1. Introduction
While pollutant emissions from land-based sources are progressively decreasing, exhaust gas emissions from ships, including nitrogen oxides (NO
x), sulphur oxides (SO
x), and particulate matter (PM), show a continuously increasing trend. According to the International Maritime Organization (IMO), for the period from 2007 to 2012, annual averages of 20.9 million and 11.3 million tonnes of NO
x and SO
x, respectively, were discharged from ships [
1]. These amounts of NO
x and SO
x represented approximately 13% and 12% of the global NO
x total and SO
x total, respectively.
The IMO established four emission-control areas (ECAs): the Baltic Sea, the North Sea, the US Caribbean, and the coastal waters of Canada and the United States. In these areas, the emissions from ships primarily consist of SOx and NOx. The SOx controls apply to all combustion systems on-board ships. The regulation limits the maximum content of sulphur in the fuel oil and has two stringency levels. The first stringency level is valid in SOx emission control areas (SECAs), whereas the second stringency level is valid for areas outside SECAs. Beginning in 2015, the maximum sulphur content of fuel oil is limited to less than 0.1% m/m inside SECAs; after 2020, this limit is less than 0.5% m/m outside SECAs. The MARPOL Annex VI also established a regulation for NOx emissions from installed marine diesel engines. Ships constructed after 2016 will have to comply with NOx Tier III standards, which should reduce 80% of NOx emissions.
In addition, the IMO introduced an energy efficiency design index (EEDI) to reduce greenhouse gas (GHG) emissions from ships [
2]. The EEDI aims to lower CO
2 emissions from ships using technical requirements for systems and voyage plans. The attained EEDI of new ships built after 2013 must be below the required EEDI baseline, which is calculated as the ratio of a reference line that is specific to the ship type and size. For a very large crude carrier (VLCC), the required baseline was reduced from the average level by 10% in 2013 and will be reduced by 25% and 35% in 2018 and 2023, respectively.
Two alternatives to satisfying the formidable regulations for ship emissions are considered to be economically feasible: exhaust gas treatment systems and liquefied natural gas (LNG)-fuelled propulsion systems [
3]. The former consists of post-treatment devices, such as diesel oxidation catalysts, diesel particulate soot filters, and selective catalytic reduction, which are applicable to ships that are already equipped with heavy fuel oil (HFO) propulsion systems. However, this solution requires a considerable footprint and significant operating expense. In contrast, LNG-fuelled propulsion systems can fundamentally prevent noxious emissions. Although the initial capital cost is substantial, this solution is reported to have a payback period of less than 10 years [
4]. Since 2000, 63 LNG-fuelled ships have been in operation [
5] and their successful operation for more than 15 years demonstrates that LNG-fuelled shipping can be safe and economically viable.
Previous LNG-fuelled ships and ships that are currently under development have small fuel tanks that range in size from 32 m
3 to 234 m
3 [
6]. They are typically bunkered by onshore tank trucks while in port. However, truck-based LNG bunkering does not seem feasible for large carriers. For example, the largest post-Panamax container ships may have a fuel tank capacity of 12,000 m
3, which corresponds to 480 trucks of 25 m
3 storage [
7]. Another possible solution would be to bunker LNG from a dedicated shore terminal or a jetty. Although such a jetty may solve the problem of bunkering capacity, the ships would have to sail from the port to the onshore bunkering site, consuming additional time. Moreover, the accessibility of the bunkering site by large ships is limited, requiring tug boat operations. Considering that the annual number of ships that visit a large port is usually more than 10,000 (more than 50,000 ships per year for Busan Port), the shore bunkering would not sufficiently satisfy the bunkering demand [
6]. Consequently, the two shore-based LNG bunkering solutions seem infeasible for many large carriers. Only ship-to-ship LNG bunkering, as is practised for HFO, is considered acceptable for large ports.
The operation of transferring cryogenic fuel LNG, which is called the LNG bunkering operation, is one of the challenges for the second alternative. The LNG bunkering operation consists of the steps listed in
Table 1 [
8]. In contrast with HFO bunkering, because of its low boiling temperature, LNG is stored under cryogenic conditions at approximately −162 °C. Although the system components, such as LNG fuel tanks, piping, and valves, are designed to reduce heat ingress, their contact with the cryogenic liquid creates a considerable amount of undesirable boil-off gas (BOG) [
9]. If the fuel tank is a pressure-vessel type [
10], the remaining LNG in the fuel tank can produce a significant mass of BOG in the form of flashed gas when the LNG is depressurized prior to bunkering [
11]. BOG generation can be a significant challenge for the LNG bunkering operation; thus, considerable research has focused on properly treating BOG in the LNG industrial field [
12,
13,
14].
2. Options to Treat Boil-off Gas (BOG)
The BOG generated during LNG bunkering is characterized as an intermittent flow with various peak loads, which is different from that in the LNG storage tank. There are several options to treat the BOG: venting, re-liquefaction, and absorption. The first option is simply to vent the generated BOG into the atmosphere. Before the LNG-fuelled ship enters the port for LNG bunkering, it should release the relatively high-pressure BOG from the fuel tanks to the atmosphere via the vent or incineration stack. Despite its simplicity, this option generates several problems: LNG fuel loss, environmental pollution, increased risks of fire and explosion, and the requirement to install auxiliary equipment for venting. A substantial amount of fuel loss is expected because of the fuel tank size. Additionally, gas vented at cryogenic temperature may remain around the ship because its density is larger than that of the atmosphere. One solution is to heat the vented gas such that it becomes lighter than the air. The risk of ignition of the vented BOG can be removed by installing an incineration unit, which is called a gas combustion unit in conventional LNG carriers; however, this incurs an additional cost for the installation and operation of the dedicated equipment. Both the BOG and incinerated exhaust are GHGs.
Another option is to liquefy the BOG with a BOG re-liquefaction system. Re-liquefaction, which is widely used in LNG carriers, enables the high-pressure BOG to be re-liquefied and subsequently transferred to the LNG fuel tanks, which prevents the LNG fuel tanks from being overpressurized while avoiding cargo loss. Several studies have optimized and described the processes in various re-liquefaction systems [
15,
16,
17,
18,
19]. Gómez et al. summarized the specifications and compared the performances of commercial re-liquefaction systems [
20].
These studies investigate the increased energy efficiency of BOG re-liquefaction systems to determine why the BOG re-liquefaction processes consume a significant amount of power. Park et al. proposed a process improvement to increase the liquefaction efficiency using a dual nitrogen expander [
21]. He et al. proposed and optimized a novel liquefaction process for an LNG plant [
22,
23].
However, the conventional systems appear impractical for the LNG bunkering operation because such an operation should be intermittently performed to liquefy BOG at fluctuating flow rates. One solution that uses this conventional technology is to increase the liquefaction capacity to accommodate the peak load. This approach is not economically feasible because of the considerable equipment cost. Another solution is to maintain the liquefaction capacity for the average load and gradually liquefy the BOG by extending the BOG transfer sub-operation and delaying the entire LNG export operation. Both solutions should occur during the idling mode of the LNG transfer sub-operation, which can incur frequent load changes, cause equipment failure and impose operational complexities on the crew.
The final option is to condense the generated BOG into LNG. Condensation of BOG into LNG is considered the most favourable solution for several reasons. The BOG recondenser system does not face several of the problems that the other options encounter, such as cargo loss, environmental pollution, and risk of fire or explosion. Additionally, a BOG recondenser system can handle high-pressure BOG transfer, which is characterized by intermittent flow with a significant peak. The BOG recondensers have operated in an onshore LNG terminal, with the objective of BOG re-liquefaction, and then continuously transfer to a regasification process without storage. Yang et al. designed a process to condense the double-stage pre-cooled and compressed BOG with the aim of minimizing the total power consumption [
24]. Lee et al. proposed a dynamic modelling method to simulate a BOG recondenser with variable flash efficiency in a non-equilibrium state [
25].
Many studies have focused on the optimization of the process and control logic. Li et al. conducted a dynamic simulation for an optimal BOG condensation operation strategy based on the practical data of the Da-Peng LNG terminal in China [
26].
This study presents a design of a new BOG re-liquefaction technology using a BOG recondenser system, which is targeted to the LNG bunkering operation. The system is designed to temporarily store the transient BOG inflow, condense it with subcooled liquefied natural gas (LNG) and store the condensed liquid. The superiority of the BOG recondenser system is verified by comparing it with the most widely used conventional re-liquefaction system in terms of consumption energy and via an exergy analysis. In addition, a dynamic process simulation with various bunkering cases is performed to demonstrate the operational feasibility of the new system.
3. System Description
3.1. System I: Dual Expansion BOG Re-Liquefaction System Based on Brayton N2 Cycle
One of the most widely used BOG re-liquefaction technologies is the liquefaction of BOG in a heat exchanger via heat exchange with the refrigerant.
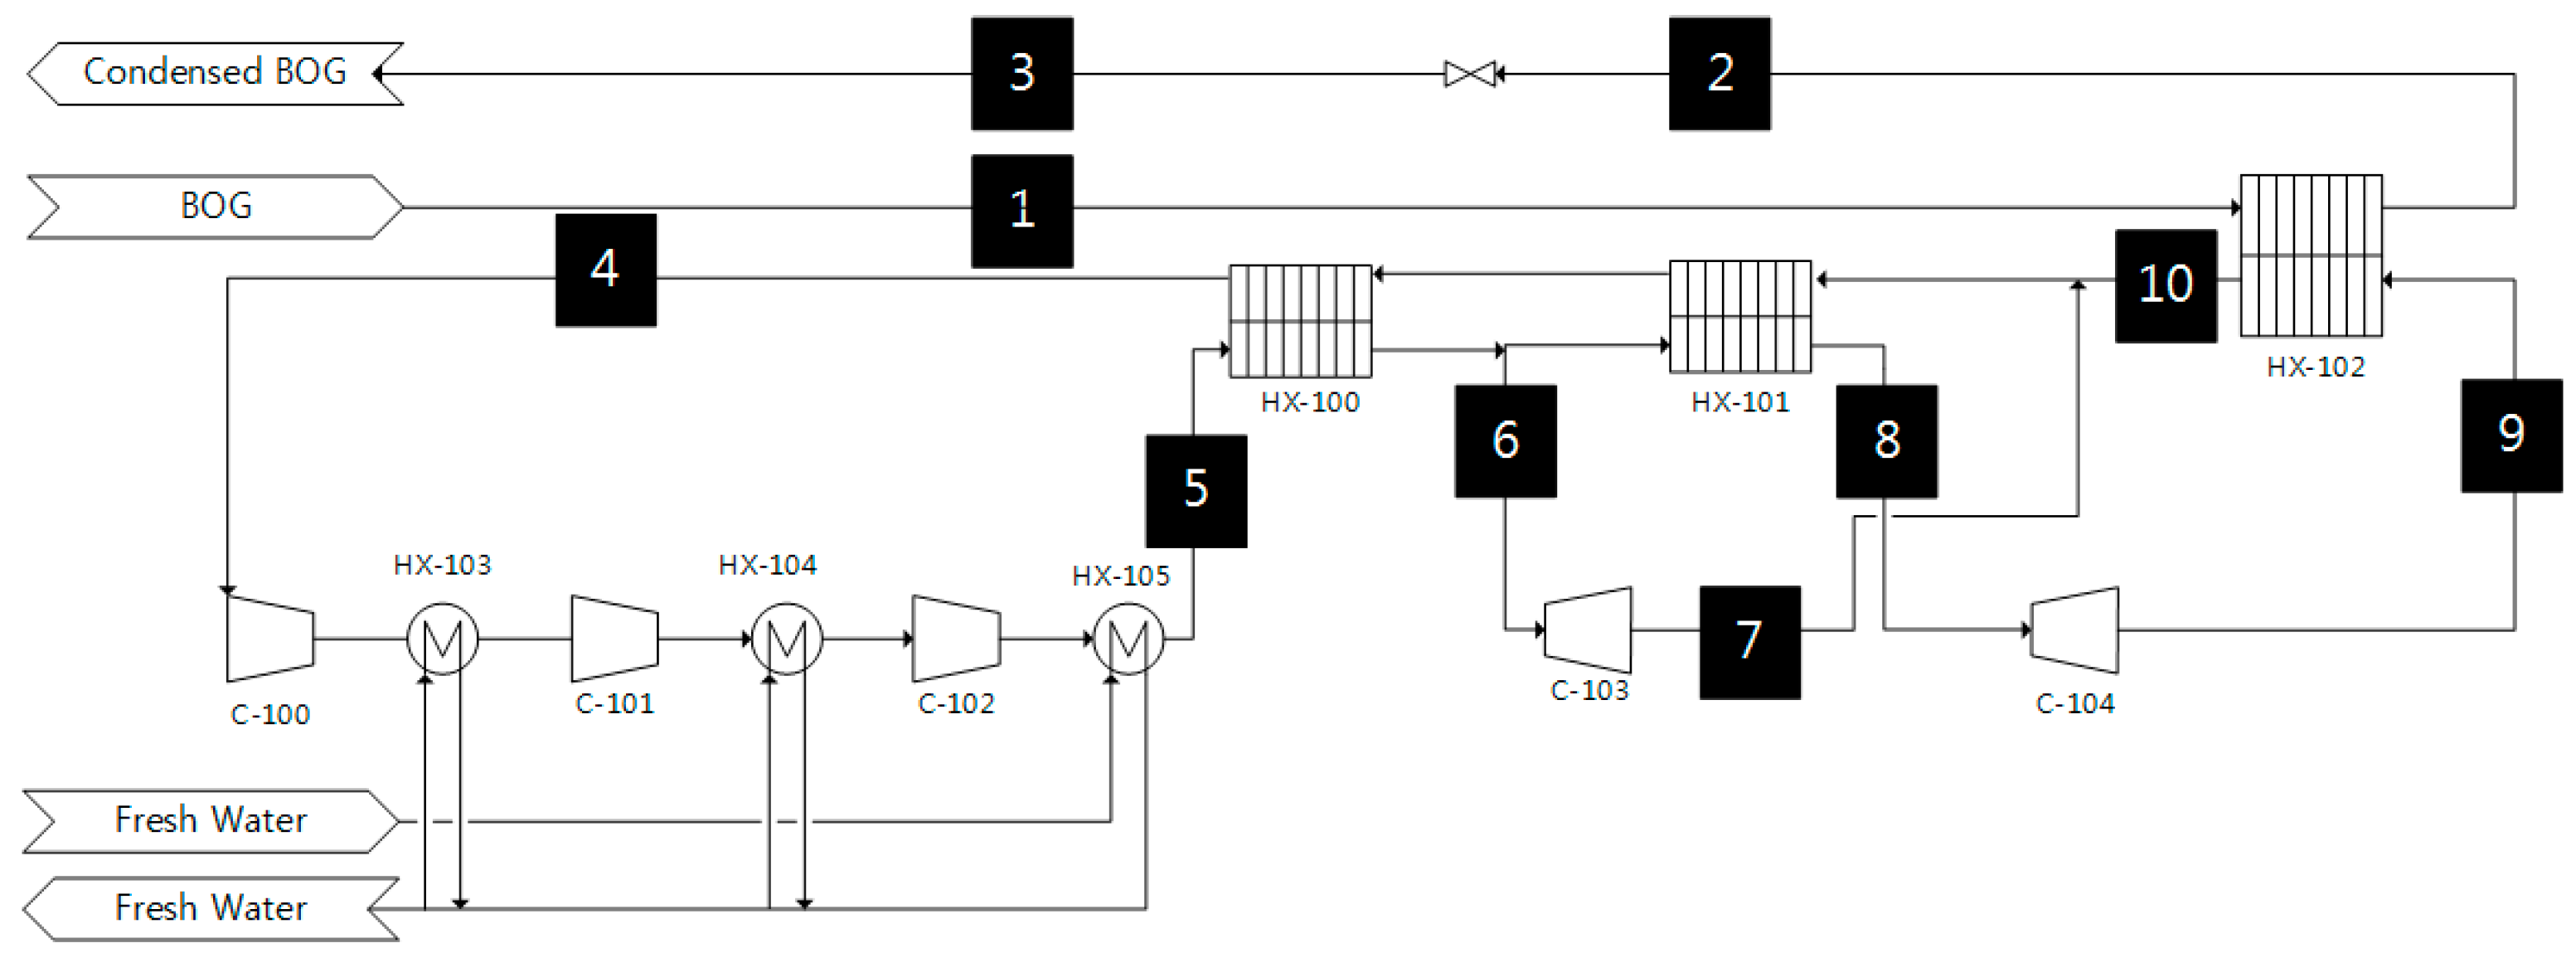
Figure 1 shows the process flow diagram (PFD) of System I; this type of system is widely used for LNG carriers [
27]. In the system, the inflow BOG is precooled and compressed to approximately −100 °C and 5.1 bar before being directly liquefied in the heat exchanger (HX-102).
The BOG (Stream 1) enters the heat exchanger (HX-102), where it is cooled and liquefied with the counter-current cold nitrogen (Stream 9). The liquefied BOG is slightly subcooled, so it can be transferred back to the storage tanks directly without passing through the separator.
The dual nitrogen expansion refrigeration cycle consists of three compressors (C-100, C-101, and C-102), two expanders (C-103 and C-104), three main heat exchangers (HX-100, HX-101, and HX-102) and an additional three heat exchangers (HX-103, HX-104, and HX-105) for free-water cooling. During operation, nitrogen is compressed across the three stages. The heat of compression is removed by three freshwater heat exchangers (HX-103, HX-104, and HX-105).
After the three compressors (C-100, C-101, and C-102) and the three heat exchangers (HX-103, HX-104, and HX-105), the compressed nitrogen (Stream 5) enters the heat exchanger (HX-100) for precooling. A small stream of nitrogen (Stream 6) after the heat exchanger (HX-100) is expanded by the expander (C-103), and the other stream is additionally precooled in the heat exchanger (HX-101) and expanded by the expander (C-104). The expanded nitrogen (Stream 9) is sent to the heat exchanger (HX-102), and the streams are then recombined after the heat exchanger (HX-102).
3.2. System II: BOG Spray Recondenser System Based on Brayton N2 Cycle
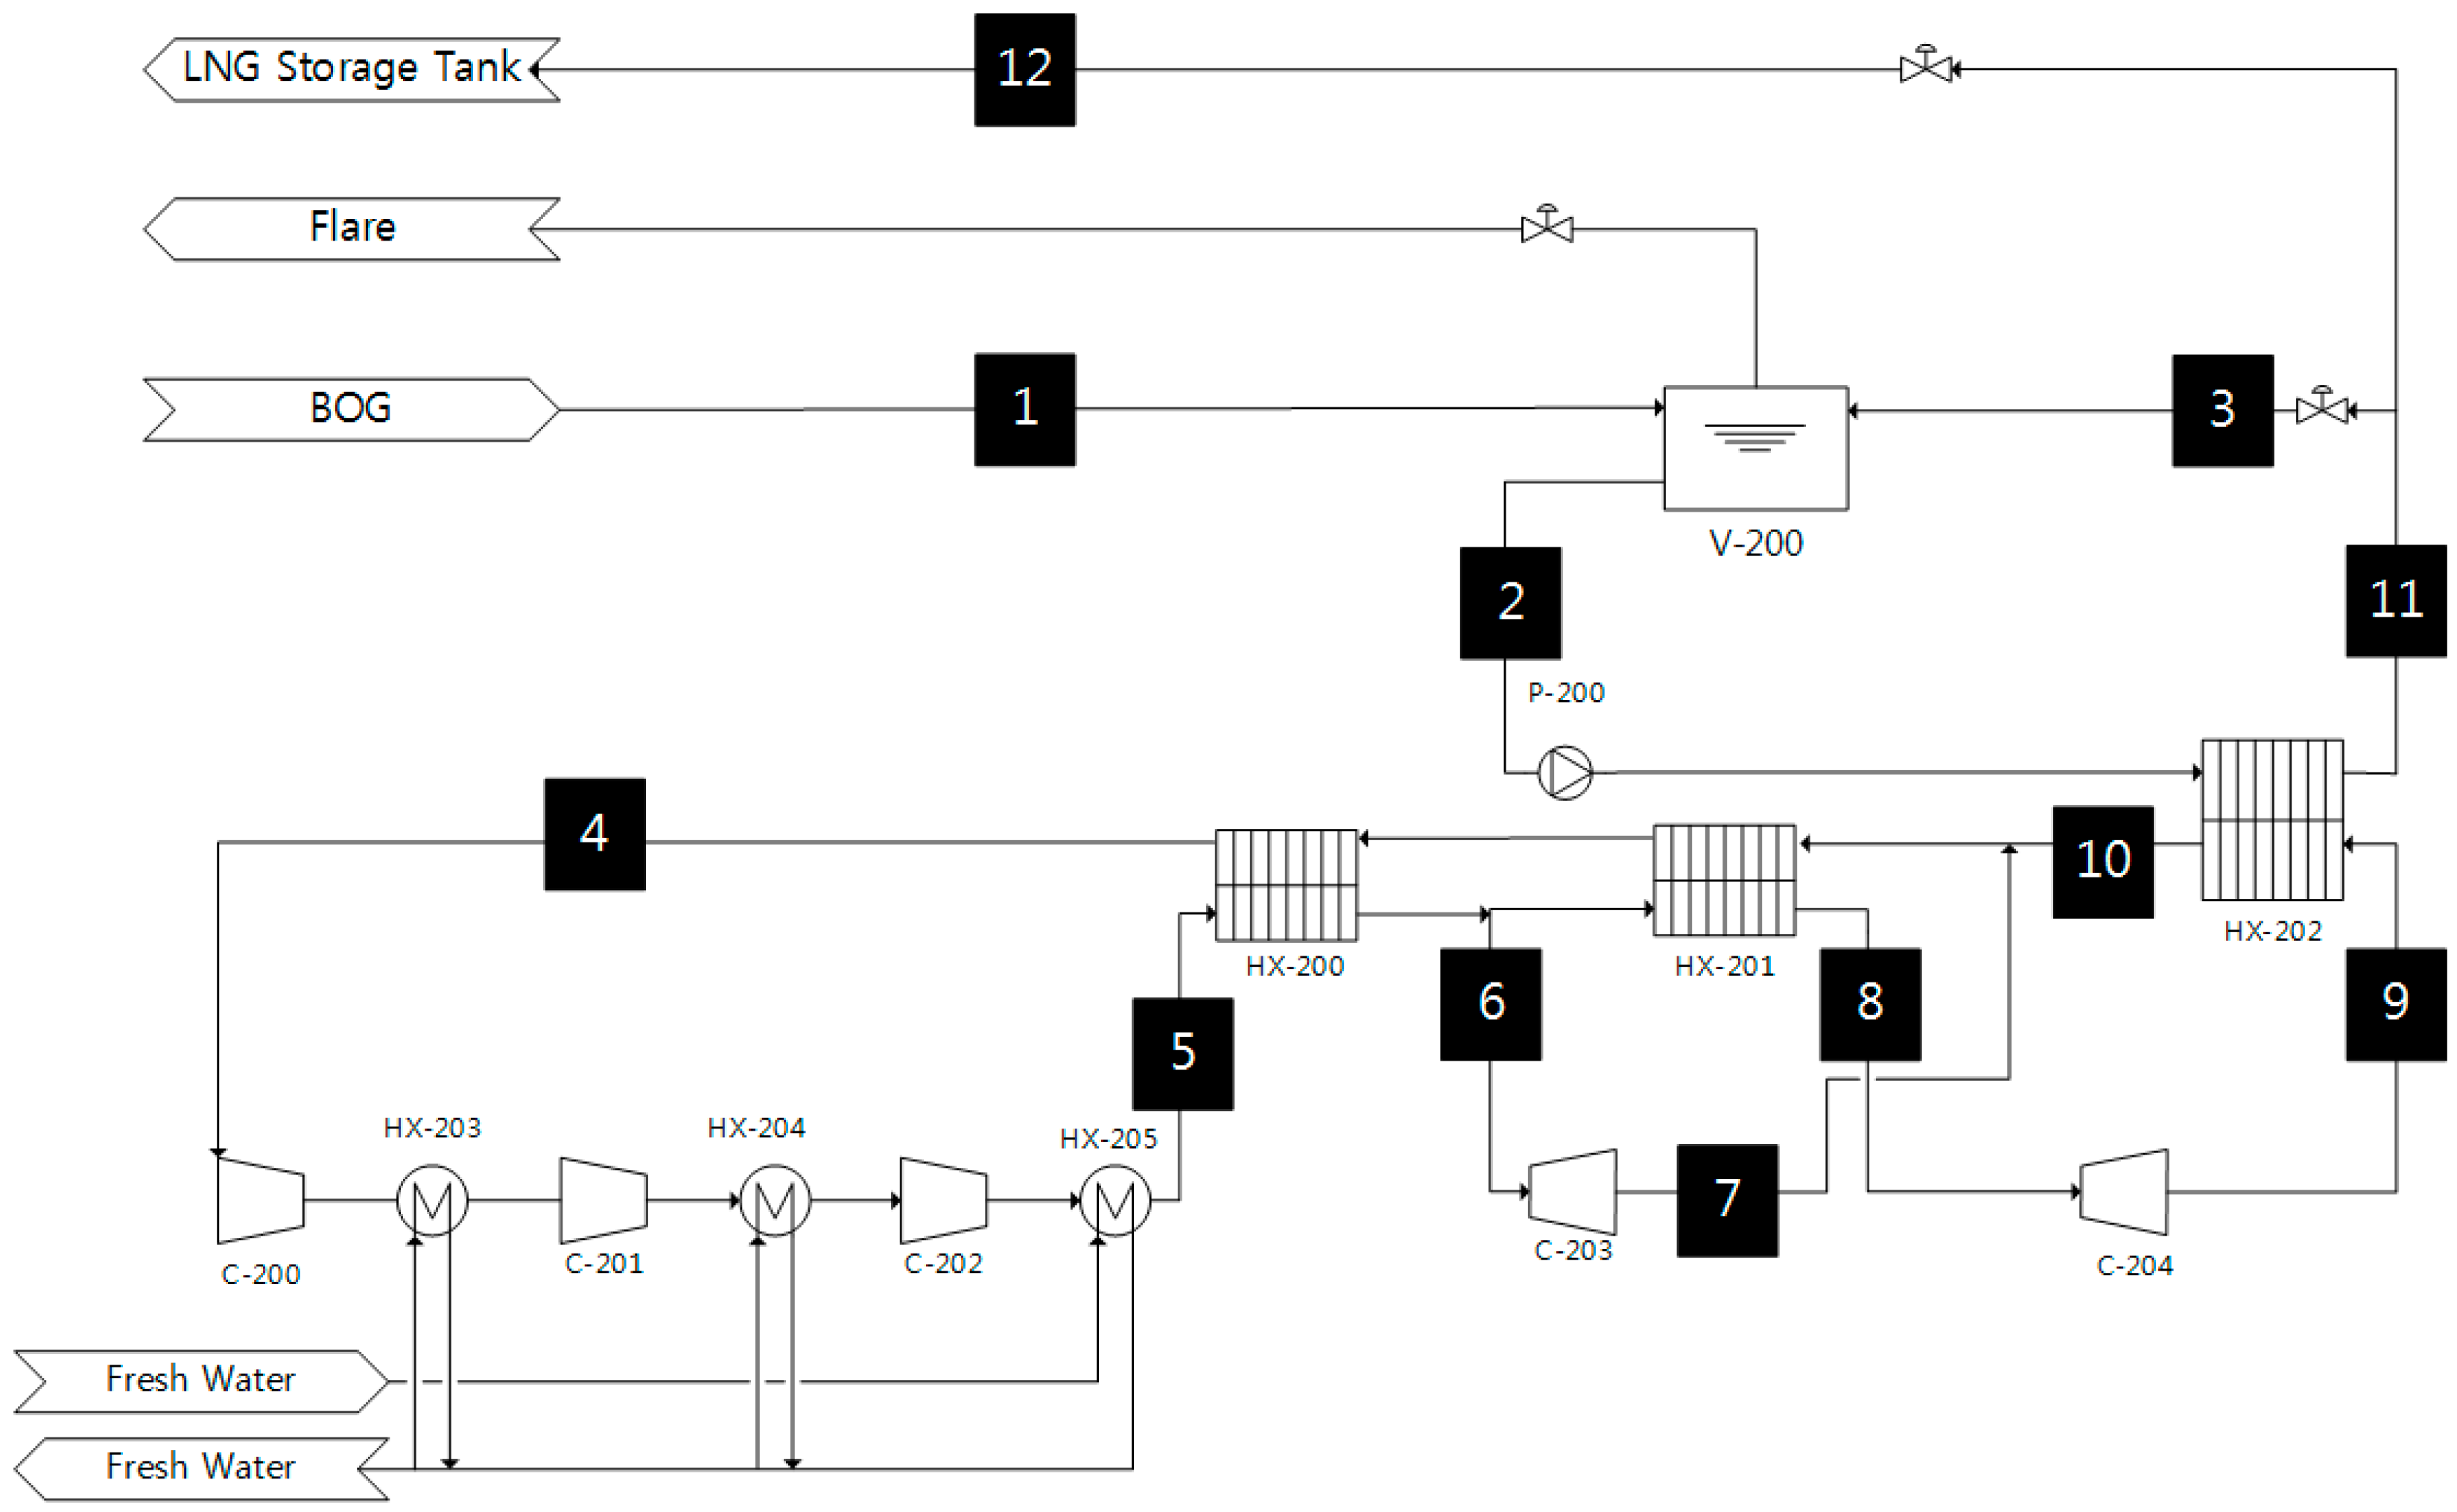
Figure 2 shows the PFD of the proposed BOG spray recondenser system, which is denoted as System II. The incoming BOG (Stream 1), which has a temperature of −100 °C and a pressure of 5.1 bar, enters the recondenser vessel (V-200), which acts as a buffer tank against variations in the BOG load. A portion of the LNG (Stream 2) in V-200 is pumped to the heat exchanger (HX-202) for subcooling. The subcooled LNG (Stream 3) is then sprayed into the upper part of V-200. A portion of the formed liquids (Stream 12) is sent to the LNG storage tank to prevent the liquid level from becoming excessively high. The sprayed LNG droplets increase the mass transfer area between the LNG and the BOG and consequently enhance the rate of BOG condensation.
The refrigeration system is identical to System I, which provides nitrogen compression, precooling, and expansion via a simple Brayton cycle. This cycle is achieved using the nitrogen compander unit, which consists of a three-stage compressor and the dual expanders.
The difference in the liquefaction method between System I and System II is the location of the phase transition. In System I, the phase transition of vapour to gas occurs in a heat exchanger (HX-102), whereas the temperature decrease of liquid occurs in a heat exchanger (HX-202) in System II. The sub-cooled liquid and the high-temperature BOG combine in V-200, and the BOG is liquefied via heat and mass transfer. In System I, the amount of power consumption is influenced by the nitrogen content in BOG due to the difference in the heat of liquefaction. The power consumption in System II is reduced as HX-202 cools the liquid stream from V-200 instead of the direct liquefaction BOG.
3.3. Comparison Basis
To compare the efficiencies of Systems I and II, a process simulation is performed using the process simulator ASPEN HYSYS V7.3. The equation of state is the Peng–Robinson equation [
28]. The amount of BOG (30–90 tons) and the nitrogen content (0%–7%) in the BOG that must be treated by the LNG bunkering system vary with the type of LNG-fuelled ship and the conditions that the ship encounters during its voyage.
According to Seo et al., the maximum operating pressure of LNG fuel tanks is 4 bar [
11]. The BOG is transferred to the V-200 tank via a compressor, whose maximum operating pressure is 5 bar. The inlet BOG pressure is assumed to be 5.1 bar, which is 0.1 bar higher than the maximum operating pressure. The saturated vapour temperature is approximately −129 °C at 4 bar, and the temperature increases to approximately −117 °C after the vapour is compressed to 5.1 bar. In this study, the BOG inlet conditions are assumed to be −100 °C, 5.1 bar, and 30 ton/h, which take into consideration more severe condition.
The system performance may vary significantly depending on the composition.
Table 2 shows the LNG and BOG compositions. In particular, the nitrogen content in BOG significantly affects the system performance. Three compositions are considered. Composition A contains no nitrogen, whereas the nitrogen contents of Compositions B and C are 3.5 and 7.0 mole %, respectively.
Several assumptions about the process simulation are formed based on Seider et al. [
29]. A pressure drop occurs in the heat exchanger. A pressure decrease of 0.3447 bar is selected for the LNG due to its low viscosity, whereas a pressure decrease of 0.2068 bar is employed for the nitrogen as it is in the vapour state throughout the refrigeration cycle. Conversely, the BOG condenses in the heat exchanger and experiences a pressure decrease of 0.1034 bar in System I.
The process simulation results were validated by comparison with reference data. A process simulation with the conditions applied in Gómez et al. was performed to verify the process simulation results [
20]. The MARK-I re-liquefaction system from Hamworthy was chosen for the verification of the simulation results.
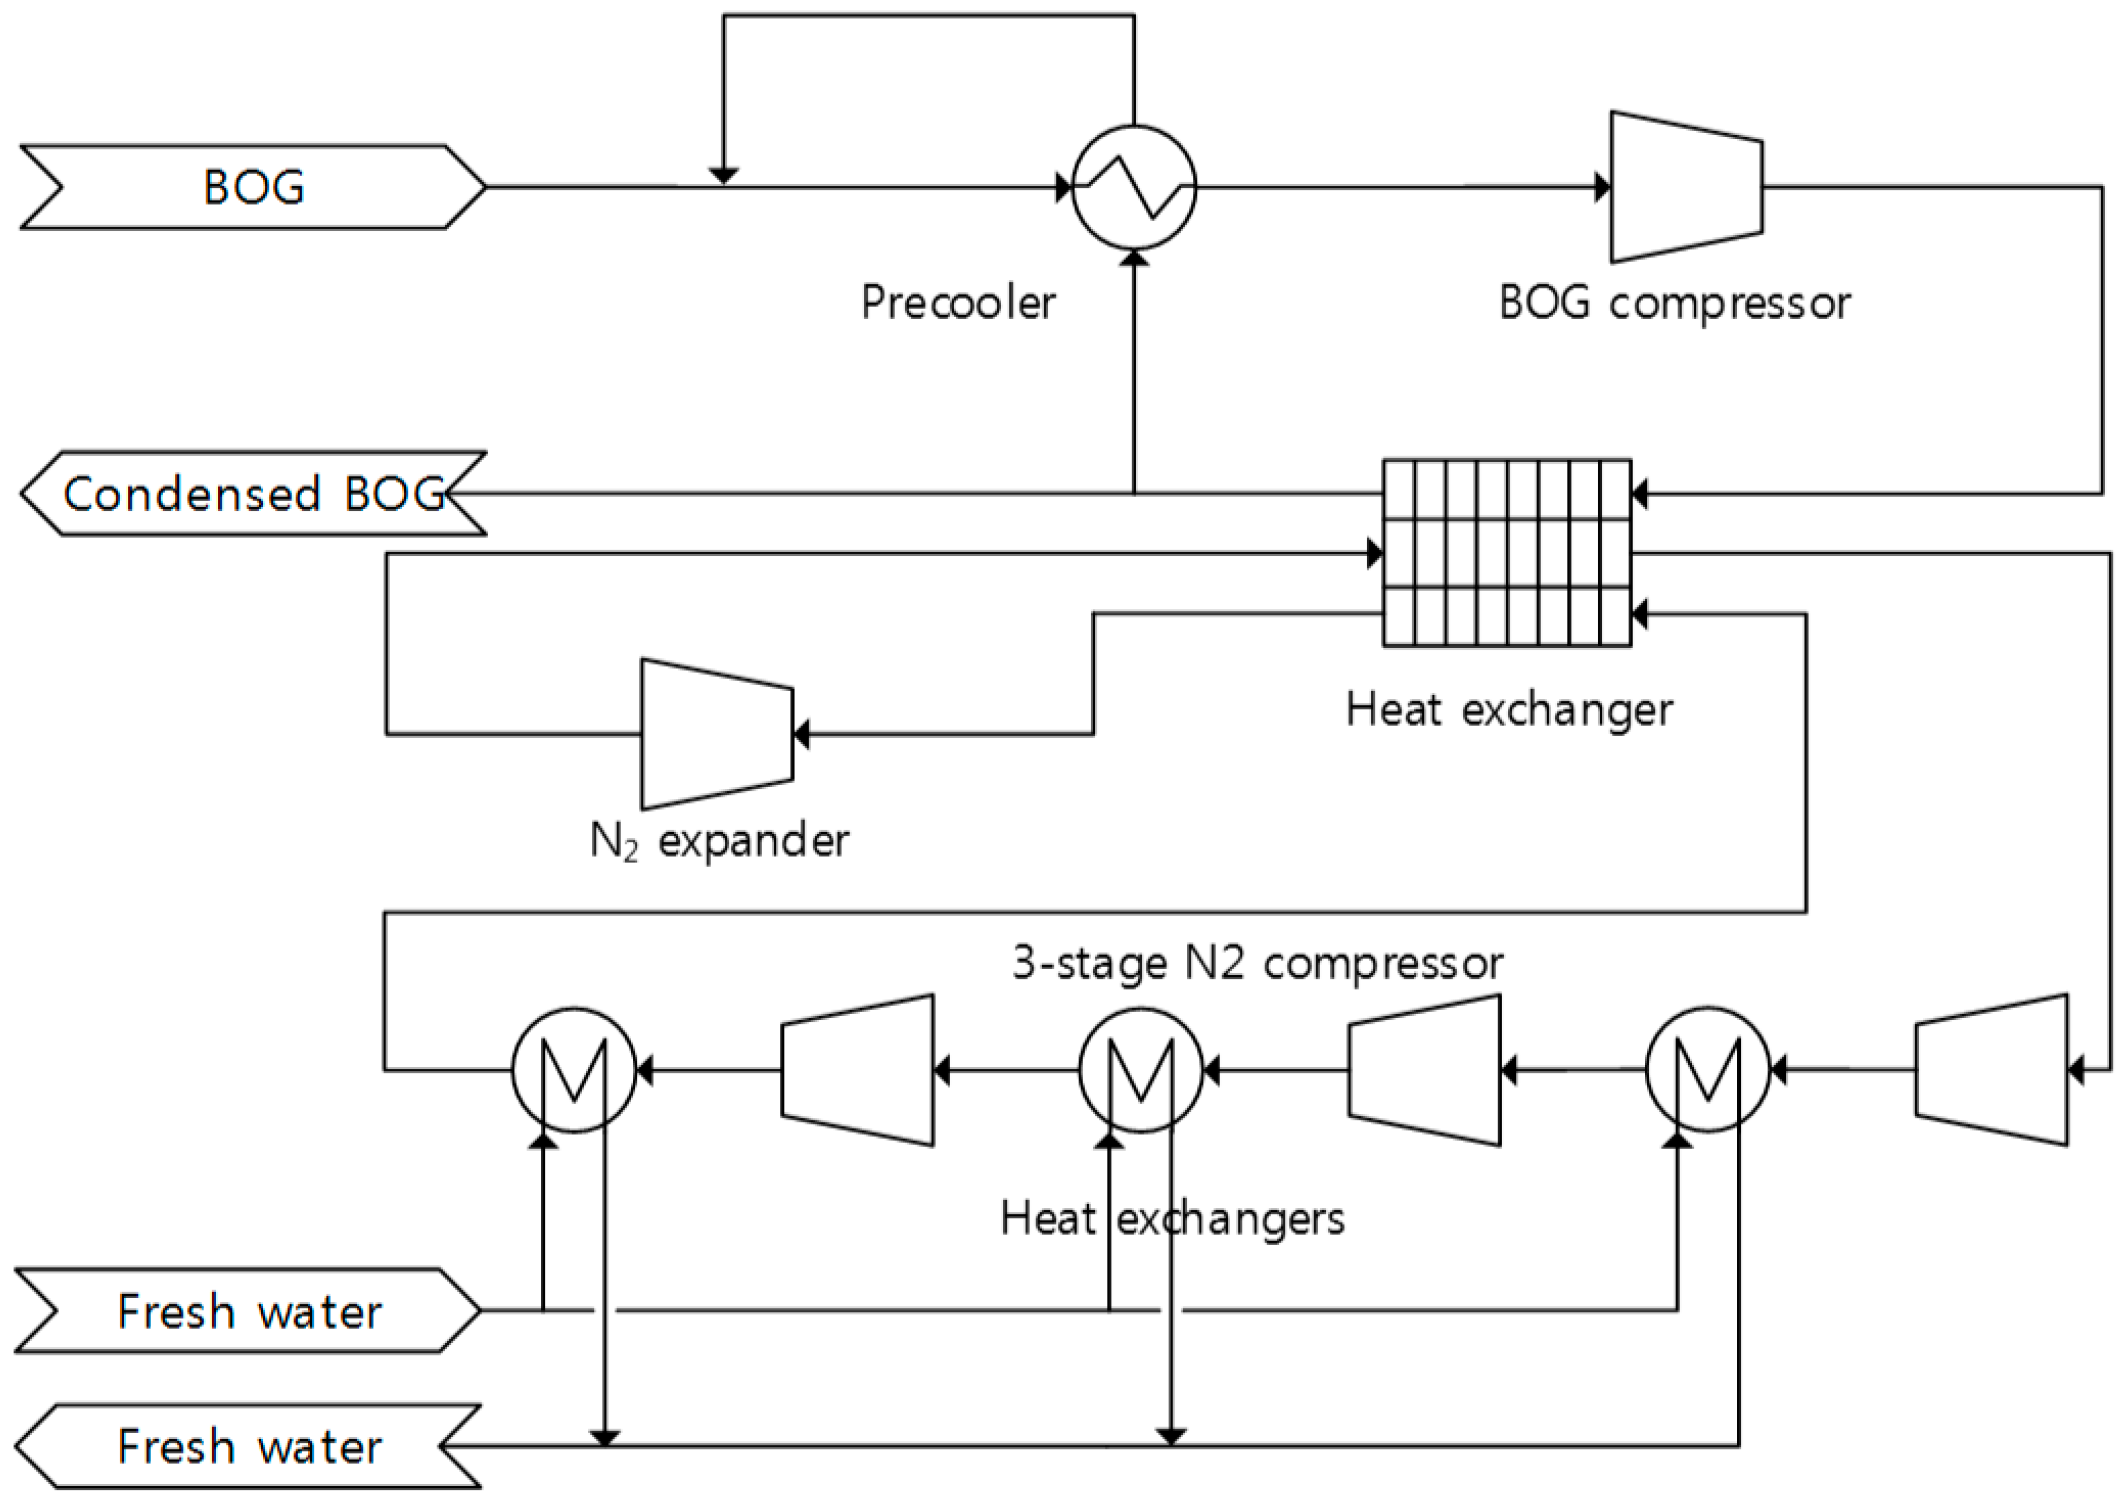
Figure 3 shows the process flow diagram of Hamworthy Mark-1 reliquefaction process. The system is the most extensively employed BOG re-liquefaction technology, in which BOG is liquefied in the heat exchanger via heat exchange with the refrigerant.
The BOG is pre-cooled in a precooler by flashing a small stream of condensed BOG from a stream after exiting a heat exchanger. The precooled BOG is compressed in a BOG compressor to approximately 4.5 bar. The compressed BOG is condensed counter flow with the cold nitrogen in the heat exchanger. The refrigerant cycle is based on the reverse Brayton cycle using nitrogen as the working fluid. Nitrogen is compressed to approximately 58 bar in a three-compression stage with intercooling and cooled to −110 °C in the cryogenic heat exchanger. In the expansion, the pressure decreases to 14.5 bar and the temperature decreases to −163 °C.
The stream conditions of temperature, pressure and flow rate were reported previously, but adiabatic efficiency and minimum approach temperature were unverified. The simulation was performed for the minimum approach temperature of 1 to 5 °C and an adiabatic efficiency of 70%, 75%, and 80% for rotary machines. By trial and error, the minimum approach temperature was determined to be 3 °C, and the adiabatic efficiency was determined to be 75% for compressors and 80% for expanders.
Table 3 lists the results of Gómez et al. and the simulation that was repeated [
20].
3.4. Specific Net Power Consumption
The specific net power that is consumed in a system is an appropriate measure for comparison [
31]. The specific power (
) is defined as the specific net power consumption divided by the unit mass of BOG (tons):
The specific net power consumption (
) is defined as the difference between power output and power input:
where
indicates the power produced by the system per unit mass. The power output is generated in the expander, where,
= C-103, and C-104 for System I,
= C-203, and C-204 for System II.
where
indicates the power that must be input into the system per unit mass. This power input is supplied at the compressors to pressurize the cooling refrigerant, where,
= C-100, C-101, and C-102 for System I,
= C-200, C-201, and C-202 for System II.
3.5. Exergy Efficiency
The exergy is a measure of the maximum potential of a system to perform work [
32]. This maximum potential indicates the maximum useful work that can be obtained from a system in a given state in a given environment. The efficiency of a process with identical feed and product can be compared with the exergy analysis. Any system in a state different from the environment contains exergy and can perform work. The general exergy efficiency (
) is calculated as the ratio between gained exergy and expended exergy:
Then, the exergy gain in a system and exergy loss in each piece of equipment is
In the BOG re-liquefaction system, the exergy expenditure is divided into two parts: the supplied work to the system, which can be fully used, and the difference between the entering exergy and the exergy that leaves the system with respect to the BOG and LNG flow.
In the numerator, the first two terms represent the exergies that enter and leave the system with a certain flow rate (). The third term is the net power that can be obtained from heat transfer (), and the final term is the net power supplied to the system ().
The exergy is calculated using the following equation, where,
, and
are the properties of the system evaluated at the dead state (
).
Exergy loss (), which indicates exergy destruction, necessarily occurs in a system because of heat transfer, fluid friction, and energy dissipation into the surrounding environment. The following equations describe the exergy loss in different pieces of equipment. The exergy loss in each piece of equipment includes the exergy difference between the inlet and the outlet. Here, the consumed power in a compressor is added to the calculation of exergy loss, whereas the produced power in an expander is subtracted from the exergy loss.
Venkatarathnam et al. and He et al. noted that the exergy loss in a refrigeration cycle primarily occurs in the heat exchangers and expanders (valves or turbines) [
21,
26]. The following equations express the exergy loss in heat exchangers:
where
denotes the exergy loss in the heat exchanger,
U is the overall heat transfer coefficient,
A is the surface area of heat transfer, and
is the ambient temperature. Because
T is the operating temperature, all variables are constant except the temperature difference between the hot and cold streams on the right-hand side of the equation. The equation illustrates that decreasing the temperature difference will result in a more efficient refrigeration unit.
3.6. Dynamic Process Simulation
System II, which is intended to continuously treat BOG, is assumed to be subjected to changes in the composition of the holdup LNG. The refrigeration efficiency decreases with the volatility of the holdup. Thus, dynamic simulations of six cases are conducted as described in
Table 4.
The dynamic process simulation follows three operation modes: the BOG inflow mode, initialization mode, and idling mode. In the BOG inflow mode, BOG is transferred to the BOG recondenser vessel (V-200). The refrigeration system continuously subcools the liquid holdup of V-200 and sprays it back into V-200 to condense the BOG inflow. In this mode, the pressure and temperature of the liquid holdup increase when it encounters the BOG. After all of the BOG has been transferred, System II is allowed to return to the initial state to ensure that it can treat the BOG again. This recovery operation is called the initialization mode. During the initialization mode, the liquid holdup is continuously subcooled and sprayed as in the BOG inflow mode. Finally, the idling mode follows when all of the BOG has been treated and the temperature has returned to the initial state.
The volume and design vapour pressure of V-200 are set to 1000 m3 and 5 bar, respectively. The initial conditions of the V-200 are −162 °C, 1.1 bar and 72% filled with LNG (consists of approximately 320 tons); the vessel can accommodate a maximum of 30 tons of BOG at 5 bar operation pressure and 80% liquid level fraction without using subcooled LNG. The flow rate of the subcooled LNG is assumed to be 100 ton/h. The maximum liquid level fraction of V-200 is set to 80%. When the liquid level in V-200 reaches 80% of the capacity during the BOG inflow mode, V-200 transfers approximately 30 ton/h of the liquid holdup to the storage tank via Stream 12.
4. Results and Discussion
4.1. Specific Net Power Consumption
Steady-state process simulations were performed to facilitate direct comparisons with other systems. The stream properties followed the design basis, and the basic process specifications of System I and System II are provided in
Table 5 and
Table 6, respectively. The corresponding pressure-enthalpy (p-h) diagram is shown in
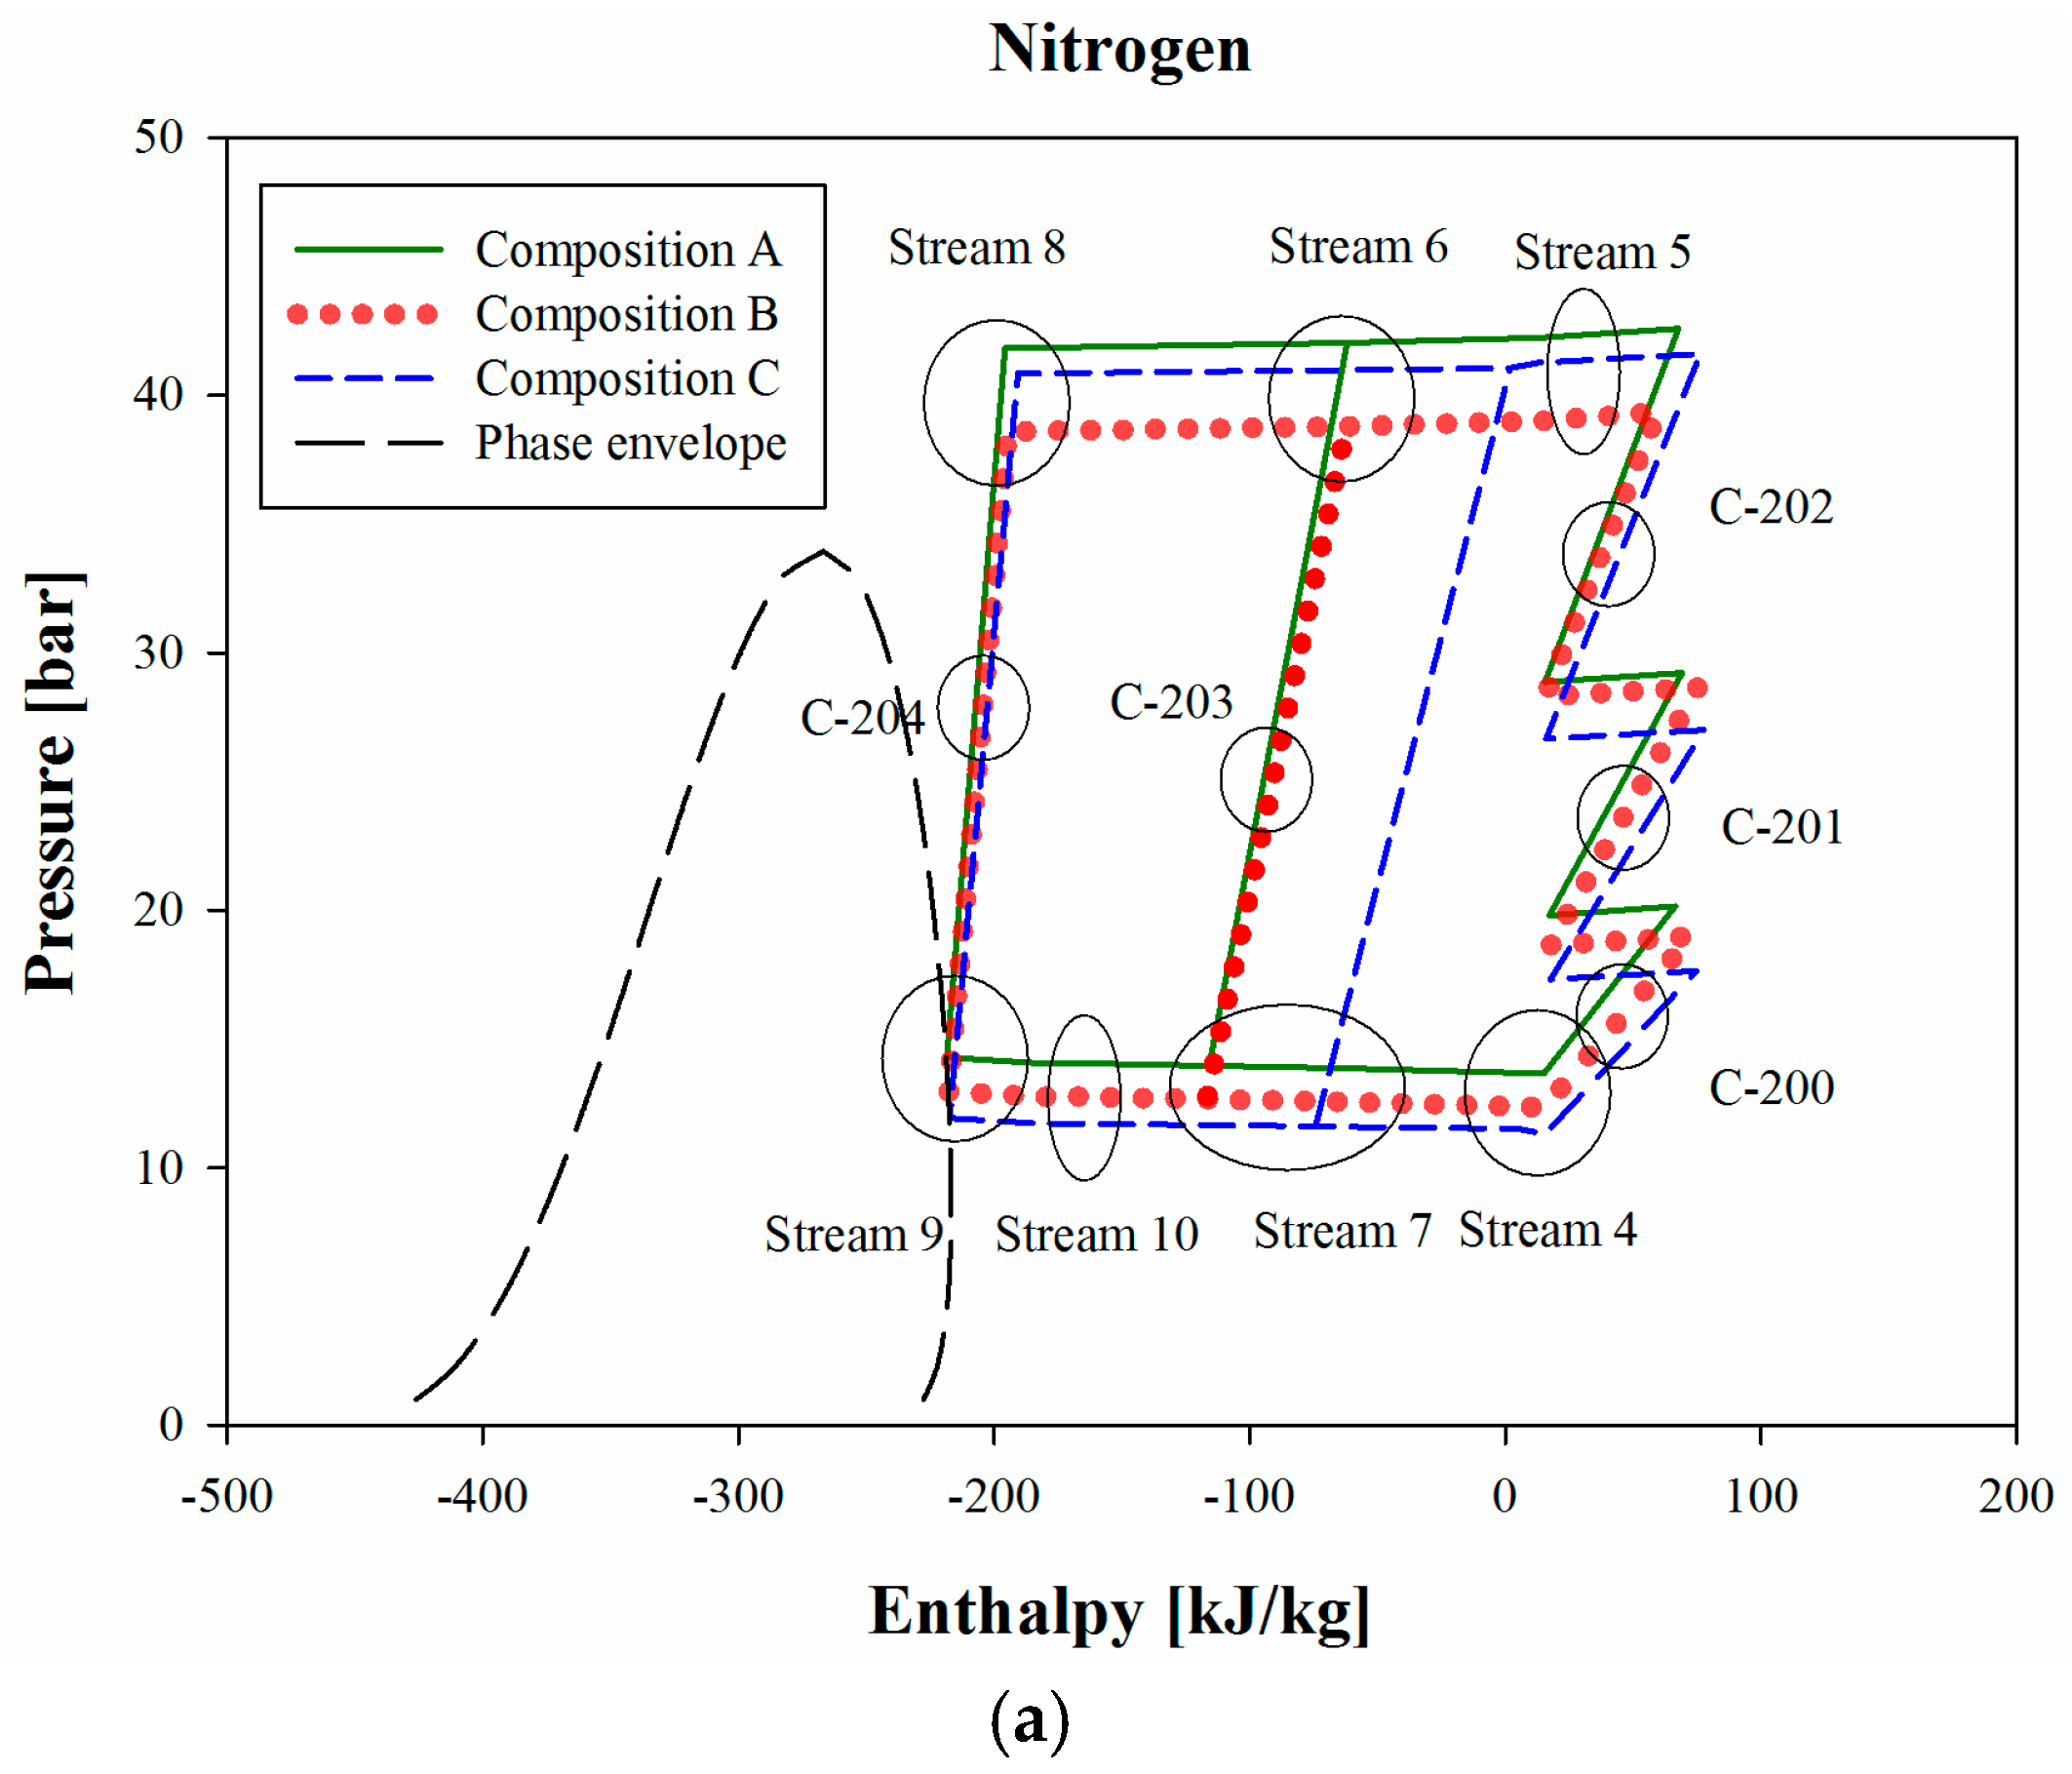
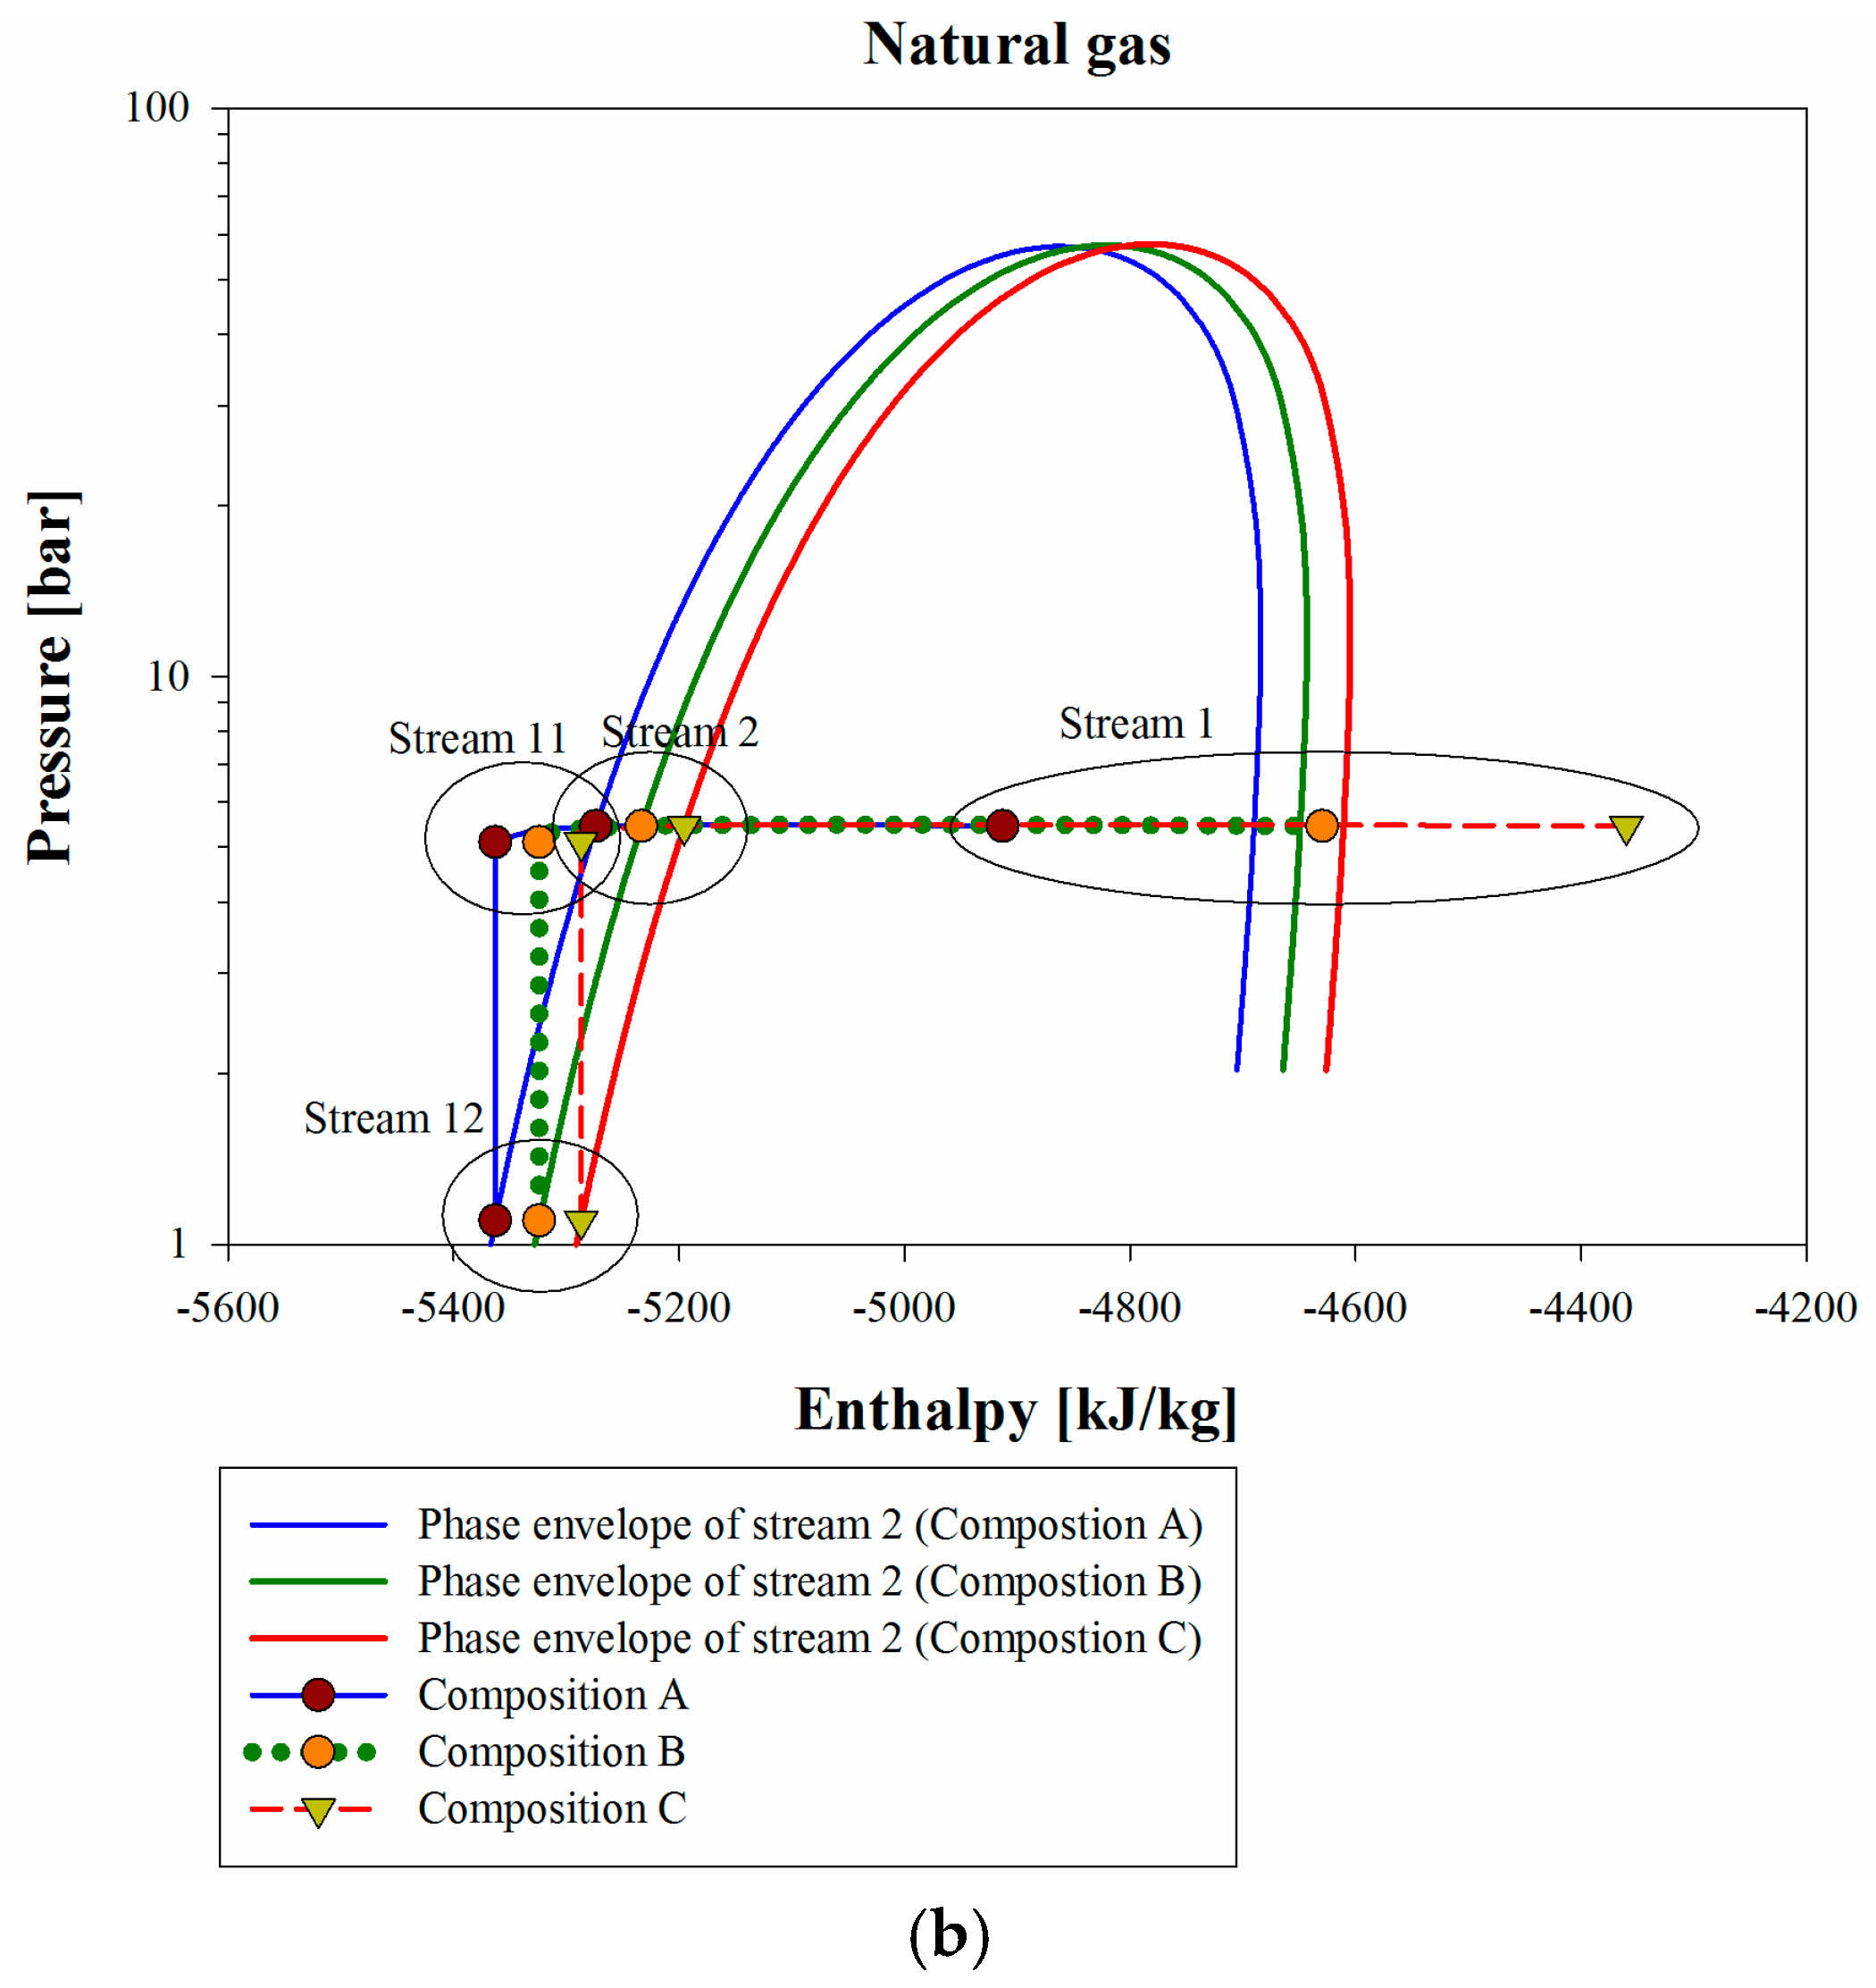
Figure 4a,b.
Figure 4a is a three-stage p-h diagram of the refrigeration cycle, and
Figure 4b is a p-h diagram for the liquefaction flow. In
Figure 4a, the minimum pressure of Stream 4 and Stream 7 differ depending on the nitrogen composition. The larger is the nitrogen composition in BOG, the lower is the required pressure.
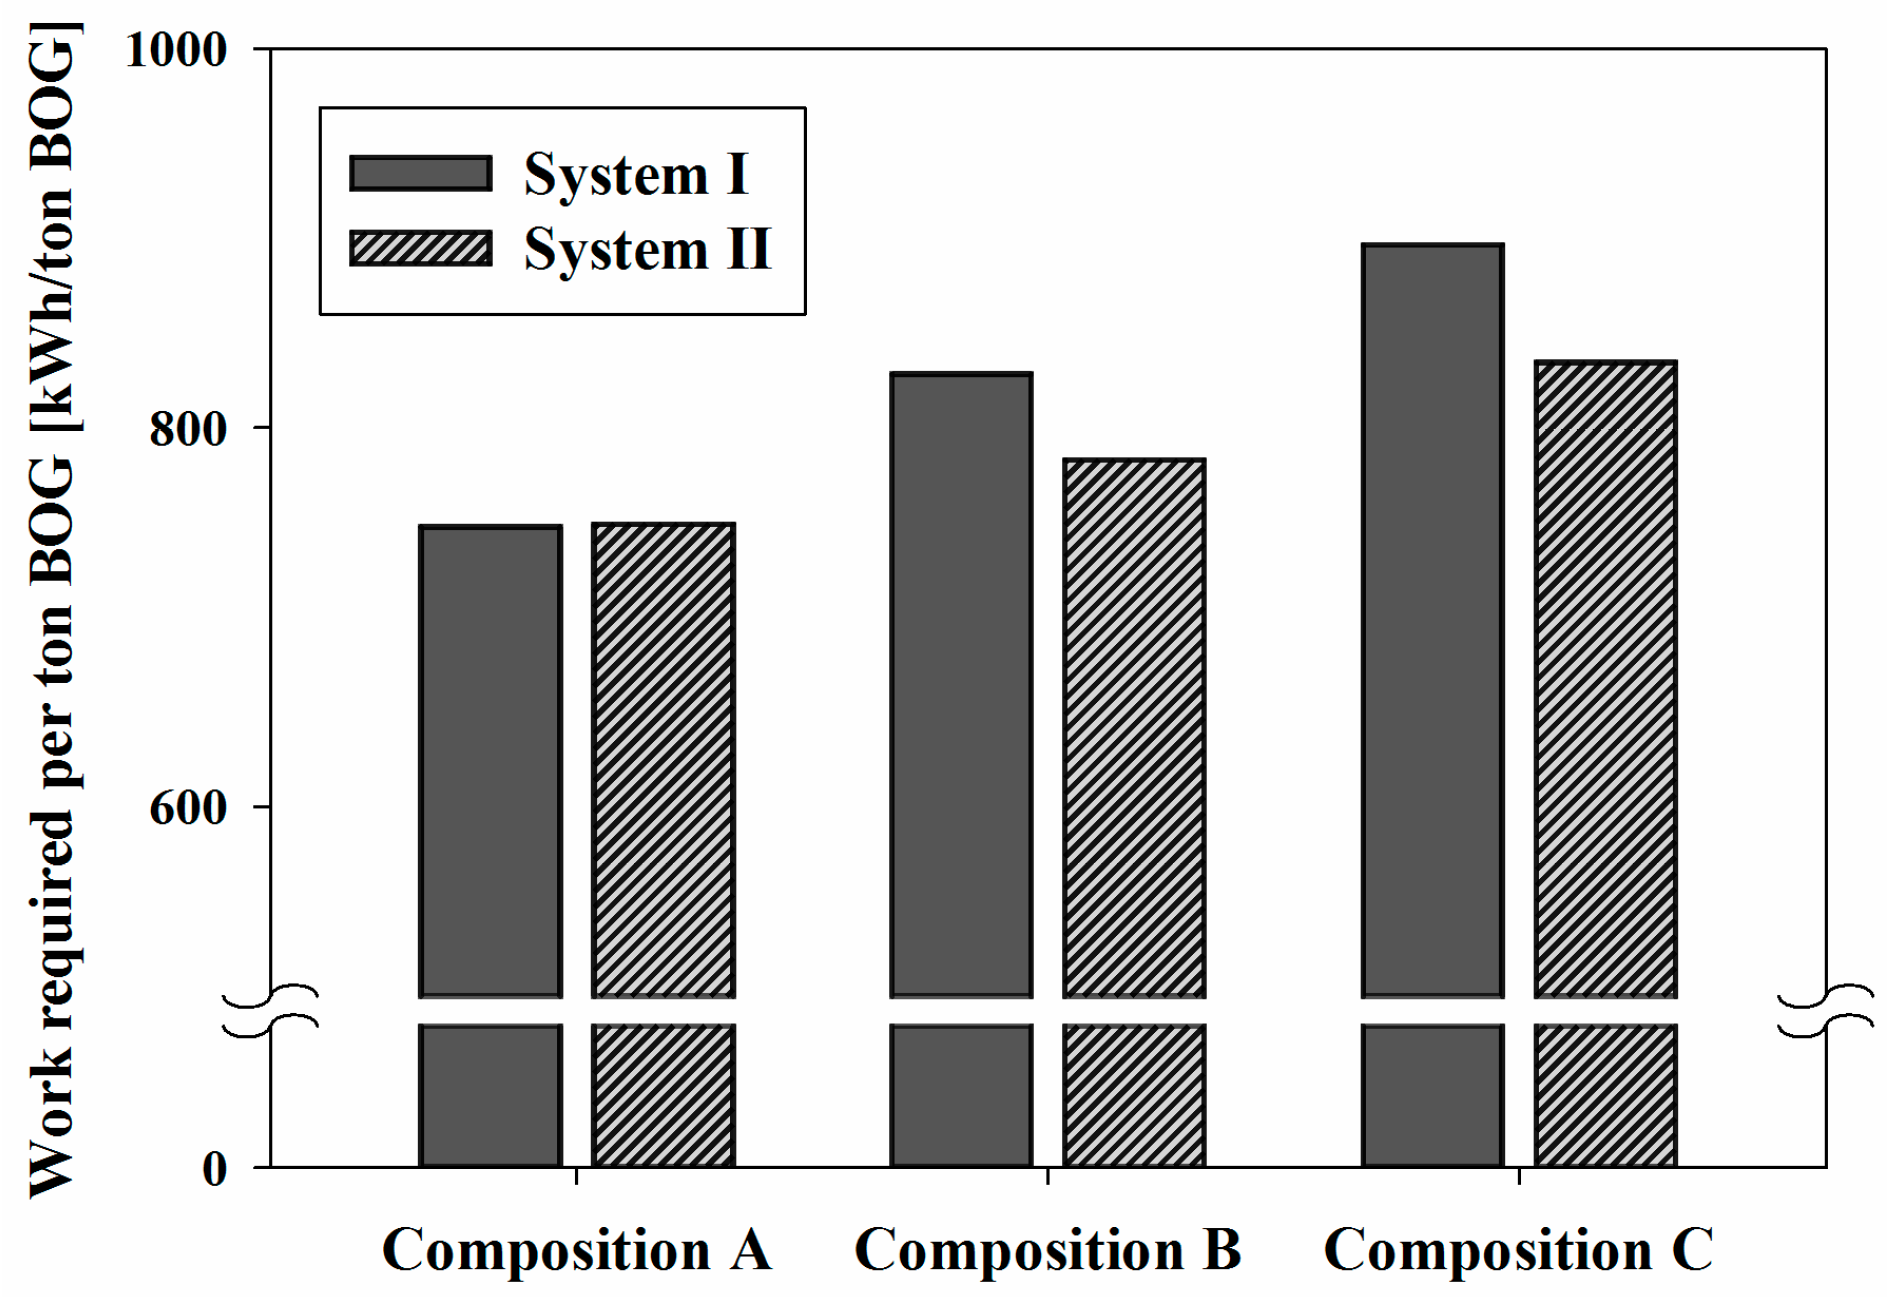
Figure 5 shows the specific net power (
) that was consumed to liquefy the BOG depending on the nitrogen content of the BOG. In System I, the
required to liquefy the BOG was 747.8, 828.2 and 896.4 kWh/ton BOG for Compositions A–C, respectively. The
values of System II were approximately 749.2, 783.1, and 834.5 kWh/ton BOG for Composition A–C, respectively.
System II used nearly the same amount of power (0.2% more) than System I for Composition A and 5.4% and 6.9% less for Compositions B and C, respectively. When the nitrogen composition in the BOG increases, the BOG volatility increases, which requires a lower-temperature product. Because nitrogen has a lower heat capacity than methane, the BOG of Composition C requires more energy, although the enthalpy difference is less than Composition A. However, the effects of the nitrogen contents in the BOG on the values in both systems were different. The results showed that the differences of between Compositions B and C were approximately 19.87% and 11.39% in System I and System II, respectively. System II reduced the effect of the nitrogen content because it cooled the liquid stream from the pressure vessel (V-200) instead of the liquefaction BOG directly as in System I. The variation of the required heat for liquid cooling in System II was less than that for the liquefaction of the BOG in System I.
4.2. Exergy Efficiency
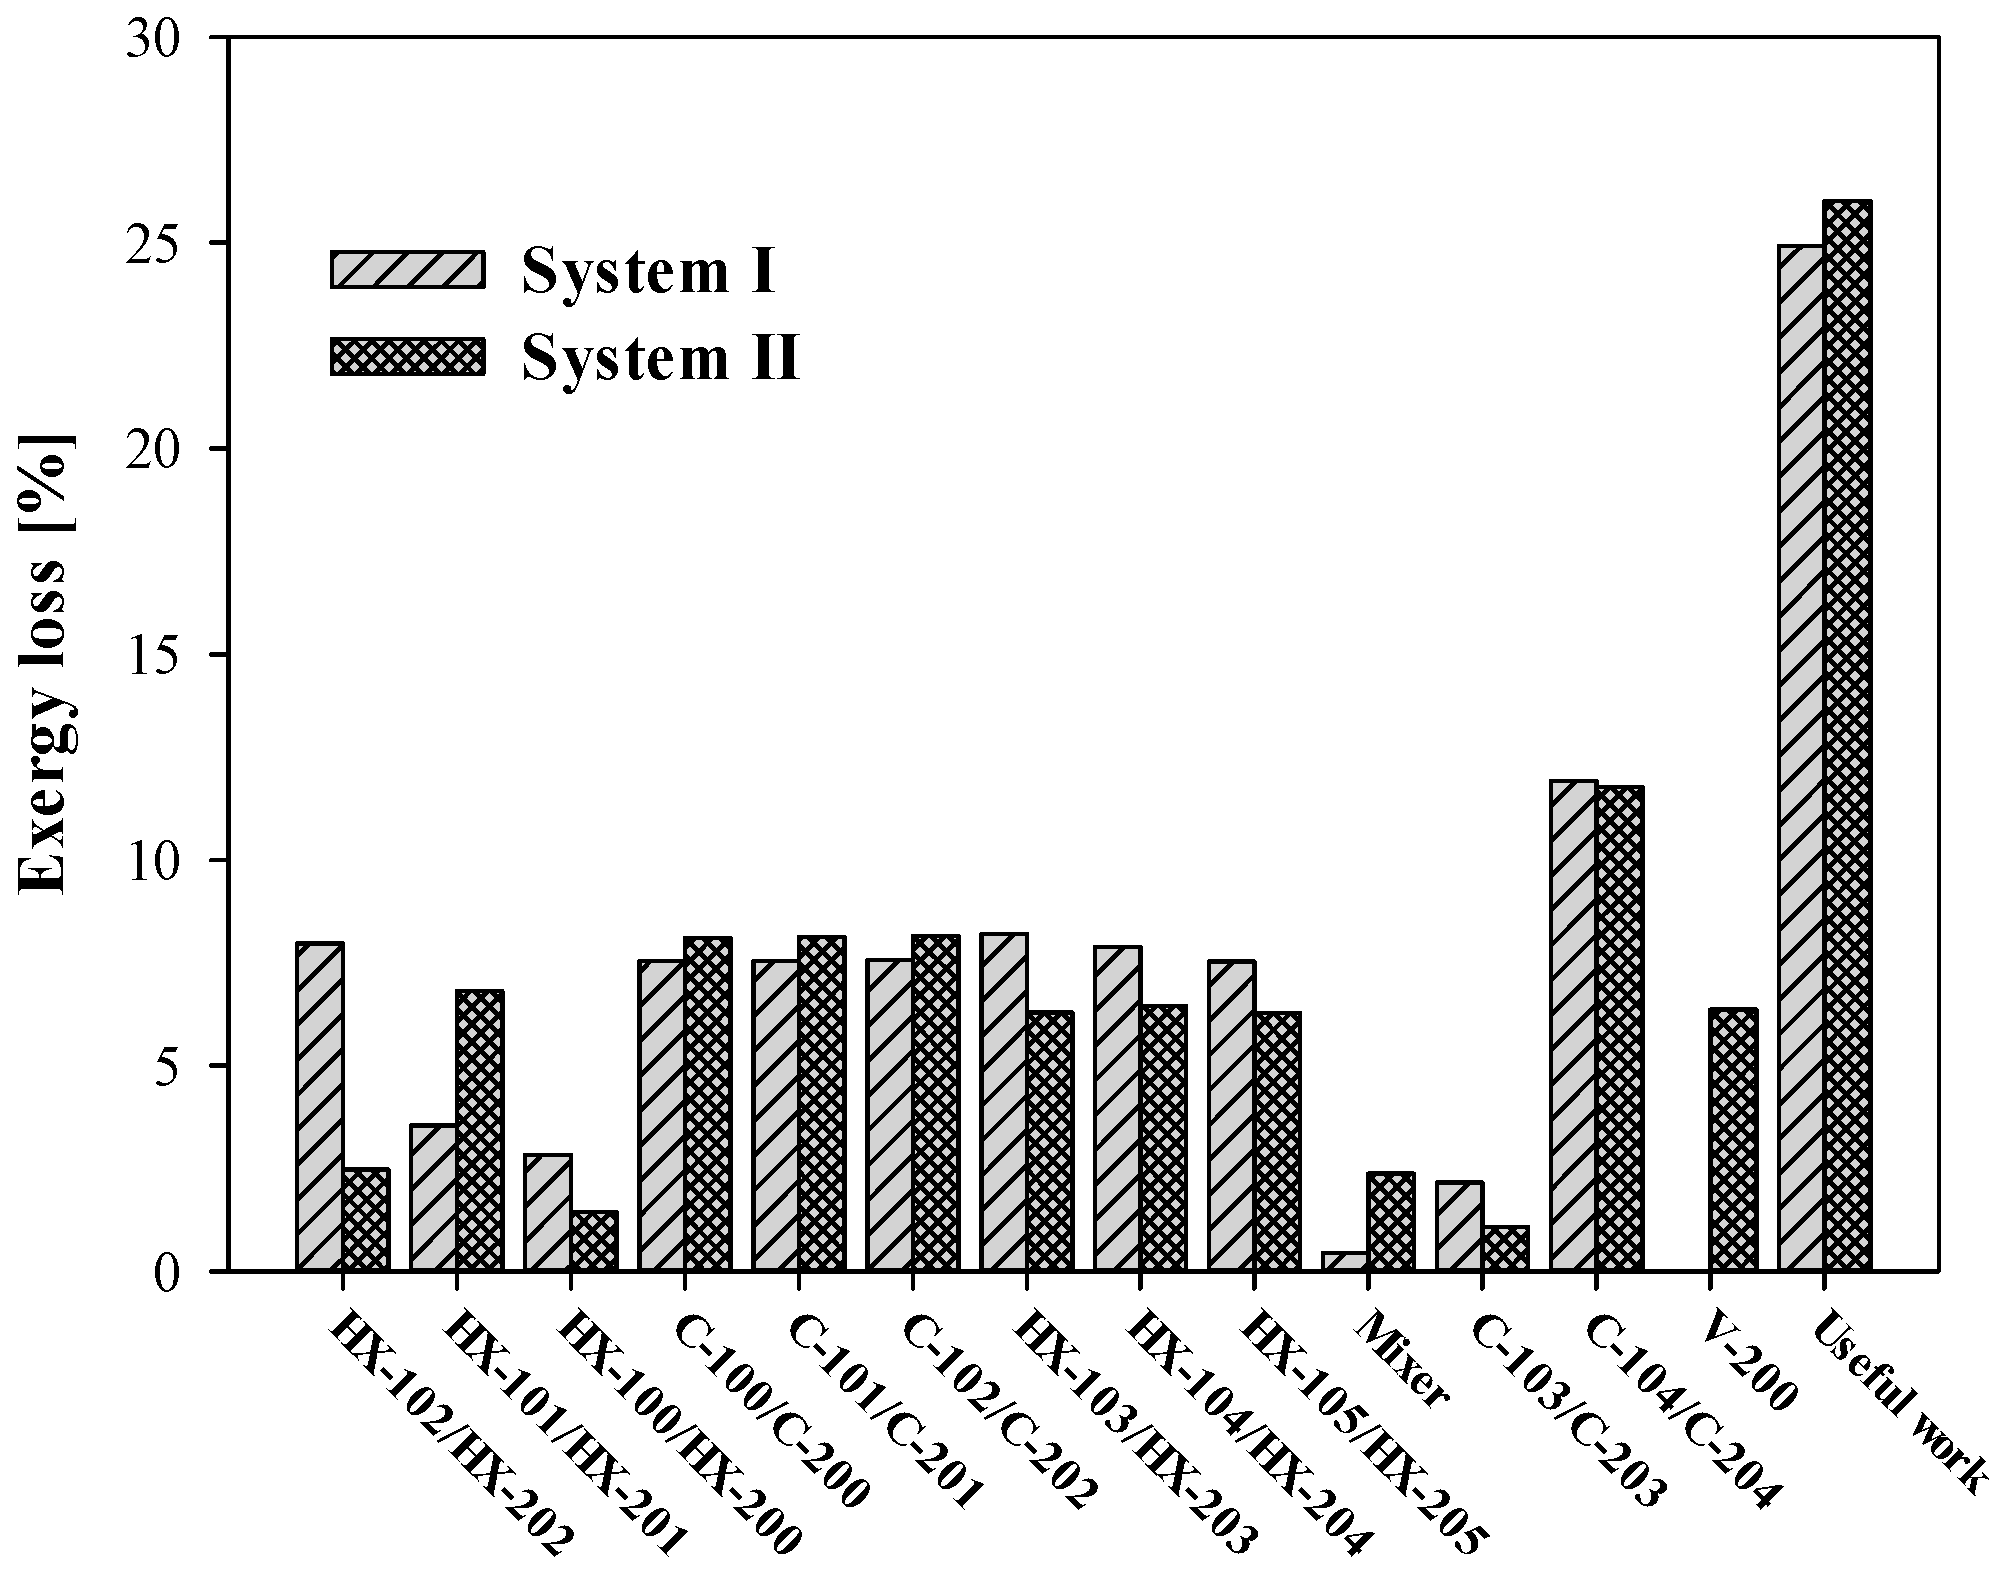
The exergy efficiency was analysed to determine the performance of each system. Composition C was selected for the representative analysis.
Figure 6 shows that the useful work of System I was 24.9% and the useful work of System II was 26.0%. Exergy losses mainly occurred in the rotary machines, such as the compressors and expanders, in both systems. In System I, 22.64% of the loss occurred in the three compressors, and 14.08% occurred in the two expanders, whereas in System II, 24.37% occurred in the three compressors, and 12.83% occurred in the two expanders.
Despite the 4.71% exergy loss that occurred in V-200 for mixing a subcooled LNG with a high-temperature BOG, System II had a higher ratio of useful work than System I. This reduction of exergy loss primarily occurred in the heat exchangers HX-102 and HX-202.
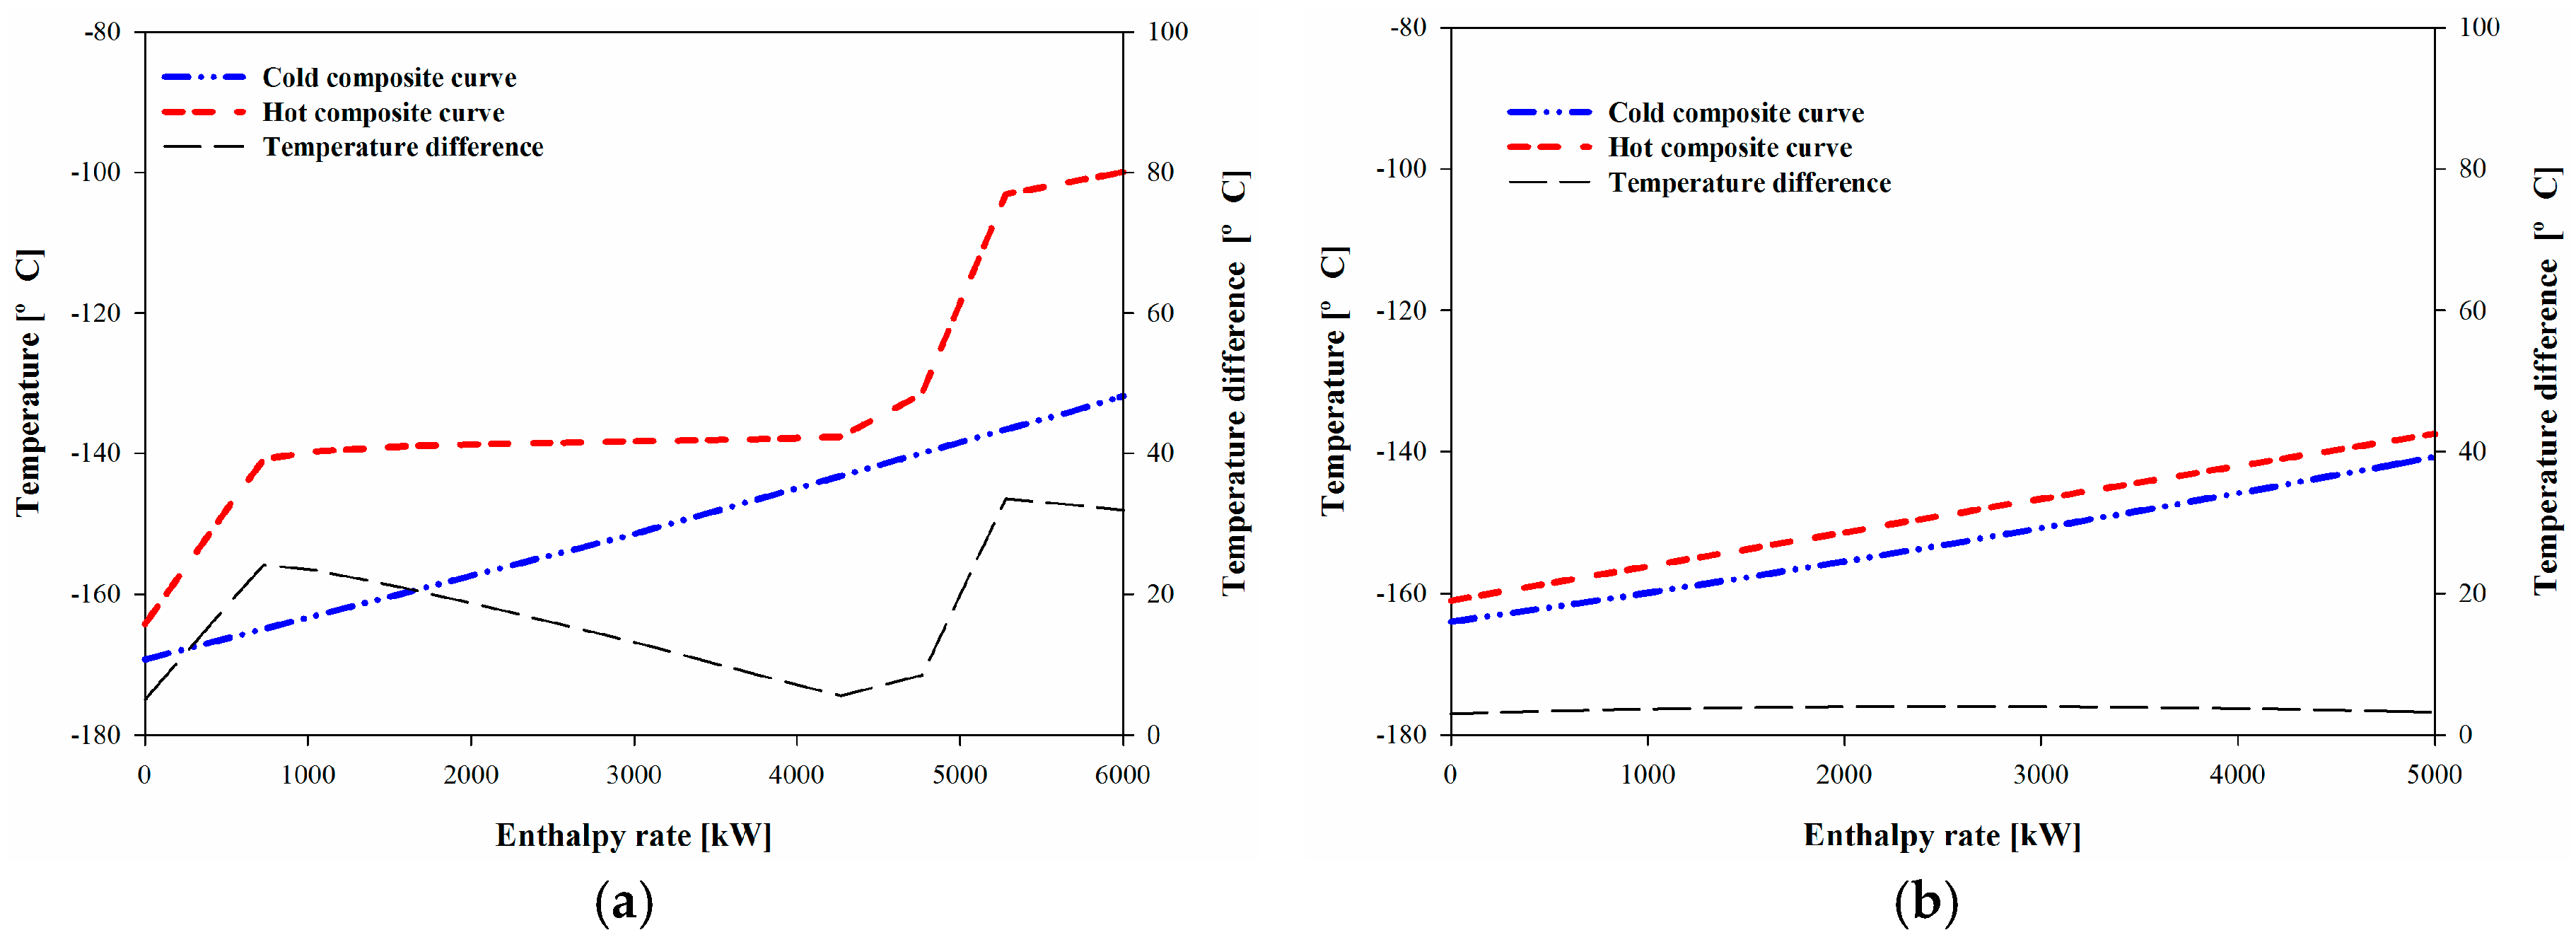
Figure 7a,b show the composite curves of System I and System II, respectively. The temperature difference in System I varied from 5 to 33 °C (
Figure 7a), and this range increased the exergy loss because of the phase transition of the BOG. When the BOG was condensed in the heat exchanger (HX-102), the heat capacity of the BOG changed considerably, but the nitrogen refrigerant did not experience a phase change; thus, the heat capacity was nearly constant. However,
Figure 7b shows that the two composite curves are nearly parallel. The temperature difference between the hot and cold streams of System II was 3 to 4 °C; this small and nearly constant range increased the performance of System II compared with System I.
4.3. Dynamic Simulation for Different Numbers of BOG Inlets (DS-Cases I to III)
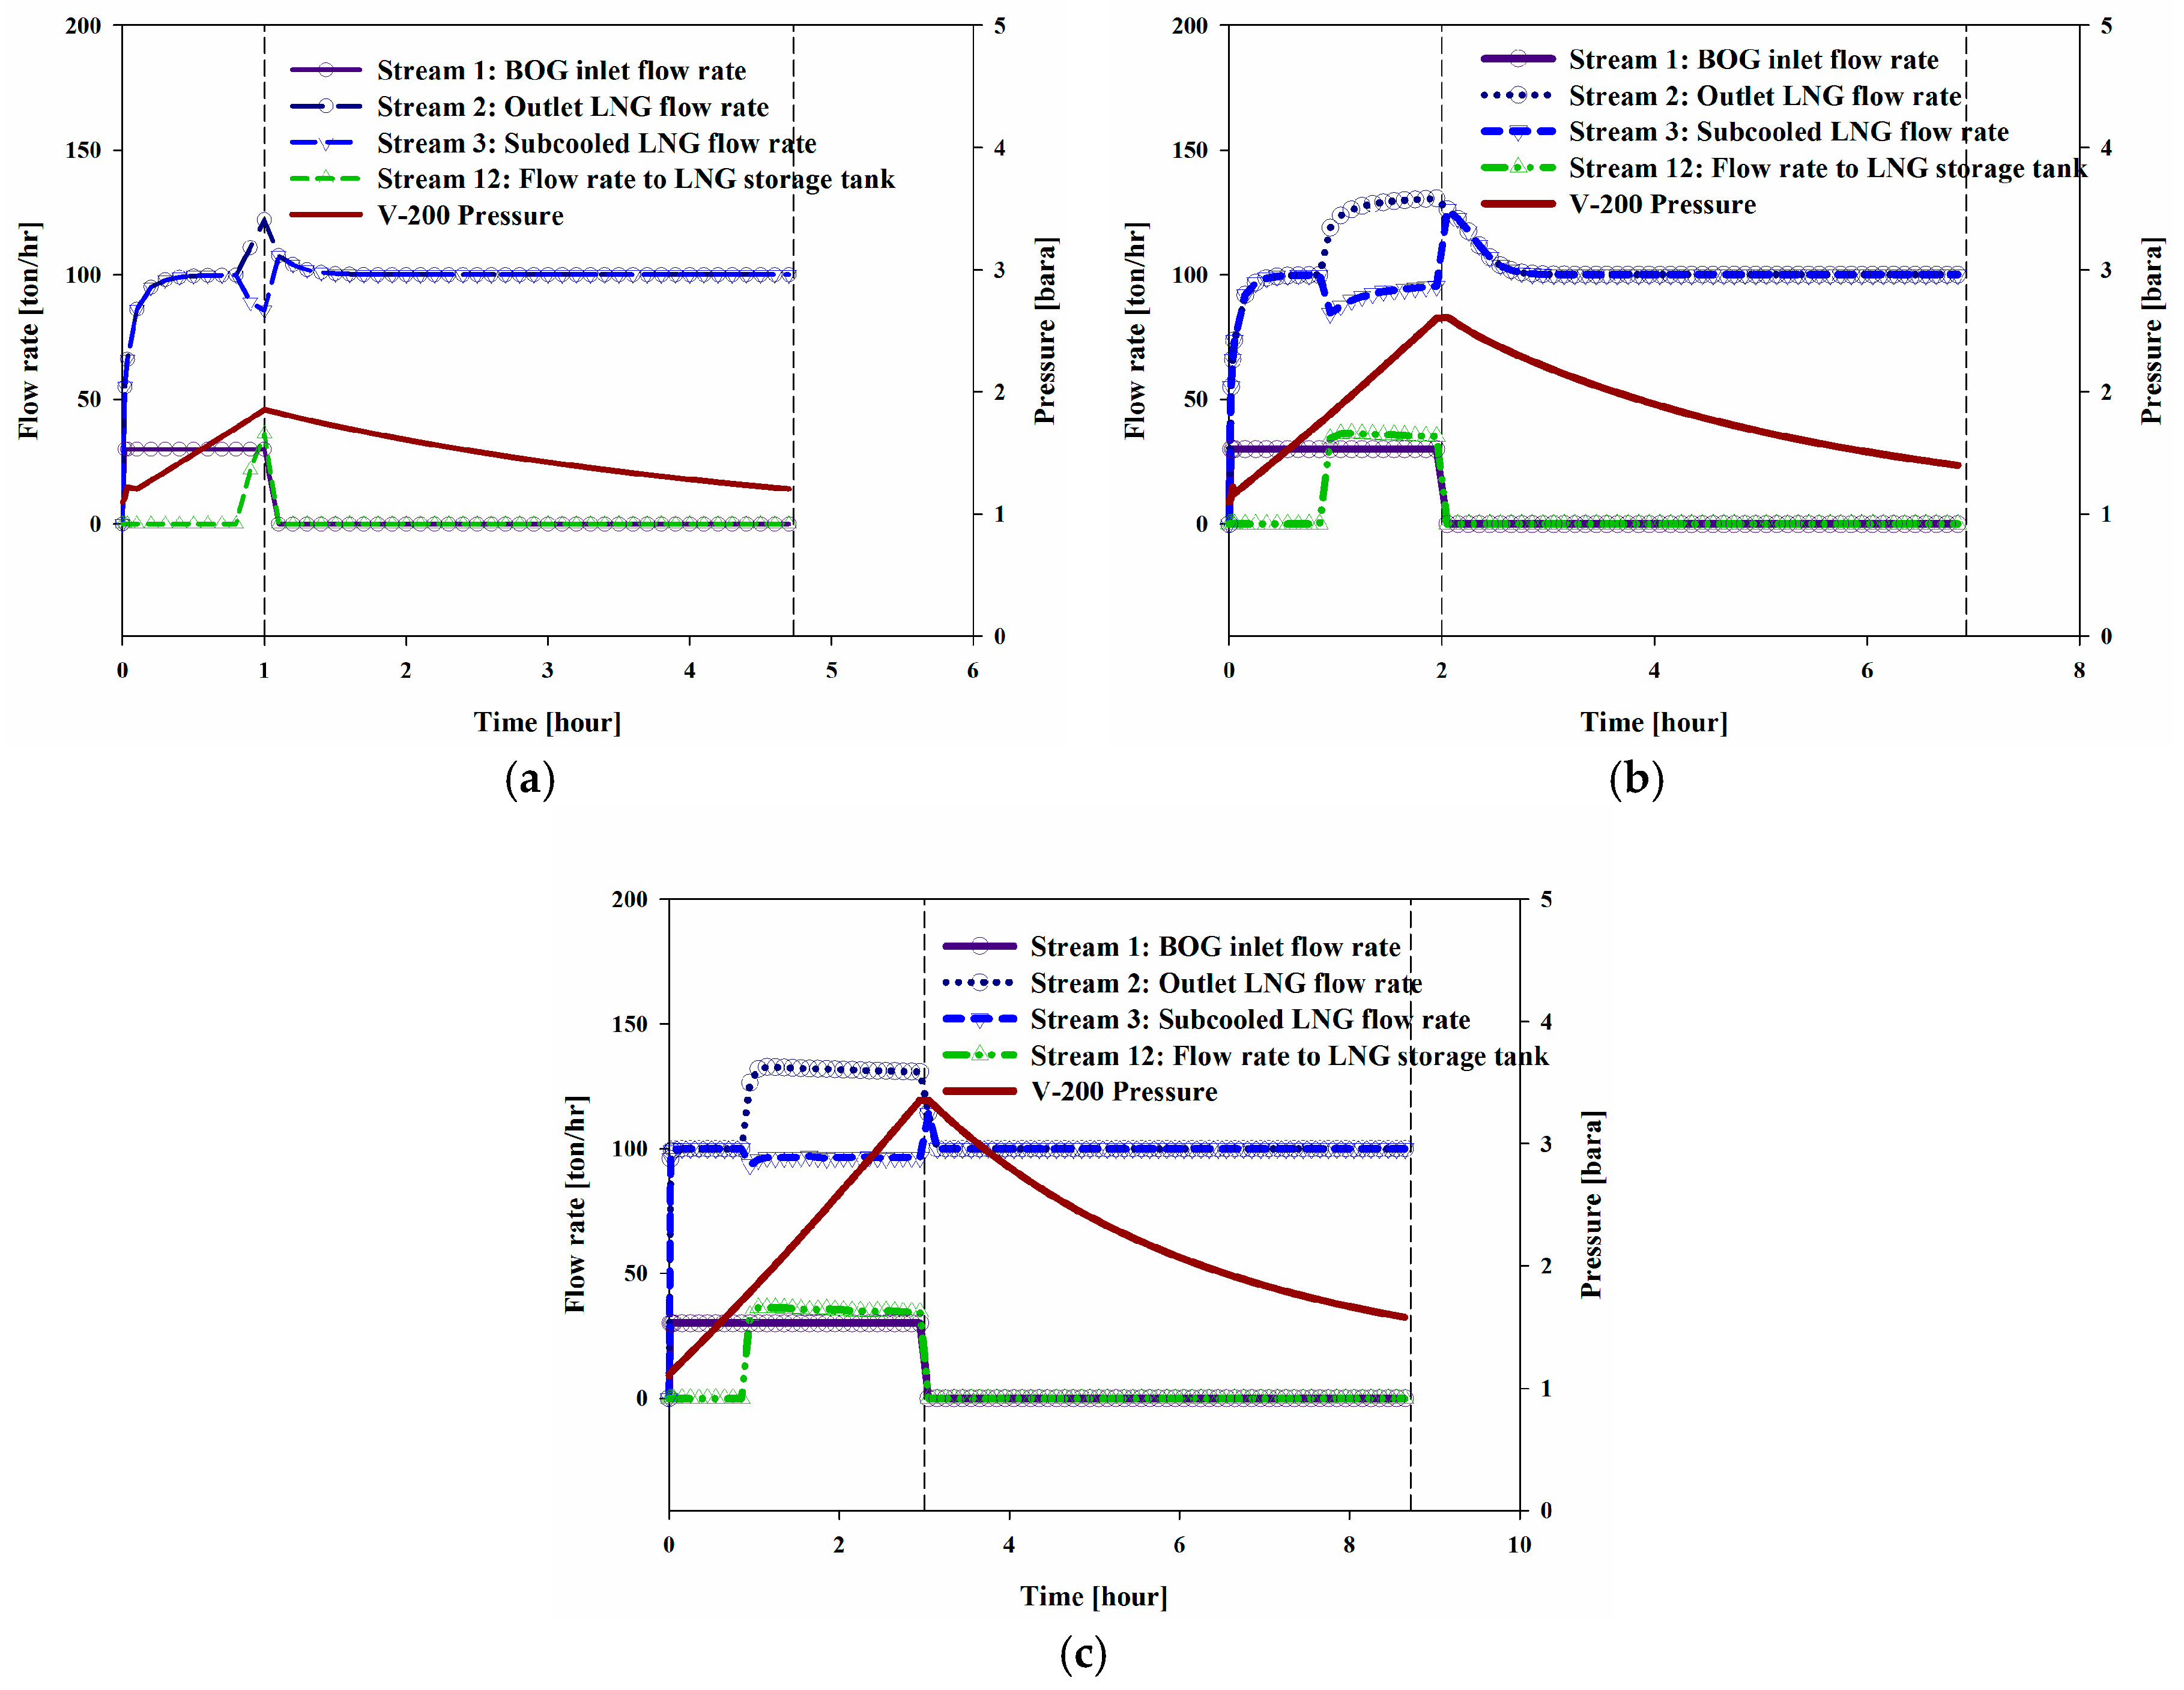
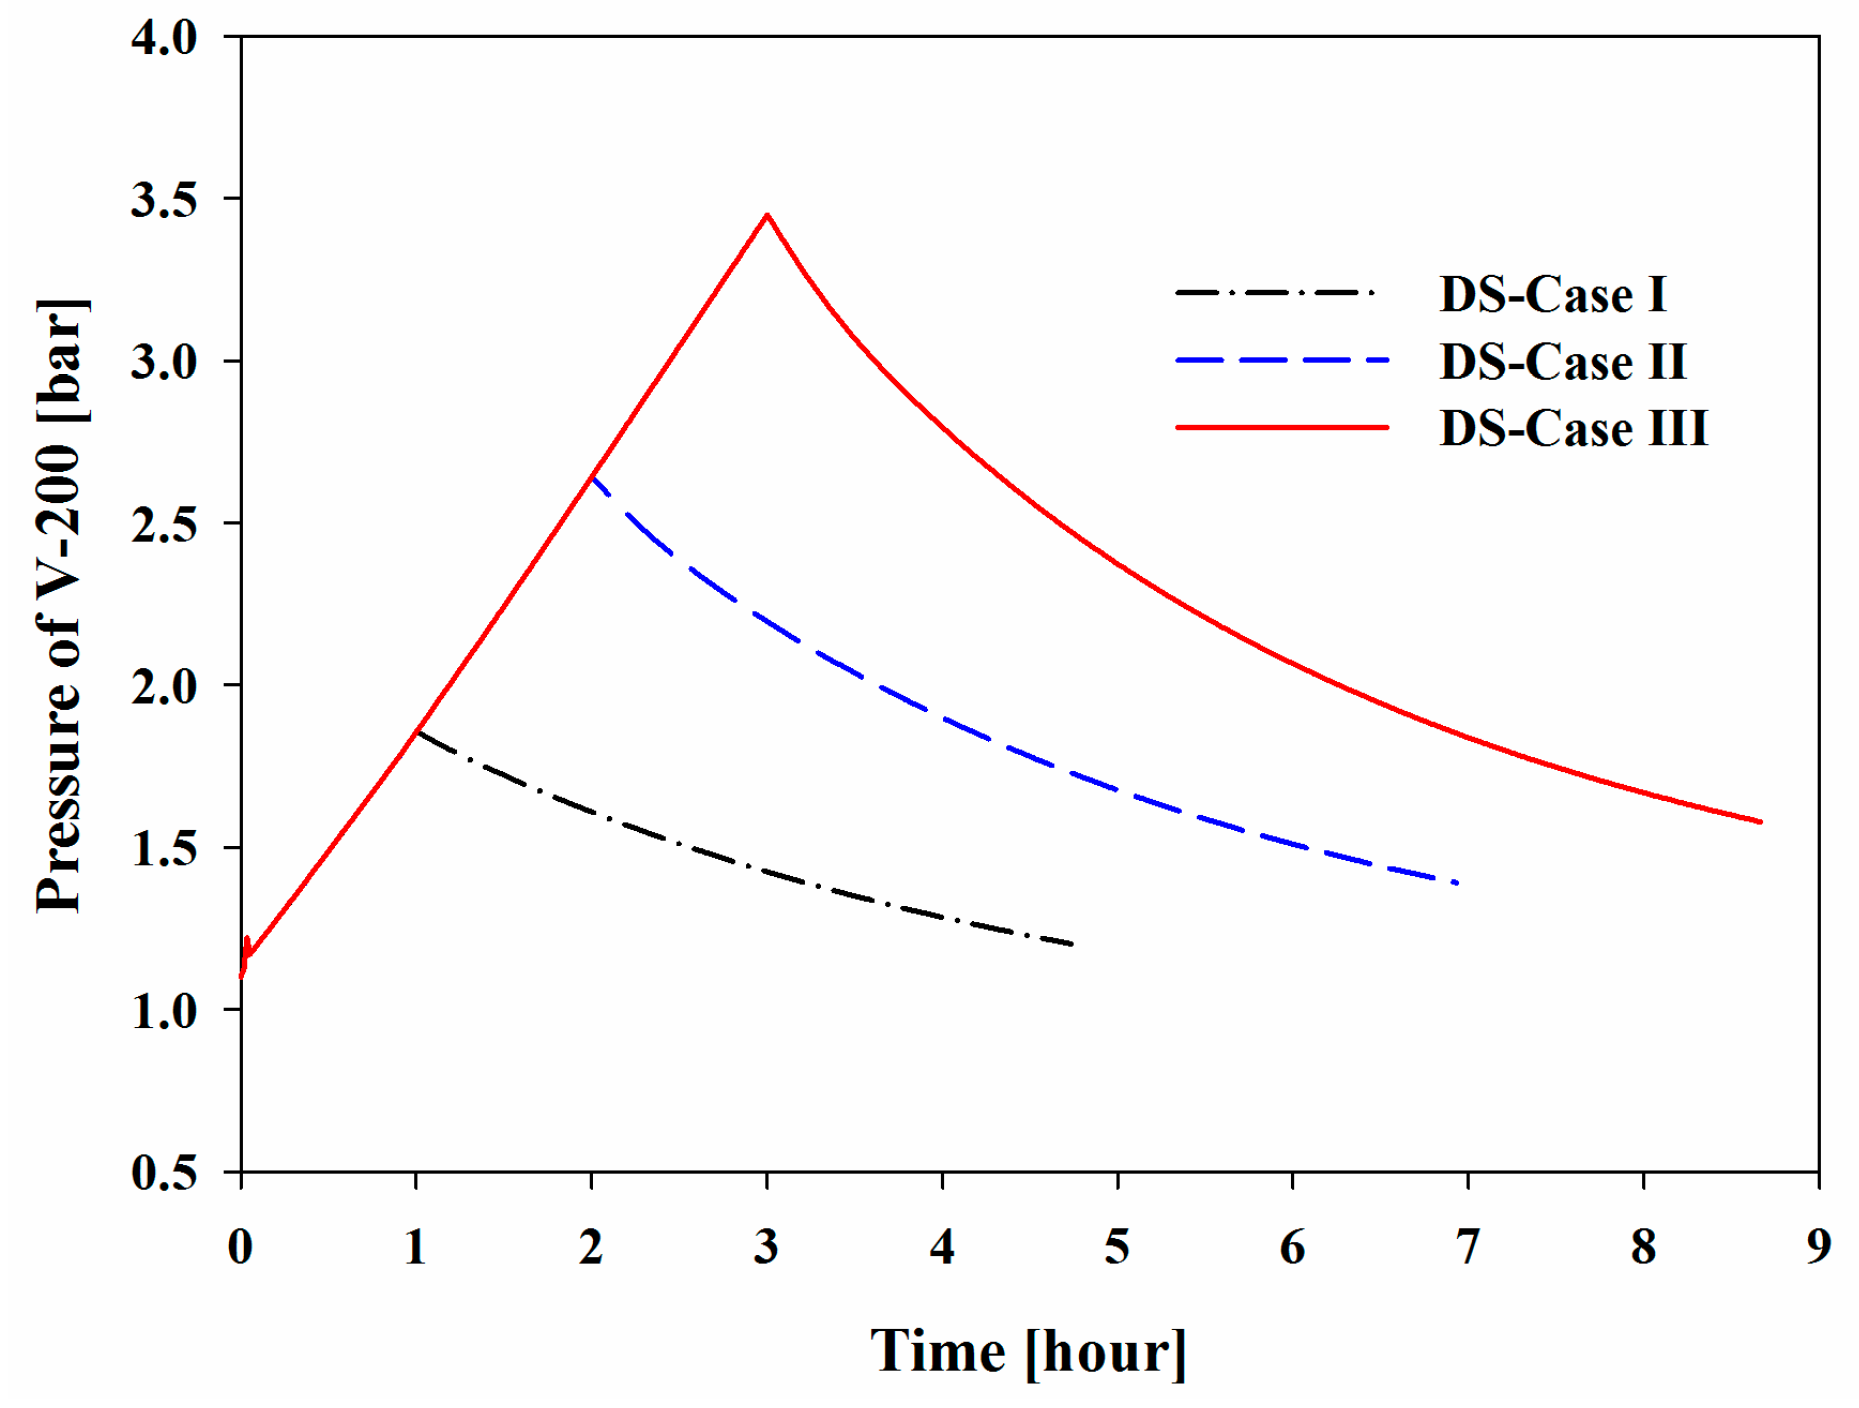
The amount of BOG that is transferred into System II can vary depending on the conditions of the ships to be bunkered. Thus, dynamic simulations of three cases were performed. DS-Cases I to III considered the treatment of BOG for one, two, and three hours, respectively, at a constant flow rate (30 ton/h). In these simulations, the BOG inflow operation started at 0 h, and as soon as all of the BOG had flowed in, the initialization mode began and ran until the temperature had returned to the initial temperature of −162 °C.
Figure 8a–c shows the trends for the flow rate over time.
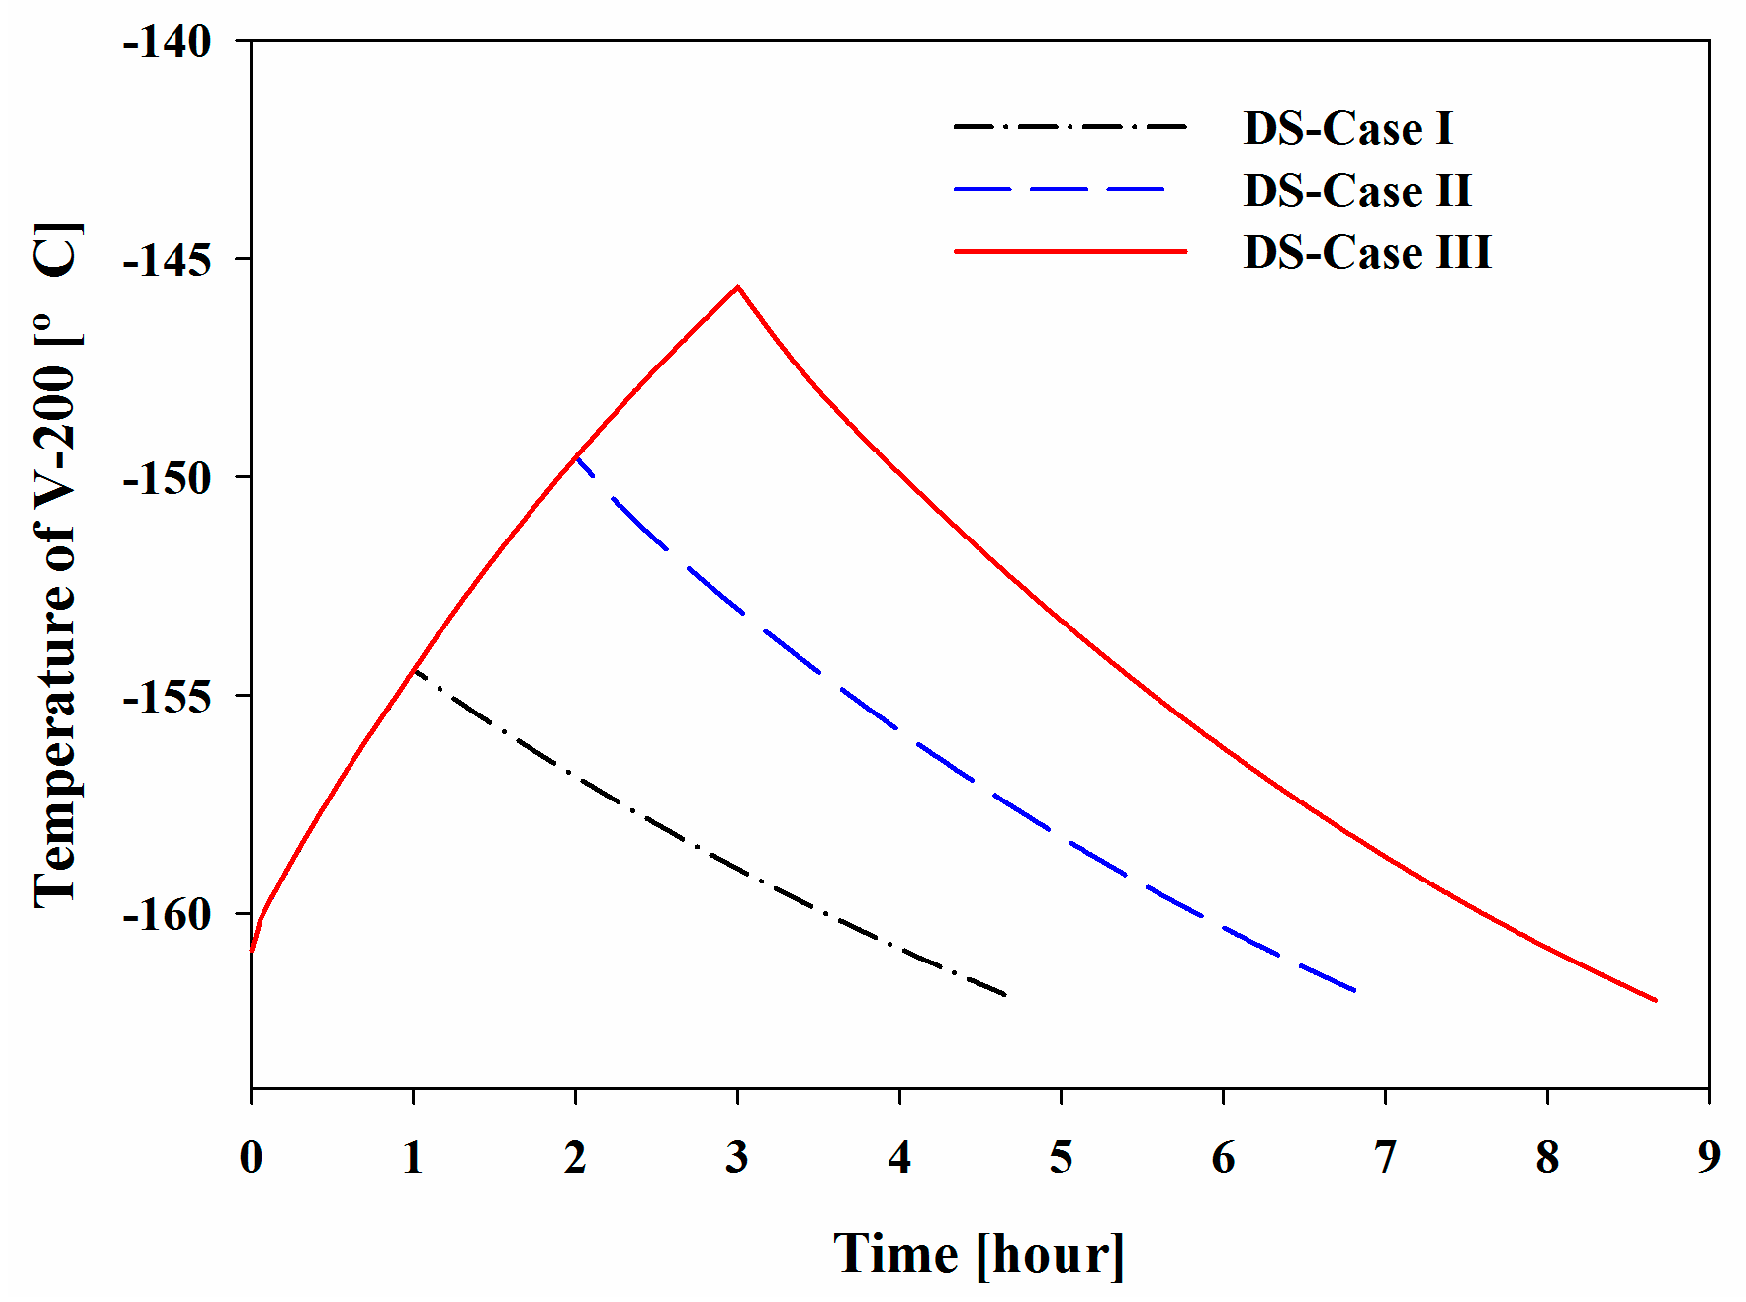
Figure 9 and
Figure 10 show the increase in the pressure and temperature of V-200 during the BOG inflow mode and the subsequent decreases during the initialization mode. Considering the BOG as a heat source, the increases in these values were proportional to the peak temperature and pressure that were observed in the system. The maximum pressures of V-200 in DS-Cases I to III were 1.86, 2.64, and 3.45 bar, respectively, and the maximum temperatures were −154.42, −149.55, and −145.66 °C, respectively.
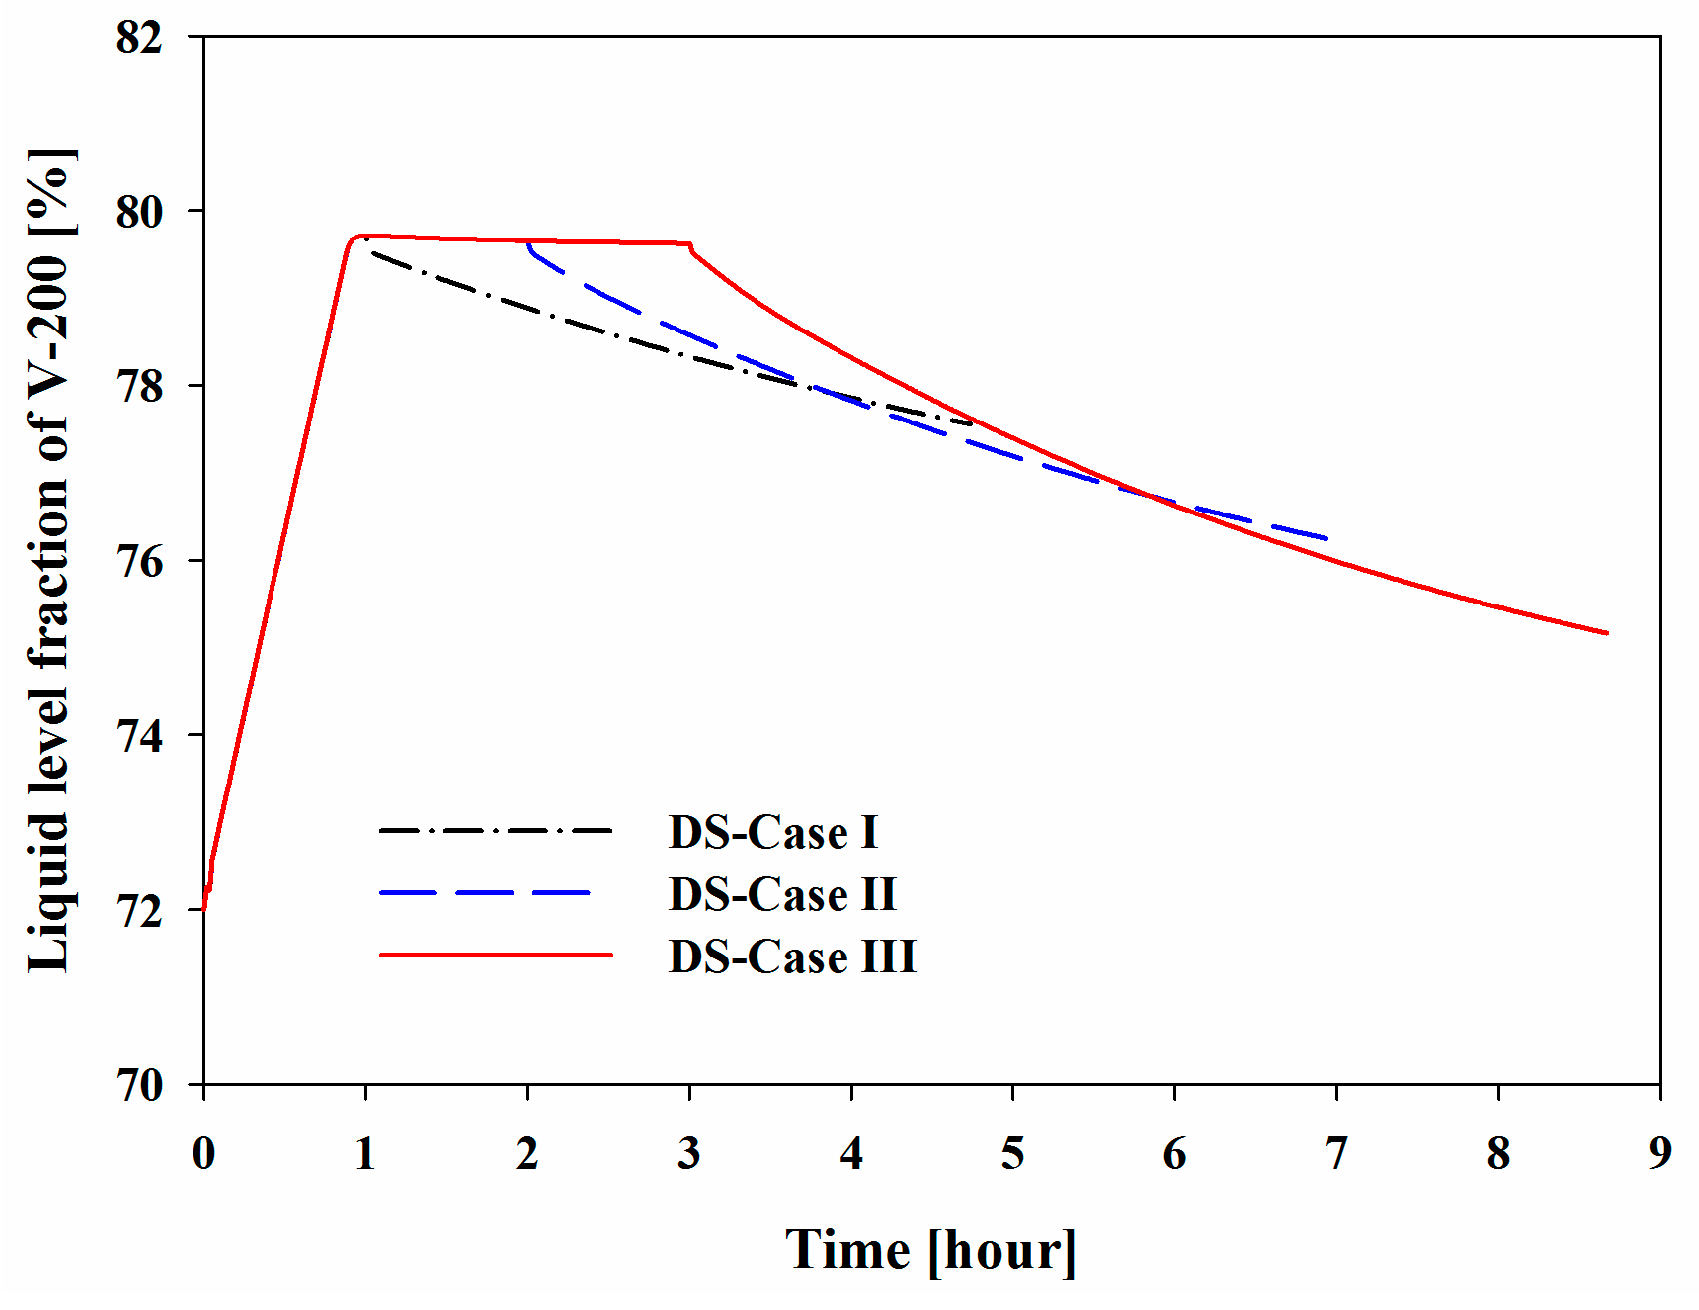
Figure 11 shows the profiles of the liquid level fraction. The liquid level increased from 72% to 80% in the middle of the BOG inflow mode. The increase in the liquid level was restricted to less than 80% using a flow via Stream 12 to the storage tank. After the BOG inflow mode, the temperature of V-200 decreased to the initial temperature of −162 °C, which allowed System II to treat fresh BOG the same as in the initial state. The liquid level decreased because of the decreases in temperature, which caused a decrease in density.
4.4. Different Compositions of BOG (DS-Cases IV to VI)
Figure 9 shows the change in pressure in the V-200 of System II. At the end of the operation, although the temperature of V-200 was re-initialized to −162 °C, the pressure was slightly higher than the initial state (1.1 bar). This is the reason that the nitrogen content in the BOG affected the property of the holdup in V-200.
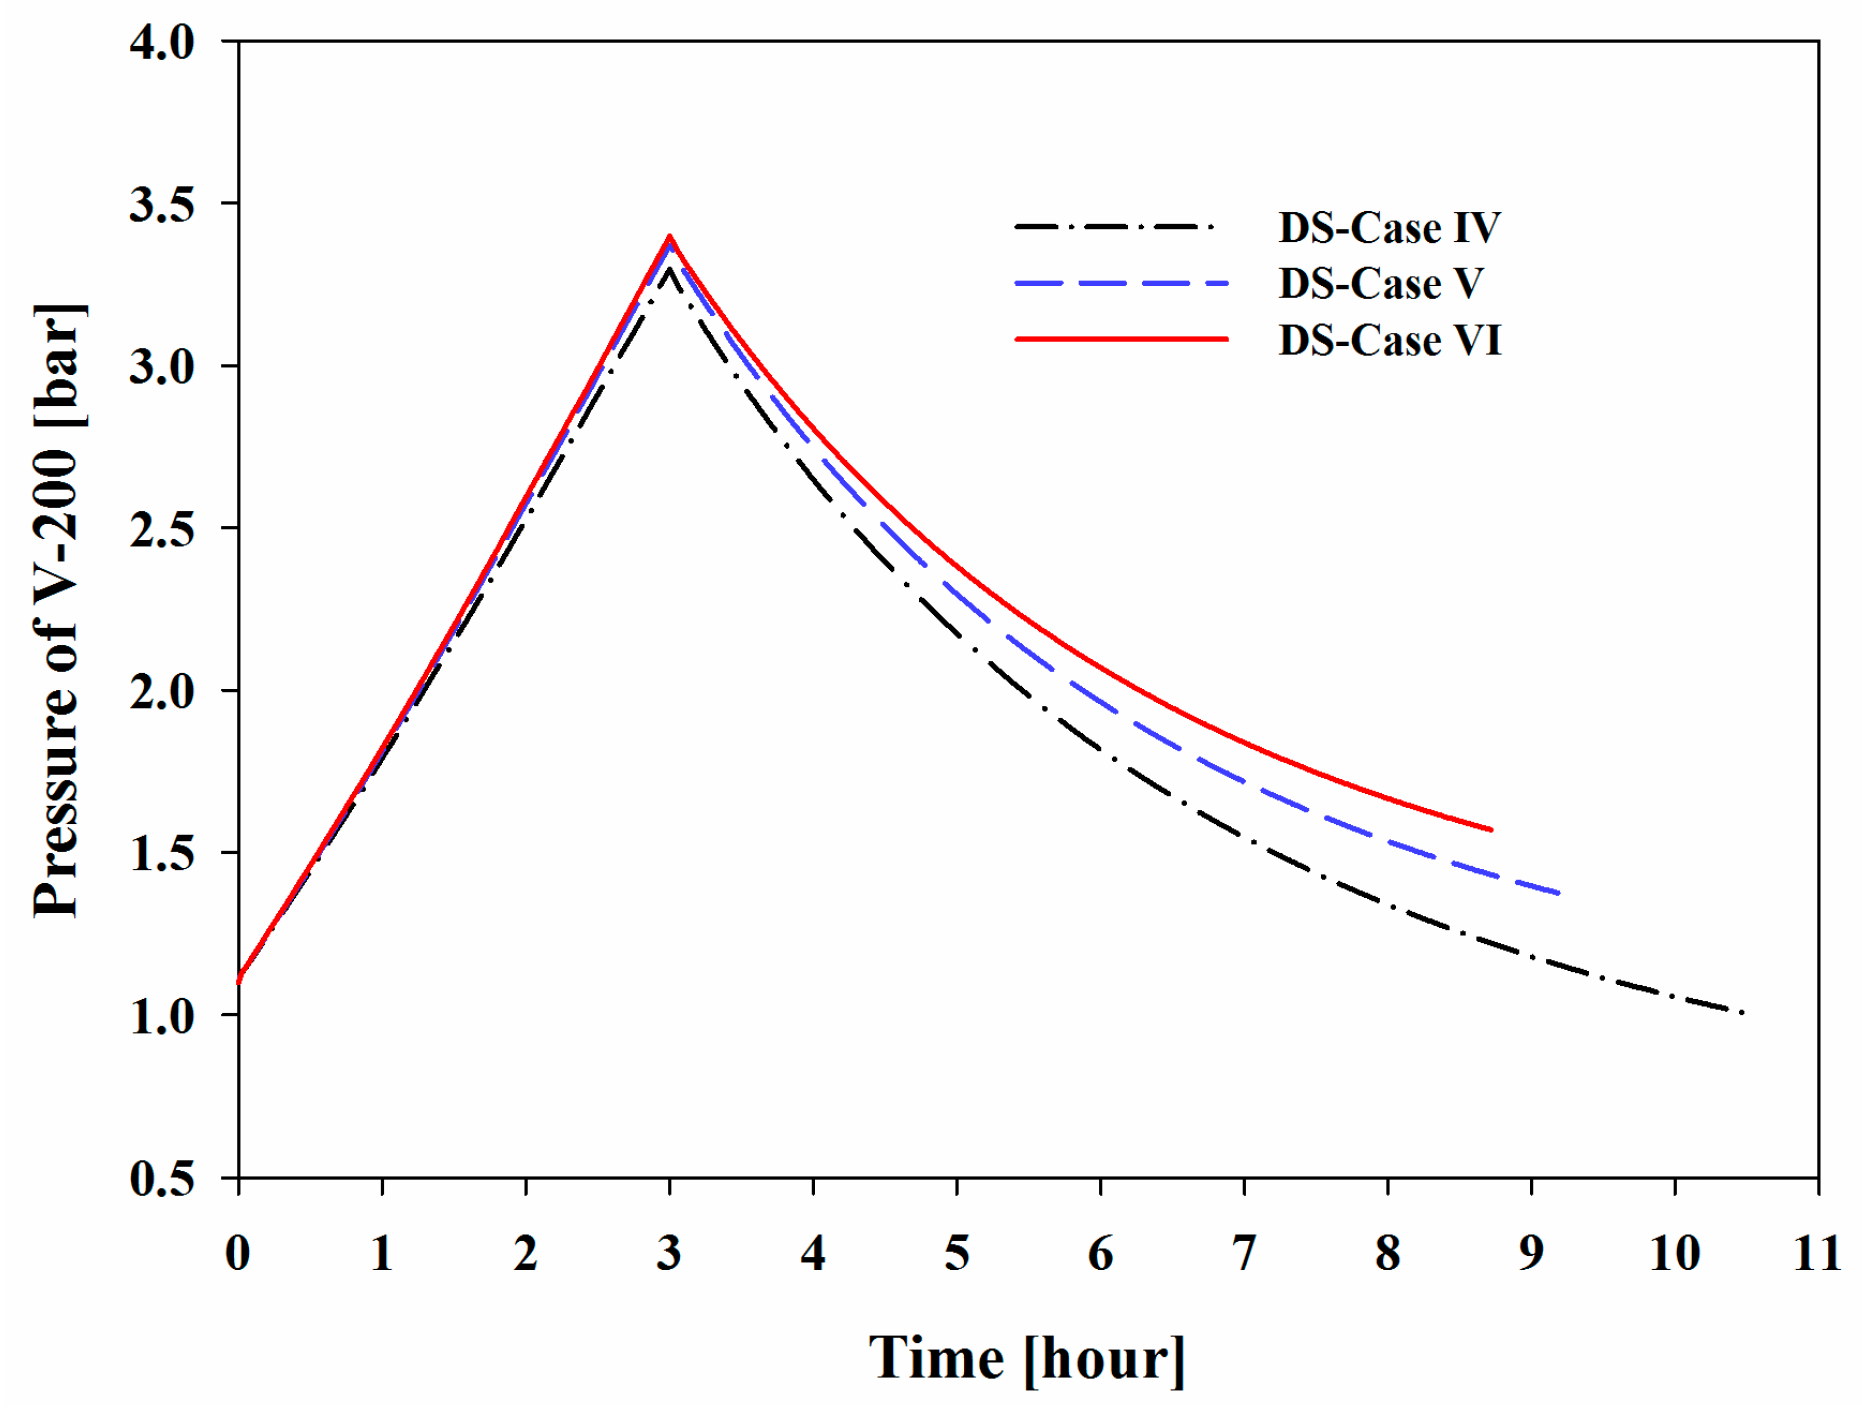
Thus, additional simulations were performed with different BOG compositions to determine the effect of nitrogen on this system. The results of DS-Cases I to III indicated that 90 tons of BOG is the worst case; thus, an inflow of 90 tons of BOG was considered with different compositions.
In these simulations, the BOG inflow operation started at 0 h and finished at 3 h, as soon as all of the BOG had flowed in, the initialization mode began and ran until the temperature had returned to the initial temperature of −162 °C.
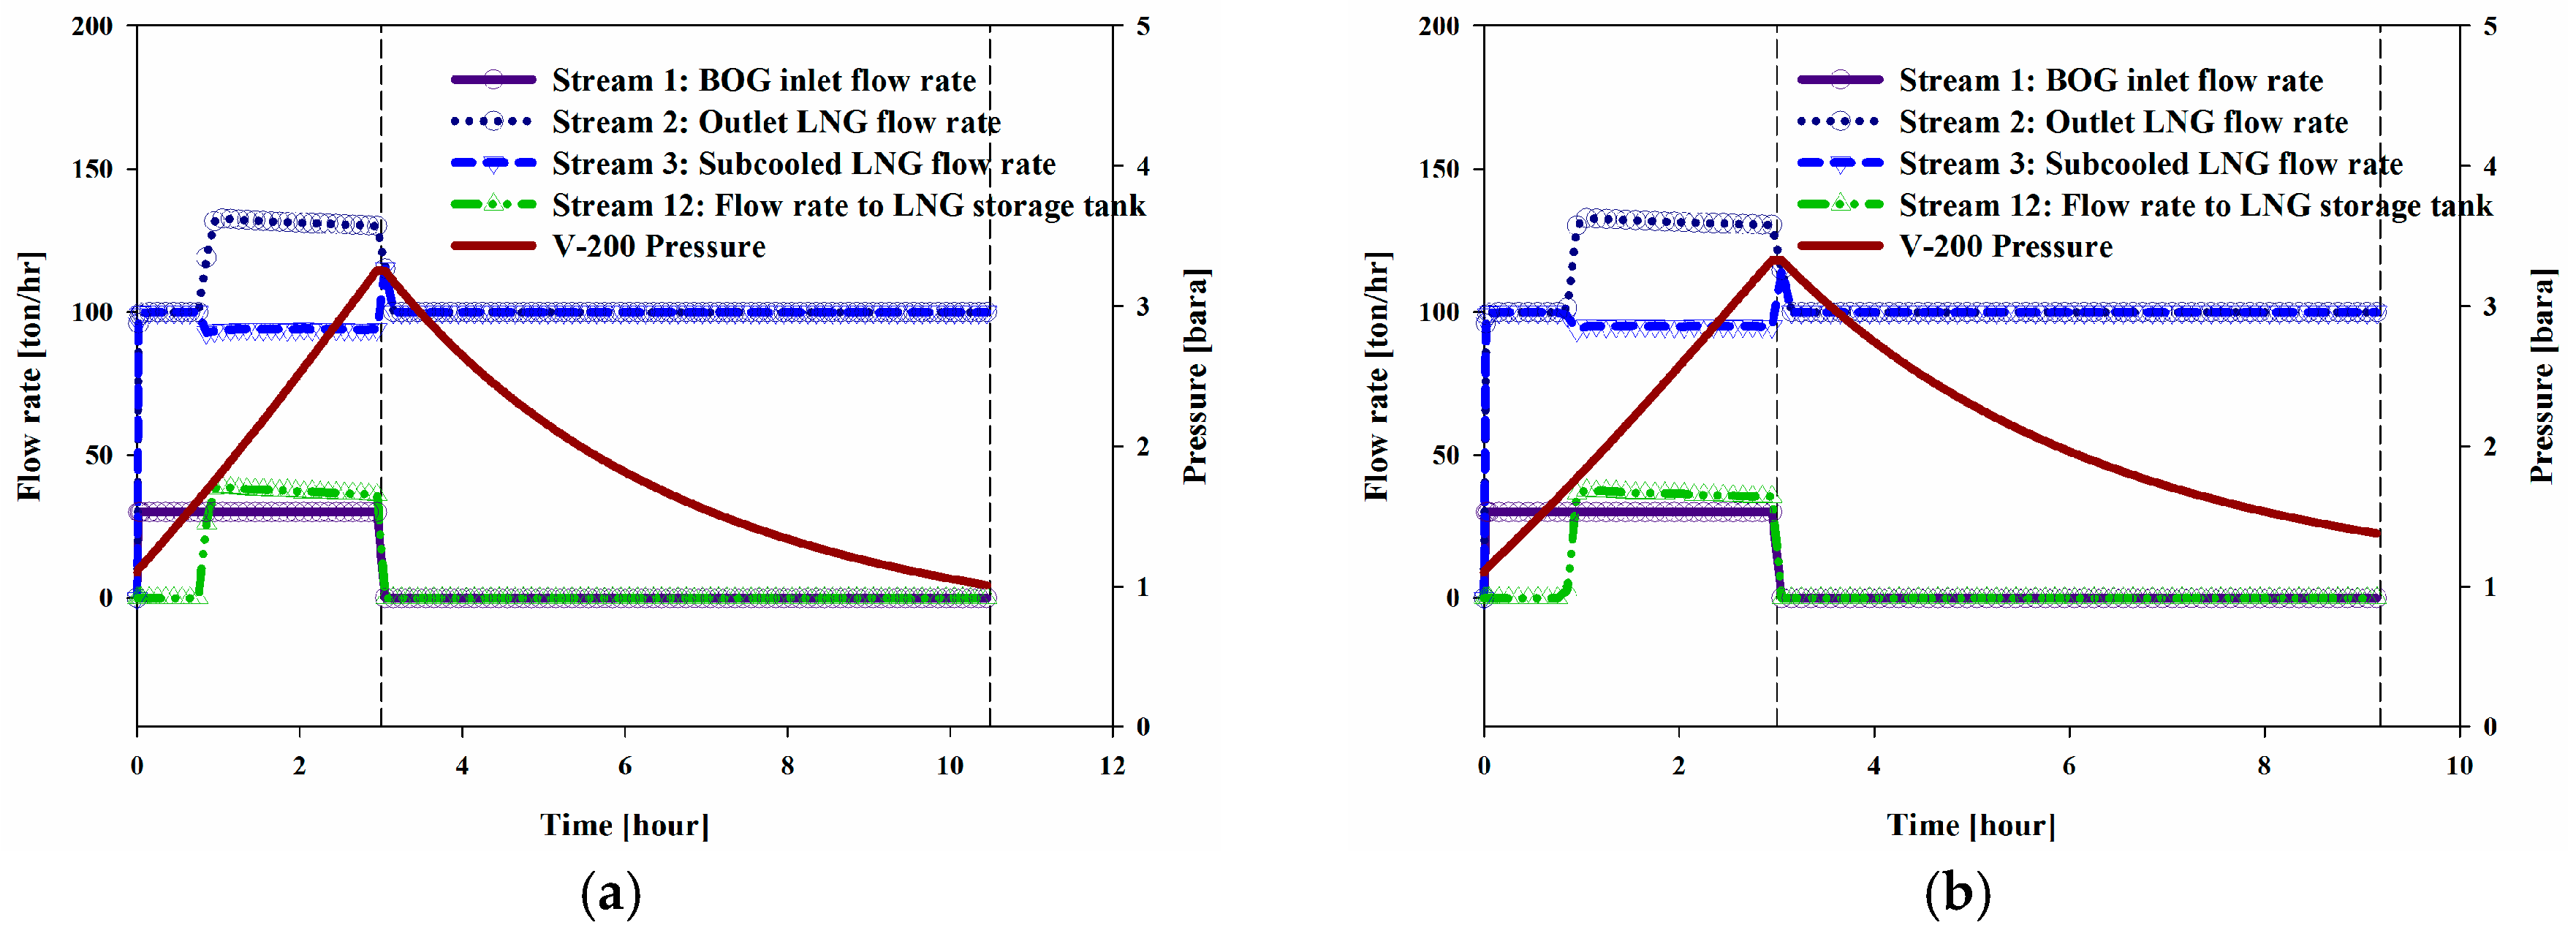
Figure 12a,b and
Figure 8c show the trends of the flow rate for Stream 1, 2, 3, and 12. Additionally, they show the pressure profile of V-200.
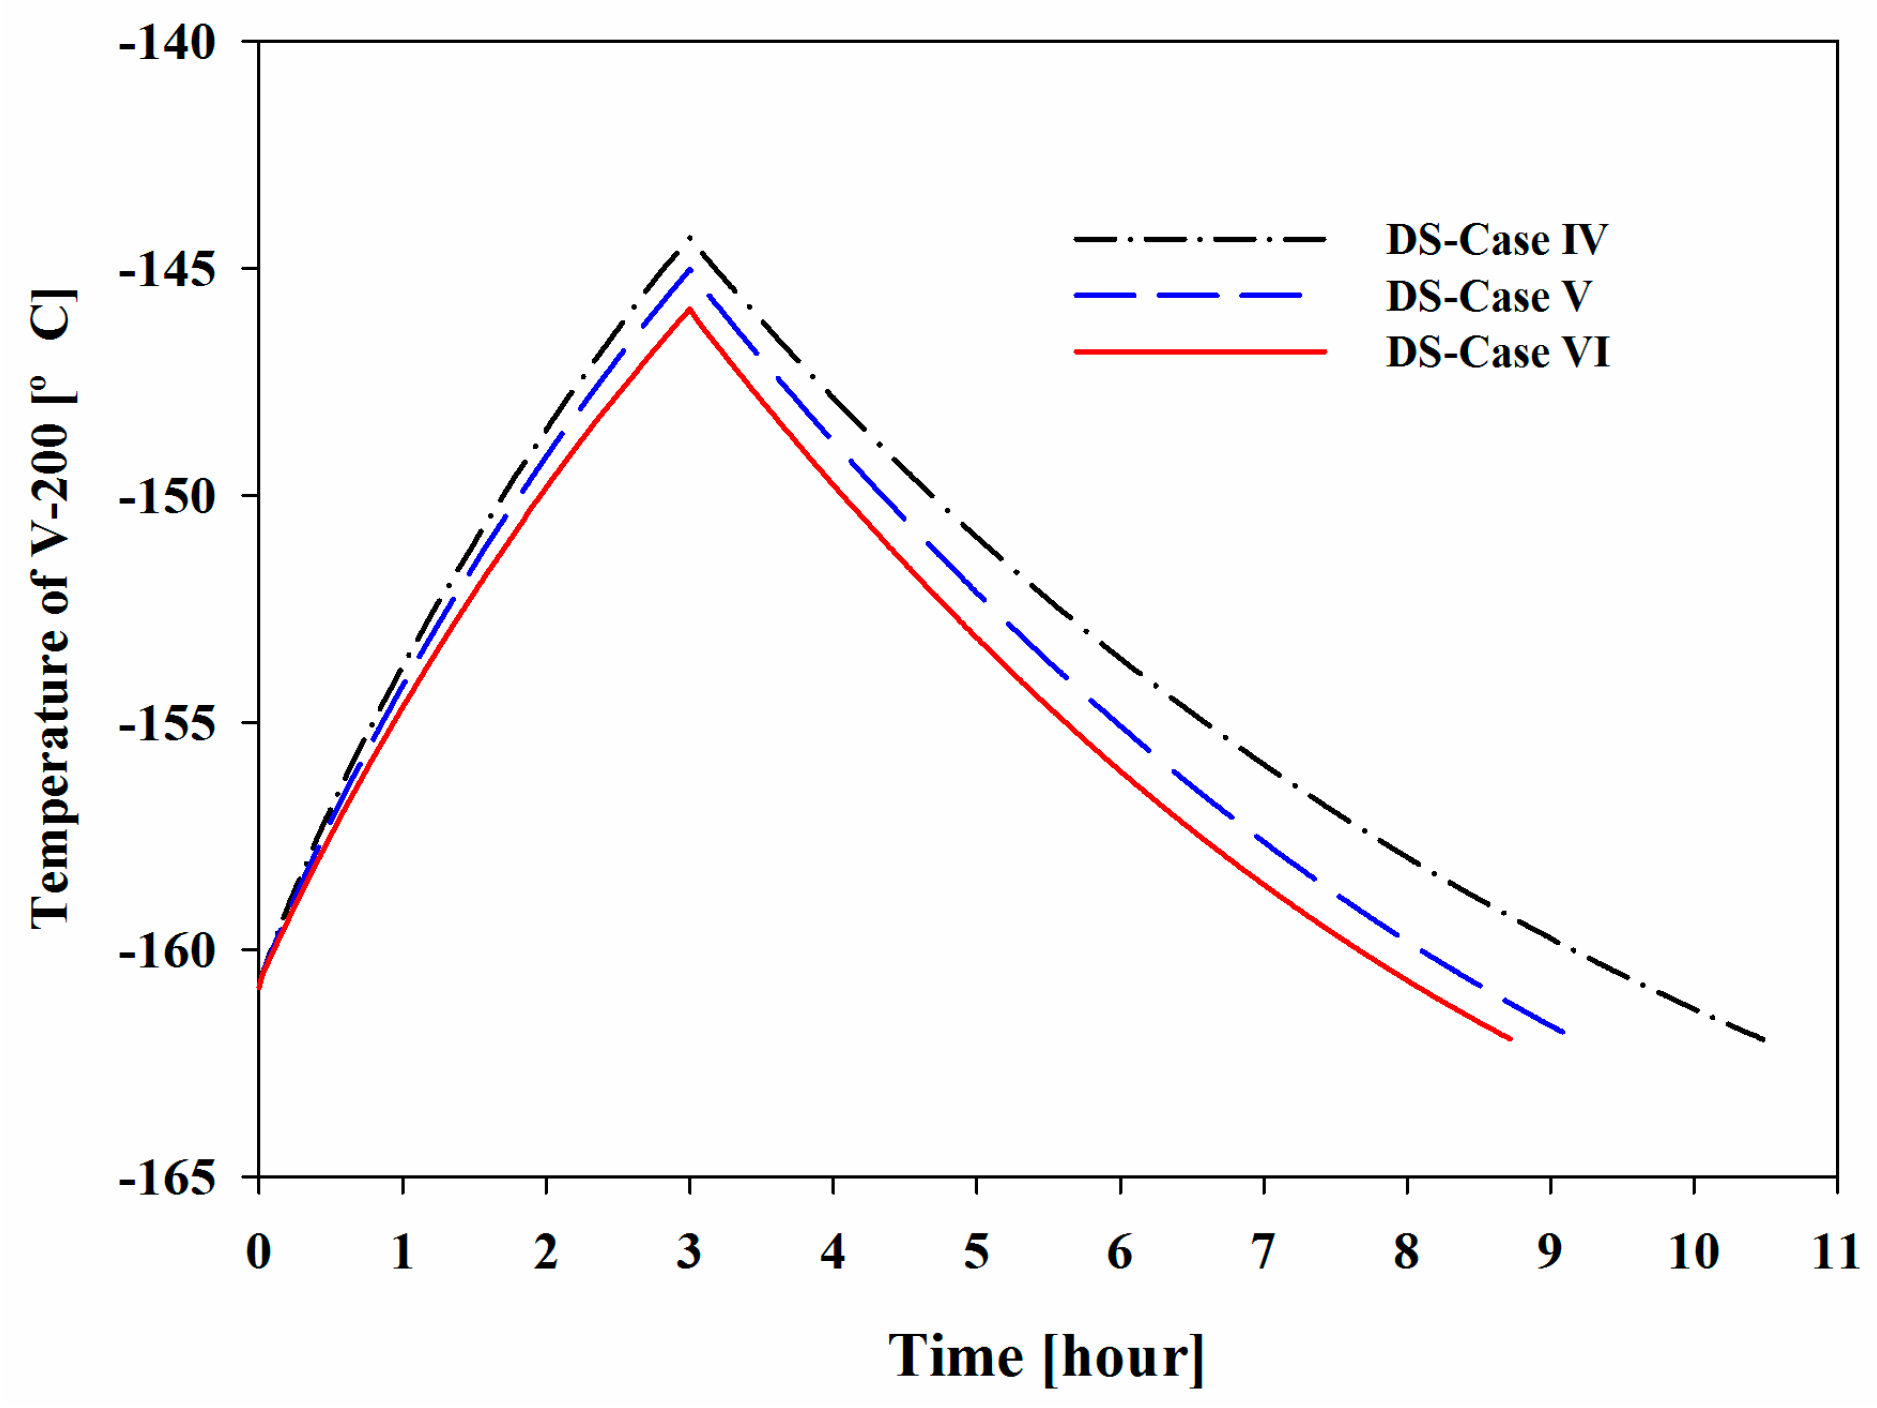
As shown in
Figure 13 and
Figure 14, three hours after the BOG inflow mode, the maximum pressures of V-200 were 3.30, 3.37, and 3.45 bar for DS-Cases IV to VI, respectively, and the maximum temperatures were −144.3, −145.0, and −145.7 °C, respectively. After the BOG inflow mode, the temperature returned to −162.0 °C during the initialization mode, while the pressure could not reach the initial value. When the nitrogen content was increased, the volatility of the holdup in V-200 increased, which eventually resulted in a pressure that was higher than the initial pressure. In addition, the refrigeration time was affected by the nitrogen content. Methane has a slightly higher heat capacity than nitrogen. Considering BOG as the heat source, the BOG with less nitrogen contained more heat, which resulted in a higher maximum temperature and a greater amount of time required to cool the holdup in V-200.
4.5. Composition Change in System II
As shown in
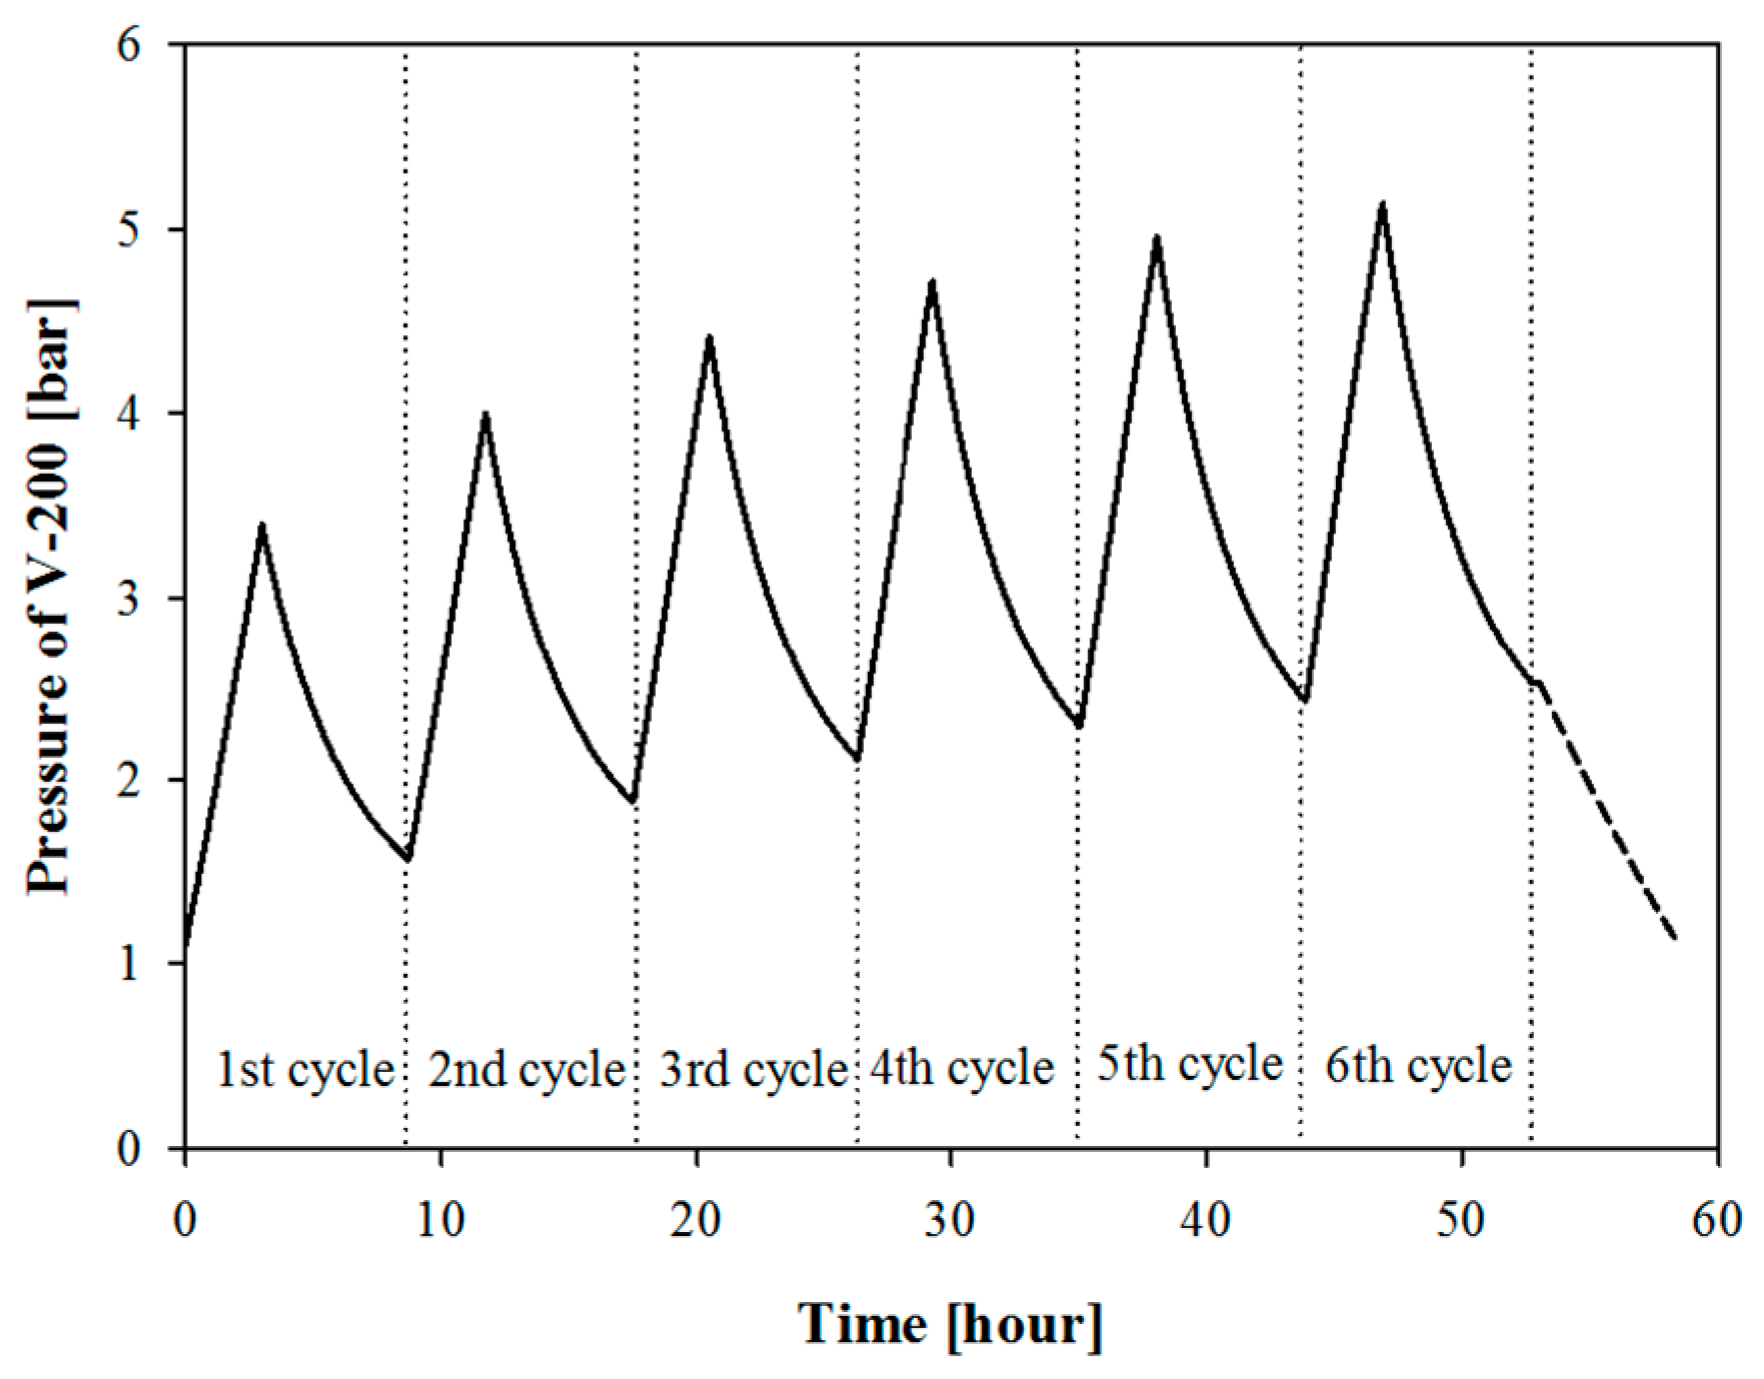
Figure 15, in the middle of six repetitive operations for DS-Case III, the maximum pressure reached the design pressure of 5 bar, and the pressure after the sixth initialization was 2.5 bar. The maximum pressure of V-200 would thus exceed the limit in the next cycle. Thus, a solution to decrease the nitrogen composition in V-200 was necessary.
Two methods were proposed for analysis and simulation to decrease the nitrogen composition in the V-200. The first method was to vent the vapour portion of V-200. After six cycles of BOG treatment, the pressure was 2.5 bar, and the vapour composition was 37% methane and 63% nitrogen. Because the vapour had a high nitrogen concentration, venting the vapour at that point minimized the hydrocarbon loss. After the venting operation, the pressure decreased to the initial pressure of 1.1 bar. A total of 54.7 tons of vapour was vented. Because approximately 37% of the vapour was methane, 20.2 tons of methane was purged with nitrogen. In addition, because System II condensed 540 tons of BOG during the six cycles, the 20.2 tons of methane represented only 3.7% of the total output.
The other method was renewing the LNG. In this method, all of the LNG in V-200 that contains high nitrogen composition by condensation of BOG was transferred to the LNG storage tank, and then V-200 was filled with fresh LNG with low nitrogen composition. LNG renewal is a solution that does not cause hydrocarbon losses but requires storage of a sufficient amount of LNG in the LNG storage tank.
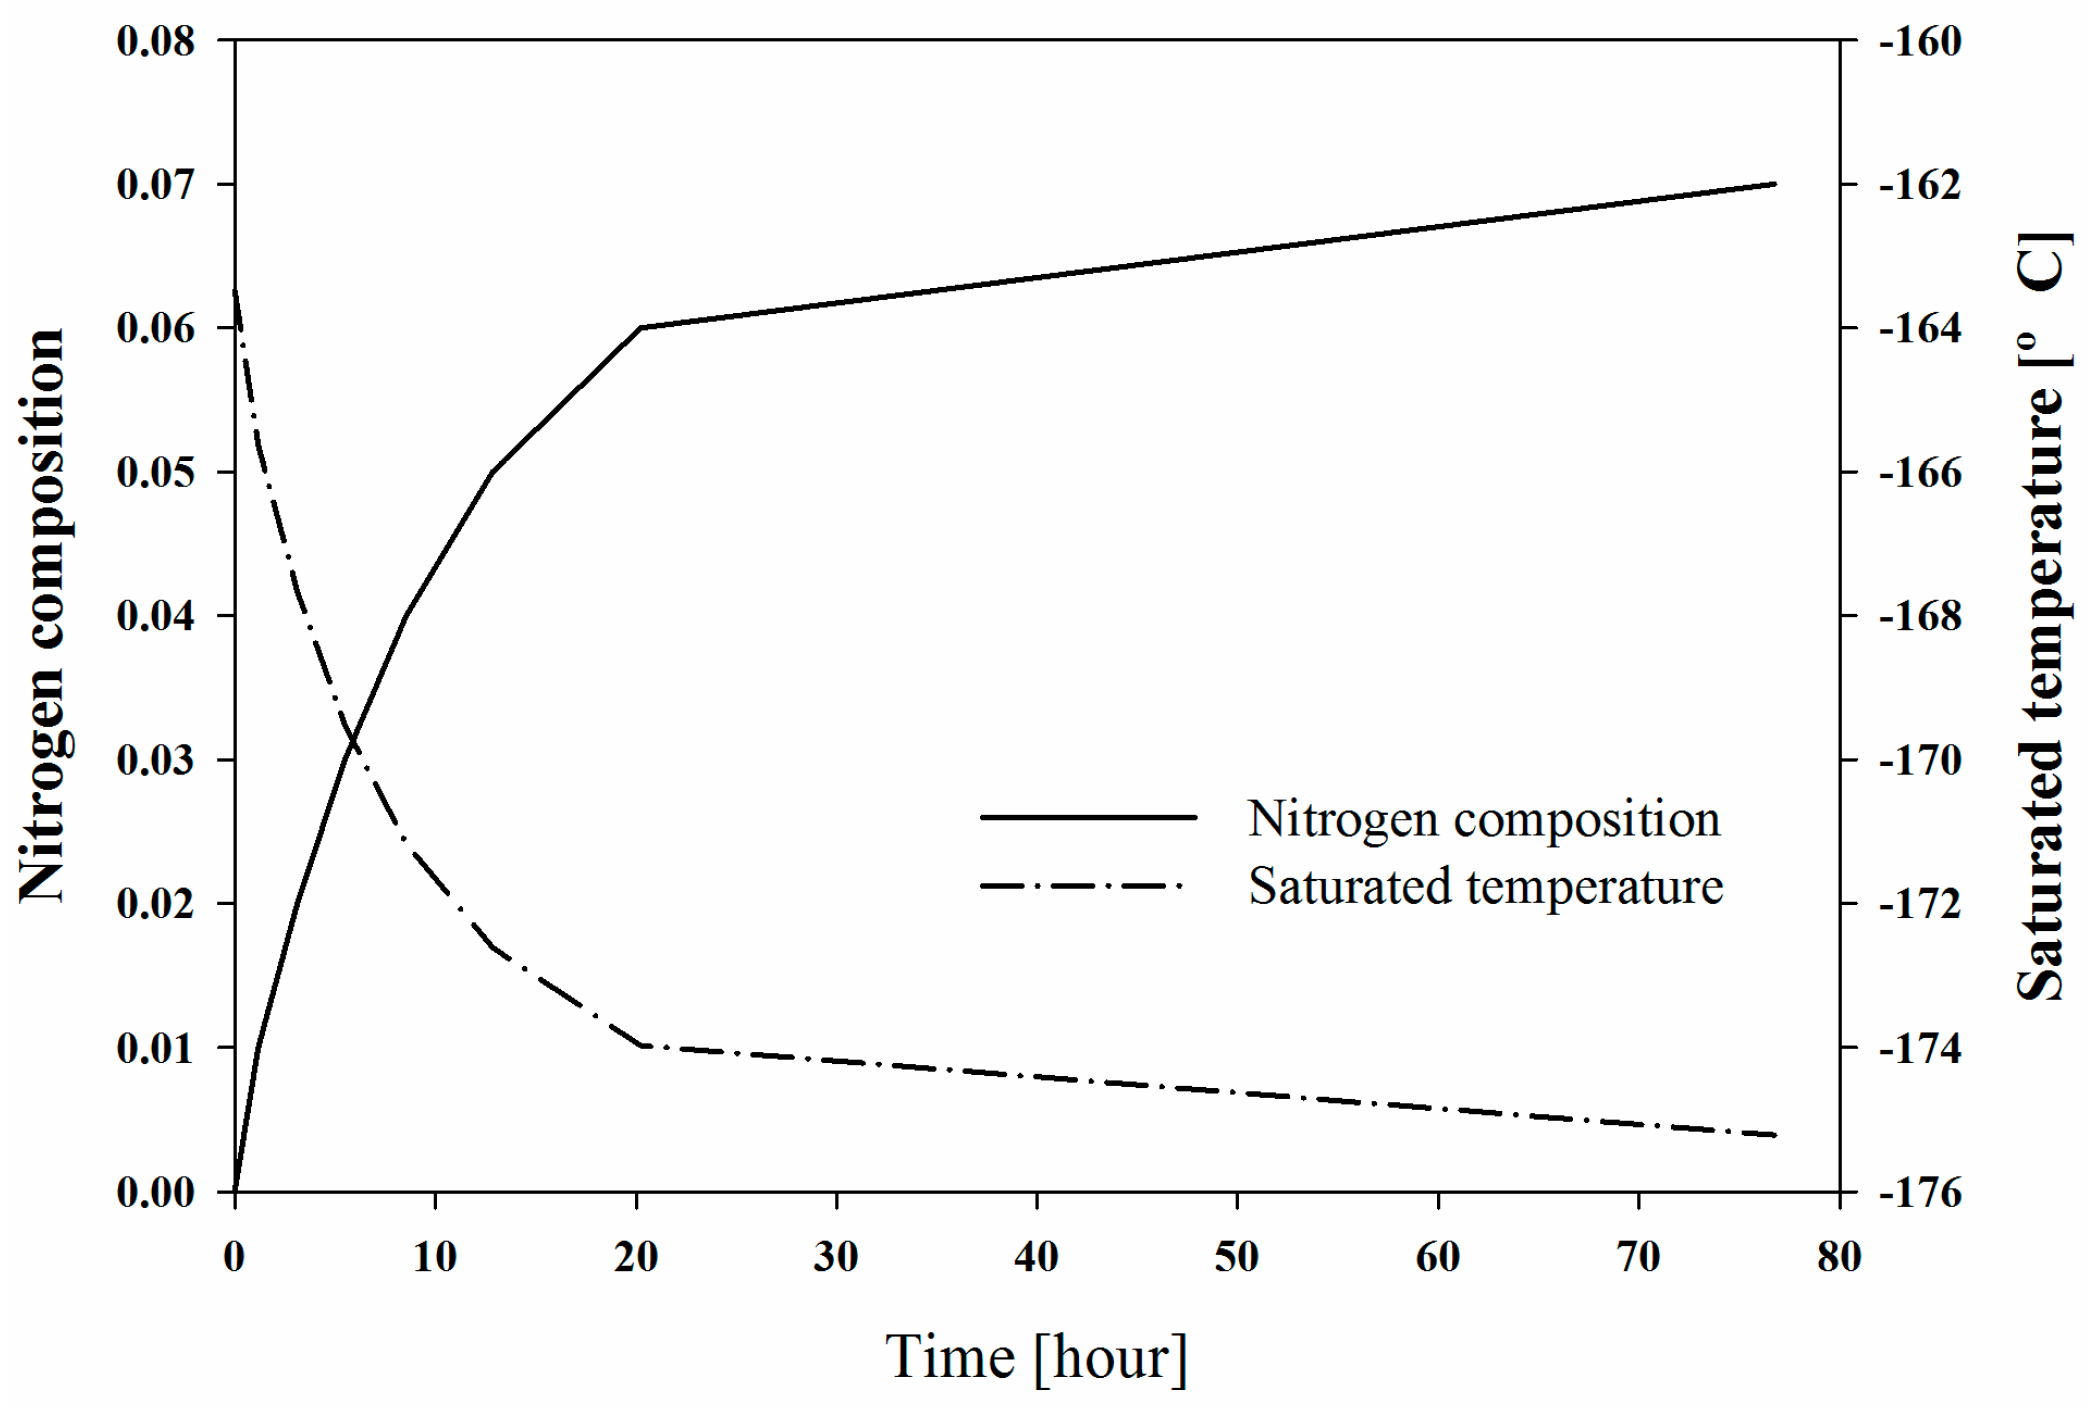
Figure 16 shows the changes in the composition of the holdup in the V-200 of System II. When the BOG of Composition C flowed into V-200 at a flow rate of 30 ton/h and the liquid holdup was transmitted through Stream 12 at a flow rate of 30 ton/h, the nitrogen composition in V-200 instantaneously increased, and the saturated temperature decreased. The holdup temperature and efficiency of the refrigeration cycle were correlated because the temperature determined the stream condition of the expander outlet (Stream 9), which was also the cool stream inlet for the heat exchanger (HX-202) that subcooled the LNG. The temperature of Stream 9 was considered to be the temperature of the saturated vapour in the process simulations; thus, the pressure of the stream decreased. The ratio of the maximum and minimum pressures of the refrigeration cycle directly affected the exergy loss.
5. Conclusions
The purpose of this study was to design a novel BOG re-liquefaction technology using a BOG spray recondenser system that is intended for LNG bunkering operations. The advantages of the BOG recondenser system were verified and compared with the most widely used conventional re-liquefaction system in terms of energy consumption and via an exergy analysis. The main characteristic of the new system was the change of the location of re-liquefaction from the heat exchanger to the pressure vessel, which is called the BOG recondenser vessel and acted as a buffer tank against variations in the BOG load. The phase transition occurred in the pressure vessel and not in a heat exchanger, which enabled the proposed BOG recondenser system to achieve efficiencies up to 6.9% higher than the conventional system. The exergy analysis showed that the useful work of the conventional system was 24.9%, and that of the BOG recondenser system was 30.70%.
Dynamic process simulations of six bunkering cases were performed to demonstrate the operational feasibility of the new system following three operation modes: the BOG inflow mode, initialization mode, and idling mode. The pressure and temperature of the holdup in V-200 increased during the BOG inflow mode and decreased during the initialization mode. The maximum pressures of V-200 for DS-Cases I to III were 1.86, 2.64, and 3.45 bar, respectively, and the maximum temperatures were −154.4, −149.6, and −145.7 °C, respectively. For DS-Cases IV to VI, the maximum pressures were 3.30, 3.37, and 3.45 bar, respectively, and the maximum temperatures were −144.3, −145.0, and −145.7 °C, respectively.
The dynamic simulations indicated that the pressure vessel experienced a composition-related challenge. At the end of the initialization operation, the temperature of V-200 returned to the initial temperature (−162 °C), while the pressure was slightly higher than the initial state (1.1 bar) due to the nitrogen content of the BOG affecting the properties of the holdup in V-200. In the middle of six repetitive operations for DS-Case III, the maximum pressure reached the design pressure of 5 bar, and the pressure after the initialization mode was 2.5 bar. Two solutions were suggested to mitigate the increase in pressure. The first method was to vent the vapour portion of V-200, and the other was to renew the LNG.
Several challenges were identified for future investigations. One is the verification of the heat and mass transfer between the LNG droplets and the BOG. For example, the nitrogen component, which is more volatile than methane, may form a mass transfer barrier between the BOG and the liquid phase. Research is recommended on the effects of the pressure, temperature, contact area and LNG concentration on the mass transfer.
Another challenge is the process optimization. The subcooling temperature should be selected on the basis of the operational cost, exergy loss, and amount of nitrogen that the operation can purge. When a high subcooling temperature is selected, the hydrocarbon loss increases because of flashing in the storage tank. Additionally, the pressure of the BOG that is transferred to V-200 was fixed at 5.1 bar in this study. However, there is likely an optimal pressure for the new system. The pressure should be optimized considering the OPEX and CAPEX. The control philosophy and appropriate overpressure protection methods should be fully evaluated by considering all realistic scenarios.


