Article

Assessment of Renewable Sources for the Energy Consumption in Malta in the Mediterranean Sea

Department of Energy, Information Engineering and Mathematical Models, University of Palermo (UNIPA), 90128 Palermo, Italy
*
Author to whom correspondence should be addressed.
Energies 2016, 9(12), 1034; https://doi.org/10.3390/en9121034
Submission received: 24 September 2016 / Revised: 18 November 2016 / Accepted: 28 November 2016 / Published: 8 December 2016

Abstract

:
The main purpose of this paper is to analyze the energy production in the Maltese islands, focusing on the employment of renewable energies in order to increase their energy independence. The main renewable source here proposed is wave energy: thanks to a strategic position, Malta will be able to produce electrical energy using an innovative type of Wave Energy Converter (WEC) based on the prototype of a linear generator realized by University of Palermo. The use of this new technology will be able to cut down the electrical energy production from traditional power plants and, consequently, the greenhouse gas emissions (GHG). Wave energy source and off-shore photovoltaic (PV) technology are here proposed. Particularly, the installation of 12 wave farms, for a total installed capacity of 86 MW, will generate about 9.5% of Malta’s energy requirement in 2025, while the installation of 9.6 MW of off-shore PV will generate about 0.73%.

1. Introduction

The electrical power production is almost completely based on diesel generators in many islands in the Mediterranean Sea [1]. The fuel is usually shipped by mainland and long underwater cables sometimes connect the small islands to the mainland [2]. Due to these reasons, in small islands, the electrical power production shows higher operating costs and losses than in mainland [3]. The use of Renewable Energy Sources (RES), such as solar, wind, biomass and sea wave, will produce a reduction in energy dependence on fossil fuels and the improvement of the efficiency of the electrical grid [4]. The RES also contribute to the reduction of greenhouse gas (GHG) emissions and environmental pollution. After the ratification of the Kyoto Protocol, the European Community undertook measures to cut its GHG emissions by 8% of 1990 levels [5]. According to the European Directive 2009/28/EC (Annex I), Malta is required to produce 10% of its energy from RES in gross final consumption by 2020 [6,7]. Malta’s target is considerable, although it is lower than other European Countries, because Malta presents quite particular conditions, such as other Mediterranean islands: high population density, limited available land and an ever increasing electricity demand. In order to achieve the environmental and energetic targets [8], Malta will have to use all available renewable sources [9]. Moreover, Malta’s electrical grid needs several developments in order to minimize the electrical problems caused by varying power outputs of RES, such as wind, solar and sea wave [10]. The following Figure 1 shows the properties of the future grid. Every available RES will be used to produce electrical energy [11]. In order to match the electrical load and the electrical production by RES, new innovative storage systems have to be developed.
Among various RES, in the last years the wave energy source, thanks to its great potential, has sparked great interest, evidenced by several prototypes and researches [12]. This work analyses the wave energy source along Malta’s coasts, which can be exploited to produce electrical energy using an innovative Point Absorber, which directly converts the mechanical energy of sea wave into electrical output, minimizing the energetic conversion losses [13]. This system is based on a new linear generator prototype realized by Department of Energy of University of Palermo (Italy).
In particular, Section 2 of this paper reports some geographical and climate data about Malta’s archipelago. Section 3 analyzes the electrical energy demand in Malta during the last years. Section 4 describes the sea wave energy potential along Maltese coasts. Section 5 describes an energy converter, designed and developed by Palermo University, able to exploit wave and solar sources at the same time. Finally, Section 6 proposes an energetic scenario based on the energy converter of Palermo University, evaluating the annual electrical production and the avoided CO2 emissions.

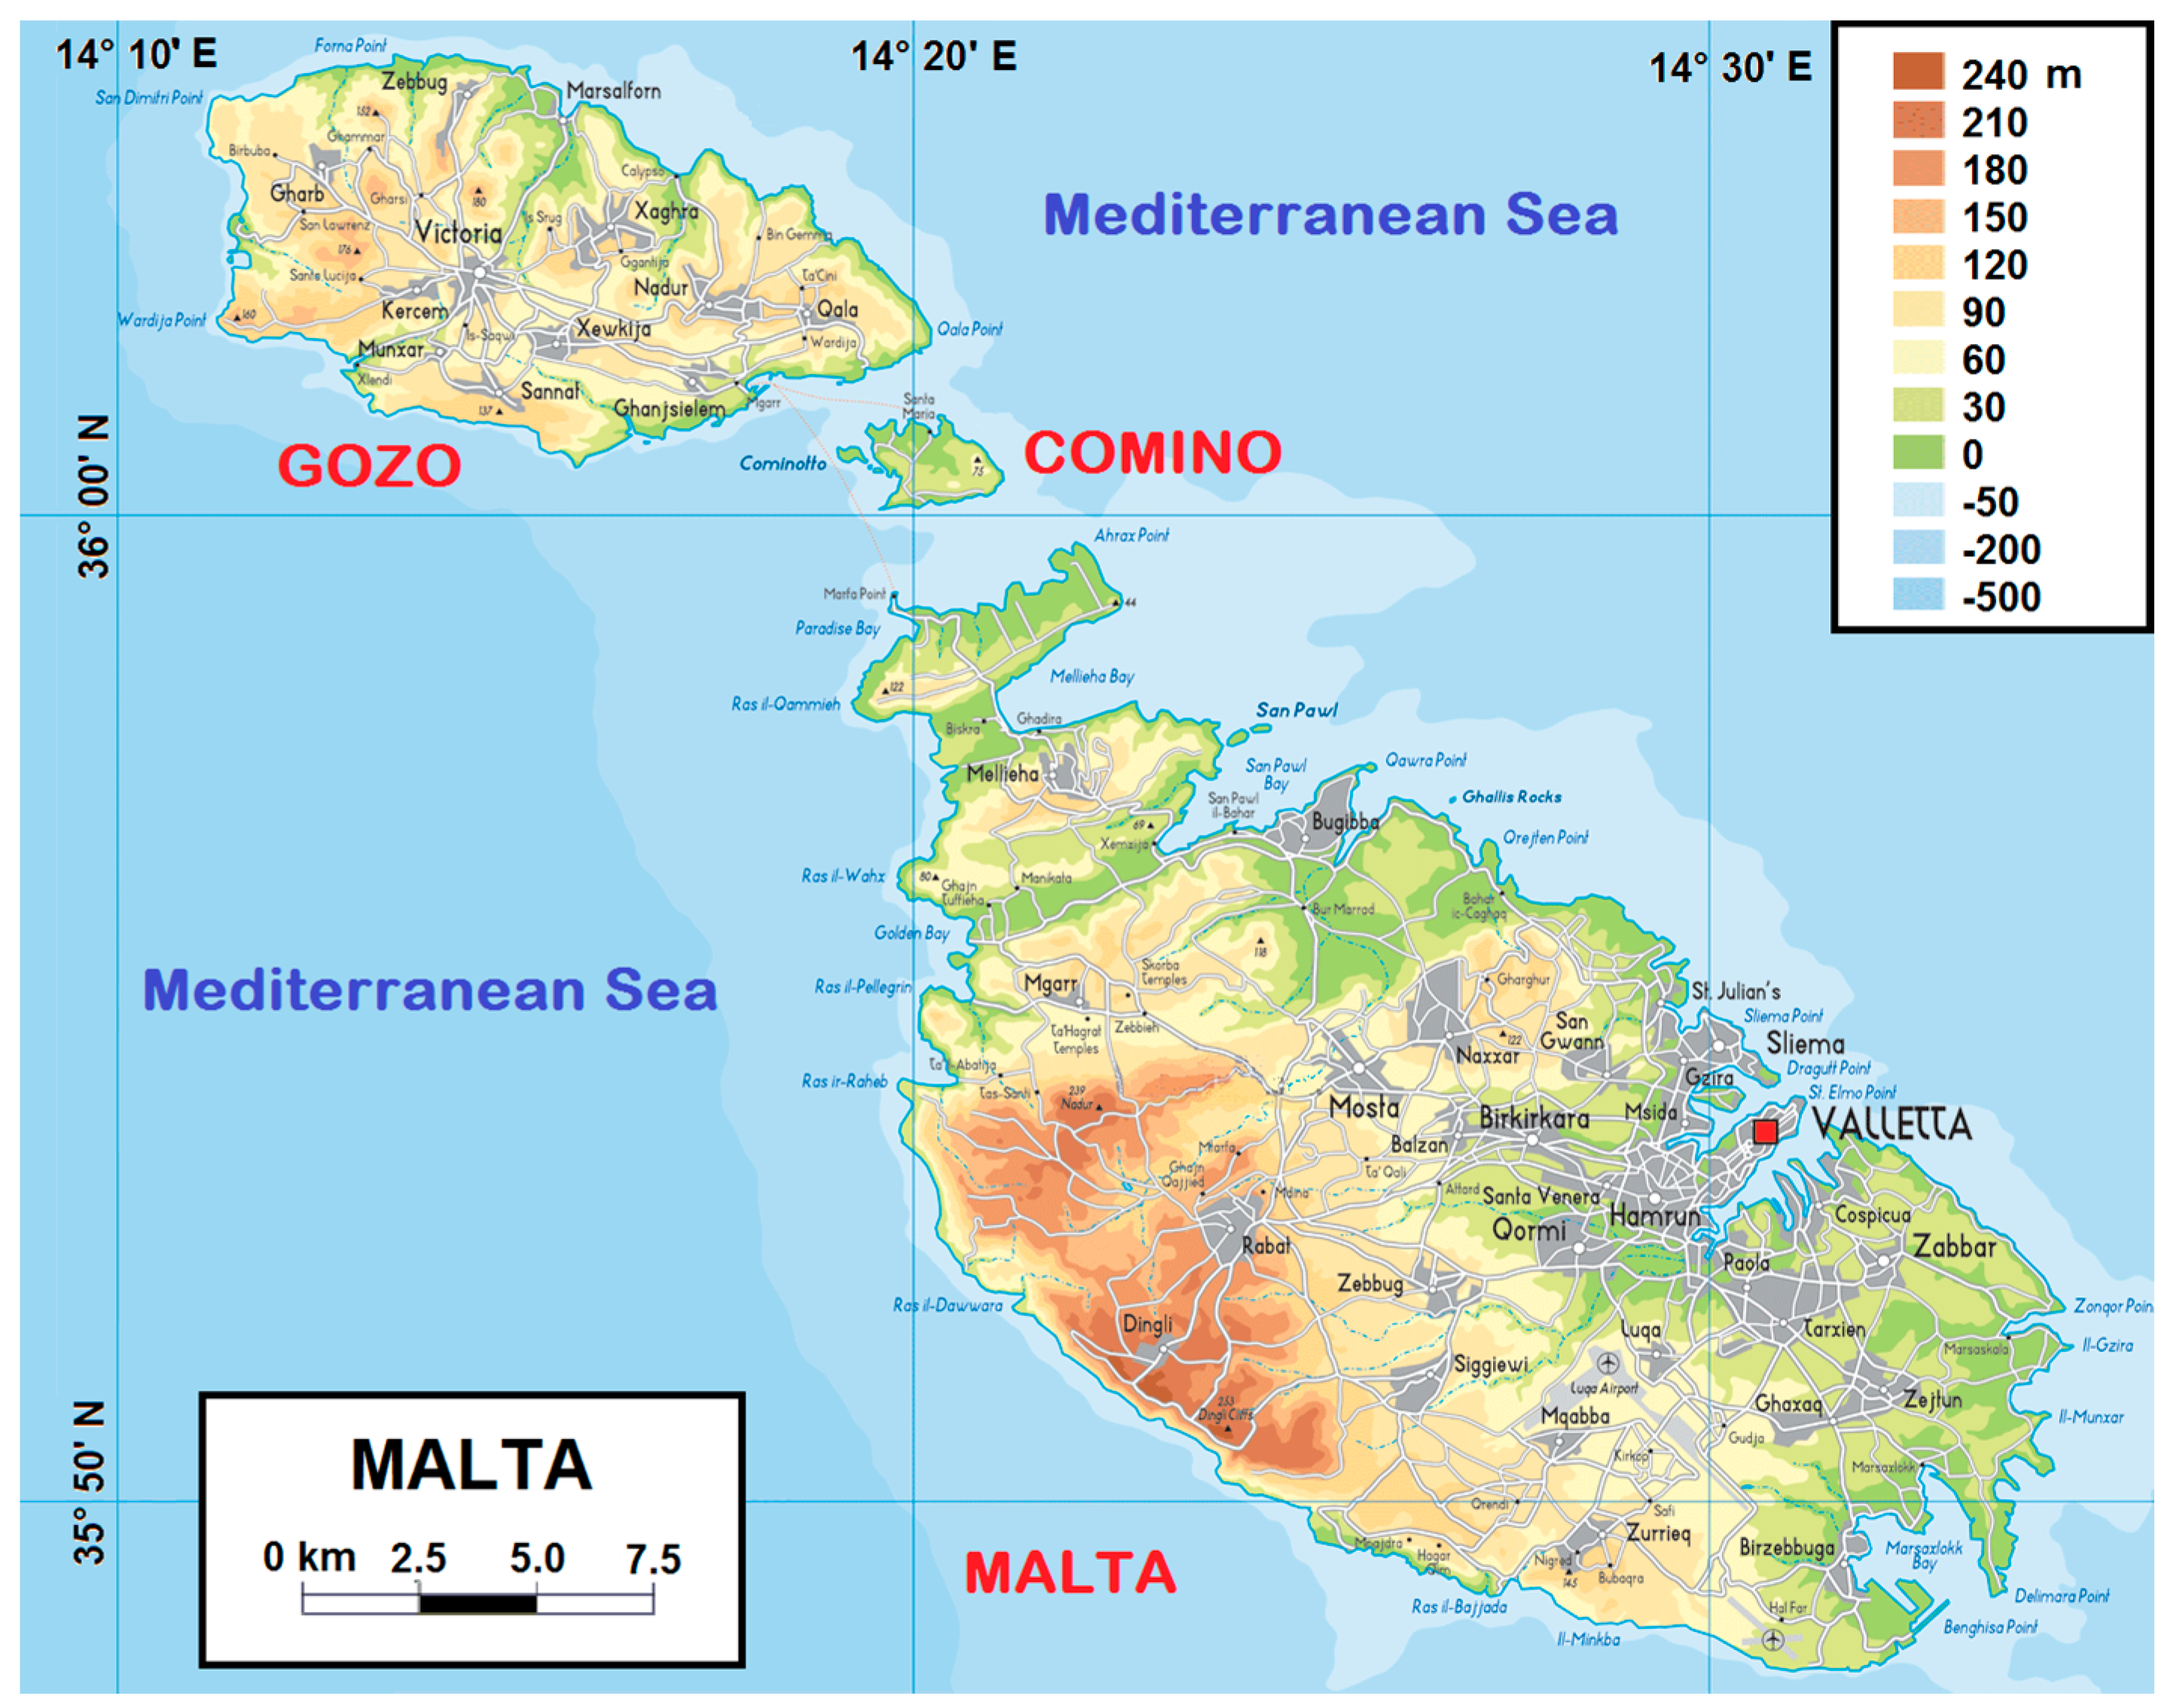
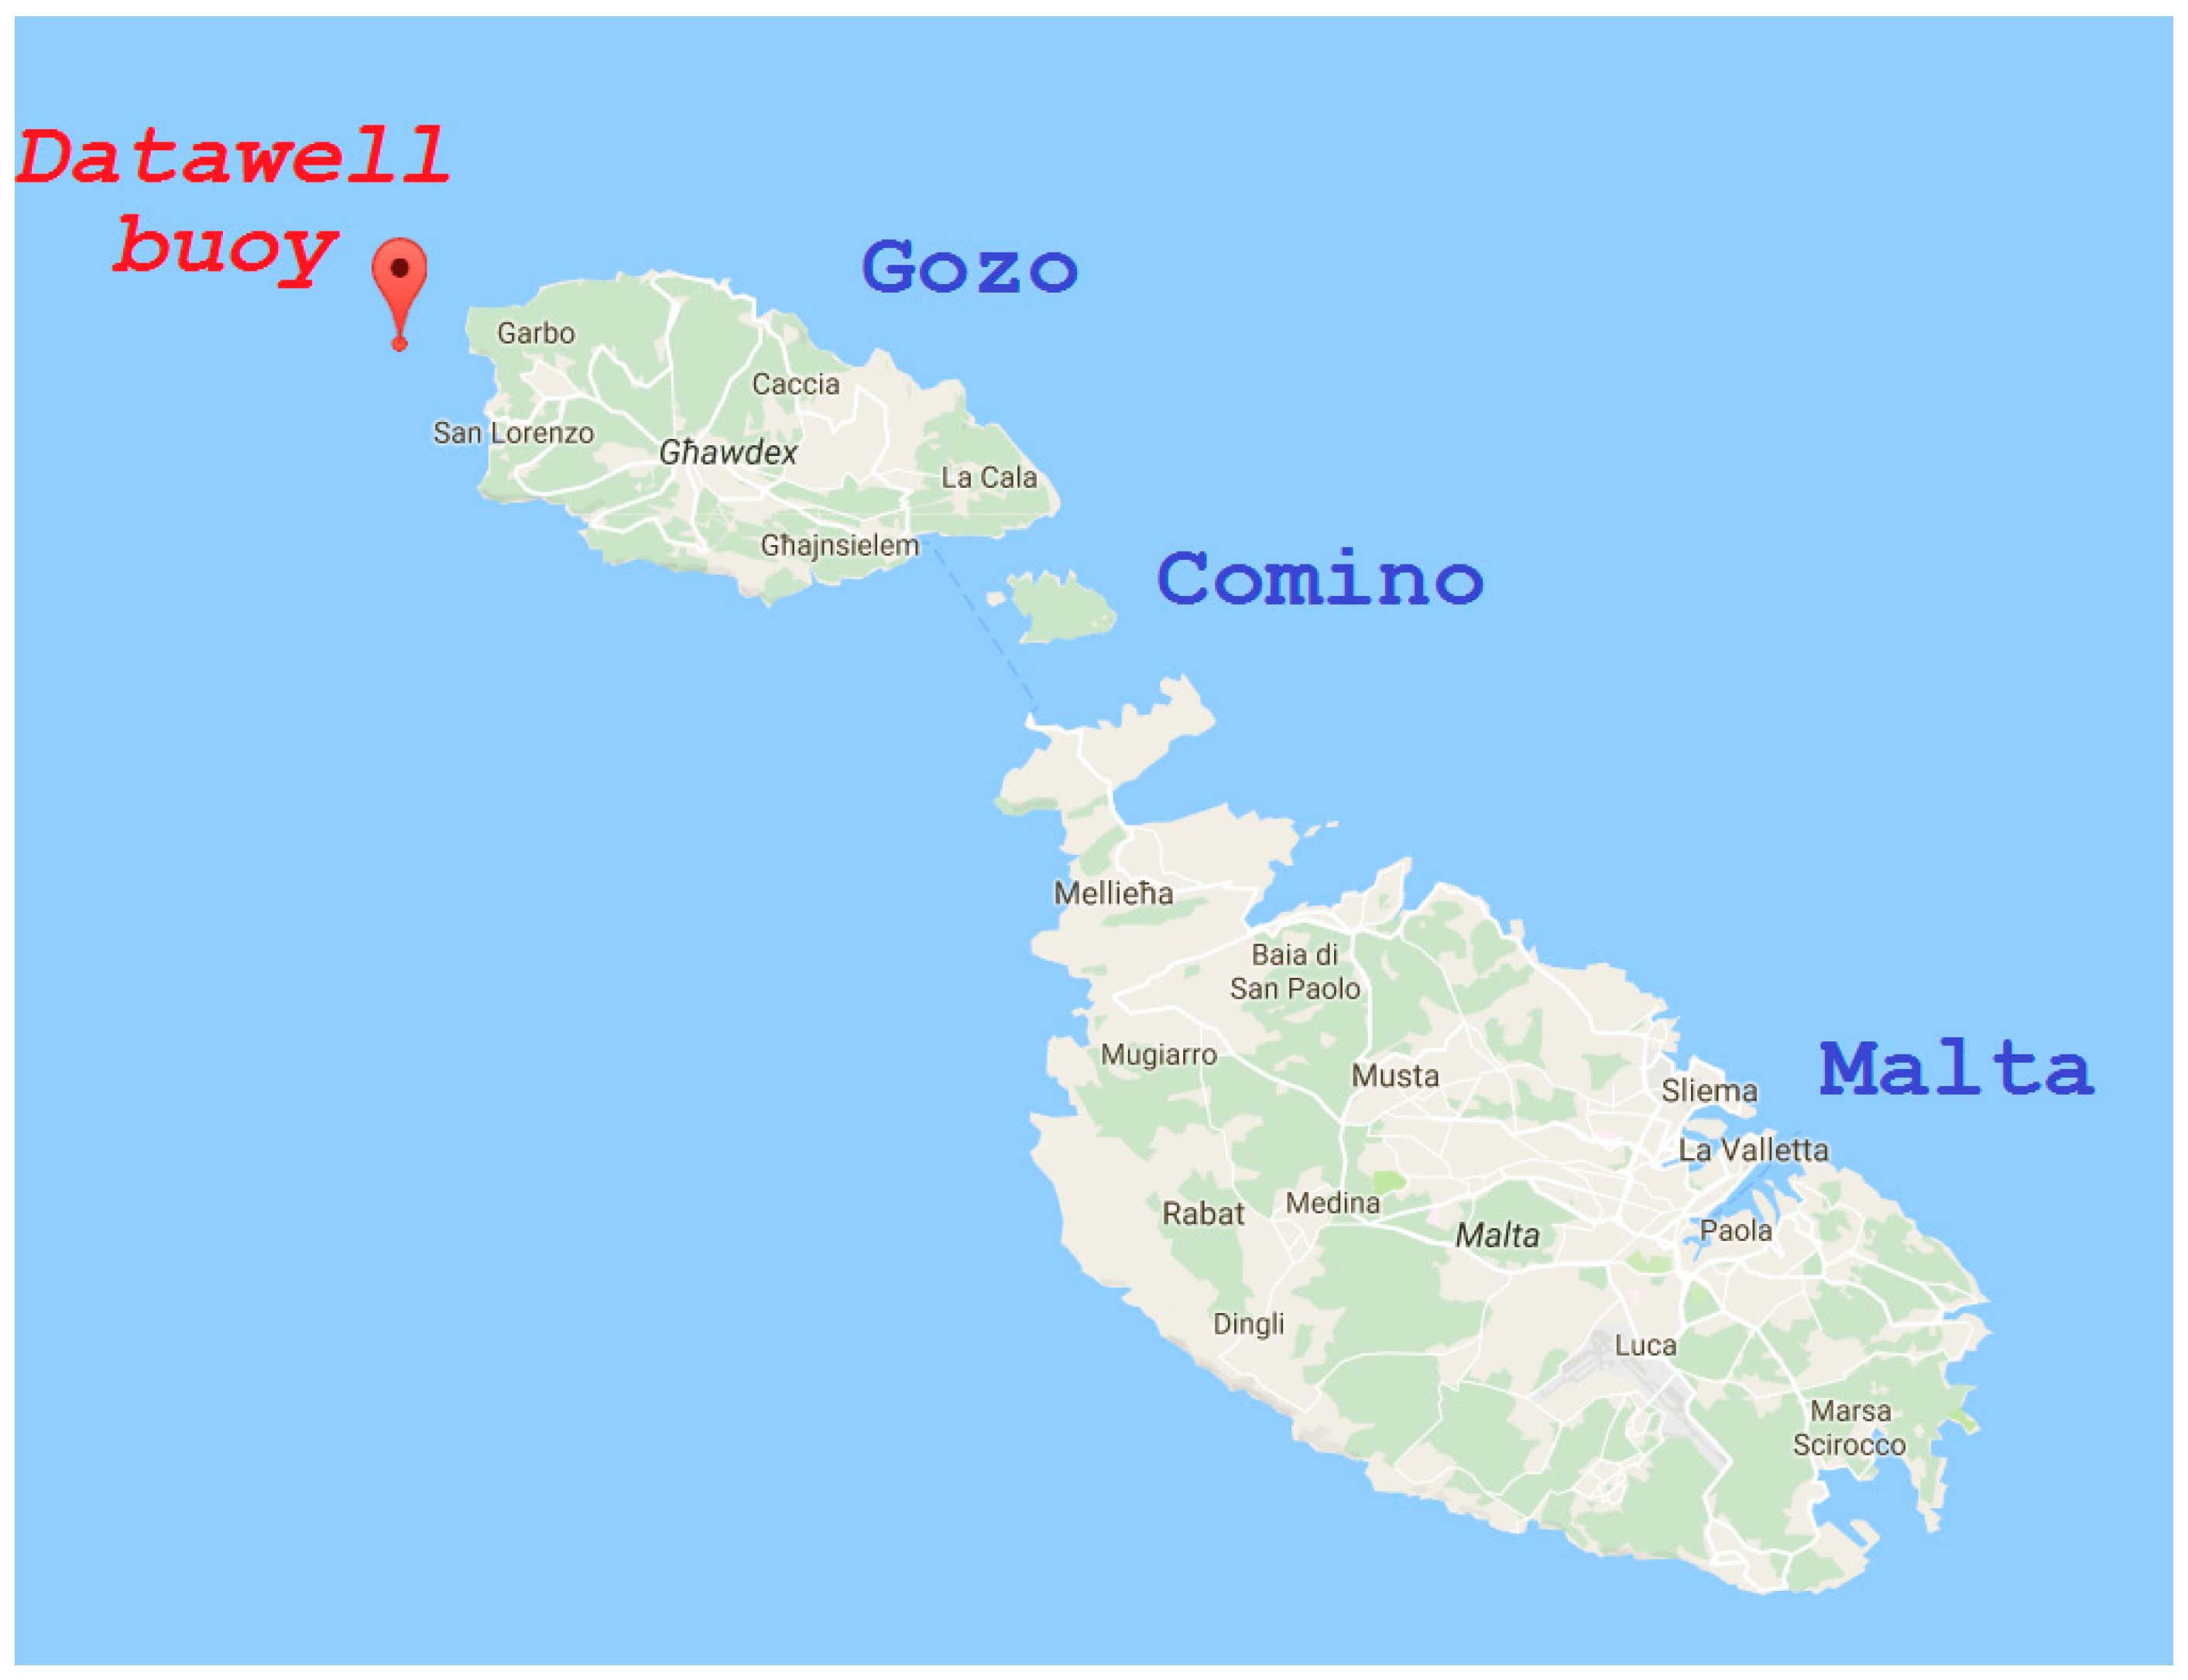
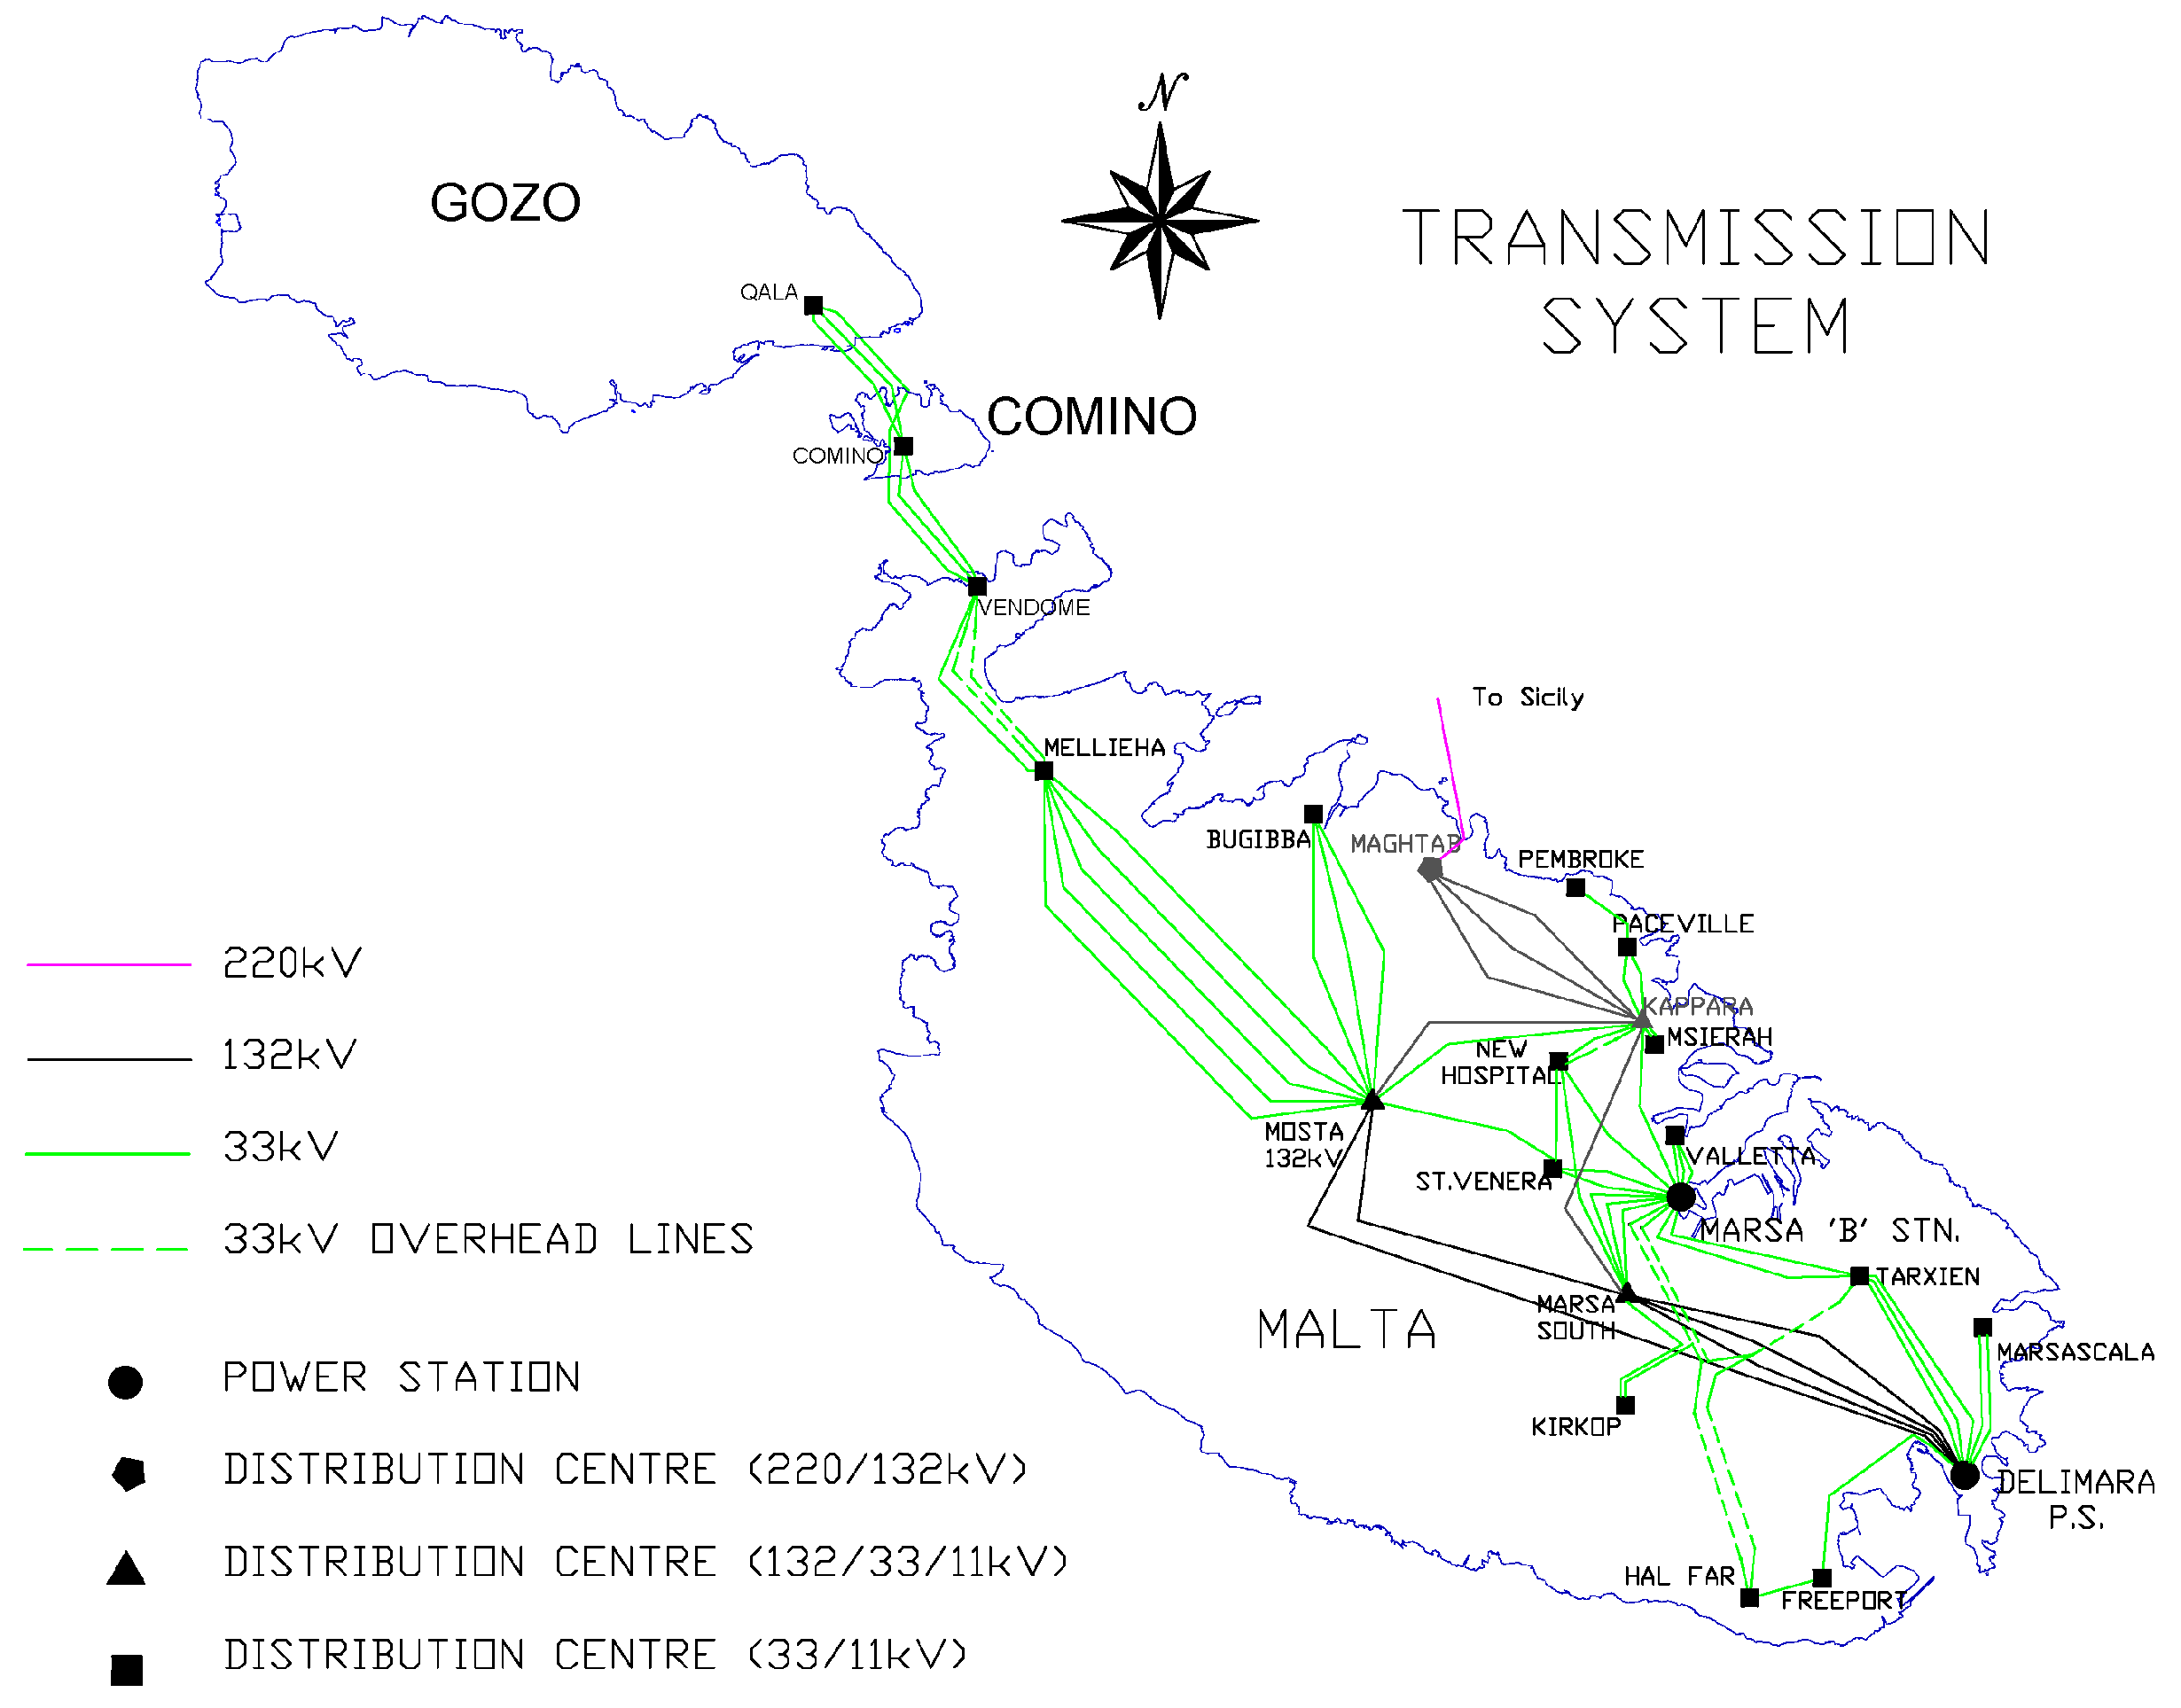
2. Maltese Archipelago

Malta’s Country is an archipelago, located in the middle of the Mediterranean Sea. It is situated at 80 km south of Sicily, 284 km east of Tunisia and 333 km north of Libya. The capital city is Valletta, with the geographical coordinates 35°53’ N–14°35’ E. It is situated in the largest island (called also Malta) of the archipelago, as shown in Figure 2.
Malta covers an overall area of 316 km2, so it is one of the smallest European Countries. The Maltese Archipelago is characterized by a high population density (1318 in./km2, 2012). The main island (Malta) has a population of about 368,250 inhabitants (2012), while the total population is about 416,515 inhabitants (2012). The Maltese Archipelago is composed by several islands, but only the biggest three of them are populated: Malta Island (245.8 km2), Gozo (67.1 km2) and Comino (2.8 km2), as shown in Figure 2. The archipelago includes also 18 uninhabited smaller islands. There are numerous bays along the indented coastline of the islands.
Malta’s islands are mainly rocky, with terraced fields, dry vegetation, rock and limestone. In the Maltese Archipelago, permanent rivers or lakes are absent; during autumn and winter, rains form torrents. The annual rainfall in Malta is low, about 578 mm per year. In order to overcome the limited availability of water in the inhabited islands of Malta, six desalination plants are installed, two of which are always on.
Due to its latitude and the central location in the Mediterranean Sea, Malta has a Subtropical Mediterranean climate with very mild winters and warm summers. The average yearly temperature is around 23 °C during the day and 16 °C in the night. January is the coldest month of the year, while August is the hottest. The average annual temperature of the sea is 20 °C, ranging from 15 to 16 °C in February to 26 °C in August. Winters in Malta are usually mild, but during the winter months it tends to get windy from wind blowing from the north-east and with a main maximum speed about 80 km/h [14]. Concerning the solar radiation, in Malta there are about 3000 sunlight hours per year, with a minimum daily average of 5.2 h in December to a maximum daily average of 12 h in July [15].

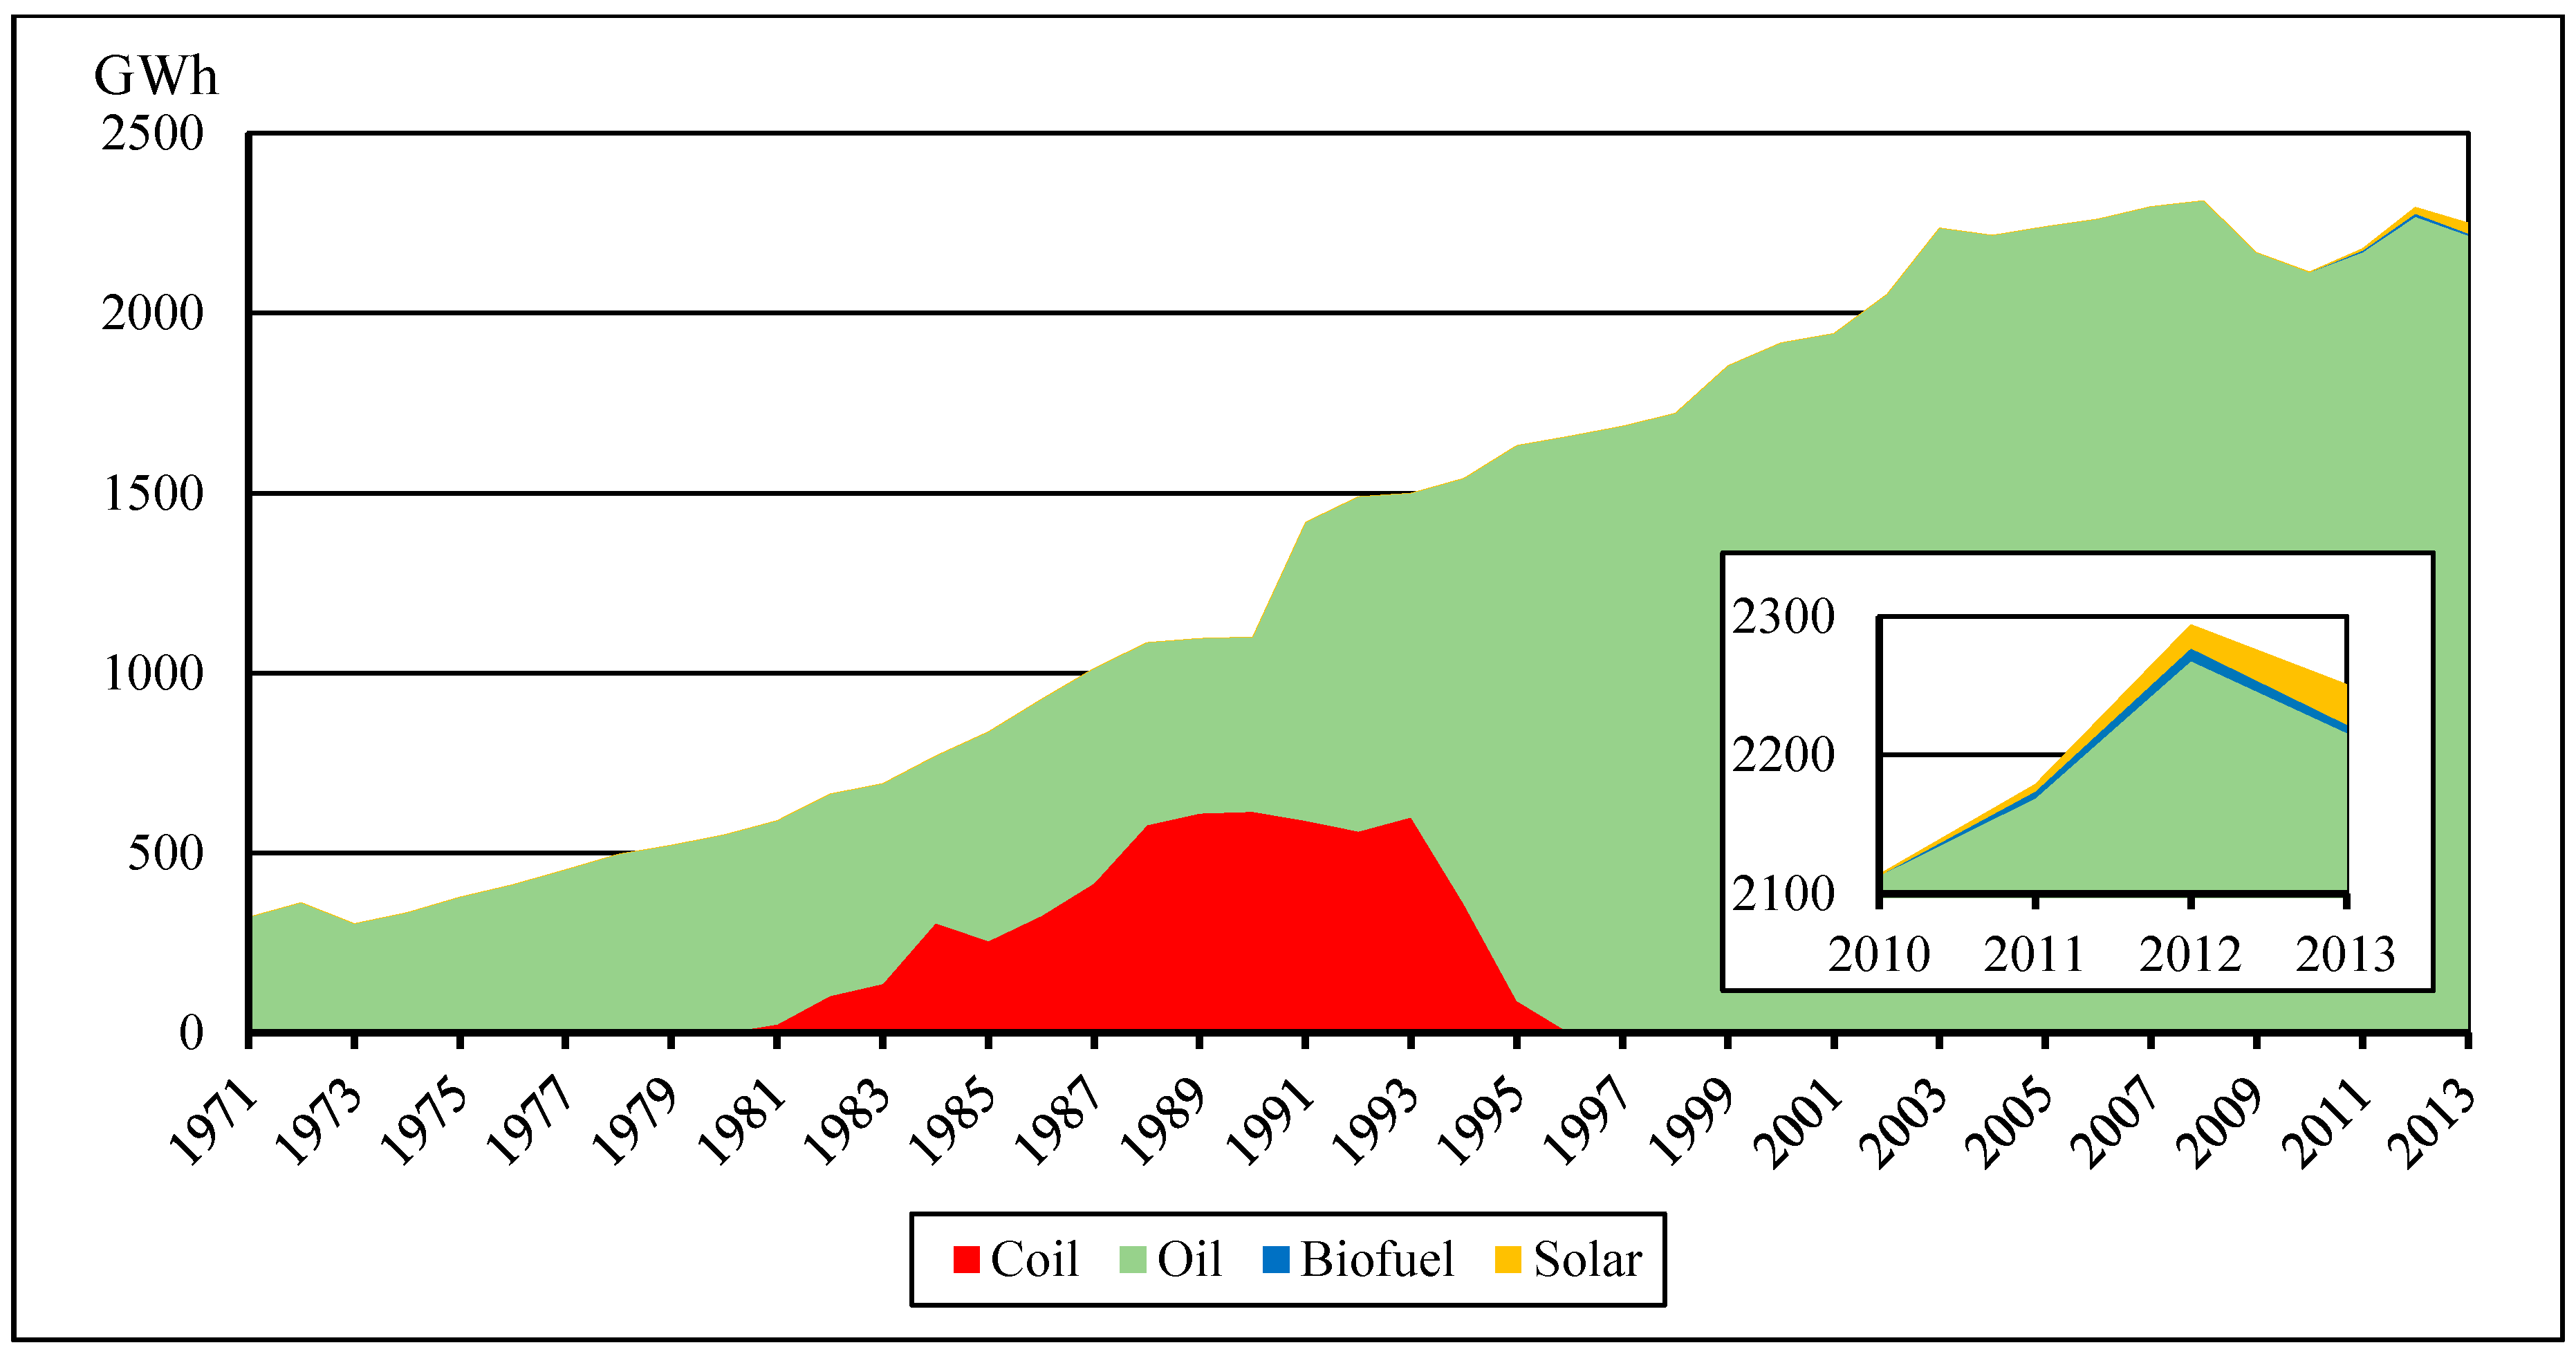
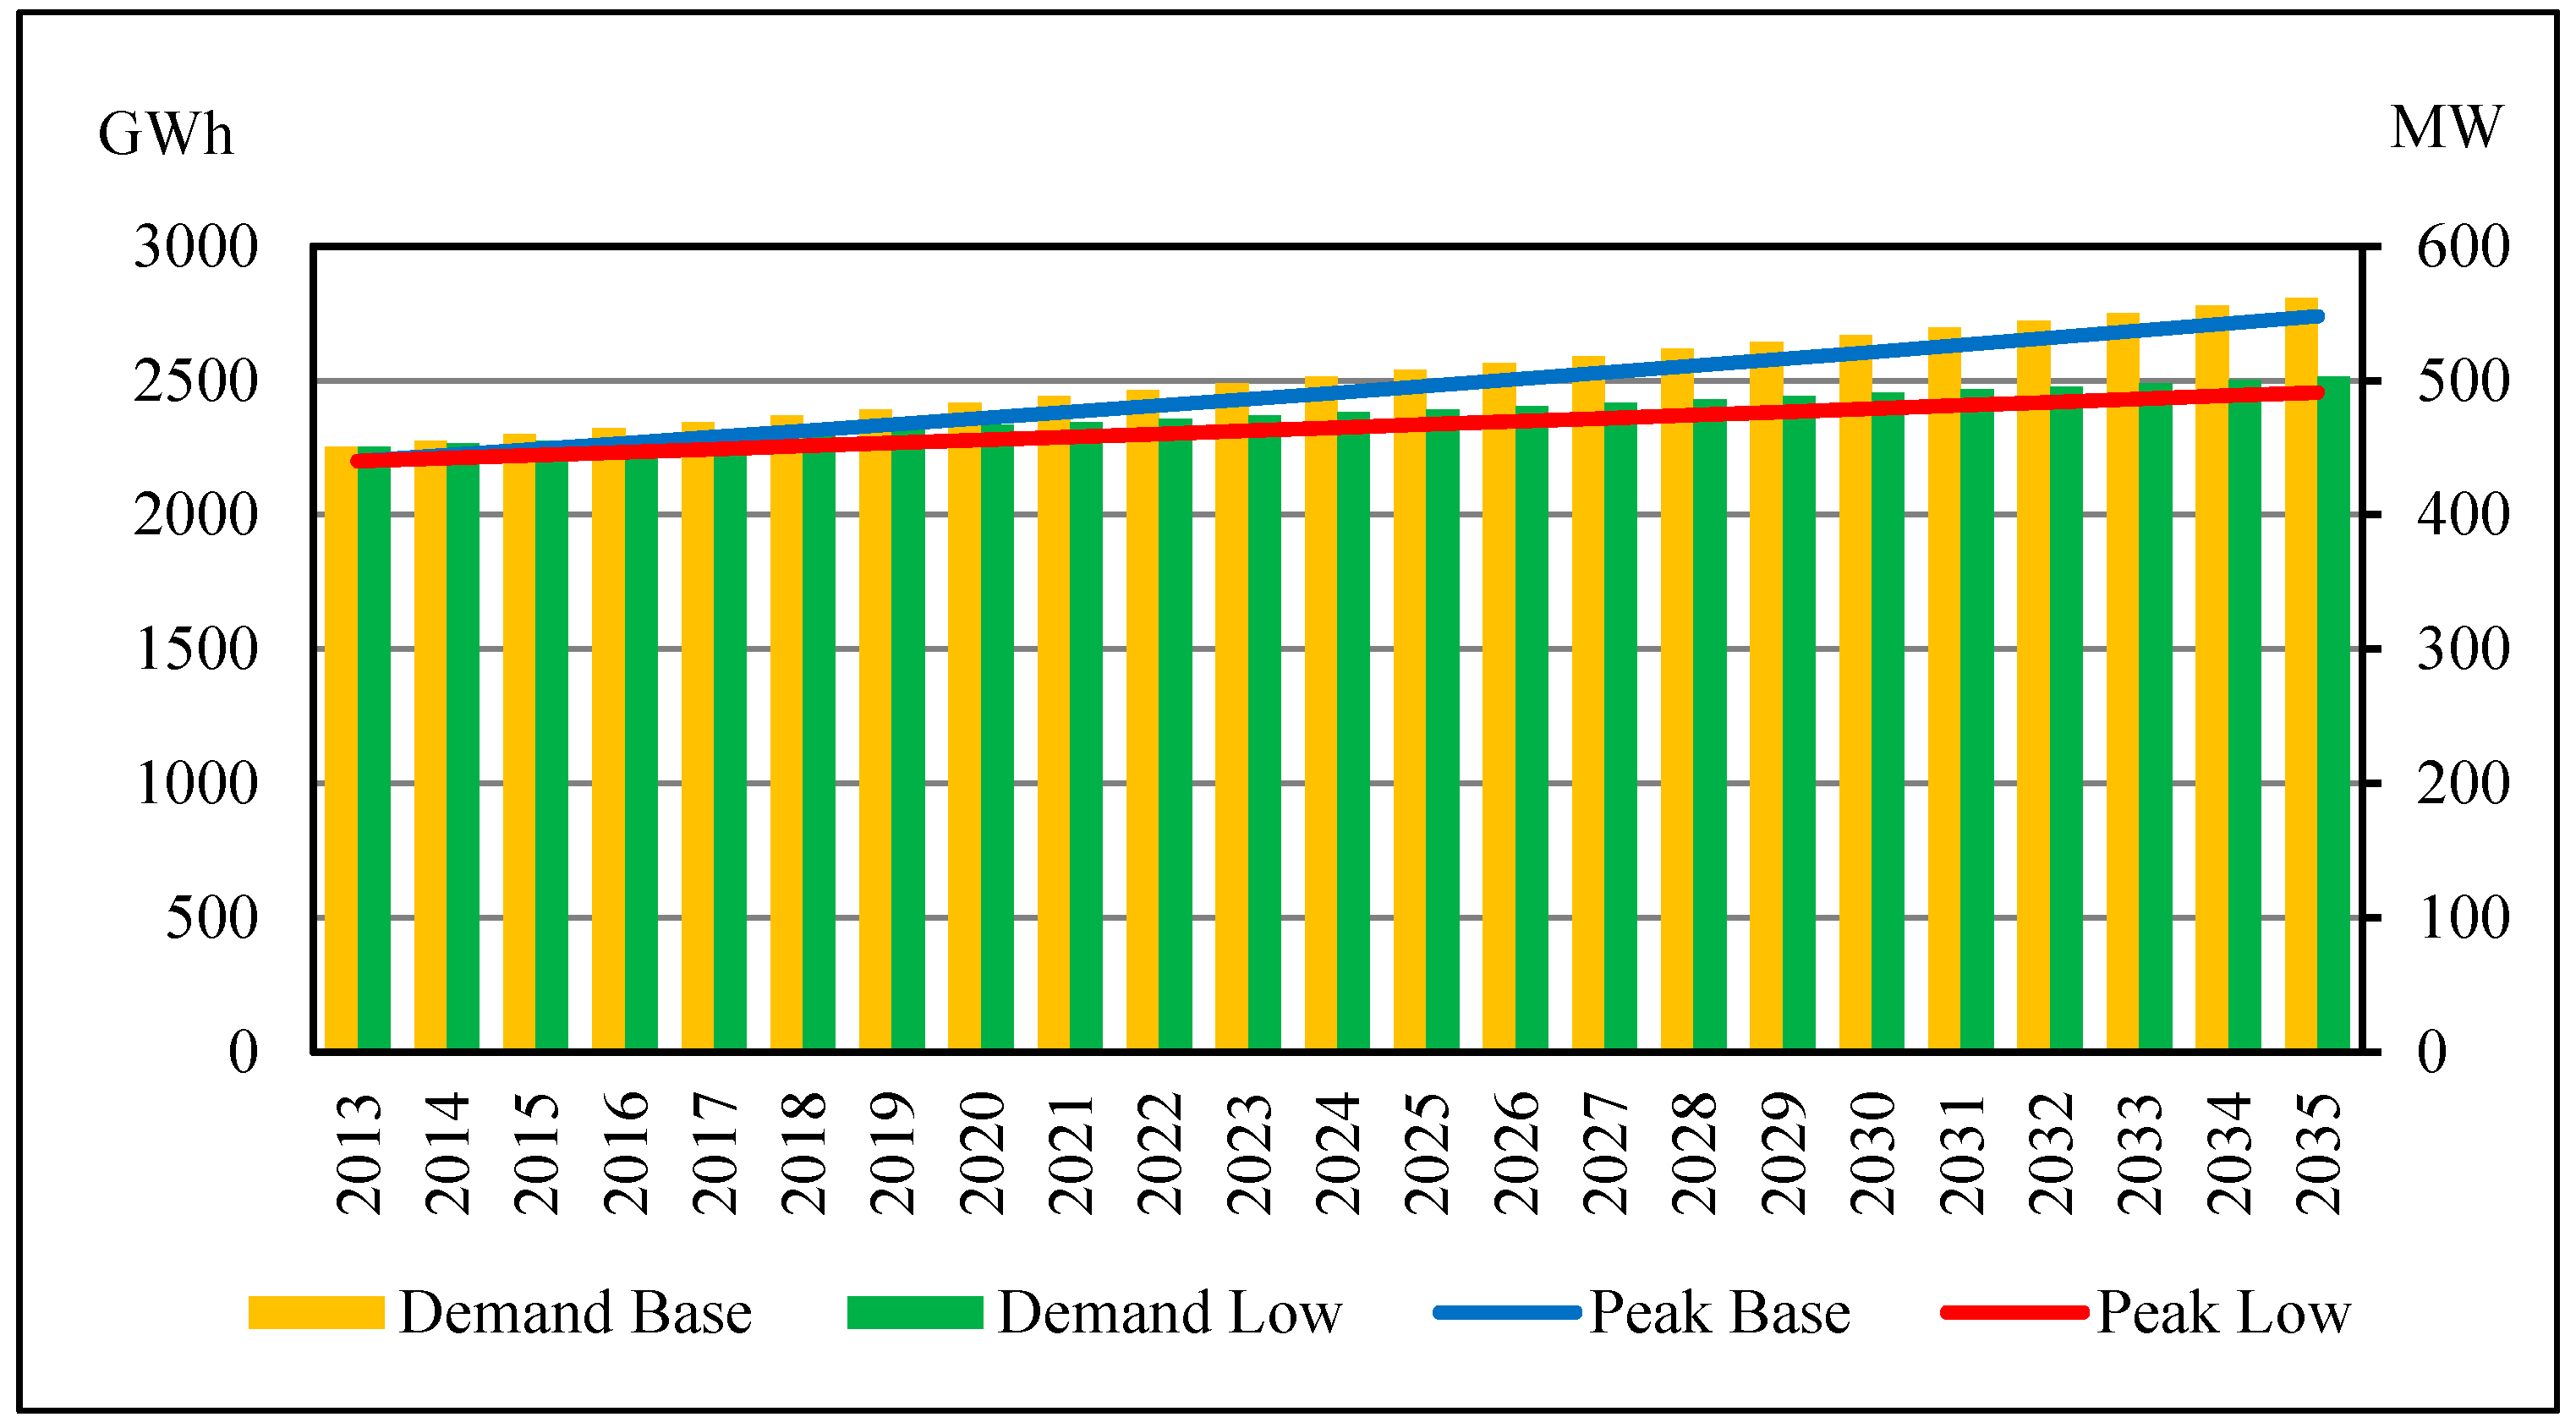
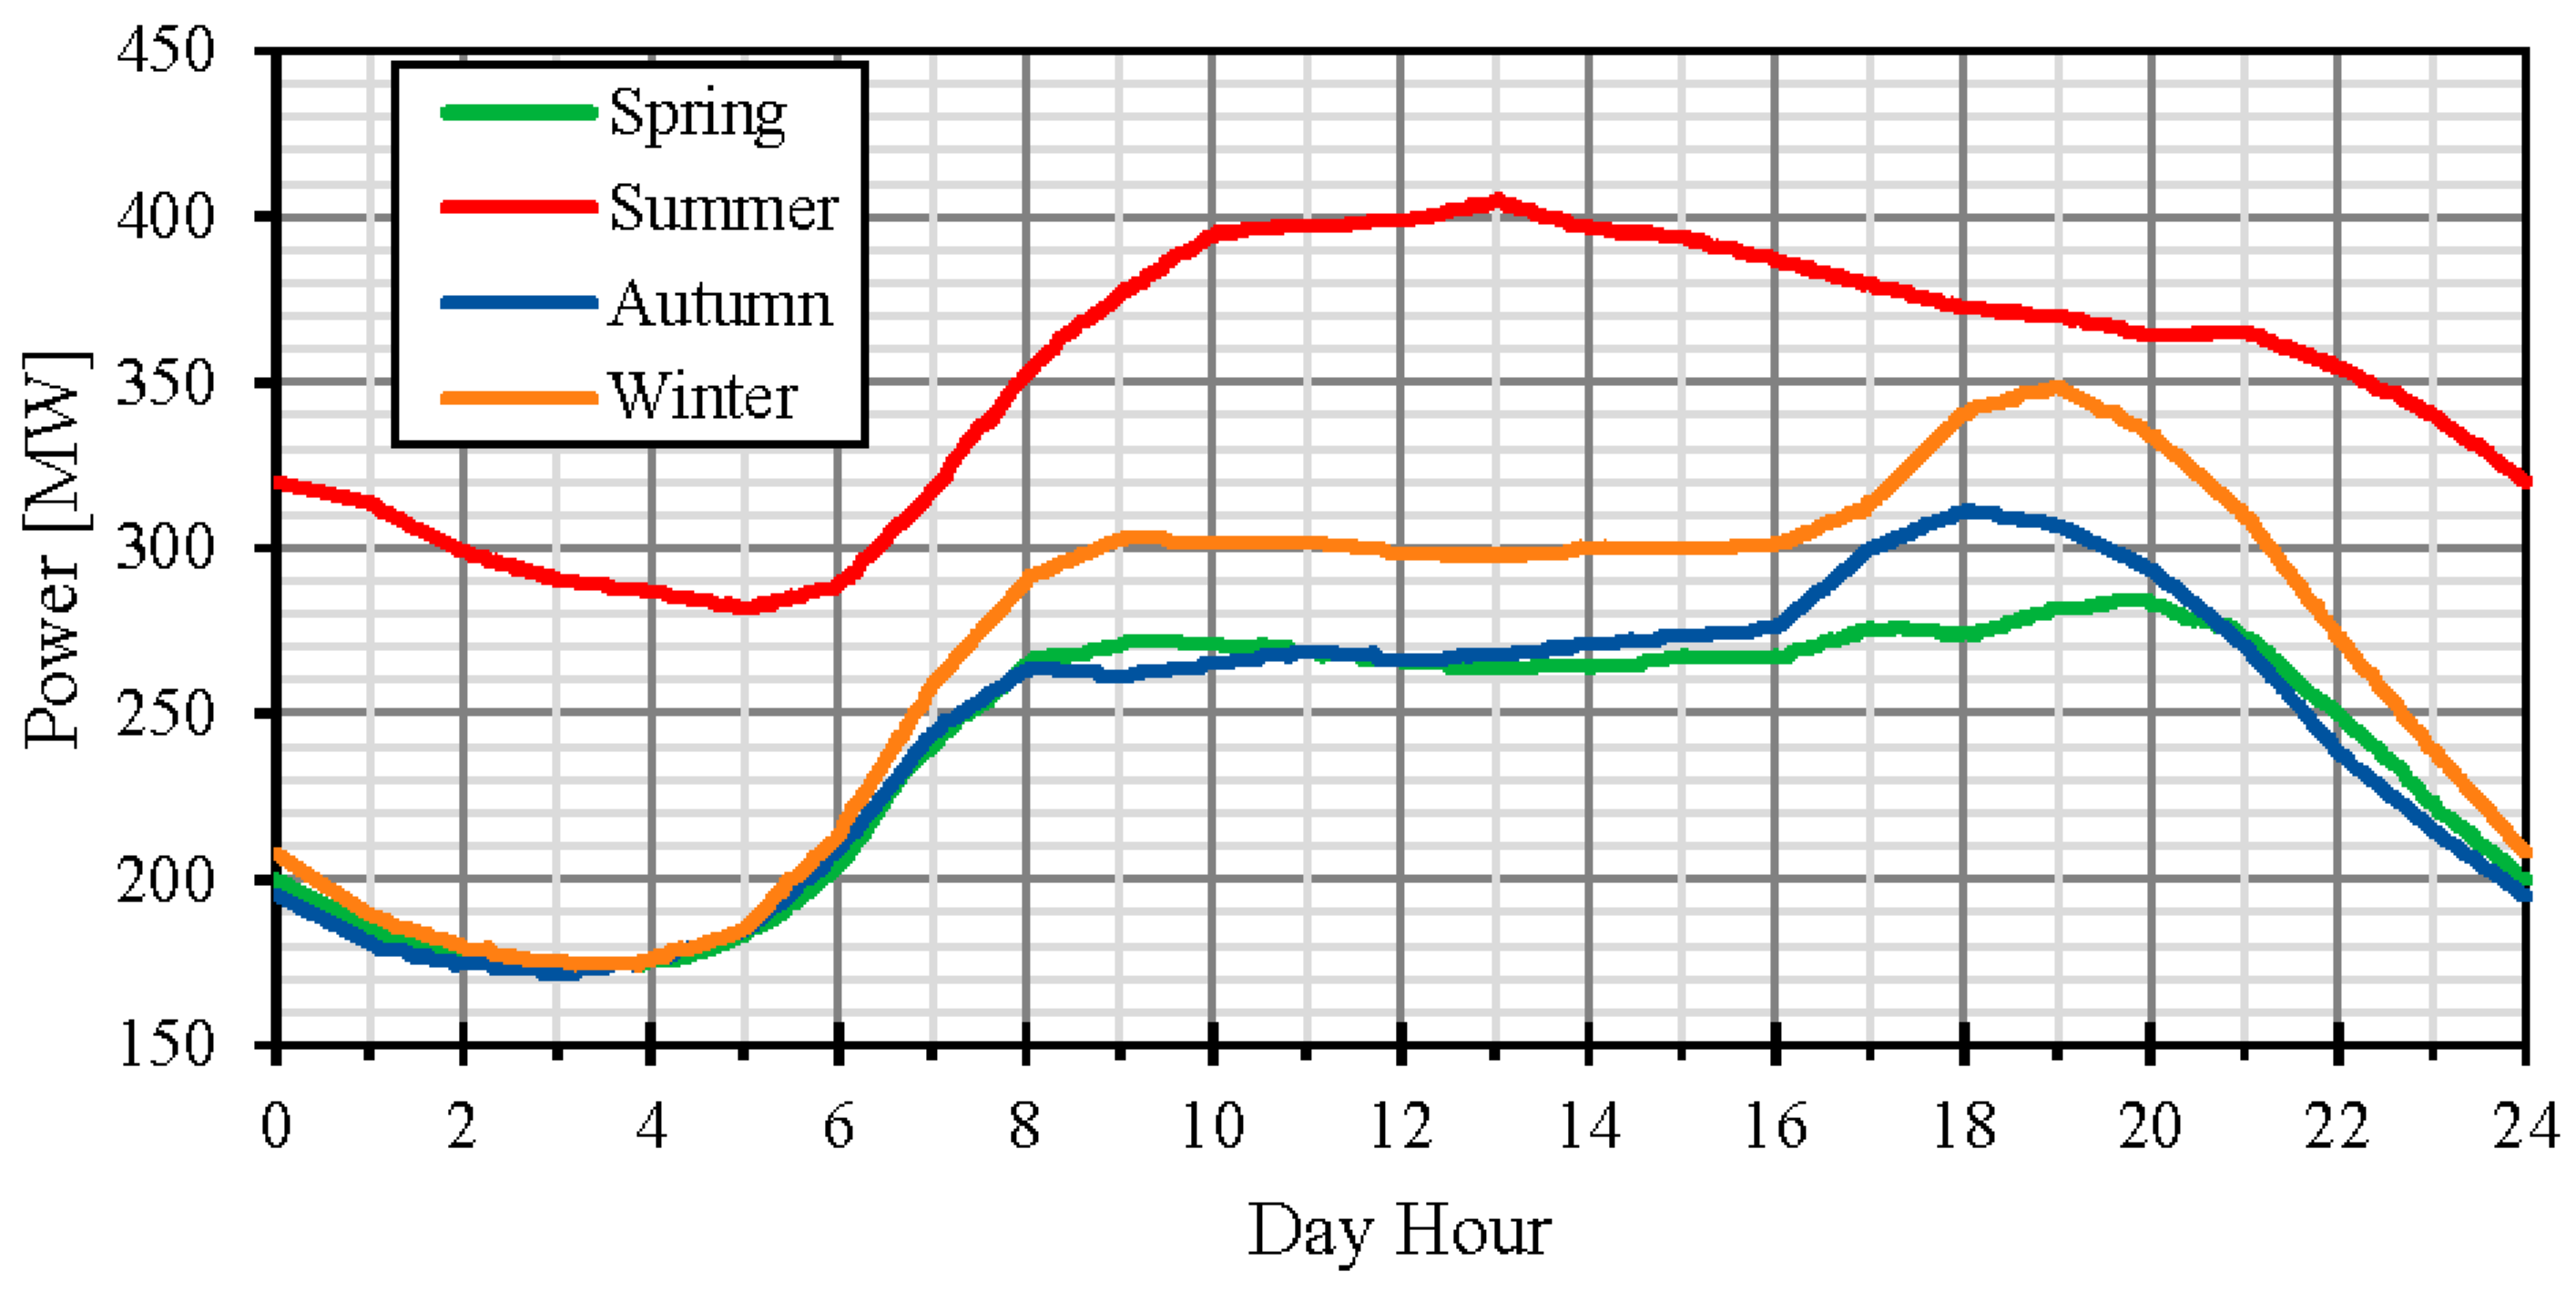
3. Electrical Energy Production in Malta

In Malta’s archipelago, the electrical power production is almost completely based on fossil fuel power plants. For example, in 2005, 100% of electricity was generated from oil [16] and, in the same year, transport fuel was fully of petroleum origin. Furthermore, in Malta’s archipelago, fossil fuel resources, such as oil, coal or natural gas, are totally absent, so all these resources must be imported from other countries, which are often characterized by geopolitical instability. Therefore, the purchase of fossil fuels represents the most relevant import element for Malta.
Maltese fossil-fuel power plants are property of Enemalta Corporation (EMC). Electrical energy is mainly generated at the Delimara Power Station (with an installed power of 444 MW), located in the south-east part of Malta’s Island. The power station is composed by conventional steam turbines (2 × 60 MW), an open cycle gas turbine (2 × 35 MW), one combined cycle plant (110 MW) and eight Wartsilla 18V46 four-stroke medium speed diesel engines (operating in a combined cycle with one steam turbine, with an overall power of 144 MW) [17]. In the past, another important plant was installed at Marsa (with an installed power of 155 MW), but nowadays it is in decommissioning stage [17]. Therefore, in the past, the total traditional installed capacity was about 599 MW, but nowadays is only 444 MW, concentrated in Delimara power station. The renewable power plants capacity does not exceed 14 MW [18].
In order to overcome the growing demand of electrical energy, the Malta–Italy Interconnector was inaugurated in April 2015, connecting the Italian station located in Ragusa (Sicily) to the Maltese station, located in Malta at Qalet Marku, Baharic-Caghaq. This Interconnector comprises a 120-km high voltage (220 kV) alternating current system, capable of bidirectional flow of electrical power, transferring 200 MW of electricity [17].
The electrical distribution grid in Malta operates with four voltage levels: 132 kV, 33 kV, 11 kV and 400/230 V. The frequency is fixed to 50 Hz, as the European electrical grid. Figure 3 shows the electric grid of the Maltese Archipelago.
In Figure 4, electrical energy generation by fuel in Malta is shown, during the period 1971–2013. This trend is characterized by an important increase, from about 300 GWh/year in 1971 to 2254 GWh/year in 2013, during which 2216 GWh/year was produced from oil plants, 6 GWh/year from biofuels and 32 GWh/year from photovoltaic plants [19]. Therefore, renewable energy production has a marginal role in comparison to the other European countries.
Figure 5 shows the typical electrical load profile in Malta’s archipelago during the four seasons (2012) [20]. The graph shows a significant increase of electrical demand during summer, due to tourists’ arrivals: the minimum power request in summer is close to the maximum request during spring or autumn. The peak of request is placed between 4 p.m. and 8 p.m. for most of the year. In summer, the peak of request is shifted to 1 p.m.
The great difference in electricity consumption between summer and other seasons is largely due to the buildings conditioning: in fact, during the summer, the building cooling is almost exclusively realized by using air-to-air heat pumps; in winter, instead, the building heating is essentially realized by using fossil fuel boilers and marginally heat pumps and electric heaters [20].
Finally, Figure 6 shows the electrical demand measured by Enemalta, during the year 2012 [20]. The graph confirms the presence of significant fluctuations in electrical load, during the days and year. It also shows a significant reduction in demand at the weekends.

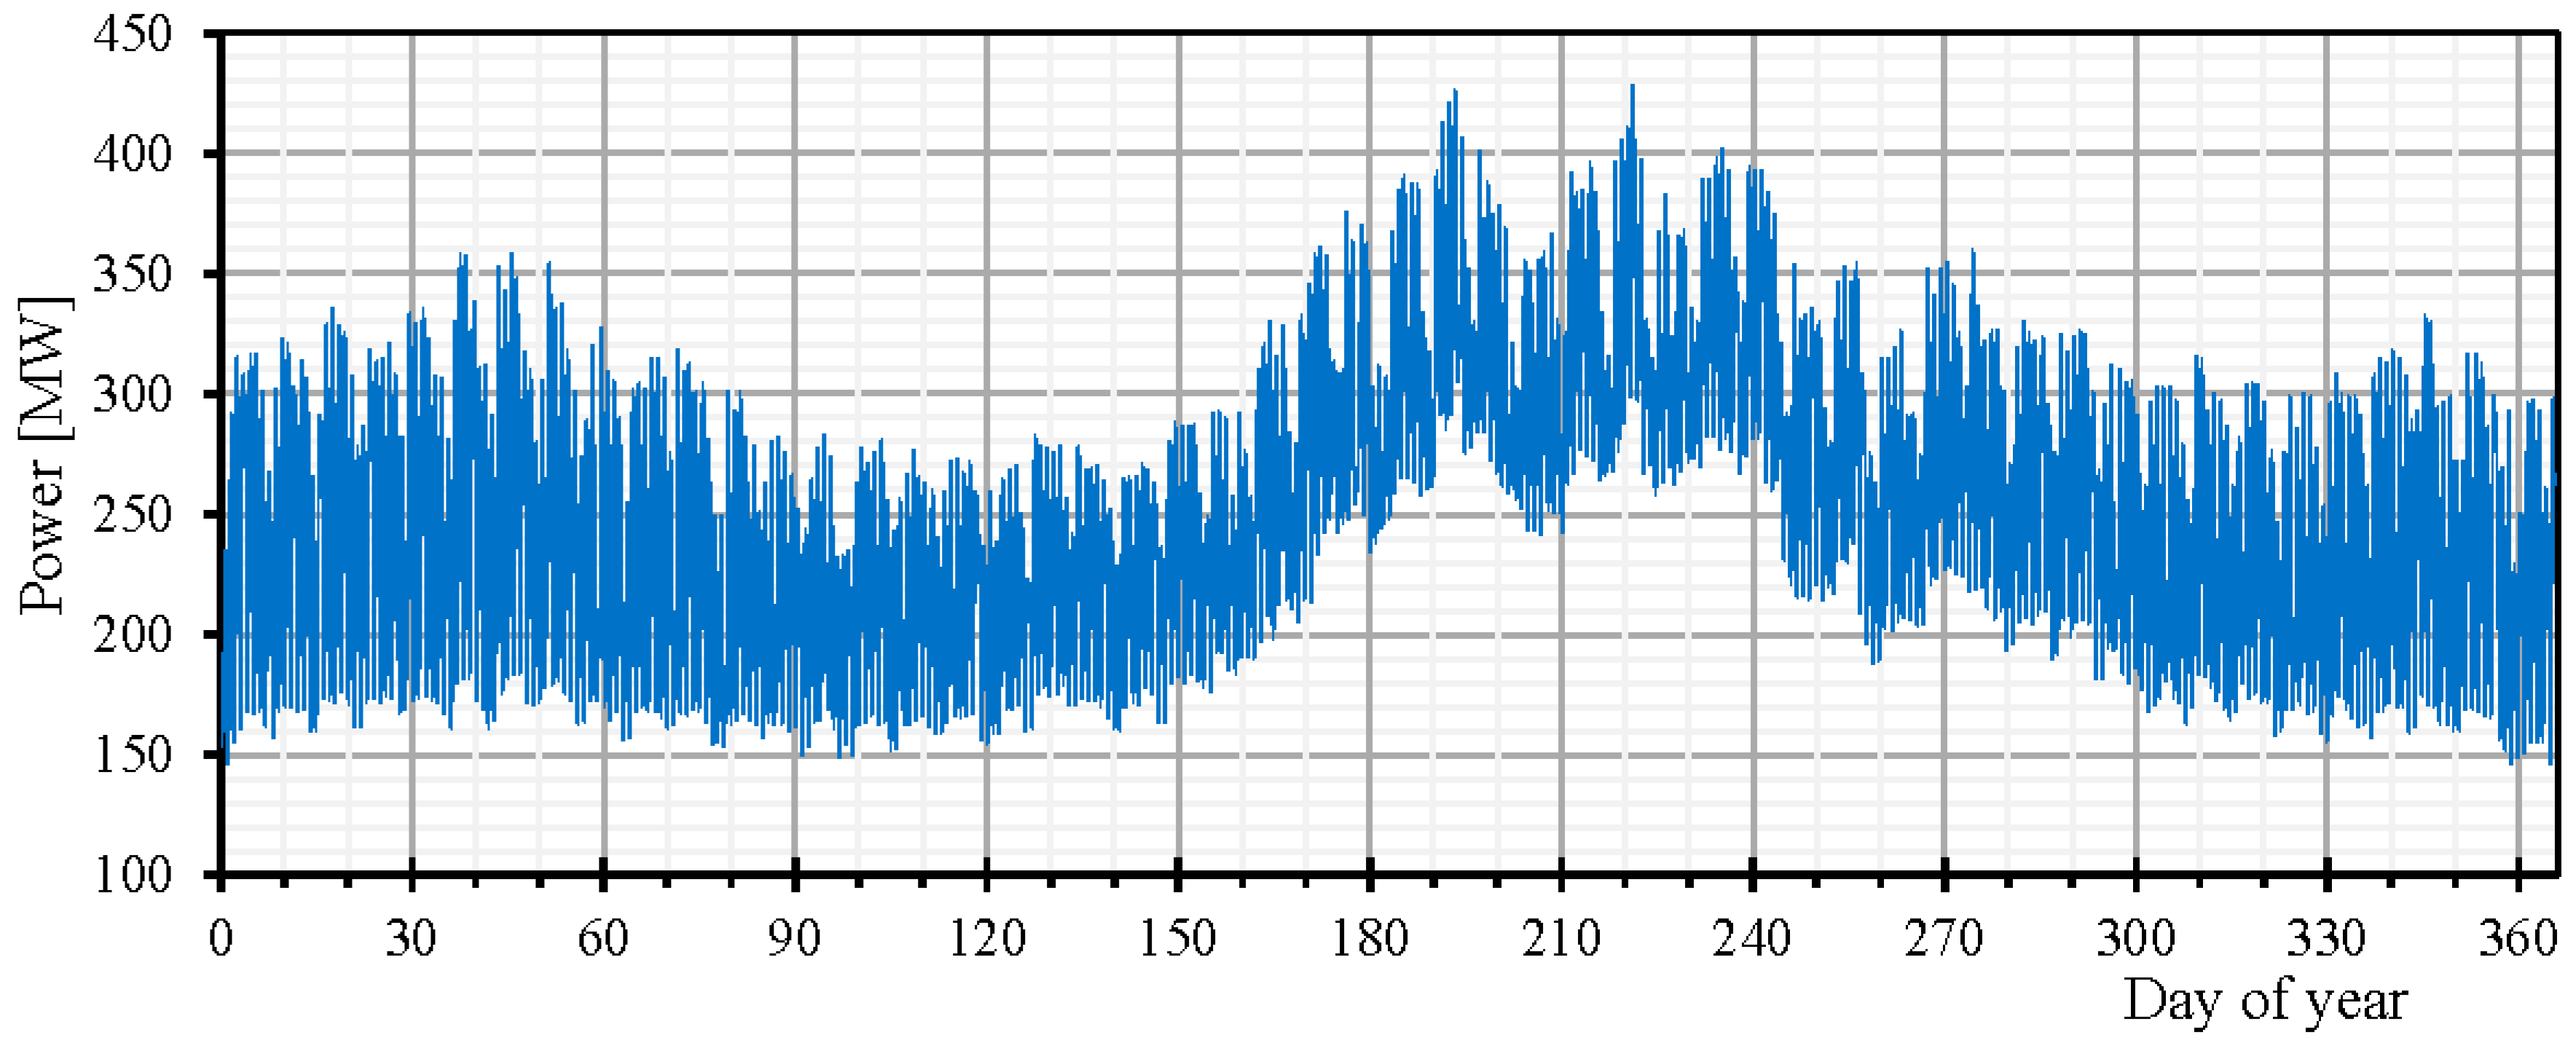
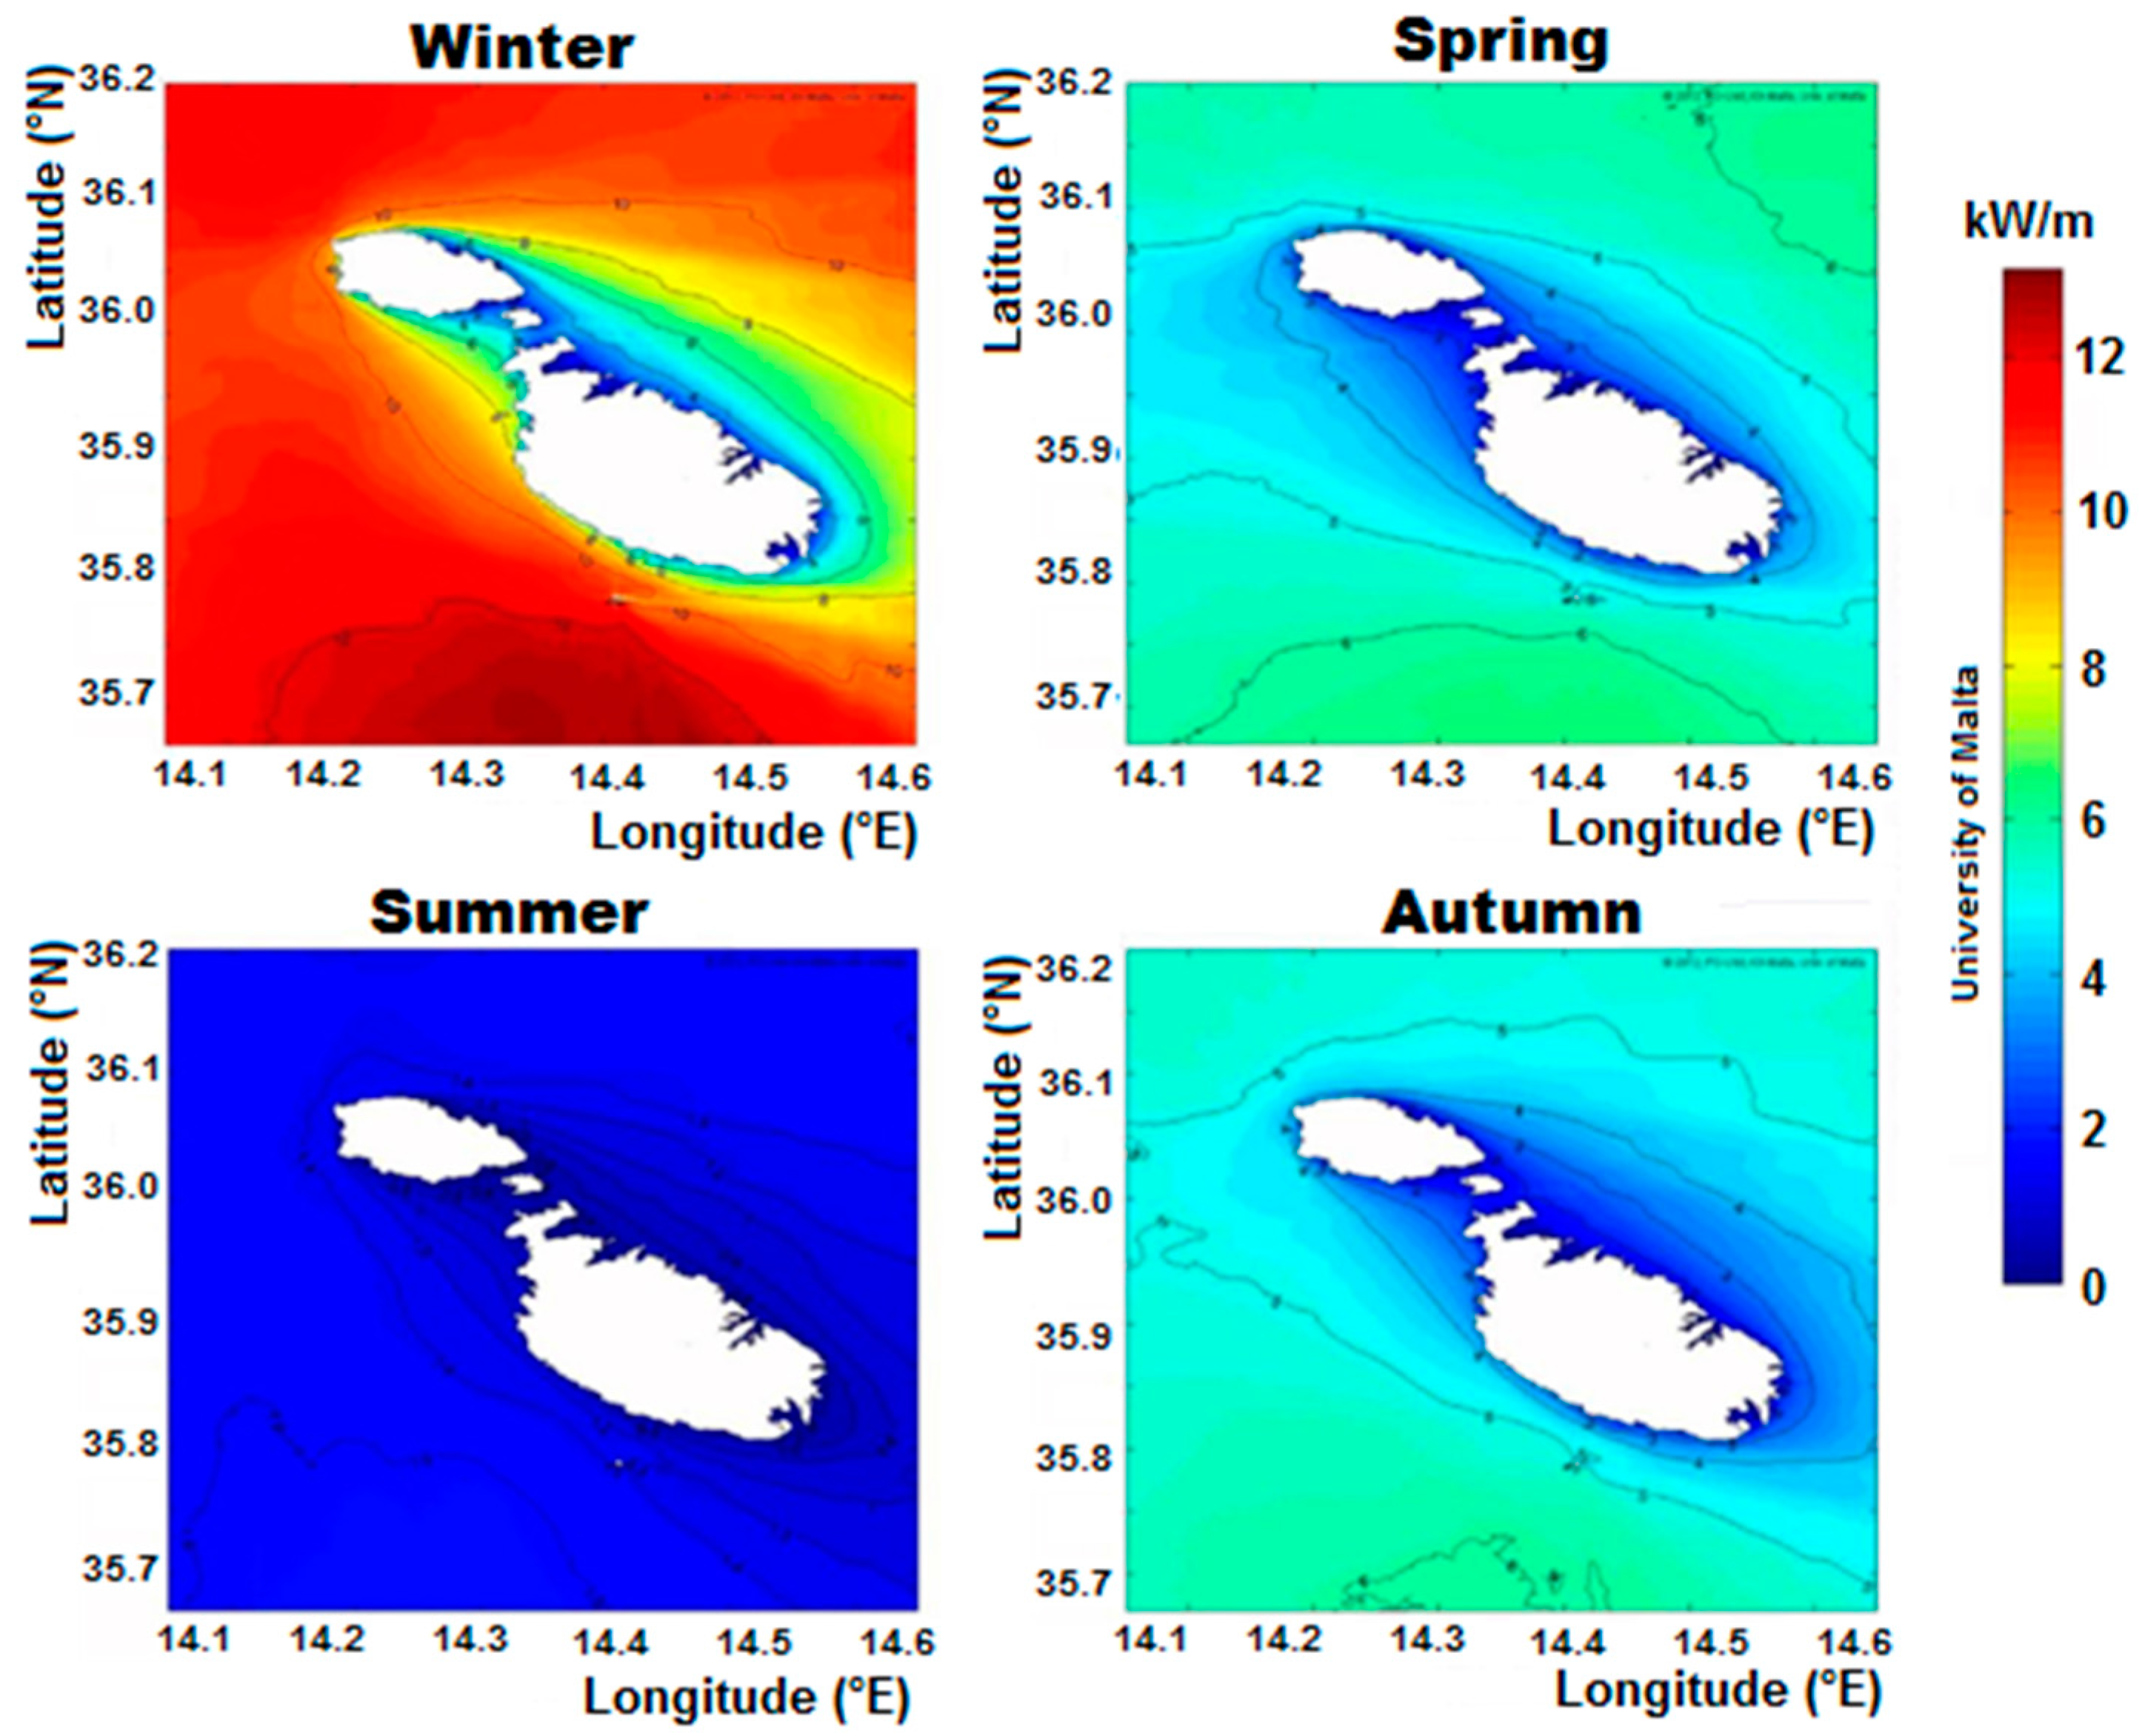
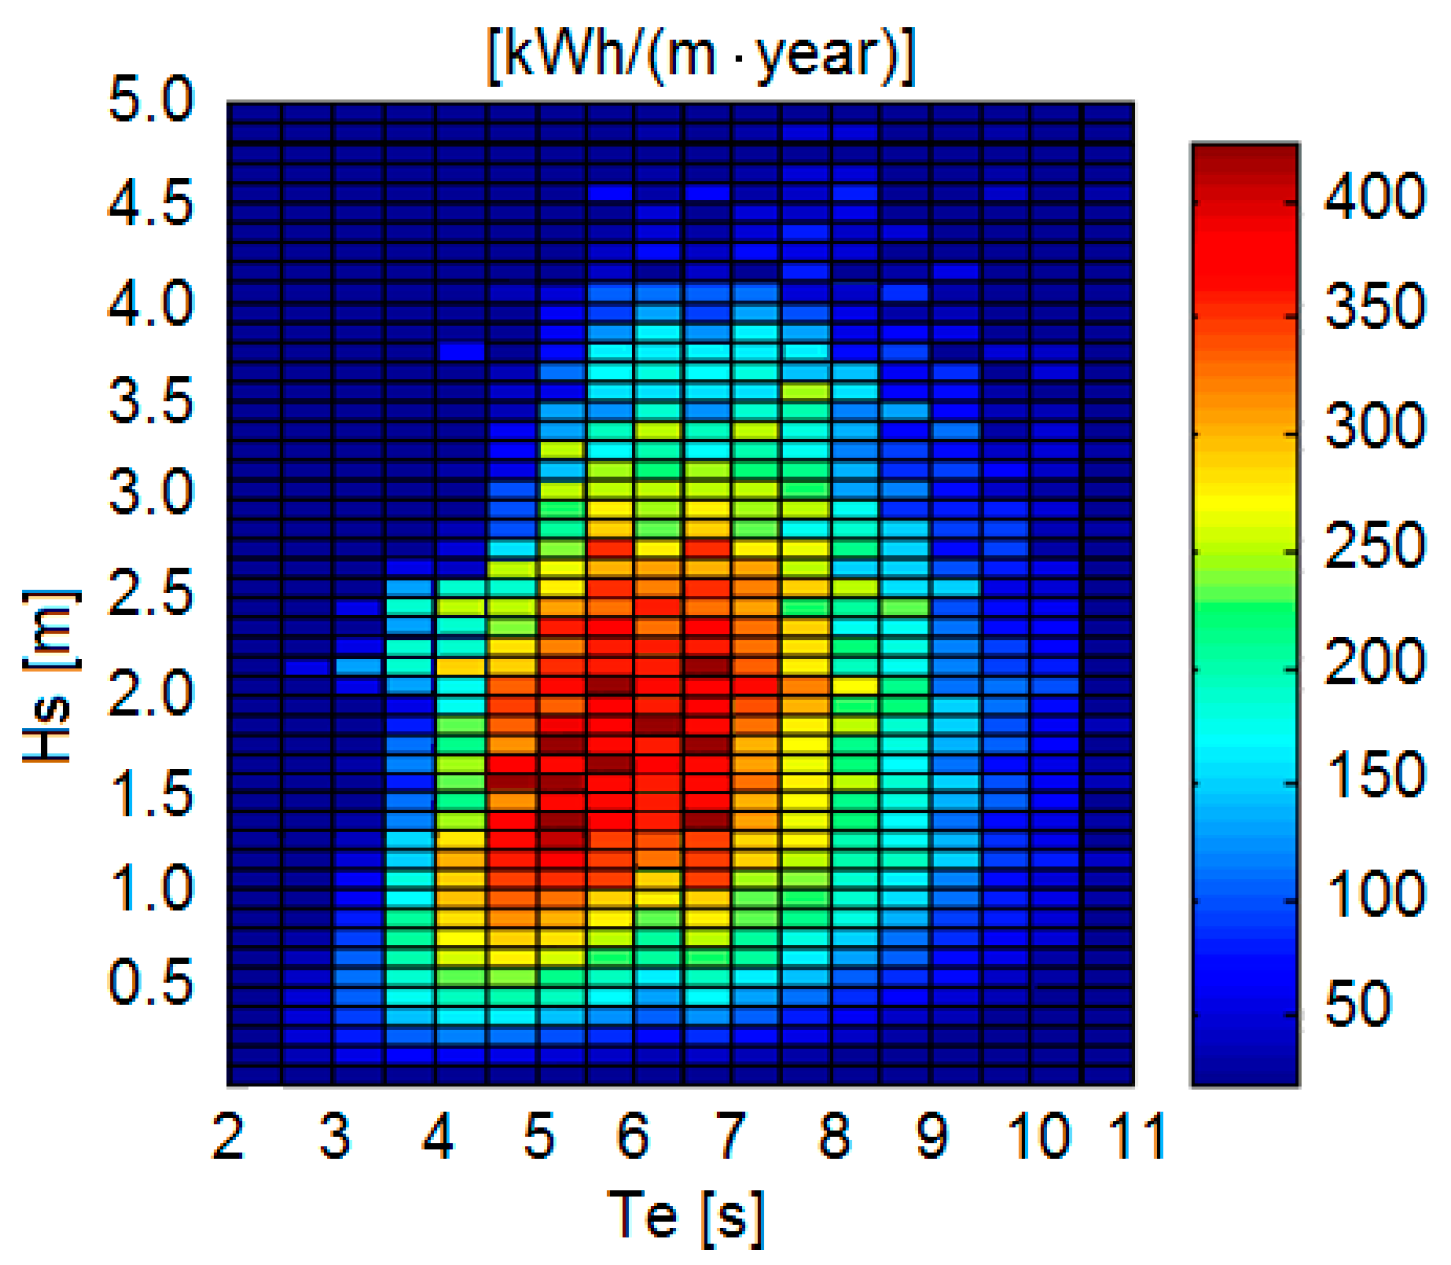
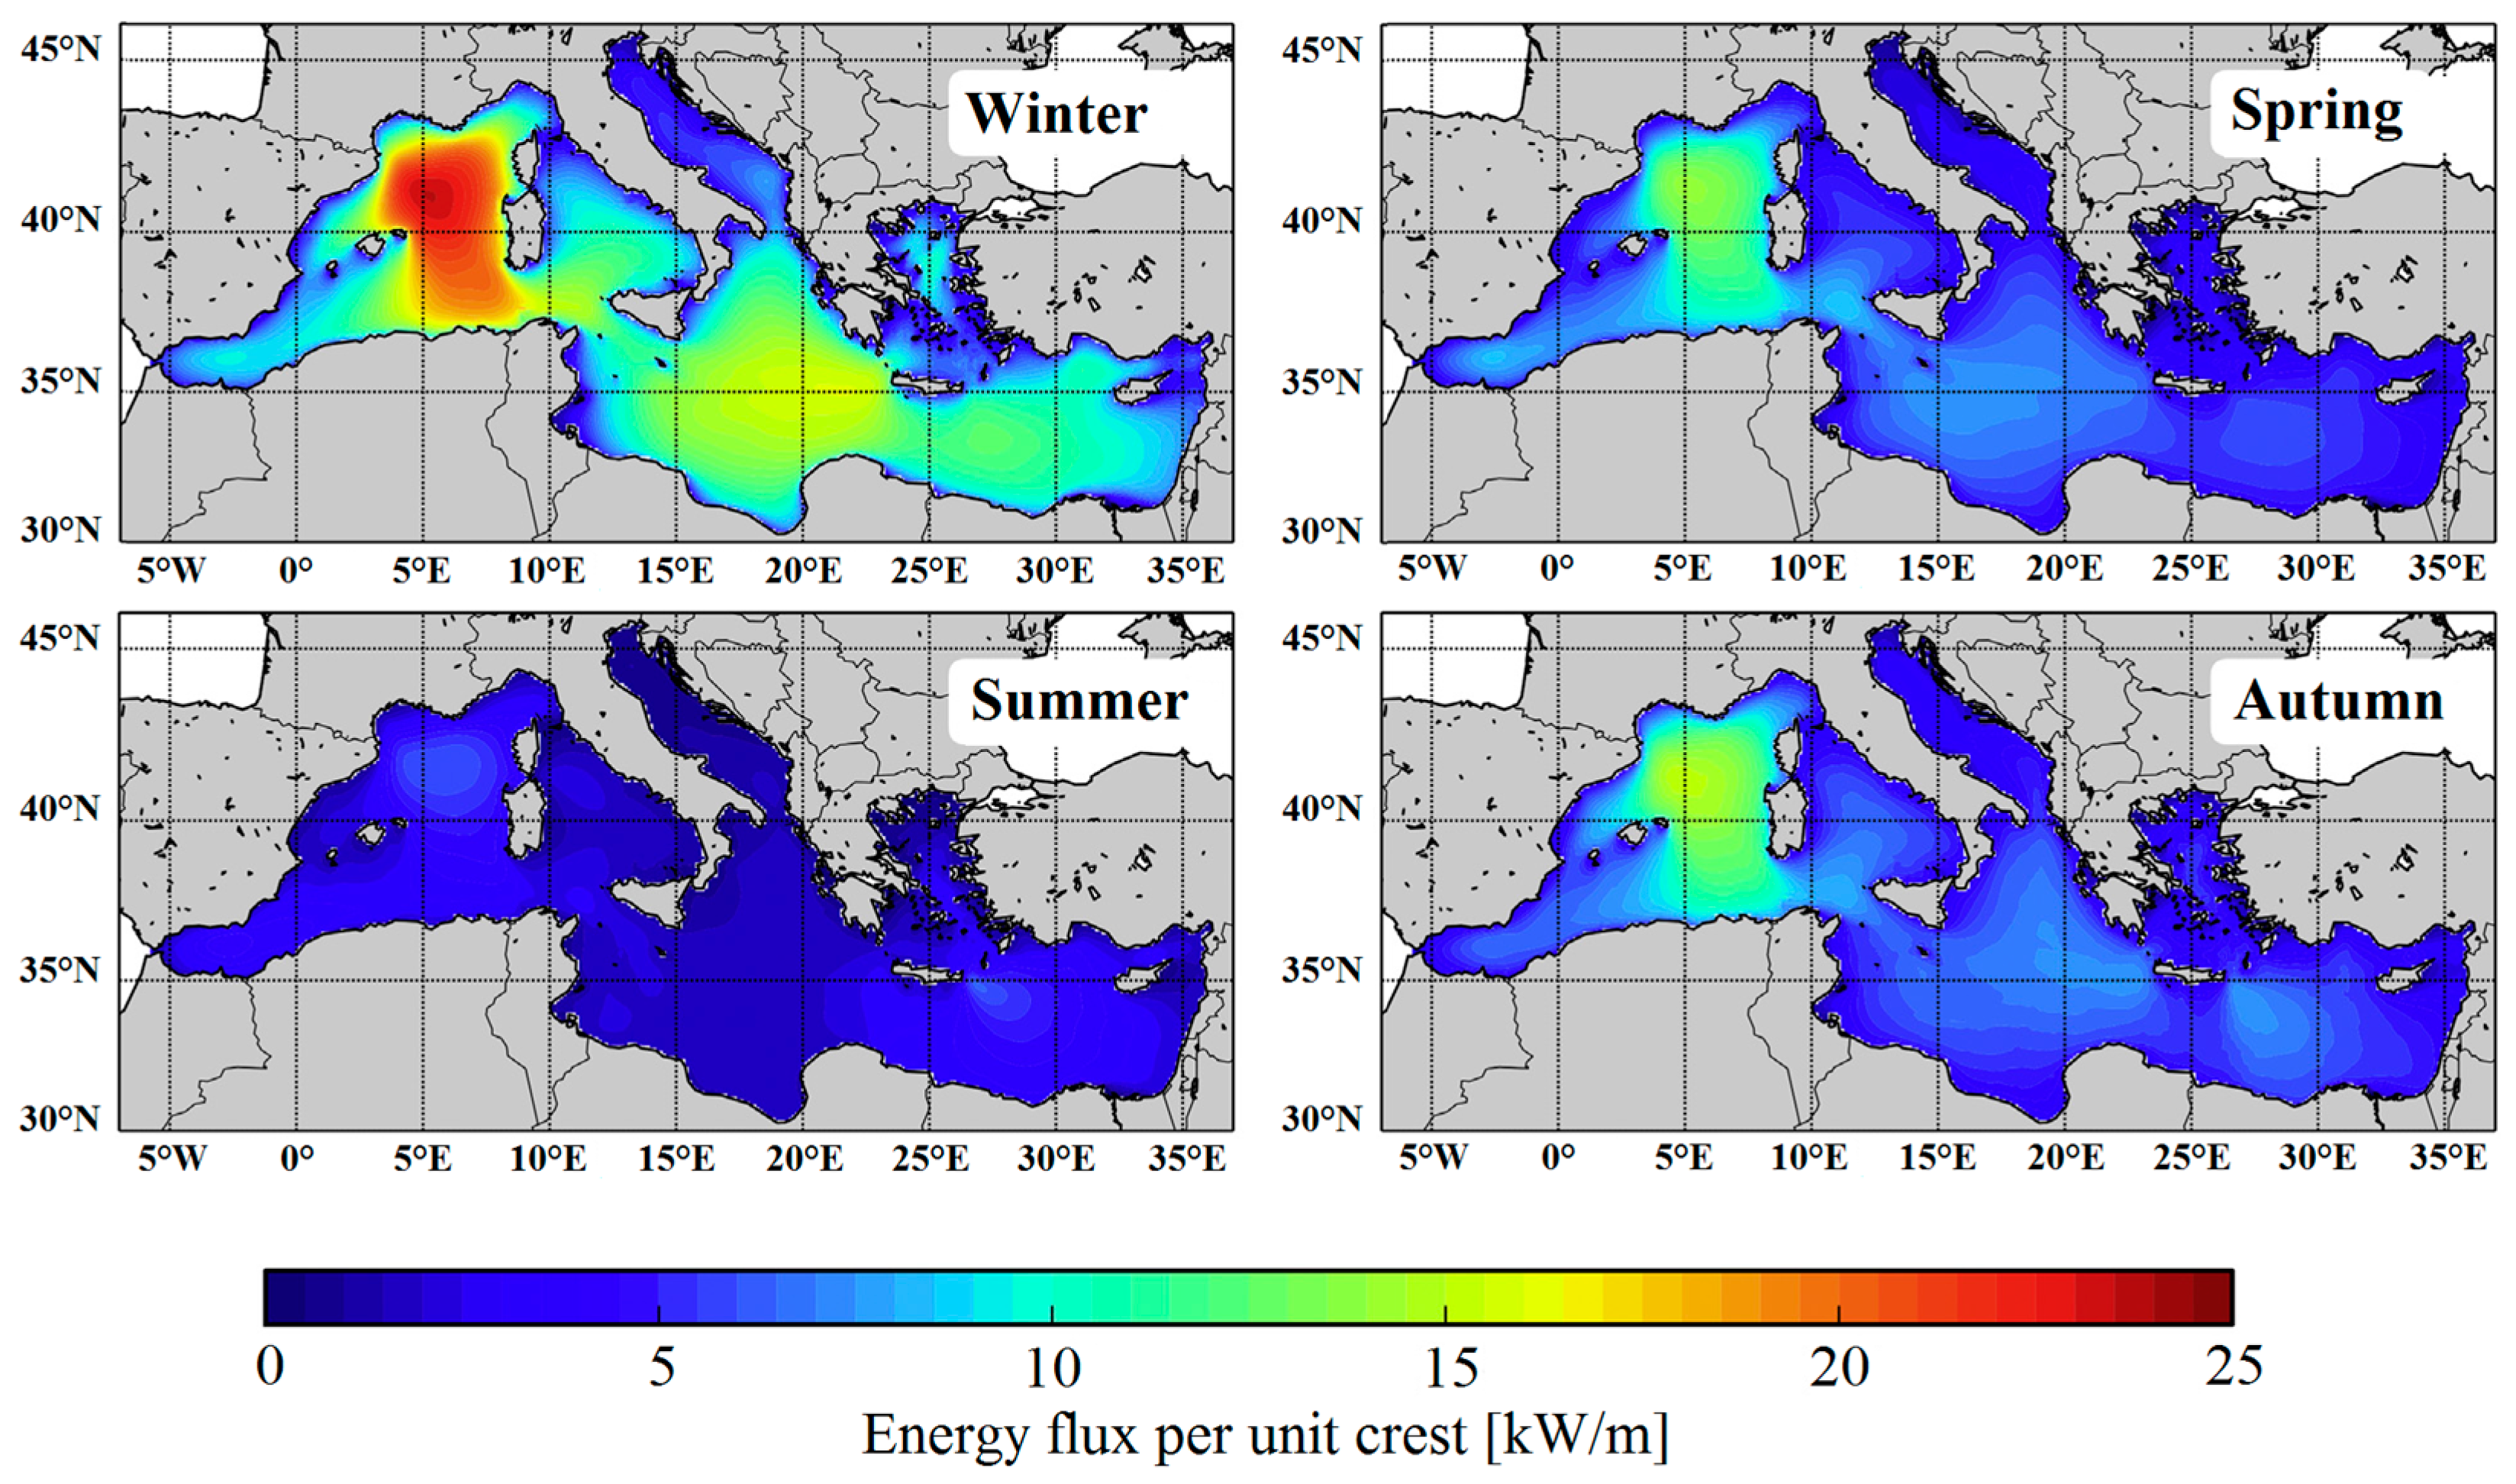
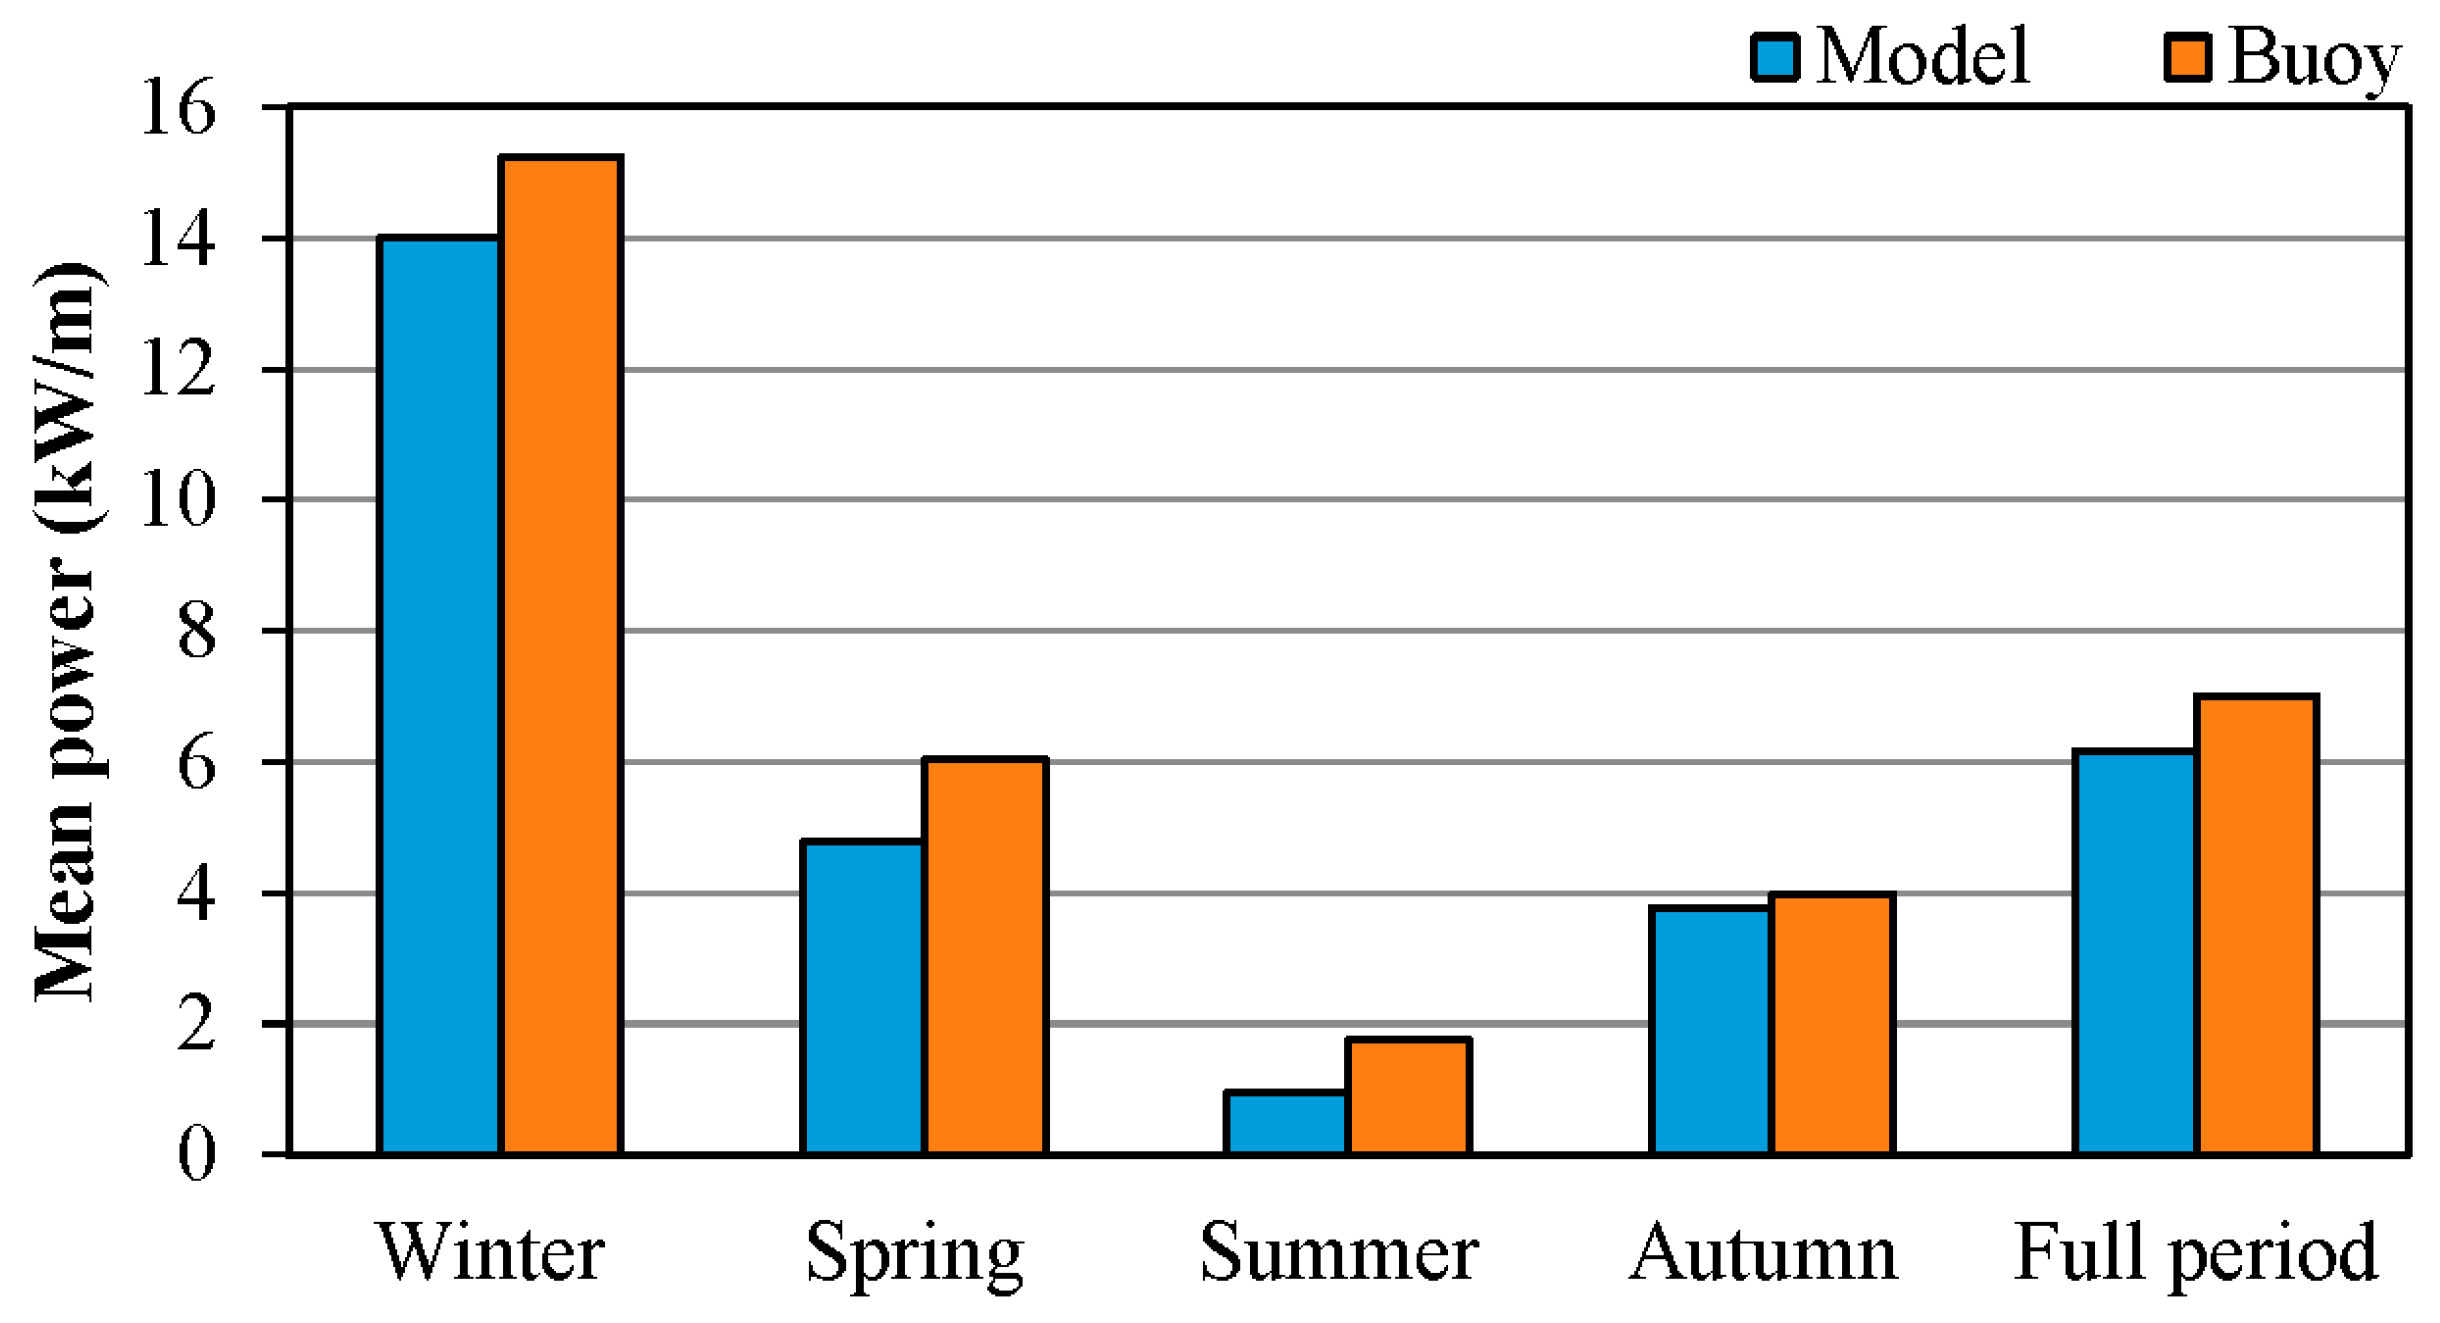
4. Sea Wave Energy Resource

The use of wave energy is able to reduce the energetic dependence of Mediterranean islands on fossil fuels. This important target presents different advantages, such as the reduction of imports of exogenous fossil fuels from unstable countries, the abatement of greenhouse gas emissions (especially CO2) and the creation of a working industry strongly linked to the territory. Nowadays, wave energy represents a renewable source totally unused in Malta, despite its 140 km of coasts. Moreover, the ratio of territorial waters to the land area in Malta is very high, approximately 10, with 3000 km2 of territorial waters [21]. This means that the exploitable areas are characterized by a great extension, with a great total energetic potential that can be properly used in order to produce electrical output thanks to appropriate conversion devices. The additional advantage is linked to the preservation of the small area of Maltese soil from the installation of further power plants.
During these years, different works focused their attention on the assessment of wave energy potential along the Mediterranean Sea. For example, Iglesias et al. evaluated the energy potential along Spanish coasts [22], Guillou and Chapalain on French coasts [23], and Vicinanza et al. on Italian coasts [24].
As shown in Figure 7, the energy potential is higher in winter than in summer. Intermediate conditions are in spring and autumn [25]. In the figure, we can identify the hot spots, i.e., the sea regions characterized by high energy potential [22].
In particular, the region in the west of Sardinia is the more energetic, with a yearly average sea wave energy flux higher than 10 kW/m (23 kW/m during winter) [26]. Other interesting areas are in the east and south of Sicily, with an energy flux between 6 and 9 kW/m [25]. The Maltese Archipelago is located exactly in this area.
The studies demonstrated that the wave energy resource of the Mediterranean Sea is lower than in other European areas, such as in north-west Europe [27]. This is linked to the enclosed structure of the Mediterranean Sea, surrounded by mountain chains that reduce the wind energy. However, this particular condition involves different advantages: the calmer sea climate defines less rigorous conditions for those Wave Energy Converters (WECs) that will be employed off-shore, with a lower risk of failure due to breakdown or malfunctions [28]. A calmer sea climate avoids an excessive oversizing of WECs too. Particularly, the central location of Malta in the Sicilian Channel determines a favorable condition in order to create the first commercial wave farms in the Mediterranean Sea.
A good validation of the energy theoretically extractable from sea wave is fundamental in order to increase the interest about this important renewable source and to improve new technologies of conversion.
The in situ measurements along Maltese coasts was realized with a single Datawell Waverider buoy, which was installed about 2 km west of the Gozo coastline, in a depth of 200 m [29]. Figure 8 shows the location of the measuring buoy along Maltese coasts. The use of wave buoys has a fundamental role in order to have some first data about wave potential with an experimental measurement campaign. However, they are usually too expensive, so they are used only in a first part of an assessment, especially in order to validate software data. The Gozo wave buoy was able to define the wave climate in Gozo and in the north-west part of the Maltese Archipelago, while it was also useful to know the wave energy potential along all the coasts. Additionally, maintenance costs usually reduce the measurement period to some years. In the case of Gozo’s wave buoy, measurements were performed from 14 September 2011 to 13 September 2012 [29], in order to know the seasonal variation of the wave climate.
The main parameters that define wave energy resources are Significant Wave High H s and Energy Period T e . The first one is measured in meters, the second one in seconds. For each sea state, using 1025 kg/m3 for the density ρ and 9.807 m/s2 for the gravitational acceleration g [29], the corresponding wave power is calculated through this expression:
φ = ρ g 2 64 π H s 2 T e 0.49 H s 2 T e [ k W m ]
Finally, the annual average wave power must be multiplied by 8760 h (hours in one year) in order to obtain the total energy, expressed in MWh/year. The next step consists of the use of the SWAN (Simulating Wave Nearshore) model hindcast 3-hourly fields, which is characterized by 89,701 grid points around the Maltese islands [29].
This model is particularly advantageous with propagation problems from deep waters up to the coasts. Both buoy data and SWAN data have highlighted an important seasonal variability of sea wave power along Maltese coasts. Wave power is characterized by high values during the winter season, which decrease in autumn and spring while the minimum values are recorded in summer. Moreover, winter wave power is more than double the annual average, as shown in Figure 9, obtained from the data reported in [29].
Therefore, mean power values obtained with SWAN model data are very similar to those obtained with the wave buoy, although slightly lower. Furthermore, this seasonal trend can be useful, because it is opposite to the solar trend and the two trends may offset each other.
Figure 10 reveals that the most advantageous location is the western coasts of the islands, due to the north-west prevalent direction of sea waves. An annual average power of 5 kW/m is considered here, which is a good value due to the high depth of the seabed even near the coast.
Finally, Figure 11 reports the scattering table of Maltese sea waves, generated by the SWAN model. As shown in the picture, the most energetic sea states are characterized by a significant wave height ranging from 0.5 m to 3.5 m and an energetic period ranging from 3.5 s to 9.0 s.

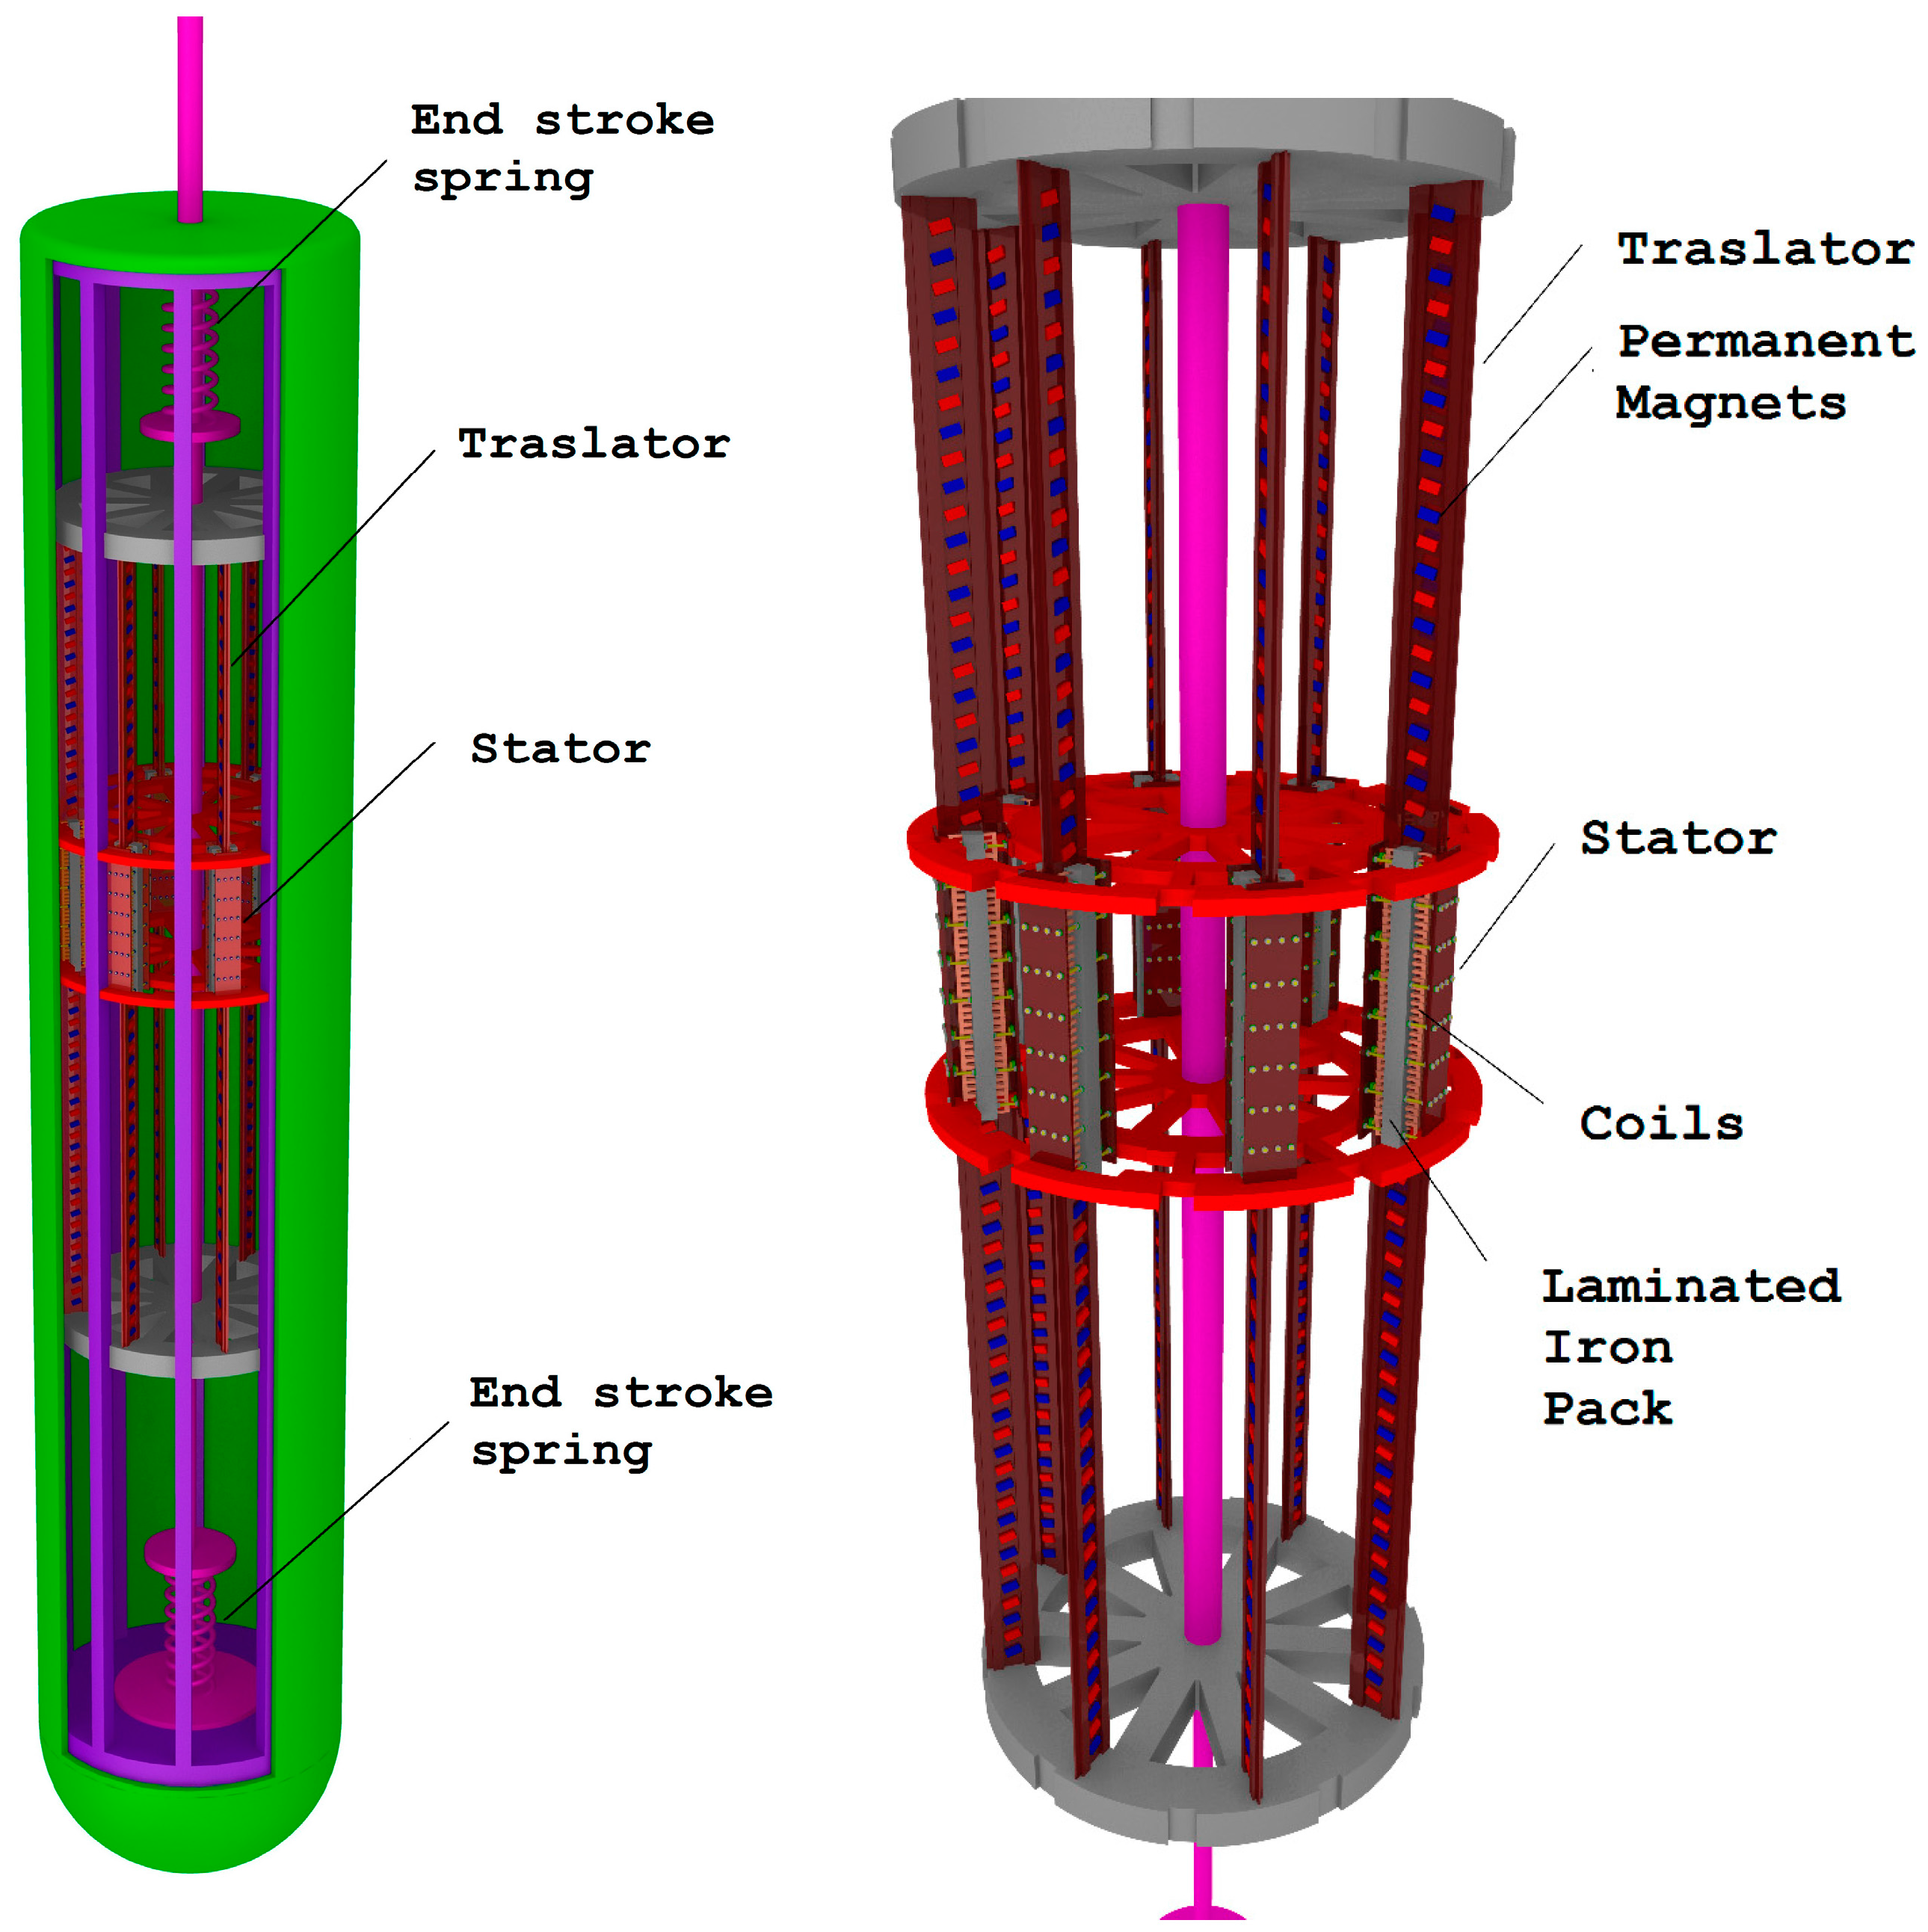
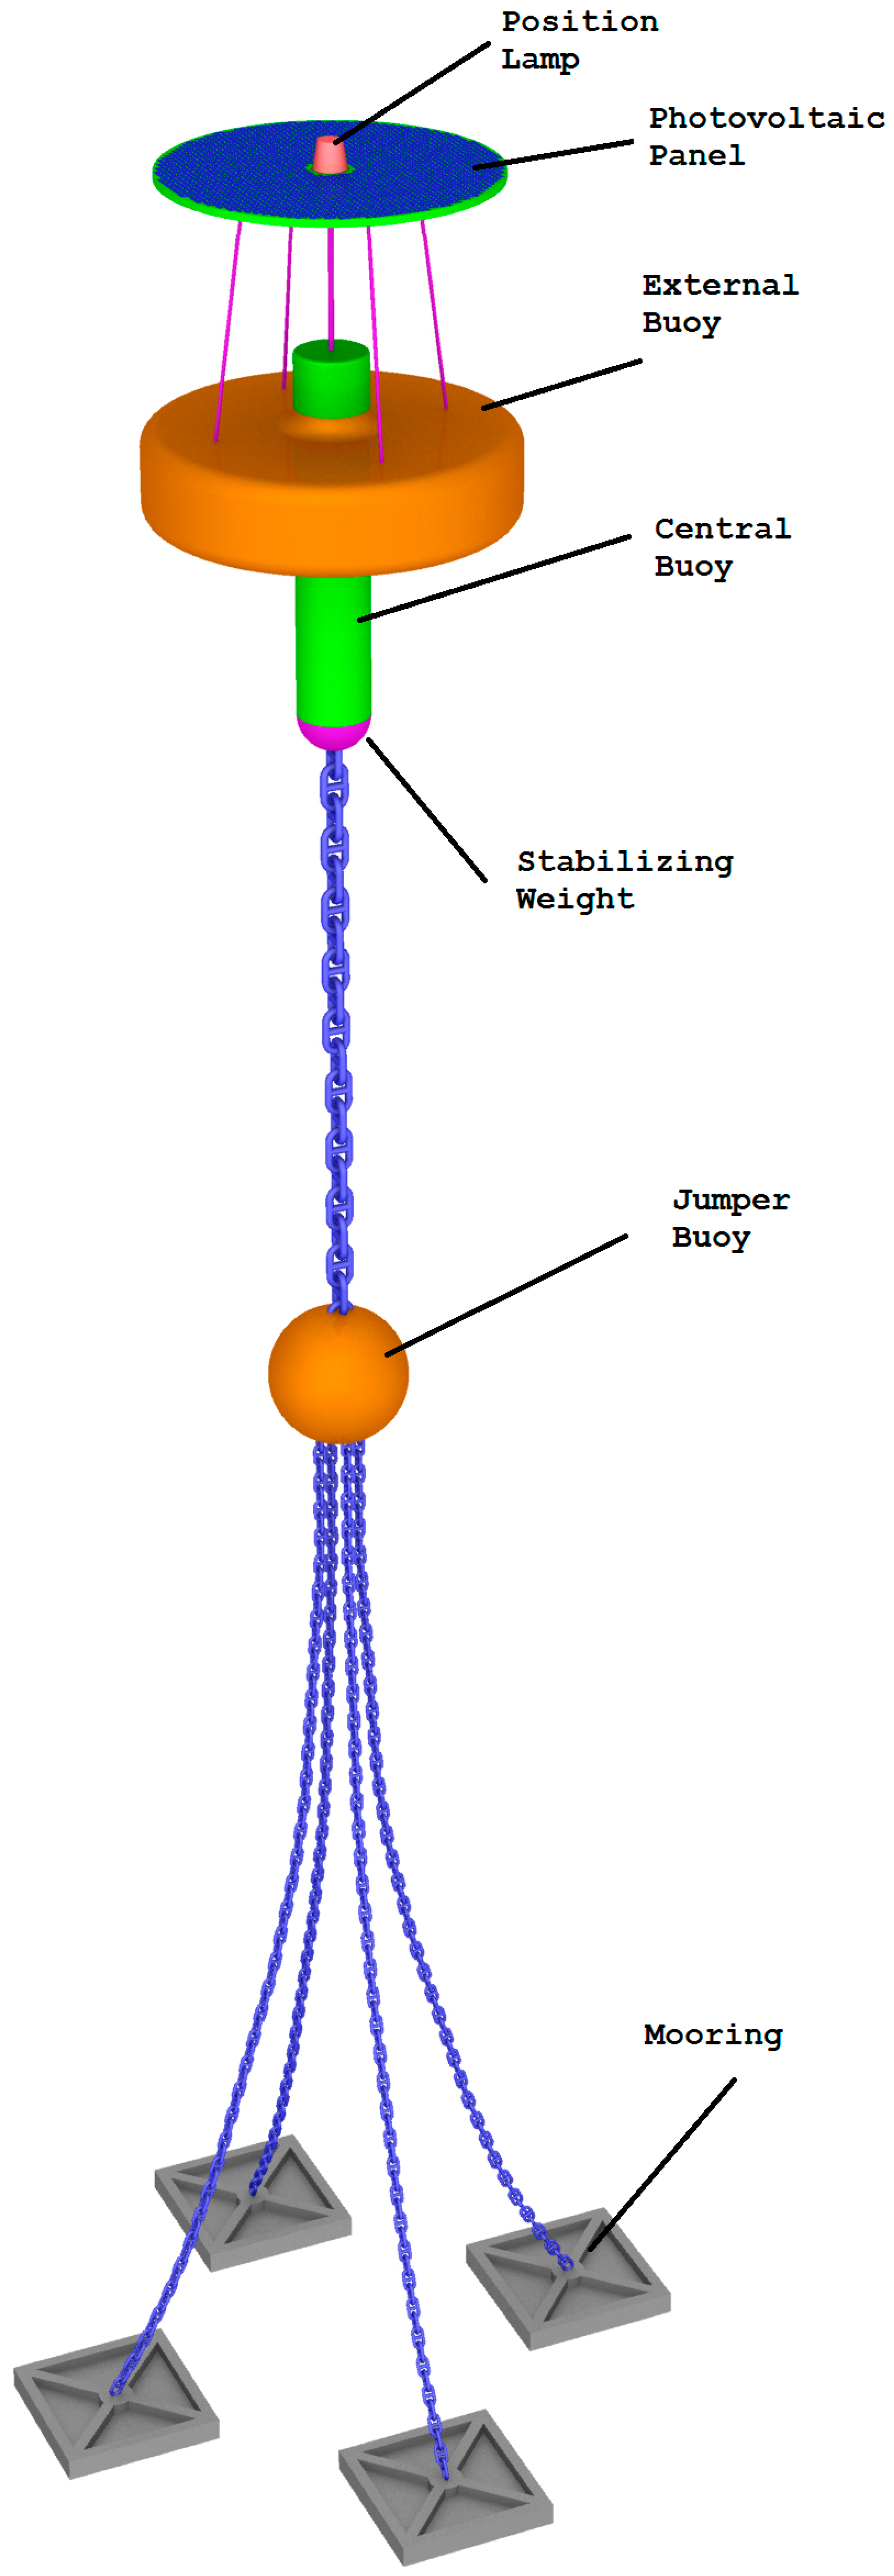
5. DEIM Point Absorber

This work proposes an innovative WEC, currently at the design stage by Department of Energy, Engineering Information and Mathematical Models (DEIM) of University of Palermo [30]. Figure 12 shows a representation of a Point Absorber, a technology proposed thanks to its ability to convert wave potential in electrical output directly, without the use of pressurized liquids (such as oils or waters) or other intermediate devices [31].
Moreover, it is able to work adequately with any direction of wave propagation, which is a really important characteristic [32]. A DEIM Point Absorber has a rated power of 80 kW and it is composed by eight single linear generators, each with a rated power of 10 kW. It consists of two floating buoys, independent of each other [33]. The external one (yellow buoy) intercepts the sea waves, while the central one (green buoy) is fixed to the seabed by moorings. Inside the internal buoy, the eight linear permanent magnet generators are installed. The alternate motion of the sea waves is transferred from the external buoy to the internal one thanks to the connecting rods (pink rods).
On the lower part of the internal buoy is located a hemispherical weight (pink in the picture) in order to confer greater stability to the system, guaranteeing its correct vertical positioning. This hemispherical weight is connected to a jumper buoy (yellow sphere) through a big chain, while the same jumper is connected to four moorings, placed on the seabed. In this way, the four chains, connecting the moorings and jumper, are constantly maintained in a vertical position, avoiding the scraping of the seabed. An intermittent red position lamp is positioned on top of the buoy, making visible the WEC up to several nautical miles away [34]. As shown in Figure 12, a photovoltaic panel can be installed in the upper part of the WEC.
The capture buoy has a useful diameter of 10 m, while the linear generators have a working stroke of 4 m. So, they are able to convert energy with agitated sea states too, which are the most energetic states. The innovative aspect of the project is related to the use of a particular type of linear electrical generator that directly converts mechanical energy from sea wave to electrical output without the use of brushes or other mechanical devices.
Each linear generator is composed by a translator and a stator. The first part is composed by 132 neodymium-iron-boron permanent magnets, which are able to produce a magnetic field without an electrical energy request. The second one contains the coils, with a three-phase connection, representing the magnetic circuit. End stroke springs are installed in the upper and lower part of the central buoy, in order to avoid any device damage due to bad weather [35]. Figure 13 represents a cross section of the conversion buoy, in which the eight linear generators are visible, with the connecting road and the springs installed in the upper and lower part of the case.
In this work, an overall efficiency of 50% is considered [36], according to the experimental tests on a small-scale prototype of a linear generator in the laboratory [37]. This is a simplified approach used to realize a first preliminary evaluation of sea wave energy potential. The following results can be used as a starting point for further analysis, which will be conducted as soon as we have the first data from a full-scale prototype.

6. Energetic Scenario Based on Wave and Photovoltaic Farms

The strategic position in the middle of the Mediterranean Sea and the quite high wave energy potential make Malta one of the best sites for the employment of the innovative Point Absorber here proposed. Moreover, DEIM WEC will be able to increase energetic independence of this country, currently at a very low level. The optimal collocation of the installation sites will be chosen according to different standards, in order to not influence main maritime routes and activities such as fishing [38]. It is important to say that fishing does not have a main role in the Maltese economy and the off-shore installation of buoys (several kilometers away from the coast) will contribute to the reduction of visual impact from the mainland. Additionally, renewable energy sources will help the local economy, thanks to the creation of a supply chain that does not exist nowadays [39]. Figure 13 represents Maltese annual energy demand (GWh) and peak demand (MW) projections until 2035. They are both assumed to grow at 1% per year in the base case scenario and 0.5% per year in the low case scenario [40].
Fixing 2025 as the reference year, the global electrical energy request will be about 2500 GWh/year, greater than the 2254 GWh/year registered in 2013. Here, wave source and off-shore photovoltaic (PV) technology are proposed.
The following Equation (2) is used to evaluate the rated power of all wave farms, considering the rated power of a single point absorber ( P C , R a t e d ), the number of devices installed in a single wave farm ( n C ) and the number of wave farms ( n F ). In order to evaluate the electrical energy production by sea wave, a simplified approach is considered. Equation (3) estimates the electrical output, considering the average sea wave power flux ( φ m ), the external diameter of a single wave converter ( D C ), its overall efficiency ( ε C ) , the total number of installed devices ( nCnF ) and, finally, the number of hours per year ( h y e a r ).
P W F = P C , R a t e d n C n F
E W F = φ m D C n C n F ε C h y e a r
All parameters are reported in Table 1. According to this simplified evaluation, the installation of 12 wave farms based on the DEIM Point Absorber along the western coast of Malta and Gozo, will generate 236,520 MWh/year. This production represents 9.5% of the overall electrical energy request in 2025. The total installed capacity is 86 MW. Each wave farm will consist of three lines of 30 WEC. Figure 14 shows the layout of the wave farm.
The minimal distance between each WEC is fixed to 51 m, about ten times greater than the radius of the external buoy (see Figure 15). This length is selected in order to minimize the interferences between the buoys of the wave farm [41]. So, a single wave farm covers an area with a length of 1500 m and a width of 120 m.
The integration of solar photovoltaic panels is also considered. The solar system could be installed in the upper part of wave converter, increasing the electrical output of the device.
Table 2 reports the daily and monthly average solar radiation in Malta [42,43,44]. According to these data, the annual solar radiation I y e a r in Malta is equal to 1915 kWh/m2. Equation (4) is used to evaluate the global installed power by photovoltaic panels, considering the standard solar radiation ( I P V , S t d ), the surface ( S P V ) of photovoltaic panels installed on a single wave converter, the total number of wave converters n C n F and the electrical efficiency of photovoltaic panels [45].
P P V F = I P V , R a t e d S P V n C n F ε P V
E P V F = I y e a r S P V n C n F ε P V
Equation (5) is used to evaluate the global electrical energy production by photovoltaic panels. All solar parameters are reported in Table 3.
According to this analysis, the solar source can be used to increase the electrical energy production, through the installation of 9.6 MWp, generating about 18.3 GWh/year that represents 0.73% of the overall electrical energy production in 2025.
Therefore, adding the electrical energy production from sea wave to solar photovoltaics, the global production is equal to 254.8 GWh/year that represents about 10.2% of the overall electrical energy request in 2025.
Finally, considering the CO2 emission factor γ C O 2 for the Delimara power plant (0.682 t CO2/MWh) [46], the avoided CO2 emissions related to renewable energy are evaluated, by Equations (6)–(8).
Γ C O 2 , W F = γ C O 2 E W F
Γ C O 2 , P V F = γ C O 2 E P V F
Γ C O 2 = Γ C O 2 , W F + Γ C O 2 , P V F
As reported in Table 4, the wave farms proposed in this paper avoid the emission of 161,307 tons of CO2. The integration of photovoltaic panels on wave converters avoids another 12,497 tons of CO2. The overall avoided CO2 emission is equal to 254,844 tons.

7. Conclusions

The correct use of Renewable Energies, especially wave energy, will contribute to the reduction of the dependence of the Maltese islands on exogenous fossil fuels, limiting the emissions of greenhouse gases due to the energy sector and global warming. Moreover, the innovative WEC will be able to exploit hundreds of kilometers of coastline, nowadays totally unused. In the end, this technology will be properly integrated with other conversion devices, such as the off-shore photovoltaic one, in order to increase renewable energy production in the same area, making wave farms even more competitive. The authors estimate that the electrical energy production from sea wave and off-shore photovoltaic will represent about 10.2% of the total share in 2025, which is a very remarkable goal in the short-term.

Author Contributions

All authors contributed equally.

Conflicts of Interest

The authors declare no conflict of interest.

Nomenclature

H s Significant wave height (m)
T e Energy period (s)
φ Wave energetic flux rate (kW/m)
φ m Average wave energetic flux rate (kW/m)
ρ Sea water density (kg/m3)
g Gravitational acceleration (m/s2)
D C Buoy external diameter (m)
P C , R a t e d Rated power of wave converter (kW)
ε C Average overall energetic efficiency of wave converter (%)
n C Number of buoys per wave farm (-)
n F Number of wave farms (-)
P W F Overall installed power of wave farms (MW)
E W F Annual energy production by sea wave (MW/year)
h y e a r Hours per year (h/year)
I d a y Daily solar radiation (kWh/m2)
I m o n t h Monthly solar radiation (kWh/m2)
I y e a r Annual solar radiation (kWh/m2)
I P V , S t d Standard solar radiation (kWh/m2)
ε P V Panel efficiency (%)
S P V Panel surface per buoy (m2)
P P V F Overall installed power of photovoltaic panels (MW)
E P V F Annual energy production by photovoltaic panels (MWh/year)
γ C O 2 CO2 emission factor (t CO2/MWh)
Γ C O 2 , W F Avoided CO2 emission by sea wave farm (t CO2/year)
Γ C O 2 , P V F Avoided CO2 emission by solar farm (t CO2/year)
Γ C O 2 Total avoided CO2 emission by sea wave and solar sources (t CO2/year)

References

  1. Di Dio, V.; Franzitta, V.; Milone, D.; Pitruzzella, S.; Trapanese, M.; Viola, A. Design of Bilateral Switched Reluctance Linear Generator to Convert Wave Energy: Case Study in Sicily. Adv. Mater. Res. 2013, 860–863, 1694–1698. [Google Scholar] [CrossRef]
  2. Franzitta, V.; Milone, A.; Milone, D.; Trapanese, M.; Viola, A. A Procedure to Evaluate the Indoor Global Quality by a Sub Objective-Objective Procedure. Adv. Mater. Res. 2013, 734–737, 3065–3070. [Google Scholar] [CrossRef]
  3. Antoine, B.; Goran, K.; Neven, D. Energy scenarios for Malta. Int. J. Hydrogen Energy 2008, 33, 4235–4246. [Google Scholar] [CrossRef]
  4. Franzitta, V.; Milone, D.; Trapanese, M.; Viola, A.; di Dio, V.; Pitruzzella, S. Energy and Economic Comparison of Different Conditioning System among Traditional and Eco-Sustainable Building. Appl. Mech. Mater. 2013, 394, 289–295. [Google Scholar] [CrossRef]
  5. Franzitta, V.; Trapanese, M.; Giaconia, C.; Ferrara, P.; Viola, A. Design and experimental test of a low costweather buoy. In Proceedings of the 2013 MTS/IEEE OCEANS—Bergen, Bergen, Norway, 10–14 June 2013; pp. 1–5.
  6. Franzitta, V.; Milone, A.; Milone, D.; Pitruzzella, S.; Trapanese, M.; Viola, A. Experimental Evidence on the Thermal Performance of Opaque Surfaces in Mediterranean Climate. Adv. Mater. Res. 2013, 860–863, 1227–1231. [Google Scholar] [CrossRef]
  7. The European Parliament and of the Council. Directive 2009/28/EC of the European Parliament and of the Council of 23 April 2009 on the promotion of the use of energy from renewable sources and amending and subsequently repealing Directives 2001/77/EC and 2003/30/EC. Off. J. Eur. Union L 2009, 140, 16–62. [Google Scholar]
  8. Milone, D.; Pitruzzella, S.; Franzitta, V.; Viola, A.; Trapanese, M. Energy Savings through Integration of the Illumination Natural and Artificial, Using a System of Automatic Dimming: Case Study. Appl. Mech. Mater. 2013, 372, 253–258. [Google Scholar] [CrossRef]
  9. Franzitta, V.; Milone, A.; Milone, D.; Pitruzzella, S.; Trapanese, M.; Viola, A. A Case Study to Evaluate the Indoor Global Quality. Adv. Mater. Res. 2013, 864–867, 1054–1058. [Google Scholar] [CrossRef]
  10. Trapanese, M.; Franzitta, V.; Viola, A. The Jiles Atherton model for description of hysteresis in lithium battery. In Proceedings of the 2013 Twenty-Eighth Annual IEEE Applied Power Electronics Conference and Exposition (APEC), Long Beach, CA, USA, 17–21 March 2013; pp. 2773–2775.
  11. Trapanese, M.; Franzitta, V.; Viola, A. Description of hysteresis of Nickel Metal Hydride Battery. In Proceedings of the IECON 2012—38th Annual Conference on IEEE Industrial Electronics Society, Montreal, QC, Canada, 25–28 October 2012; pp. 967–970.
  12. Falcão, A.F.D.O. Wave energy utilization: A review of the technologies. Renew. Sustain. Energy Rev. 2010, 14, 899–918. [Google Scholar] [CrossRef]
  13. Viola, A.; Franzitta, V.; Curto, D.; Trapanese, M.; di Dio, V.; Cipriani, G.; Boscaino, V.; Corpora, M.; Raimondi, F.M. Design of wave energy converter (WEC): A prototype installed in Sicily. In Proceedings of the OCEANS 2015—Genoa, Genoa, Italy, 18–21 May 2015; pp. 1–5.
  14. Galdies, C. The Climate of Malta: Statistics, Trends and Analysis 1951–2010; National Statistics Office: Valletta, Malta, 2011. [Google Scholar]
  15. Weather and Climate in Malta and Gozo. Available online: http://www.malta.com/en/about-malta/weather-climate (accessed on 20 October 2016).
  16. Directorate General for Energy and Transport. Available online: http://ec.europa.eu/info/publications/directorate-general-mobility-and-transport_en (accessed on 23 September 2016).
  17. EneMalta Plc. Enemalta. Available online: http://www.enemalta.com.mt/ (accessed on 18 November 2016).
  18. Renewable Energy Scenarios in Islands (RESI). RESI Map. Available online: http://www.resiproject.eu/site/map/ (accessed on 20 October 2016).
  19. International Energy Agency (IEA). Malta. Available online: https://www.iea.org/countries/non-membercountries/malta/ (accessed on 20 October 2016).
  20. Modelling Malta’s Energy System towards Sustainability. Available online: http://projekter.aau.dk/projekter/files/213313567/Modelling_Malta_Energy_System_Breuer_Pilla.pdf (accessed on 23 September 2016).
  21. Trapani, K.; Millar, D.L. Proposing offshore photovoltaic (PV) technology to the energy mix of the Maltese islands. Energy Convers. Manag. 2013, 67, 18–26. [Google Scholar] [CrossRef]
  22. Iglesias, G.; Carballo, R. Wave energy and nearshore hot spots: The case of the SE Bay of Biscay. Renew. Energy 2010, 35, 2490–2500. [Google Scholar] [CrossRef]
  23. Guillou, N.; Chapalain, G. Numerical modelling of nearshore wave energy resource in the Sea of Iroise. Renew. Energy 2015, 83, 942–953. [Google Scholar] [CrossRef]
  24. Vicinanza, D.; Cappietti, L.; Ferrante, V.; Contestabile, P. Estimation of the wave energy in the Italian offshore. J. Coast. Res. 2011, 64, 613–617. [Google Scholar]
  25. Besio, G.; Mentaschi, L.; Mazzino, A. Wave energy resource assessment in the Mediterranean Sea on the basis of a 35-year hindcast. Energy 2016, 94, 50–63. [Google Scholar] [CrossRef]
  26. Vicinanza, D.; Contestabile, P.; Ferrante, V. Wave energy potential in the north-west of Sardinia (Italy). Renew. Energy 2013, 50, 506–521. [Google Scholar] [CrossRef]
  27. Sorensen, H.C.; Chozas, J.F. The Potential for Wave Energy in the North Sea. In Proceedings of the 3rd International Conference and Exhibition on Ocean Energy, ICOE—2010, Bilbao, Spain, 6–8 October 2010; pp. 1–6.
  28. Colucci, A.; Boscaino, V.; Cipriani, G.; Curto, D.; di Dio, V.; Franzitta, V.; Trapanese, M.; Viola, A. An inertial system for the production of electricity and hydrogen from sea wave energy. In Proceedings of the Ocean 2015—MTS/IEEE Washington, Washington, DC, USA, 19–22 October 2015; pp. 1–10.
  29. Drago, A.; Azzopardi, J.; Gauci, A.; Tarasova, R.; Bruschi, A. Assessing the Offshore Wave Energy Potential for the Maltese Islands. In Proceedings of the ISE Annual Conference 2013, Qawra, Malta, 21 March 2013; pp. 16–27.
  30. Trapanese, M.; Franzitta, V.; Viola, A. A dynamic model for hysteresis in magnetostrictive devices. J. Appl. Phys. 2014, 115, 1–4. [Google Scholar] [CrossRef]
  31. Franzitta, V.; Viola, A.; Trapanese, M. Design of a transverse flux machine for power generation from seawaves. J. Appl. Phys. 2014, 115, 17E712. [Google Scholar] [CrossRef]
  32. Marvuglia, A.; Messineo, A. Using Recurrent Artificial Neural Networks to Forecast Household Electricity Consumption. Energy Procedia 2012, 14, 45–55. [Google Scholar] [CrossRef]
  33. Volpe, R.; Messineo, A.; Millan, M.; Volpe, M.; Kandiyoti, R. Assessment of olive wastes as energy source: Pyrolysis, torrefaction and the key role of H loss in thermal breakdown. Energy 2015, 82, 119–127. [Google Scholar] [CrossRef]
  34. Asdrubali, F.; Presciutti, A.; Scrucca, F. Development of a greenhouse gas accounting GIS-based tool to support local policy making—Application to an Italian municipality. Energy Policy 2013, 61, 587–594. [Google Scholar] [CrossRef]
  35. Asdrubali, F.; Moncada, L.G.G.; Rotili, A. Influence of new factors on global energy prospects in the medium term: Comparison among the 2010, 2011 and 2012 editions of the IEA’s World Energy Outlook reports. Econ. Policy Energy Environ. 2013, 3, 67–89. [Google Scholar]
  36. McCullen, P.; Clement, A.; Falcao, A.; Fiorentino, A.; Gardner, F.; Hammarlund, K.; Lemonis, G.; Lewis, T.; Nielsen, K.; Petroncini, S.; et al. Wave energy in Europe: Current status and perspectives. Renew. Sustain. Energy. Rev. 2002, 6, 405–431. [Google Scholar]
  37. Curto, D. Ottimizzazione delle Performances Energetiche di un Innovativo Generatore di Energia Elettrica da Moto Ondoso; Gruppo Editoriale L’Espresso: Rome, Italy, 2015. [Google Scholar]
  38. Asdrubali, F.; D’Alessandro, F.; Baldinelli, G.; Bianchi, F. Evaluating in situ thermal transmittance of green buildings masonries—A case study. Case Stud. Constr. Mater. 2014, 1, 53–59. [Google Scholar] [CrossRef]
  39. Viola, A.; Franzitta, V.; Curto, D.; di Dio, V.; Milone, D.; Rodono, G. Environmental Impact Assessment (EIA) of Wave Energy Converter (WEC). In Proceedings of the OCEANS 2015—Genoa, Genoa, Italy, 18–21 May 2015; pp. 1–4.
  40. National Allocation Plan for Malta 2005–2007. Available online: http://mra.org.mt/wp-content/uploads/2012/09/bk1.doc-5_MALTA-NAP-2005_2007_FINAL.pdf (accessed on 23 September 2016).
  41. Balitsky, P.; Bacelli, G.; Ringwood, J.V. Control-Influenced Layout Optimization of Arrays of Wave Energy Converters. Ocean Renew. Energy 2014, 9B, V09BT09A022. [Google Scholar]
  42. Farrugia, R.N.; Fsadni, M.; Yousif, C.; Mallia, E.A. The Renewable Energy Potential of the Maltese Islands. Xjenza 2005, 10, 32–42. [Google Scholar]
  43. Yousif, C.; Quecedo, G.O.; Santos, J.B. Comparison of solar radiation in Marsaxlokk, Malta and Valladolid, Spain. Renew. Energy 2013, 49, 203–206. [Google Scholar] [CrossRef]
  44. Efficient Energy Saving. Solar Irradiance Calculator. Available online: http://www.efficientenergysaving.co.uk/solar-irradiance-calculator.html (accessed on 07 November 2016).
  45. Ciabattoni, L.; Grisostomi, M.; Ippoliti, G.; Longhi, S. Fuzzy logic home energy consumption modeling for residential photovoltaic plant sizing in the new Italian scenario. Energy 2014, 74, 359–367. [Google Scholar] [CrossRef]
  46. National Allocation Plan for Malta 2008–2012. Available online: http://mra.org.mt/wp-content/uploads/2012/09/bk2.doc-6_REVISED-MALTA-NAP-2008_2012_FINAL.pdf (accessed on 07 November 2016).
Figure 1. Electrical grid with main RES and storage systems.
Energies 09 01034 g001
Figure 2. View of the Maltese Archipelago.
Energies 09 01034 g002
Figure 3. Electrical grid in Malta’s archipelago [17].
Energies 09 01034 g003
Figure 4. Electricity generation by fuel in Malta (1971–2013) [19]. Peat and oil shale are aggregated with coal.
Energies 09 01034 g004
Figure 5. Average daily load charts per season (2012–2014) [20].
Energies 09 01034 g005
Figure 6. Electrical demand during the year (2012) [20].
Energies 09 01034 g006
Figure 7. Average energy flux in the Mediterranean Sea, during seasons [25].
Energies 09 01034 g007
Figure 8. Position of the Datawell Waverider buoy along Maltese coasts.
Energies 09 01034 g008
Figure 9. Seasonal wave power from buoy and SWAN model data in Gozo.
Energies 09 01034 g009
Figure 10. Seasonal wave power along the Maltese islands for the SWAN model domain [29].
Energies 09 01034 g010
Figure 11. Scatter table of extractable energy along Maltese coasts, using the SWAN model.
Energies 09 01034 g011
Figure 12. Graphical representation of the DEIM Point Absorber.
Energies 09 01034 g012
Figure 13. Cross section and internal view of the inner buoy of the DEIM Point Absorber.
Energies 09 01034 g013
Figure 14. Maltese annual energy and peak demand projections until 2035 [27].
Energies 09 01034 g014
Figure 15. Wave farm layout.
Energies 09 01034 g015
Table 1. Wave farm parameters.
ParameterSymbolValueUnit
Buoy diameter D C 10m
Rated power of wave converter P C , R a t e d 80kW
Average overall energetic efficiency ε C 50%
Average sea wave power flux φ m 5kW/m
n. buoys in wave farm n C 90-
n. wave farms n F 12-
Overall installed power P W F 86.4MW
Hours per year h y e a r 8760h/year
Annual energy production E W F 236,520MWh/year
Table 2. Daily and monthly solar radiation in Malta (average values 2000–2010).
Jan.Feb.Mar.Apr.MayJun.
I d a y (kWh/m2)2.643.594.946.337.257.96
I m o n t h (kWh/m2)81.84100.52153.14189.9224.75238.8
Jul.Aug.Sep.Oct.Nov.Dec.
I d a y (kWh/m2)8.067.185.674.152.792.29
I m o n t h (kWh/m2)249.86222.58170.1128.6583.770.99
Table 3. Parameters of photovoltaic panels installed on the wave farm.
ParameterSymbolValueUnit
Annual solar radiation I y e a r 1915kWh/m2
Standard solar radiation I P V , S t d 1000W/m2
Panel Efficiency ε P V 17%%
Panel surface per buoy S P V 52.12m2
Installed power P P V F 9.6MWp
Annual energy production E P V F 18,325MWh/year
Table 4. Avoided CO2 emissions by wave and solar sources.
ParameterSymbolValueUnit
Emission factor γ C O 2 0.682t CO2/MWh
Annual energy production by wave E W F 236,520MWh/year
Annual energy production by PV E P V F 18,325MWh/year
Avoided CO2 by wave Γ CO2,WF 161,307t CO2/year
Avoided CO2 by PV Γ C O 2 , P V F 12,497t CO2/year
Total Avoided CO2 Γ C O 2 254,844t CO2/year

