
Modeling and Mitigation for High Frequency Switching Transients Due to Energization in Offshore Wind Farms


Abstract
:1. Introduction
2. Layout and Component Models of Investigated Offshore Wind Farm
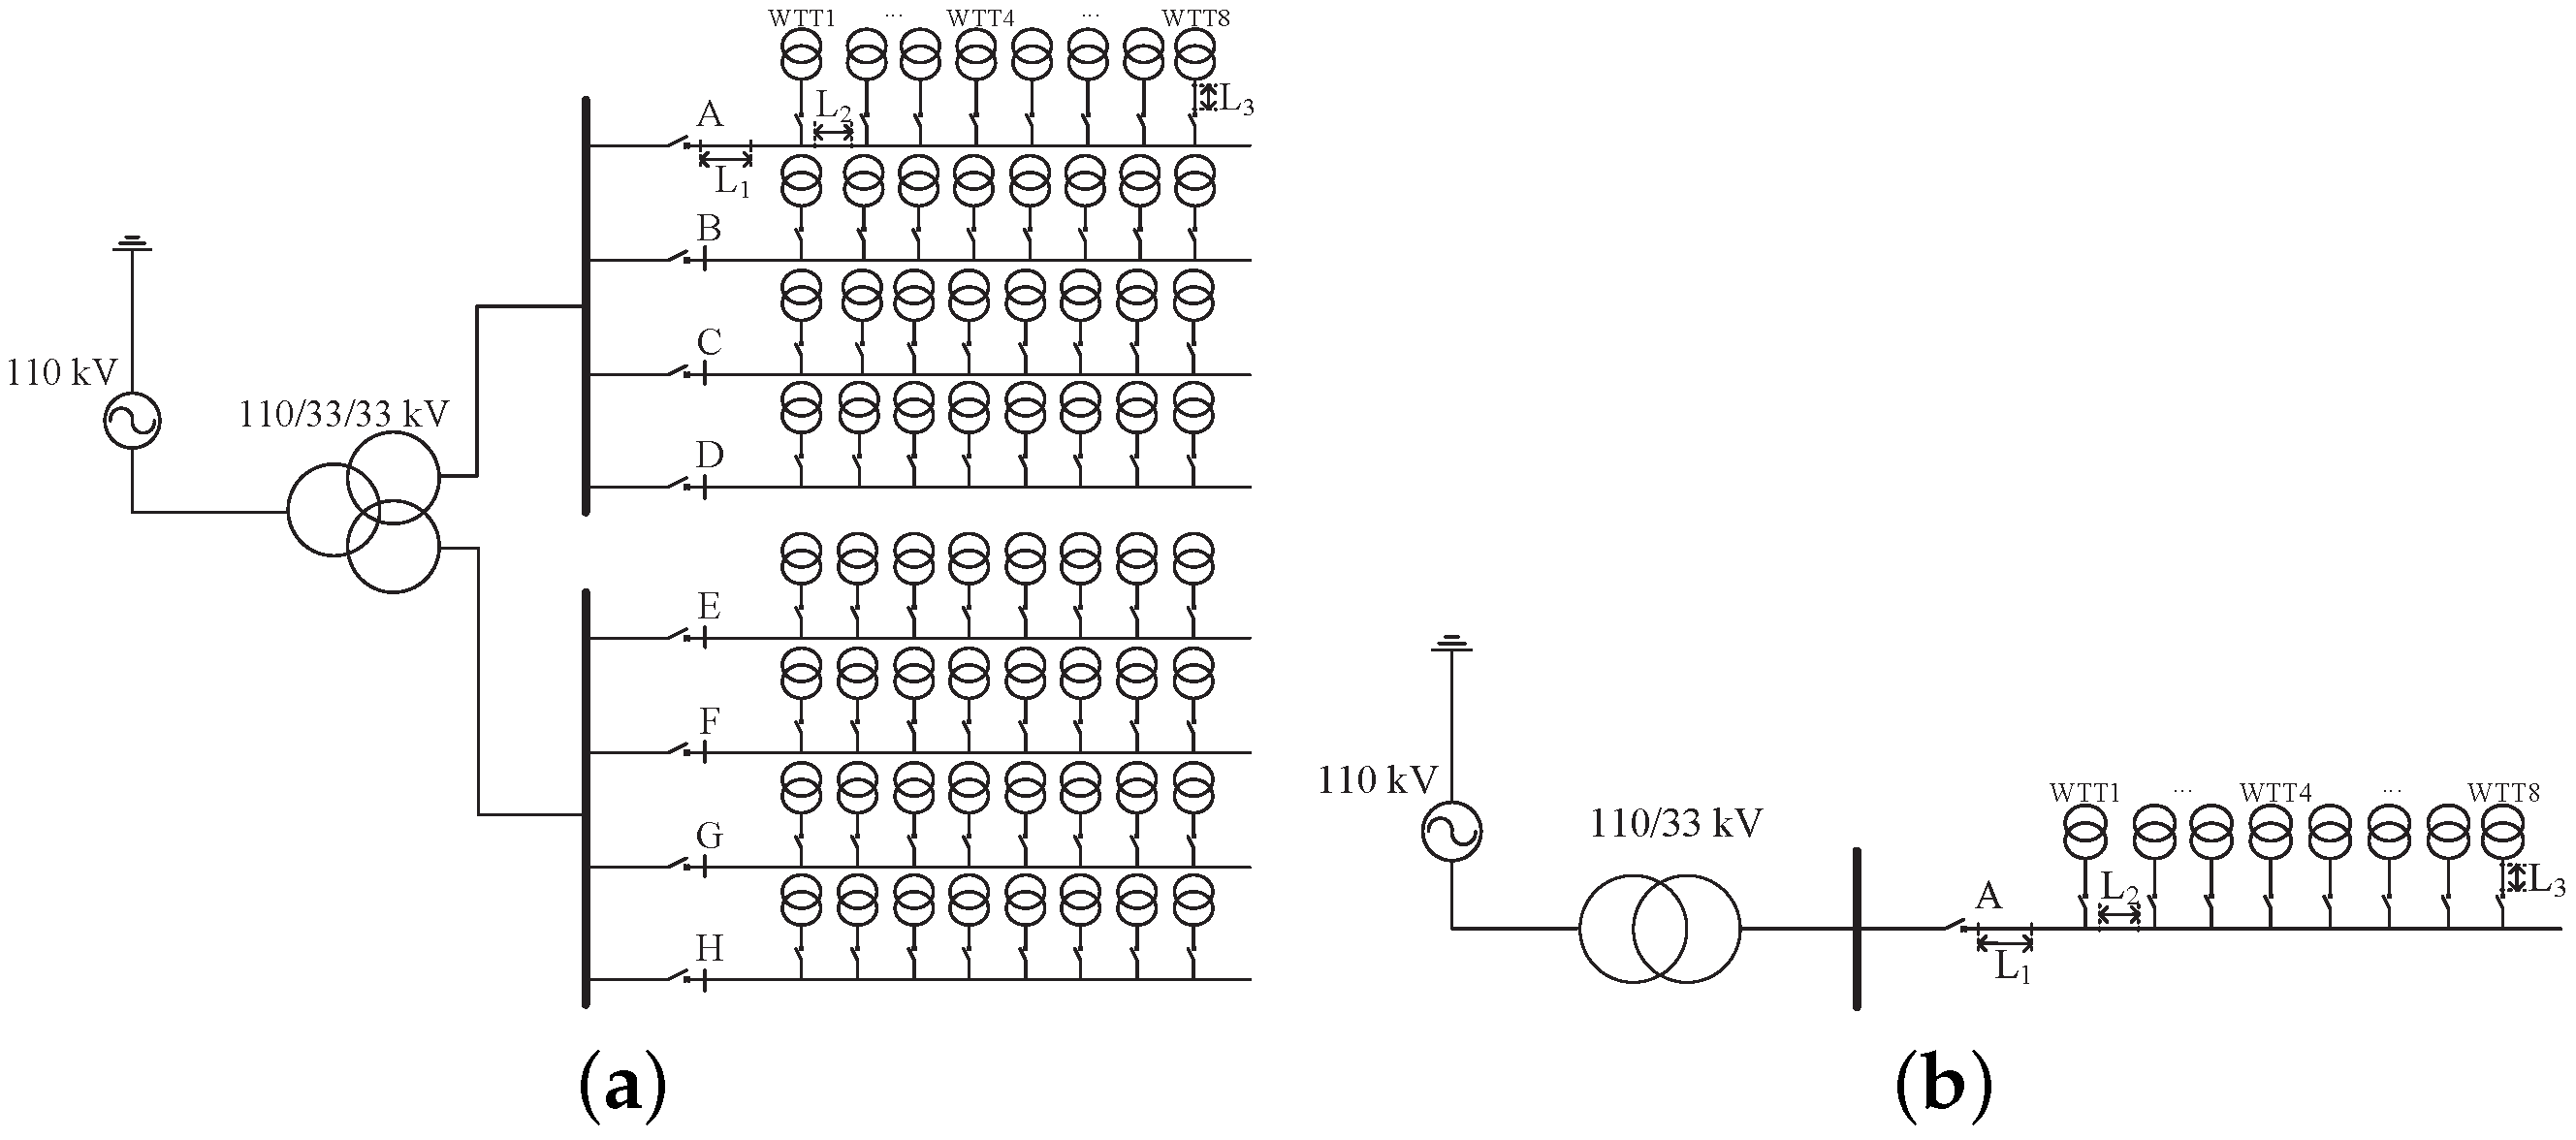
2.1. Layout Description of the Investigated Offshore Wind Farm
2.2. Modeling of Main Components and Entire System of Offshore Wind Farm
2.2.1. Modeling of Vacuum Circuit Breakers
- (1)
- Current choppingCurrent chopping is a phenomena that often leads to overvoltages, which occurs when small capacitive and inductive currents are interrupted. The value of the chopping level depends not only on the type of contact material used in a breaker but also on the level and form of interrupted currents. The current chopping level for VCBs usually varies between 3 A and 8 A [17].
- (2)
- Dielectric withstandWhen the contacts of VCB close, the dielectric strength (DS) of the vacuum gap starts to decrease. When the transient recovery voltage (TRV) exceeds the DS, prestrikes occur. The recovery of DS is modeled based on Equation (1) provided by [19]. It shows a linear relationship between the value of DS () and the time (t):where A is the rate of rise of DS and B is breaker TRV just before current zero, is the maximum dielectric strength that the breaker can withstand. Thereinto, is the amplitude factor, is the first pole to clear factor, and is the rated breaker voltage.
- (3)
- High frequency (HF) current interruptionHF currents occur after a reignition of arc, which is superimposed on the power frequency current through the arc. The changing rate of HF current (di/dt) at the zero crossing point determines whether a VCB can interrupt the current successfully or not, the critical value of which represents the quenching capability of the VCB. In this study, the method proposed by Glinkowski [18] is adopted to determine the quenching capability of a VCB . The typical equation is shown below:where is the moment of contact separation, C is the slope of linear equation and D is the intercept of linear equation.
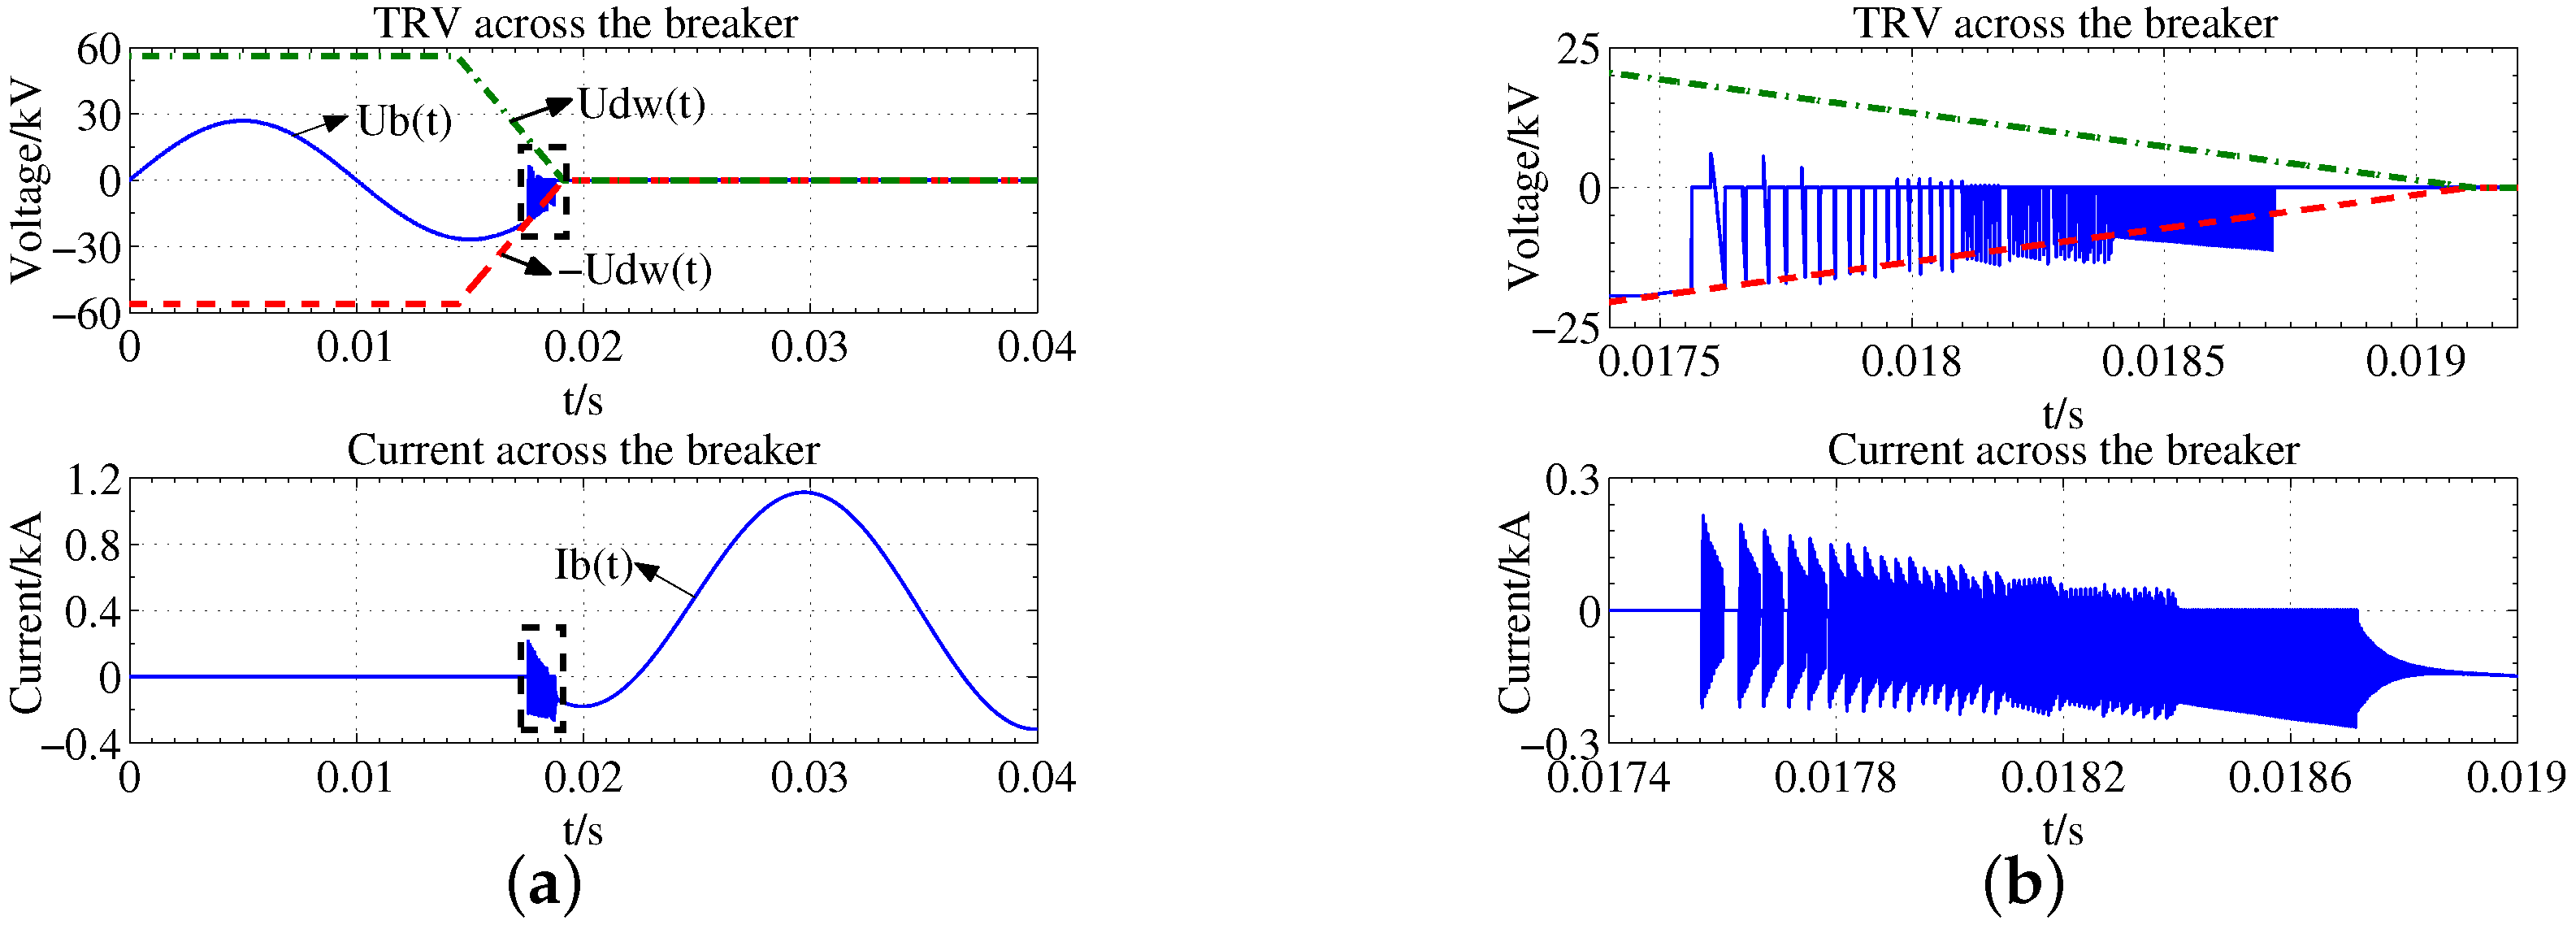
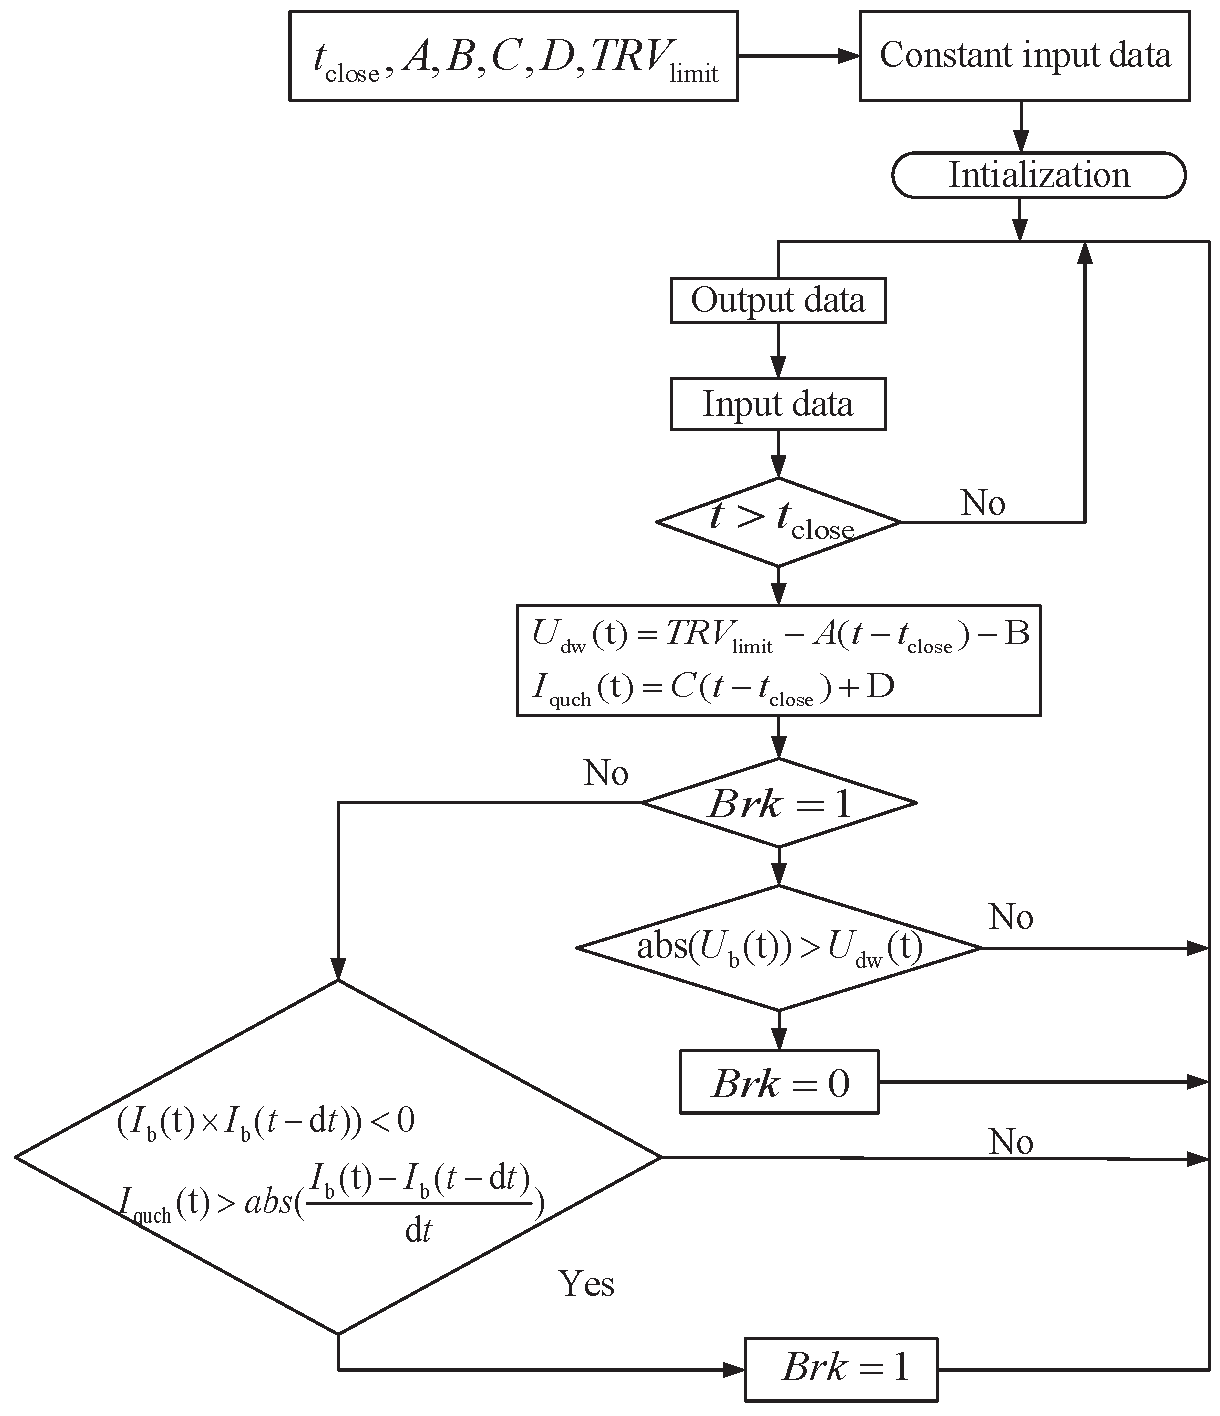
- The switch is open;
- The simulation time is greater than the operating time;
- The voltage across the VCB () exceeds the dielectric ability of VCB ();
- The current across the VCB () is at the zero crossing point, i.e., . At the same time is greater than the absolute of the change rate of current .
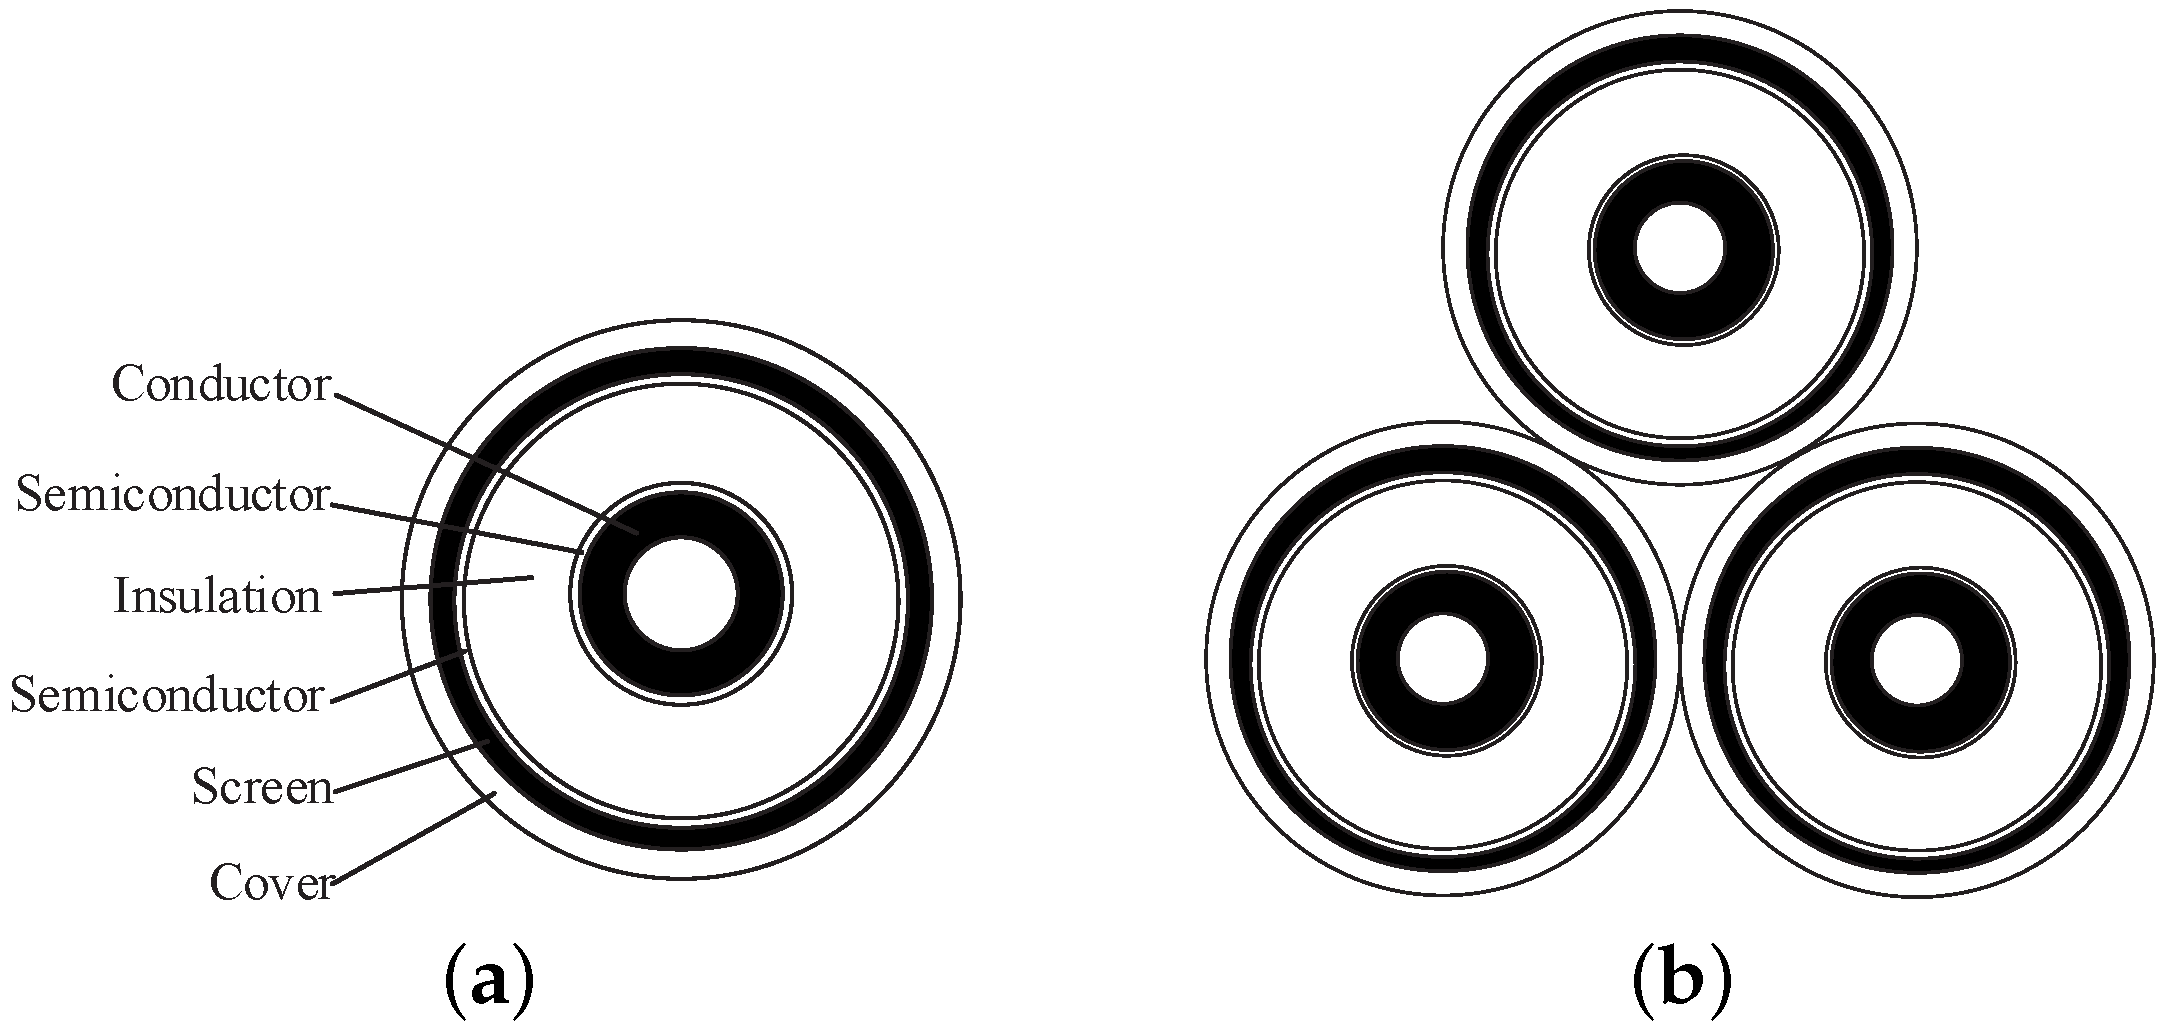
2.2.2. Modeling of Submarine Cables
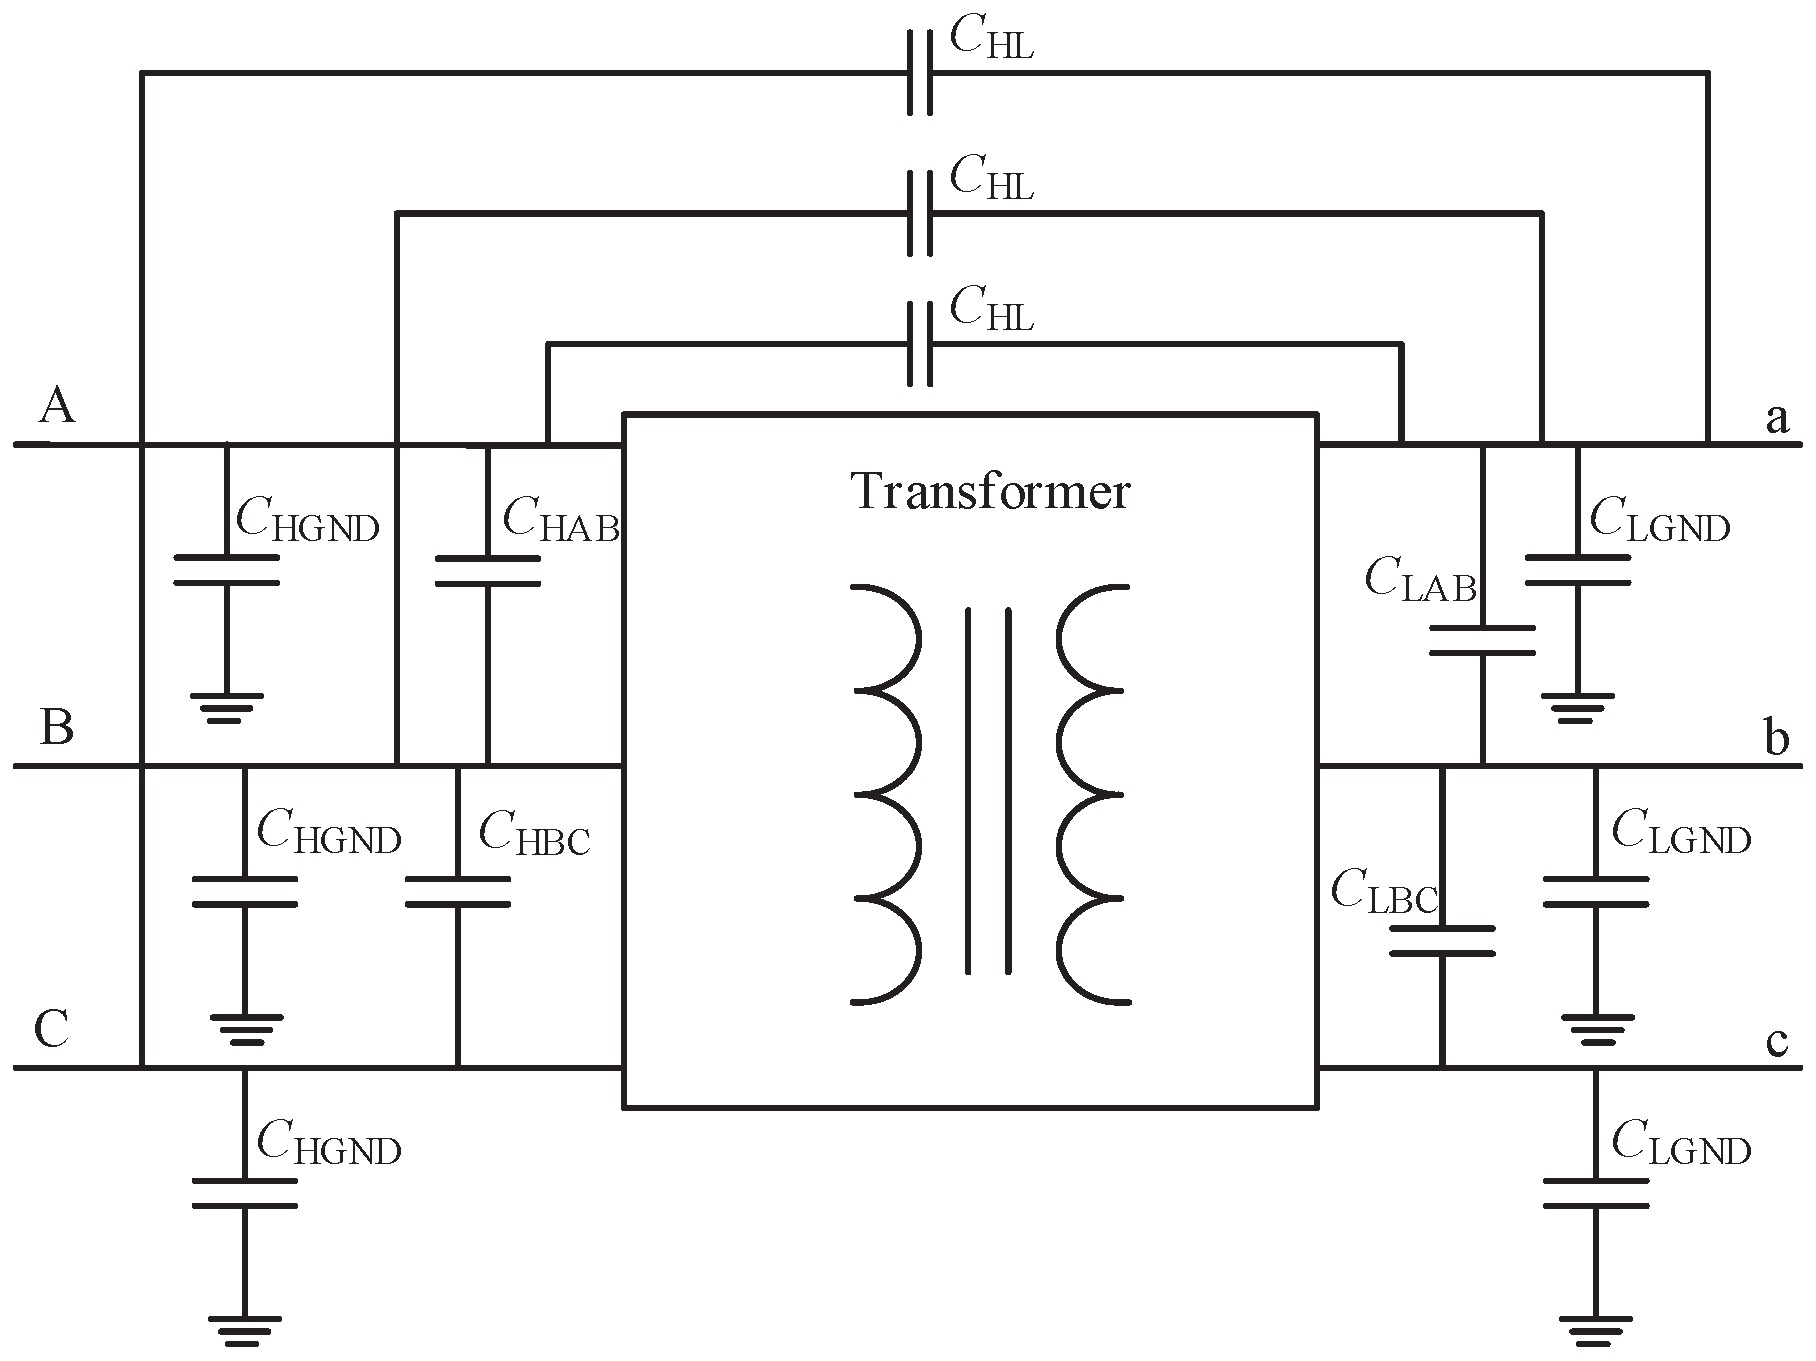
2.2.3. Modeling of Wind Turbine Transformers
3. Investigation on Switching Transient Overvoltages in An Offshore Wind Farm
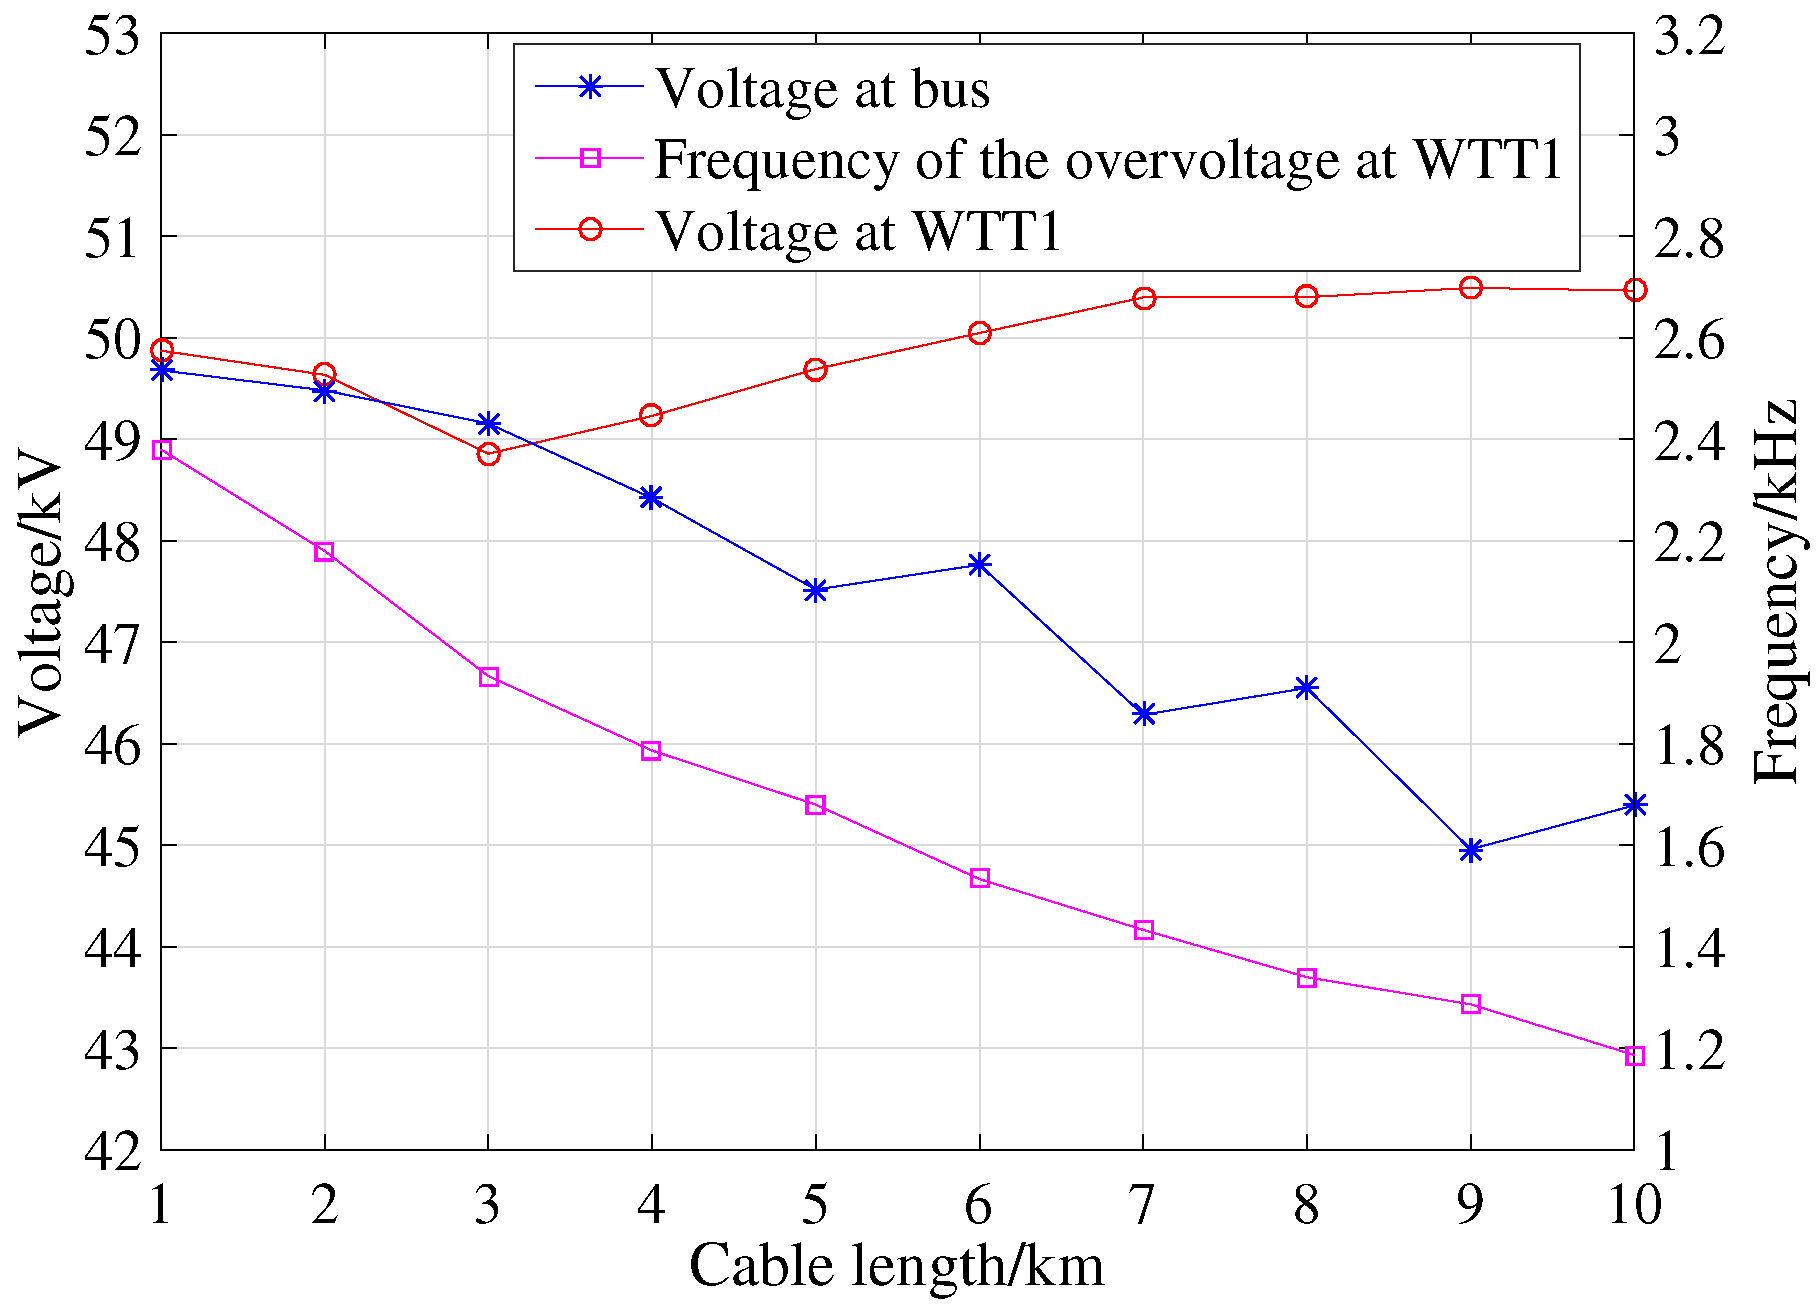
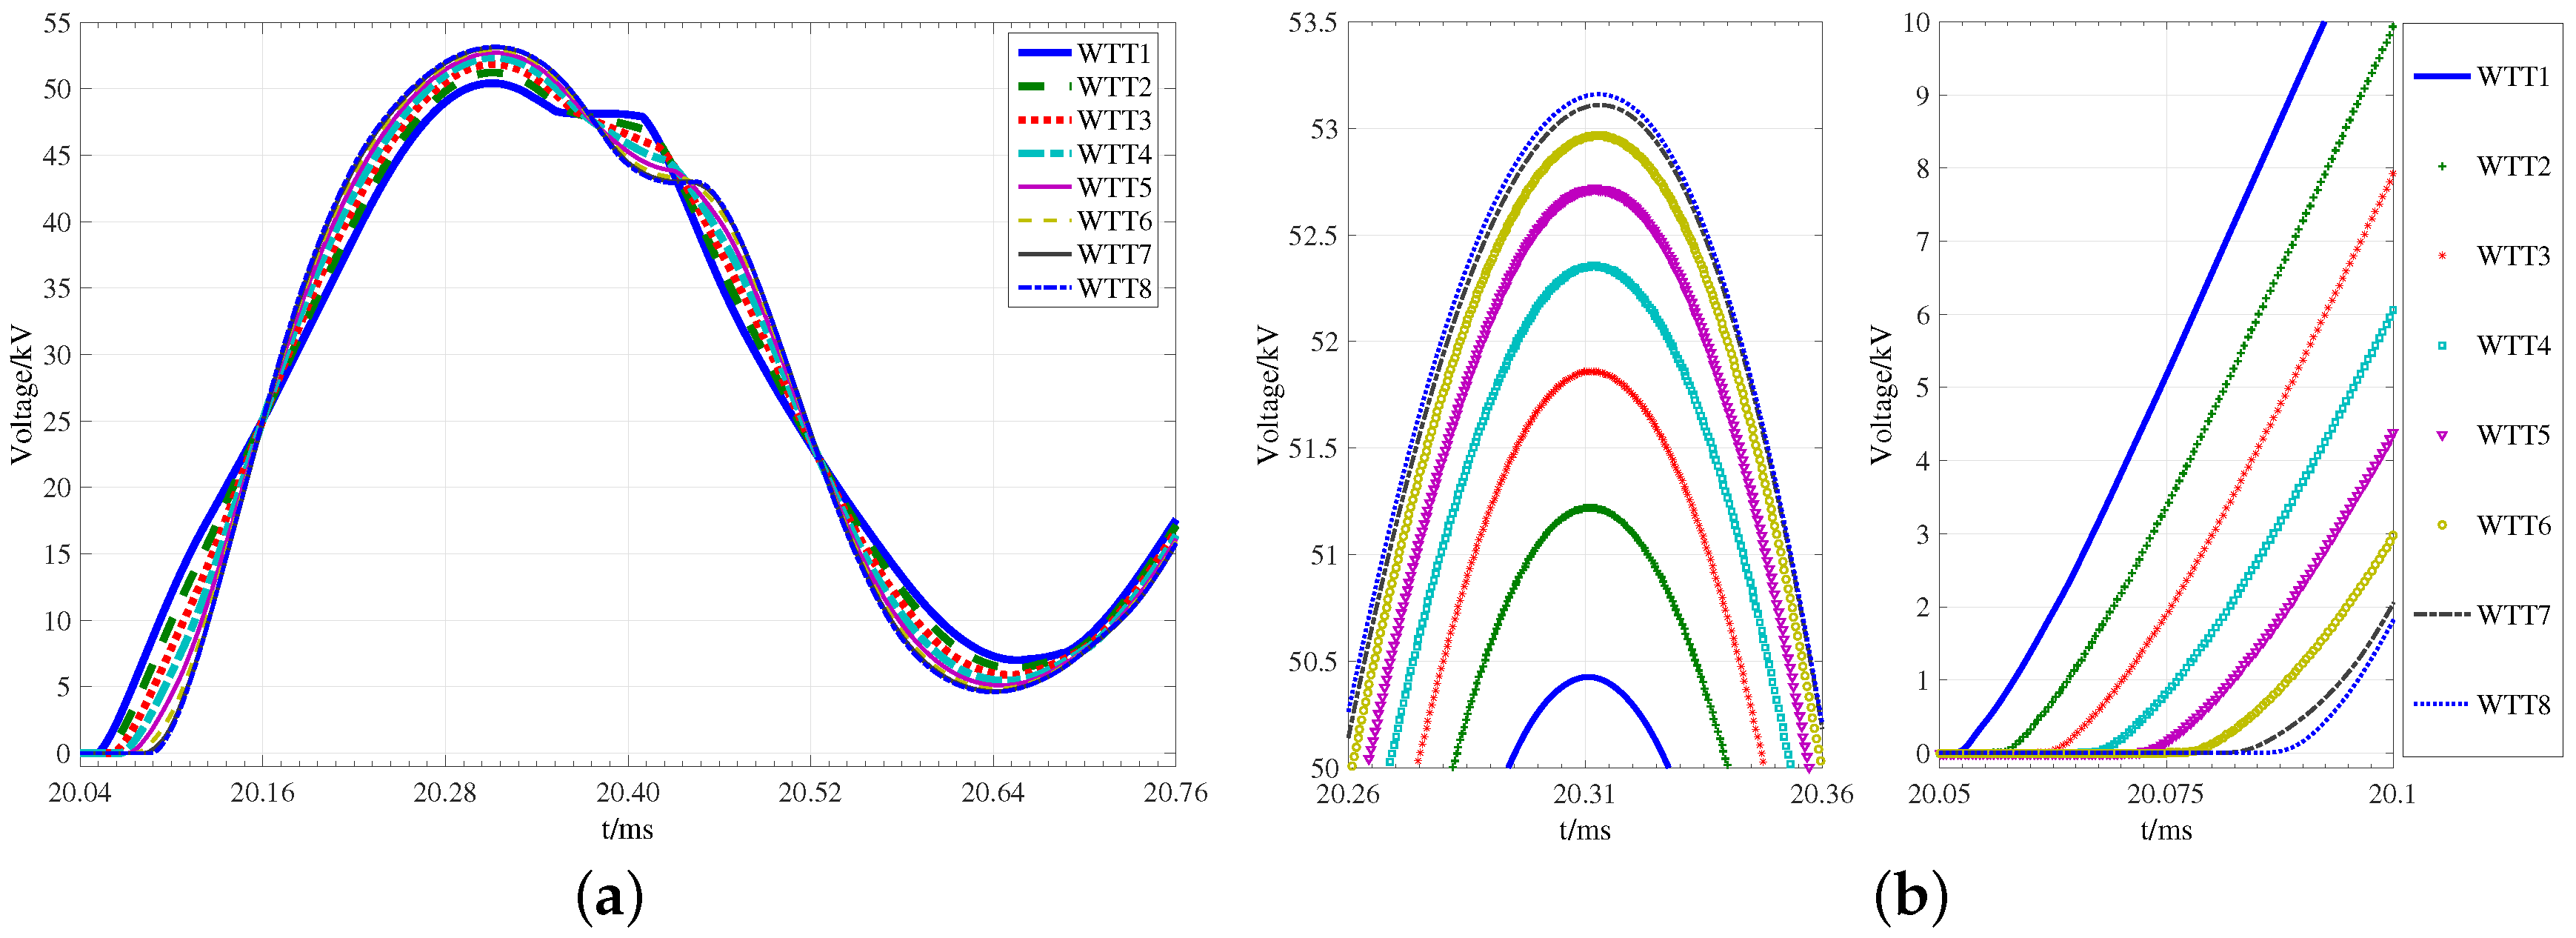
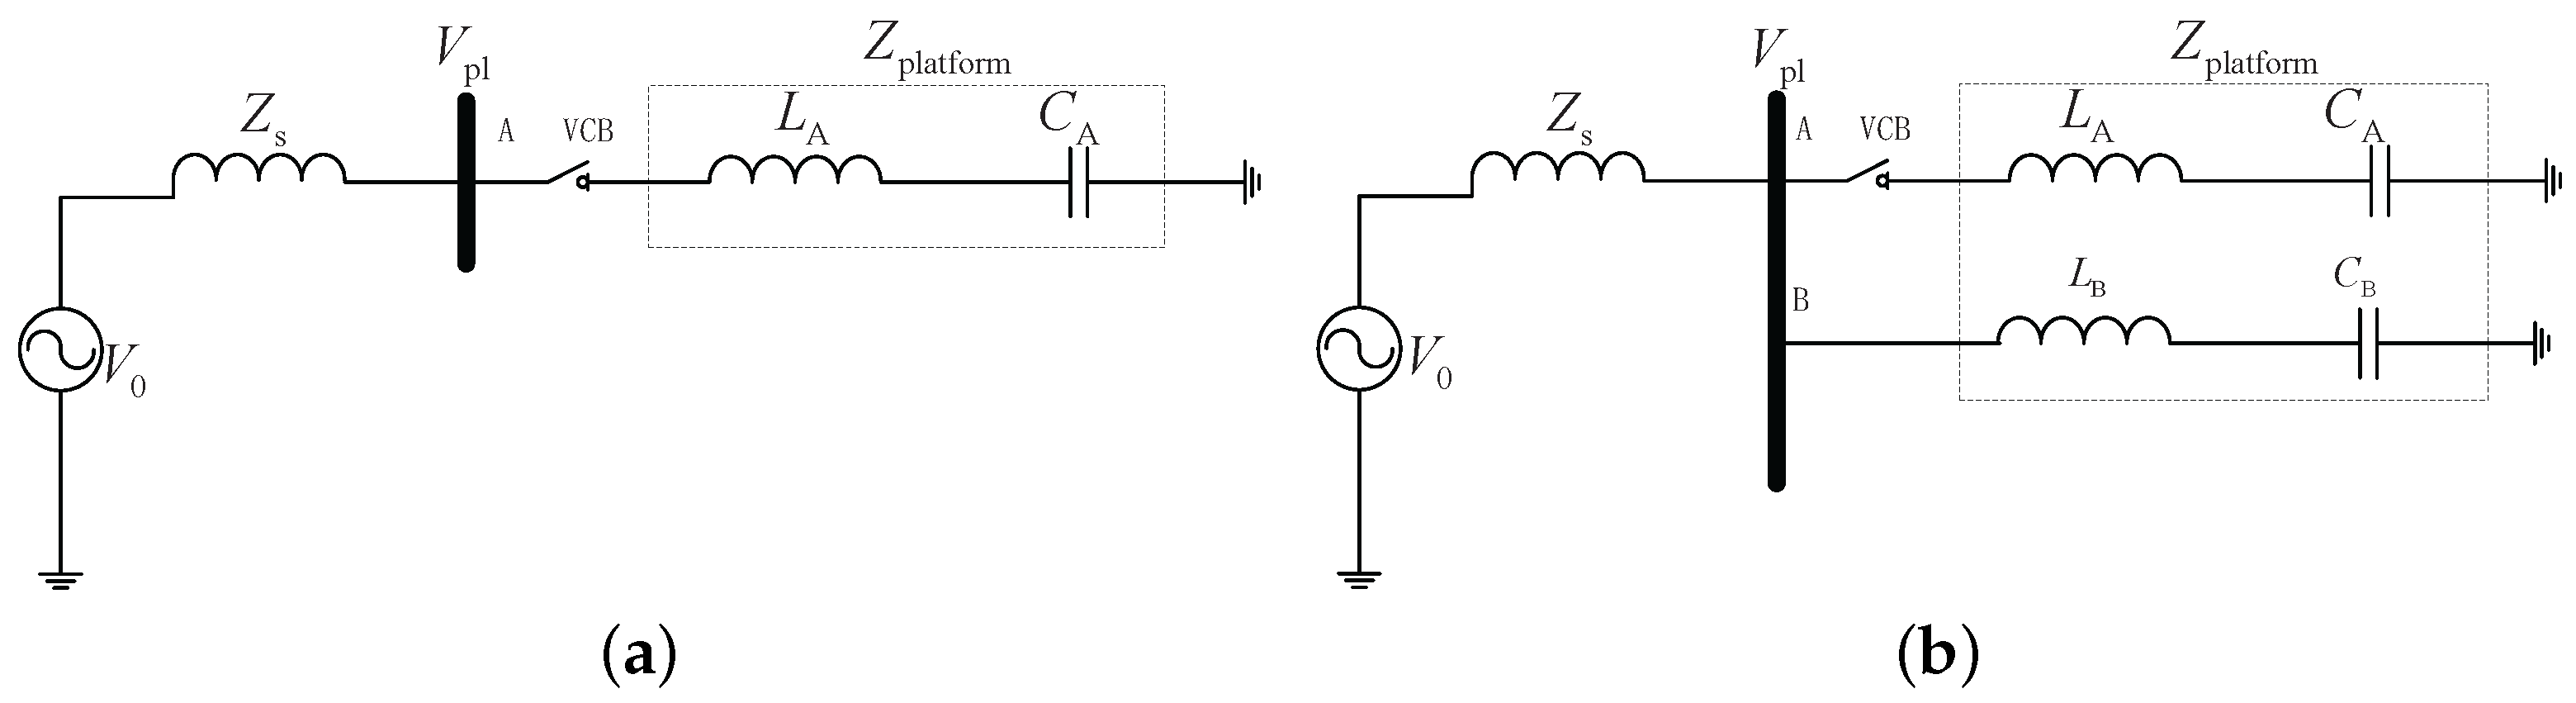
- Overvoltage comparison of energization on feeder with different cable length .
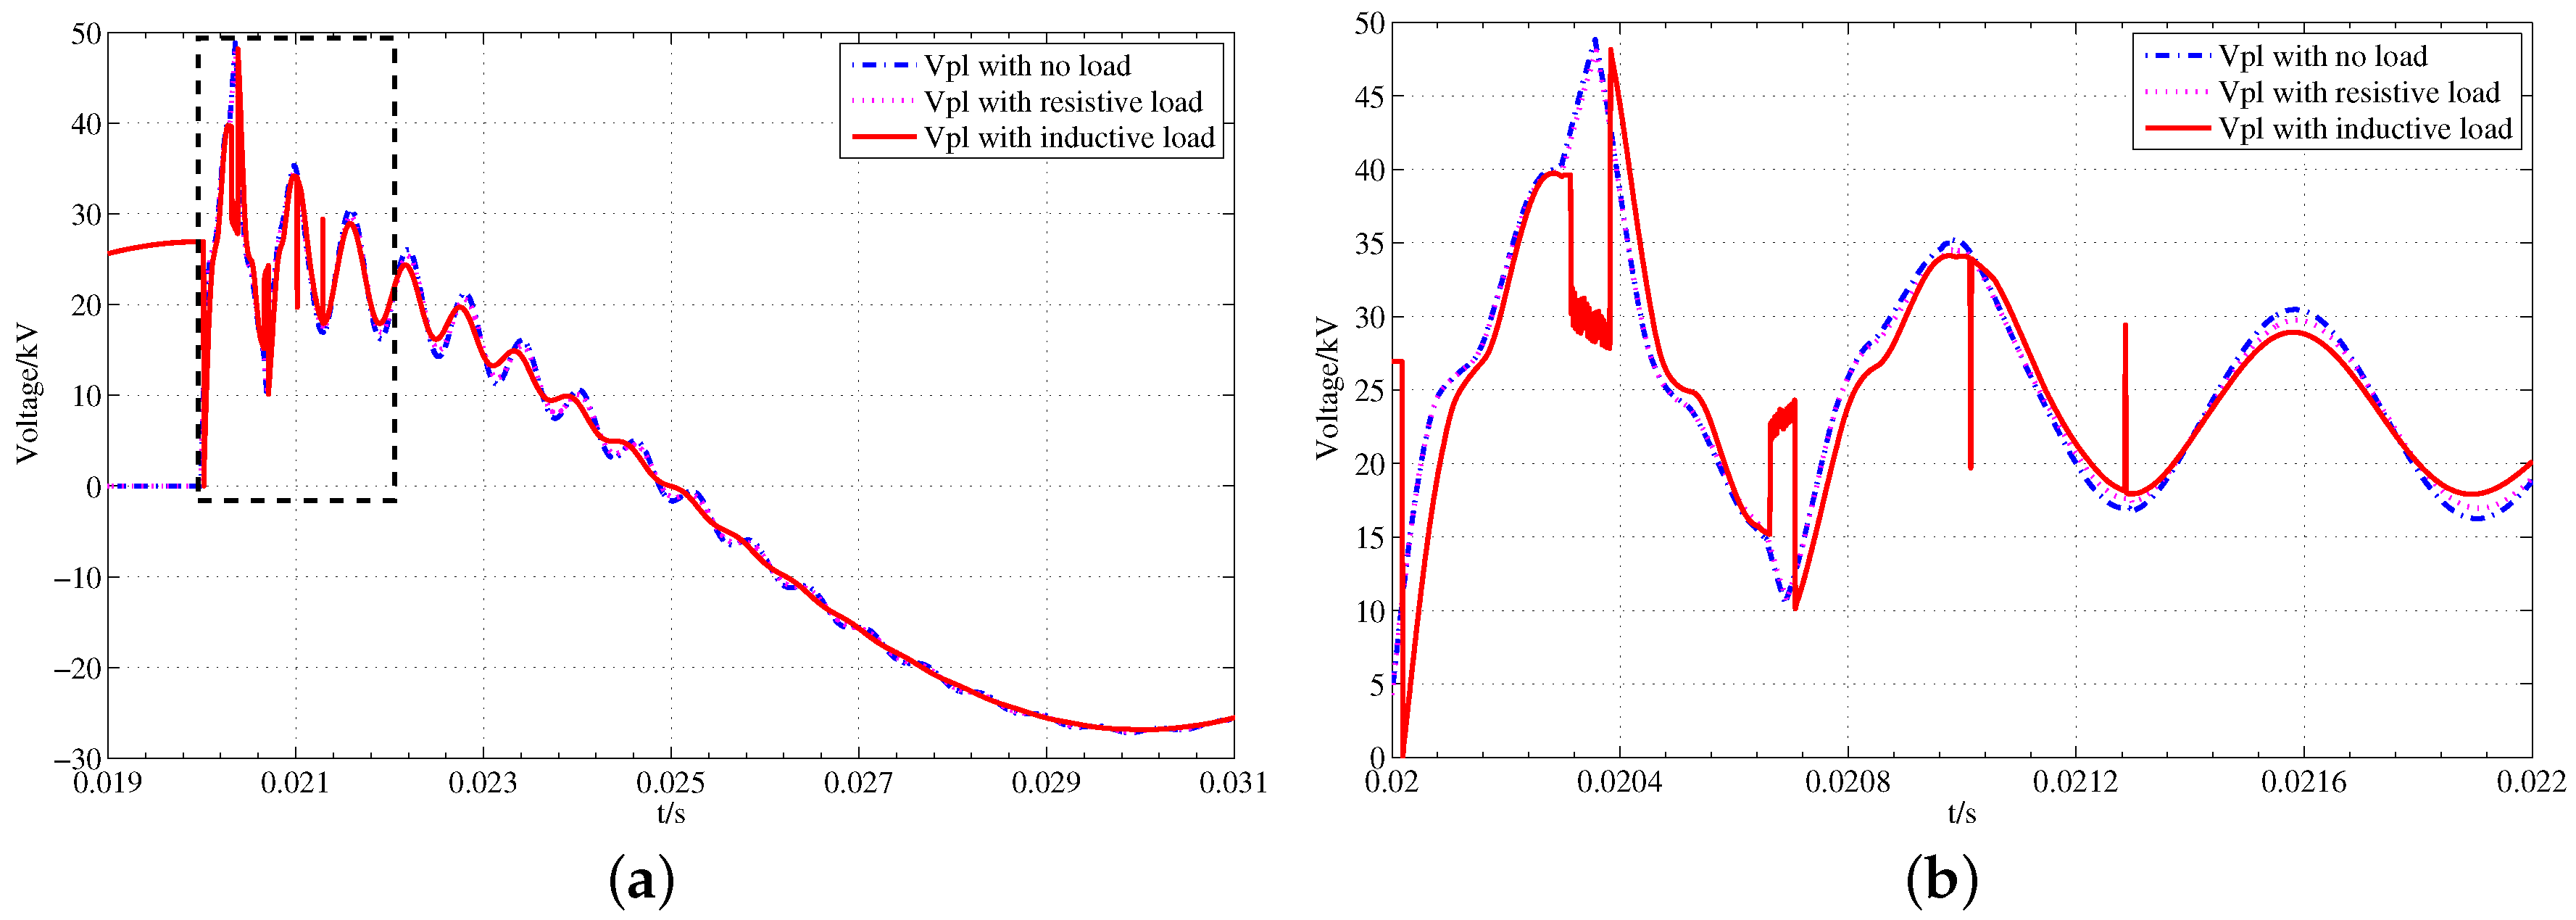
- Overvoltage comparison of energization on the feeder root A under no-load, inductive load and resistive load.
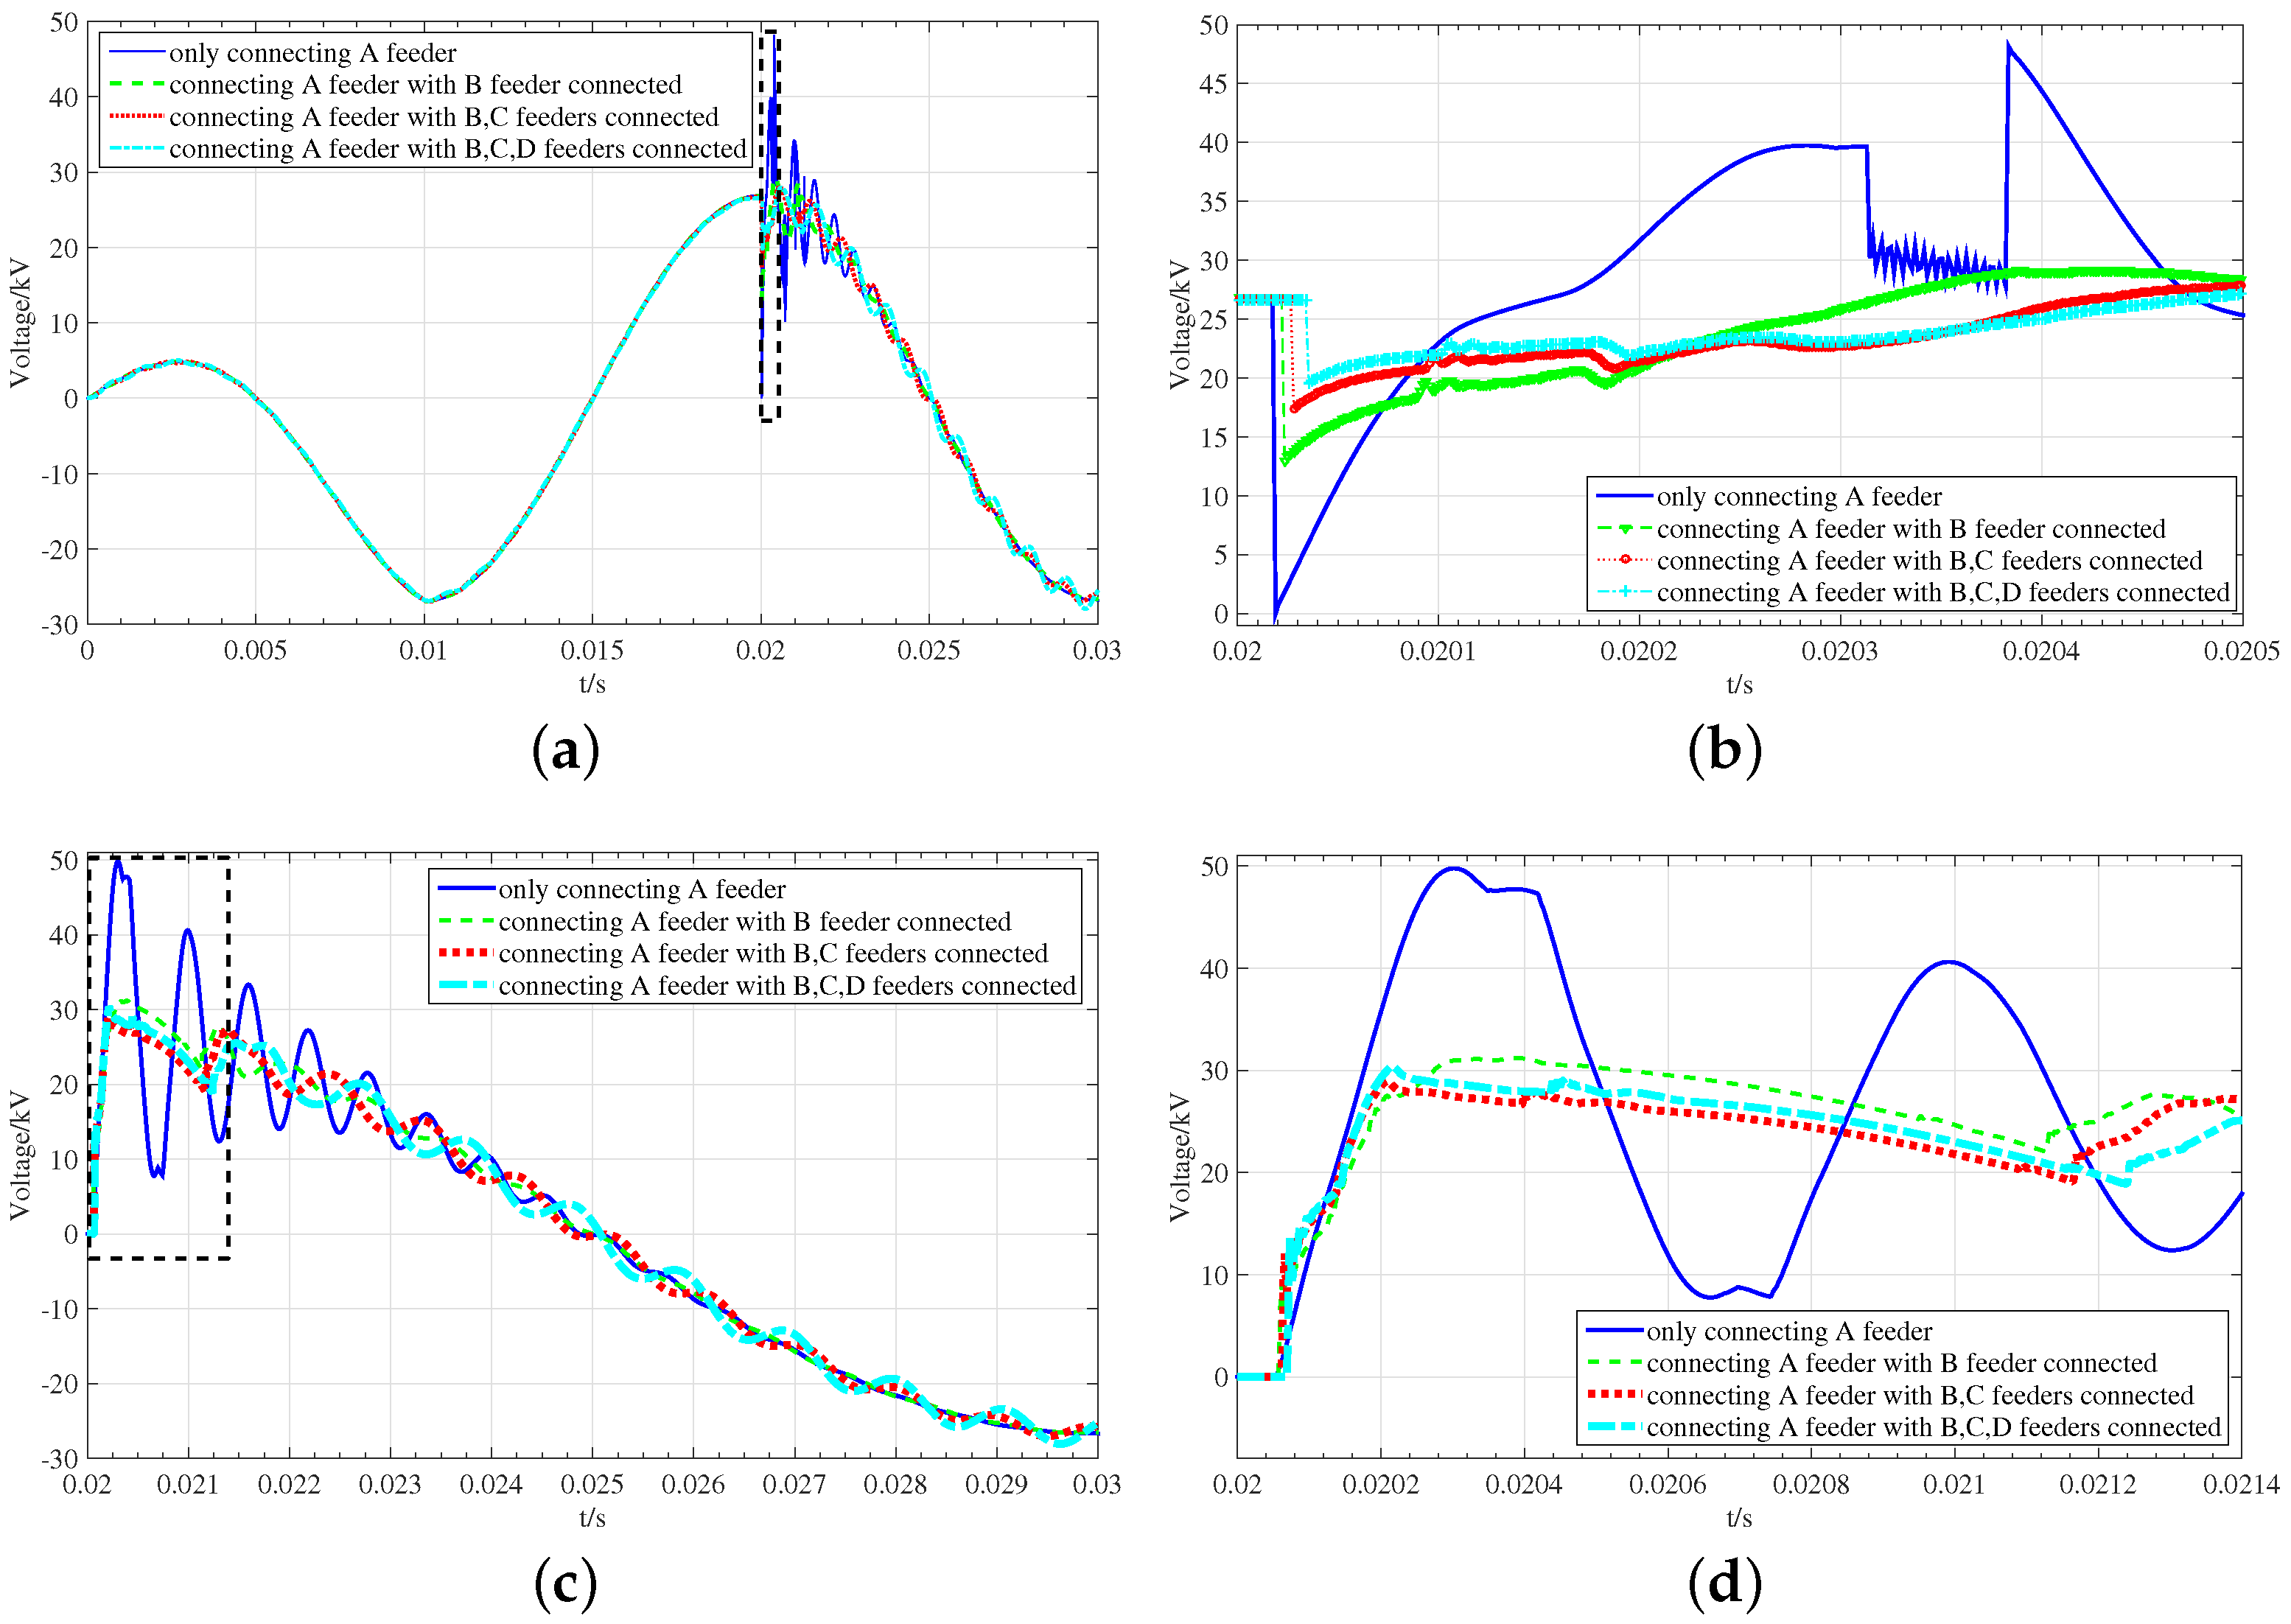
- Overvoltage comparison of energization of feeder A with different number of connected feeders under inductive load.
3.1. Effect of Cable Length with Only One Feeder Connected
3.2. Energization with Different Load Types
3.3. Energizing One Feeder with Different Number of Connected Feeders
4. Overvoltage Mitigation Methods for Suppressing Switching Overvoltage in An Offshore Wind Farm
4.1. Mitigation Methods to Suppress Switching Transient Overvoltage
- (1)
- Surge ArresterSurge arresters are normally connected in parallel to protected equipment. Surge arresters provide a momentary path to the earth, thus limit the peak value of overvoltage [21]. However, they do not affect the rate of rise of voltage. In this case, if no other protection devices are connected, the voltage escalation may exceed the basic insulation level. In order to limit the rate of voltage rise, surge capacitors and RC filters are utilized. Additional capacitance are employed to de-tune the resonant circuit formed of the transformer inductance and network capacitance.
- (2)
- Surge CapacitorA surge capacitor is represented by its phase-to-ground capacitance, which is connected in parallel to the circuit as termination of cable. It is used to reduce the amplitude of voltage and , caused by prestrikes and reignitions, as well as the frequency oscillation in the load side [32].
- (3)
- RC FilterRC filters are composed of a series connected damping resistor and a capacitor, which are used to prevent wave reflections and to dampen HF transient oscillation caused by a steep-front voltage [33]. It is connected in parallel to the main circuit and is better to be connected at the end of a cable. Generally the resistance of its resistor should equal the surge impedance of the cable. The capacitance of the capacitor should be larger than the capacitance of the cable. Although from the voltage mitigation point, this solution has many benefits, it has some technical and economical limitations.
- (4)
- Smart ChokeRecent years, a new overvoltage mitigation method was proposed by ABB, which comprises a set of parallel RL filters series connected at the upstream of a protected transformer [14,34]. Generally, it is complemented with phase-to-ground capacitance of the transformer, which forms a low-pass filter. At 50/60 Hz, it behaves like a very small impedance (almost transparent) in order to provide a minimum voltage drop. It is reported that it can reduce , limit overvoltage levels and decrease the number of wave reflections. For designing parameters of a smart choke, a satisfactory performance is normally achieved when its damping resistor value matches the surge impedance of submarine cable. In this study, the damping resistor is set about 25–50 Ω, and as a result the magnetic ring provides an equivalent inductance value ranging from 0.6 mH to 1.5 mH. Based on the above parameter setting, the smart choke can provide a satisfactory damping effect as discussed in [35].
4.2. Simulation Results and Discussions
- (1)
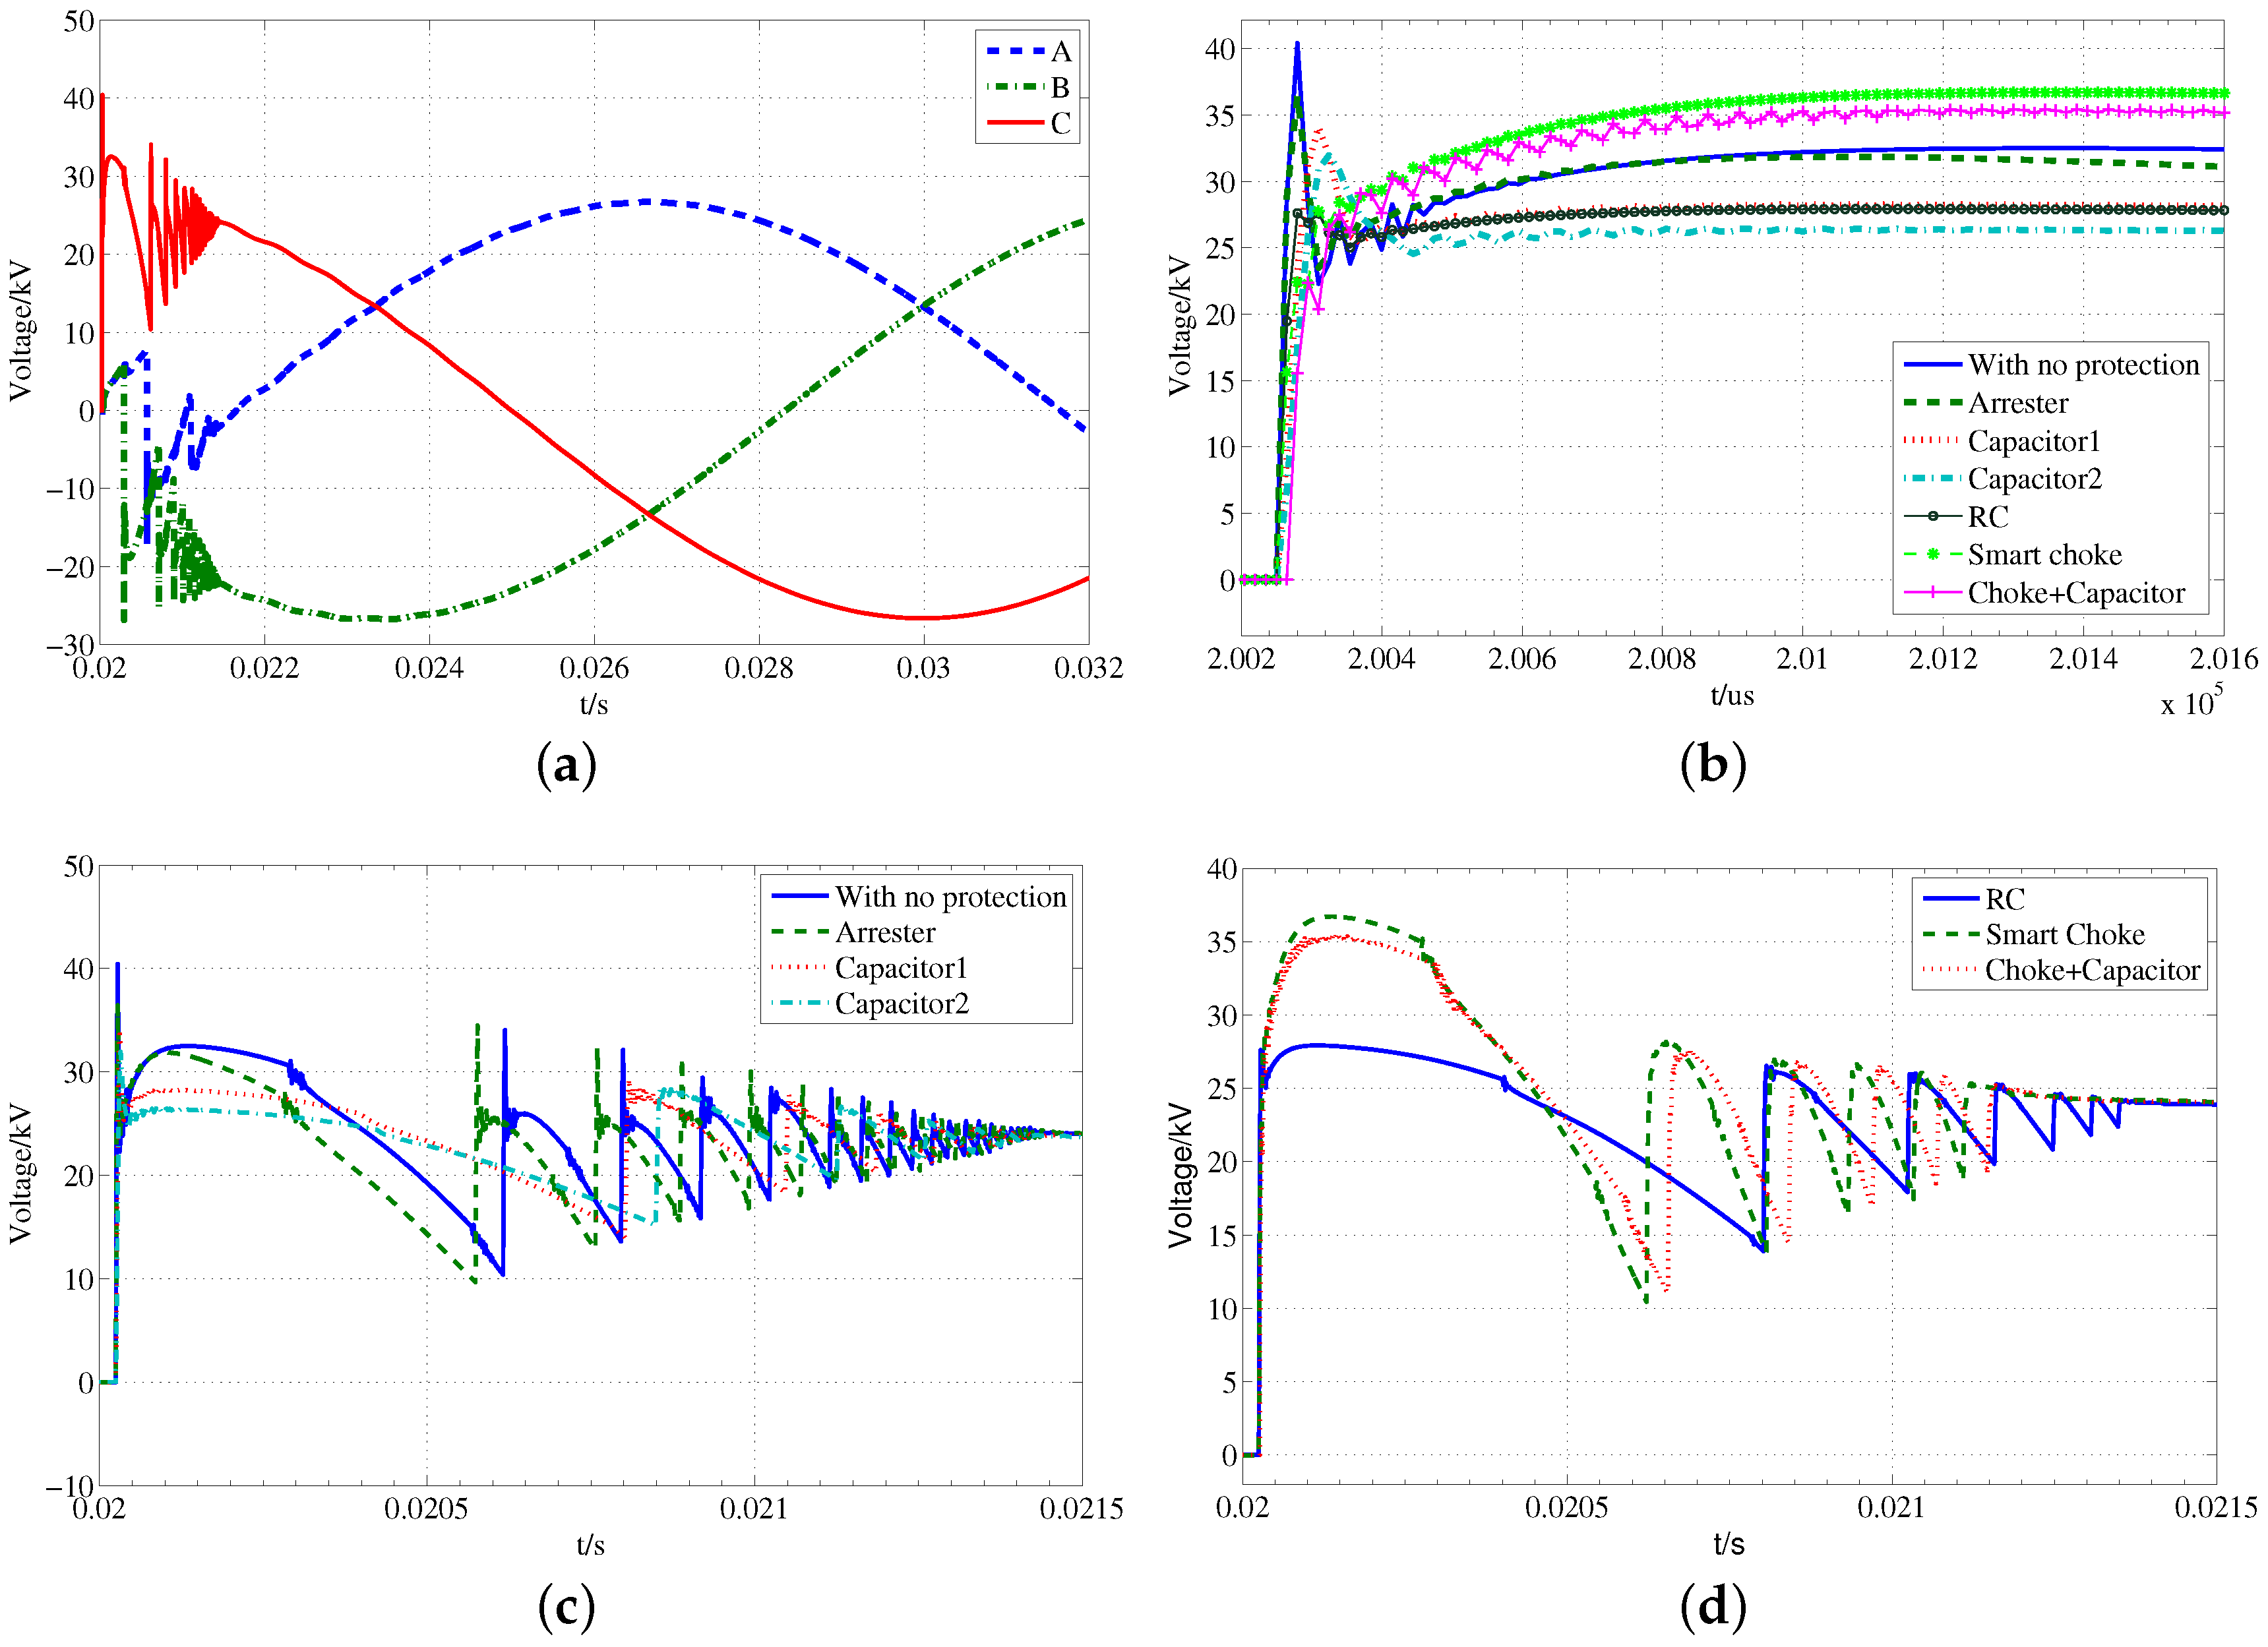
- Surge arresters can help to decrease the extreme overvoltages, and the magnitude is reduced from 40.42 kV to 36.45 kV, but it is not sufficient. Besides, is almost the same as the cases without surge arresters, with a value of 13.95 kV/s.
- (2)
- Two surge capacitors with different values are introduced to form a low pass filter combined with the surge impedance of cables, and both the voltage magnitude and are decreased, while the oscillation frequency is also reduced. However, due to the self–oscillating and the interaction with the impedance of the connecting cable, some resonant points are formed as shown in Figure 11c, which may result in hazards to related electrical components.
- (3)
- RC filters have a satisfactory mitigation effect on the magnitude, but have an undesirable effect on the rise time. It is also shown that HF oscillation is effectively damped.
- (4)
- When a smart choke is employed, it is shown that the peak value reduction of voltage is not remarkable and for this case is 36.71 kV, however the reduction of rise time and is very remarkable (more than 10 times) and for this case are 31.28 s and 0.94 kV/s, respectively.
- (5)
- When a small capacitor complements the protection of the choke, is reduced to a safe limit, and the amplitude of the HF overvoltage and the number of reignitions are decreased remarkably.
5. Conclusions
Acknowledgments
Author Contributions
Conflicts of Interest
References
- Zhang, T.; Sun, L.X.; Zhang, Y. Study on switching overvoltage in offshore wind farms. IEEE Trans. Appl. Supercond. 2014, 24. [Google Scholar] [CrossRef]
- Sweet, W. Danish wind turbines take unfortunate turn. IEEE Spectr. 2004, 41, 30–34. [Google Scholar] [CrossRef]
- Stein, G.M. A study of the initial surge distribution in concentric transformer windings. IEEE Trans. Power Appar. Syst. 1964, 83, 877–893. [Google Scholar] [CrossRef]
- Christensen, L.S.; Ulletved, M.J.; Sørensen, P.E.; Sørensen, T.; Olsen, T.; Nielsen, H.K. GPS synchronized high voltage measuring system. In Proceedings of the Risø National Laboratory Proceedings, Roskilde, Denmark, 1–2 November 2007.
- Manitoba HVDC Research Centre. PSCAD/EMTDC User’s Manual. 2007. Available online: http://hvdc.ca/pscad/ (accessed on 9 December 2016).
- ATP User Group. Alternative Transients Programs ATP–EMTP. 2007. Available online: http://www.emtp.org (accessed on 9 December 2016).
- Arana, I.; Holbøll, J.; Sørensen, T.; Nielsen, A.H.; Sørensen, P.; Holmstrøm, O. Comparison of measured transient overvoltages in the collection grid of Nysted offshore wind farm with EMT Simulations. In Proceedings of the International Conference on Power Systems Transients, Kyoto, Japan, 3–6 June 2009.
- Glasdam, J.; Bak, C.L.; Hjerrild, J. Transient studies in large offshore wind farms employing detailed circuit breaker representation. Energies 2012, 5, 2214–2231. [Google Scholar] [CrossRef]
- Ghafourian, S.M.; Arana, I.; Holboll, J.; Sorensen, T.; Popov, M.; Terzija, V. General analysis of vacuum circuit breaker switching overvoltages in offshore wind farms. IEEE Trans. Power Deliv. 2016, 31, 2351–2359. [Google Scholar] [CrossRef]
- Badrzadeh, B.; Hogdahl, M.; Isabegovic, E. Transients in wind power plants–Part I: Modeling methodology and validation. IEEE Trans. Ind. Appl. 2012, 48, 794–807. [Google Scholar] [CrossRef]
- Liljestrand, L.; Sannino, A.; Breder, H.; Thorburn, S. Transients in collection grids of large offshore wind parks. Wind Energy 2008, 11, 45–61. [Google Scholar] [CrossRef]
- Abdulahovic, T. Analysis of High-Frequency Electrical Transients in Offshore Wind Parks. Ph.D. Thesis, Department of Electrical Power Engineering, Chalmers University of Technology, Gothenburg, Sweden, 2011. [Google Scholar]
- Awad, E.A.; Badran, E.A.; Youssef, F.M.H. Mitigation of temporary overvoltages in weak grids connected to DFIG-based wind farms. J. Electr. Syst. 2014, 10, 431–444. [Google Scholar]
- Smugala, D.; Piasecki, W.; Ostrogorska, M.; Florkowski, M.; Fulczyk, M.; Granhaug, O. Wind turbine transformers protection method against high-frequency transients. IEEE Trans. Power Deliv. 2015, 30, 853–860. [Google Scholar] [CrossRef]
- Liu, B.; Tang, W.H.; Chen, X.D.; Wu, Q.H. Modeling of transient overvoltages in wind power plants. In Proceedings of the 2014 IEEE Asia-Pacific Power and Energy Engineering Conference, Hong Kong, China, 7–10 December 2014.
- Wang, J.D.; Li, G.J.; Qin, H. Simulation of switching over-voltages in the collector networks of offshore wind farm. Autom. Electr. Power Syst. 2010, 2, 104–107. [Google Scholar]
- Helmer, J.; Lindmayer, M. Mathematical modeling of the high frequency behavior of vacuum interrupters and comparison with measured transients in power systems. In Proceedings of the 17th International Symposium on Discharges and Electrical Insulation in Vacuum, Piscatawy, NJ, USA, 5–7 June 1996.
- Glinkowski, M.T.; Gutierrez, M.R.; Braun, D. Voltage escalation and reignition behavior of vacuum generator circuit breakers during load shedding. IEEE Trans. Power Deliv. 1997, 12, 219–226. [Google Scholar] [CrossRef]
- Popov, M.; Van Der Sluis, L.; Paap, G.C. Investigation of the circuit breaker reignition overvoltages caused by no-load transformer switching surges. Eur. Trans. Electr. Power 2001, 11, 413–422. [Google Scholar] [CrossRef]
- Lerche, M.M. Circuit Breaker Characteristics in Medium Voltage Equipment under Various Network Configurations. Master’s Thesis, Department of Electrical Engineering, Technical University of Denmark, Lyngby, Denmark, 2009. [Google Scholar]
- Xue, H.Y.; Popov, M. Analysis of switching transient overvoltages in the power system of floating production storage and offloading vessel. Electr. Power Syst. Res. 2014, 115, 3–10. [Google Scholar] [CrossRef]
- Devgan, M. Investigation of High Frequency Switching Transients on Wind Turbine Step up Transformers. Master’s Thesis, Department of Electrical and Computer Engineering, University of Waterloo, Waterloo, ON, Canada, 2015. [Google Scholar]
- Electrical Installations in Ships–Part 503: Special Features–AC Supply Systems with Voltages in the Range of above 1 kV Up to and Including 15 kV; IEC 60092–354; International Electrotechnical Commission: Geneva, Switzerland, 2007.
- Gustavsen, B. Panel session on data for modeling system transients insulated cables. In Proceedings of the IEEE Power Engineering Society Winter Meeting, Columbus, OH, USA, 28 January–1 February 2001.
- Morched, A.; Marti, L.; Ottevangers, J. A high frequency transformer model for the EMTP. IEEE Trans. Power Deliv. 1993, 8, 1615–1626. [Google Scholar] [CrossRef]
- Popov, M. Switching Three-Phase Distribution Transformers with a VCB: Analysis of Overvoltages and the Protection Equipment. Ph.D. Thesis, Department of Faculty of Electrical Engineering, Delft University of Technology, Delft, The Netherlands, 2002. [Google Scholar]
- Das, J.C. Surges transferred through transformers. In Proceedings of the Pulp and Paper Industry Technical Conference, Amsterdam, The Netherlands, 17–21 June 2002.
- Iravani, M.R.; Hassan, I.E.; Keri, A.J.F.; Lee, K.C.; Martinez, J.A.; Morched, A.S.; Mork, B.A.; Parniani, M.; Sarshar, A.; Shirmohammadi, D.; et al. Modelling and analysis guidelines for slow transients. II. Controller interactions; harmonic interactions. IEEE Trans. Power Deliv. 1996, 11, 1672–1677. [Google Scholar] [CrossRef]
- Arana, I.; Hernandez, A.; Thumm, G.; Holbøll, J. Energization of wind turbine transformers with an auxiliary generator in a large offshore wind farm during islanded operation. IEEE Trans. Power Deliv. 2011, 26, 2792–2800. [Google Scholar] [CrossRef]
- Ketabi, A.; Ranjbar, A.M.; Feuillet, R. Analysis and control of temporary overvoltages for automated restoration planning. IEEE Trans. Power Deliv. 2002, 17, 1121–1127. [Google Scholar] [CrossRef]
- Larsson, A. Practical experiences gained at Lillgrund offshore wind farm. In Proceedings of the 7th International Workshop on Large Scale Integration of Wind Power and on tRansmission Networks for Offshore Wind Farms, Madrid, Spain, 26–27 May 2008.
- Transformers-Switchgear-Committee. IEEE Guide to Describe the Occurrence and Mitigation of Switching Transients Induced by Transformers, Switching Device, and System Interaction, No. C57. 142; IEEE Power Energy Society: Piscataway, MJ, USA, 2010. [Google Scholar]
- Reza, M.; Breder, H. Cable System Transient Study: Vindforsk V-110: Experiments with Switching Transients and Their Mitigation in a Windpower Collection Grid Scale Model; Elforsk: Stockholm, Sweden, 2009. [Google Scholar]
- Piasecki, W.; Bywalec, G.; Florkowski, M.; Fulczyk, M.; Furgal, J. New approach towards protecting electrical equipment insulation systems against very fast transients. In Proceedings of the Annual Report–Conference on Electrical Insulation and Dielectric Phenomena, Vancouver, BC, Canada, 14–17 October 2007.
- Smugała, D.; Piasecki, W.; Ostrogórska, M.; Florkowski, M.; Fulczyk, M.; Granhaug, O. New approach to protecting transformers against high frequency transients–wind turbine case study. Prz. Elektrotech. 2013, 89, 186–190. [Google Scholar]


| A(s) | B(kV) | C(s) | D(s) | |
|---|---|---|---|---|
| HV | 17 | 3.4 | −0.034 | 255 |
| MV | 13 | 0.69 | 0.31 | 155 |
| LV | 4.7 | 0.69 | 1 | 190 |
| Geometric Properties | Electromagnetic Properties | ||
|---|---|---|---|
| Cross-section of conductor | 185 | Cross conductor resistivity | m |
| Laying depth | 1 m | Main insulation relative permittivity | 4.1 |
| Diameter of conductor layer | 15.9 mm | Screen resistivity | m |
| Inner/Outer semiconductor layer | 1.5/1 mm | Relative permeability of all media | 1 |
| Thickness of insulation layer | 8 mm | Sheath relative permittivity | 2.3 |
| Diameter of insulation layer | 33.4 mm | Capacitance | 40 F |
| Crossing area of screen layer | 35 | ||
| Outer diameter of cable | 82 mm | ||
| Case | Voltage Peak (kV) | Voltage Drop (kV) | Rise Time (s) | du/dt (kV/s) | Voltage Peak (pu) | Rate of Voltage Change (%) |
|---|---|---|---|---|---|---|
| No Protection | 40.42 | 32.33 | 2.26 | 14.28 | 1.51 | - |
| Surge Arrester | 36.45 | 29.16 | 2.09 | 13.95 | 1.36 | 9.81 |
| Surge Capacitor1 | 34.09 | 27.92 | 4.00 | 6.97 | 1.27 | 15.66 |
| Surge Capacitor2 | 32.00 | 25.60 | 4.66 | 5.49 | 1.20 | 20.82 |
| RC Filter | 27.92 | 22.34 | 2.33 | 9.60 | 1.04 | 30.92 |
| Smart Choke | 36.71 | 29.37 | 31.28 | 0.94 | 1.37 | 9.17 |
| Smart Choke + Capacitor | 35.25 | 28.20 | 26.06 | 1.08 | 1.32 | 12.78 |
© 2016 by the authors; licensee MDPI, Basel, Switzerland. This article is an open access article distributed under the terms and conditions of the Creative Commons Attribution (CC-BY) license (http://creativecommons.org/licenses/by/4.0/).
Share and Cite
Xin, Y.; Liu, B.; Tang, W.; Wu, Q. Modeling and Mitigation for High Frequency Switching Transients Due to Energization in Offshore Wind Farms. Energies 2016, 9, 1044. https://doi.org/10.3390/en9121044
Xin Y, Liu B, Tang W, Wu Q. Modeling and Mitigation for High Frequency Switching Transients Due to Energization in Offshore Wind Farms. Energies. 2016; 9(12):1044. https://doi.org/10.3390/en9121044
Chicago/Turabian StyleXin, Yanli, Bo Liu, Wenhu Tang, and Qinghua Wu. 2016. "Modeling and Mitigation for High Frequency Switching Transients Due to Energization in Offshore Wind Farms" Energies 9, no. 12: 1044. https://doi.org/10.3390/en9121044