1. Introduction
A unique system for wind generation known as the solar chimney or solar tower has been proposed by Schlaich [
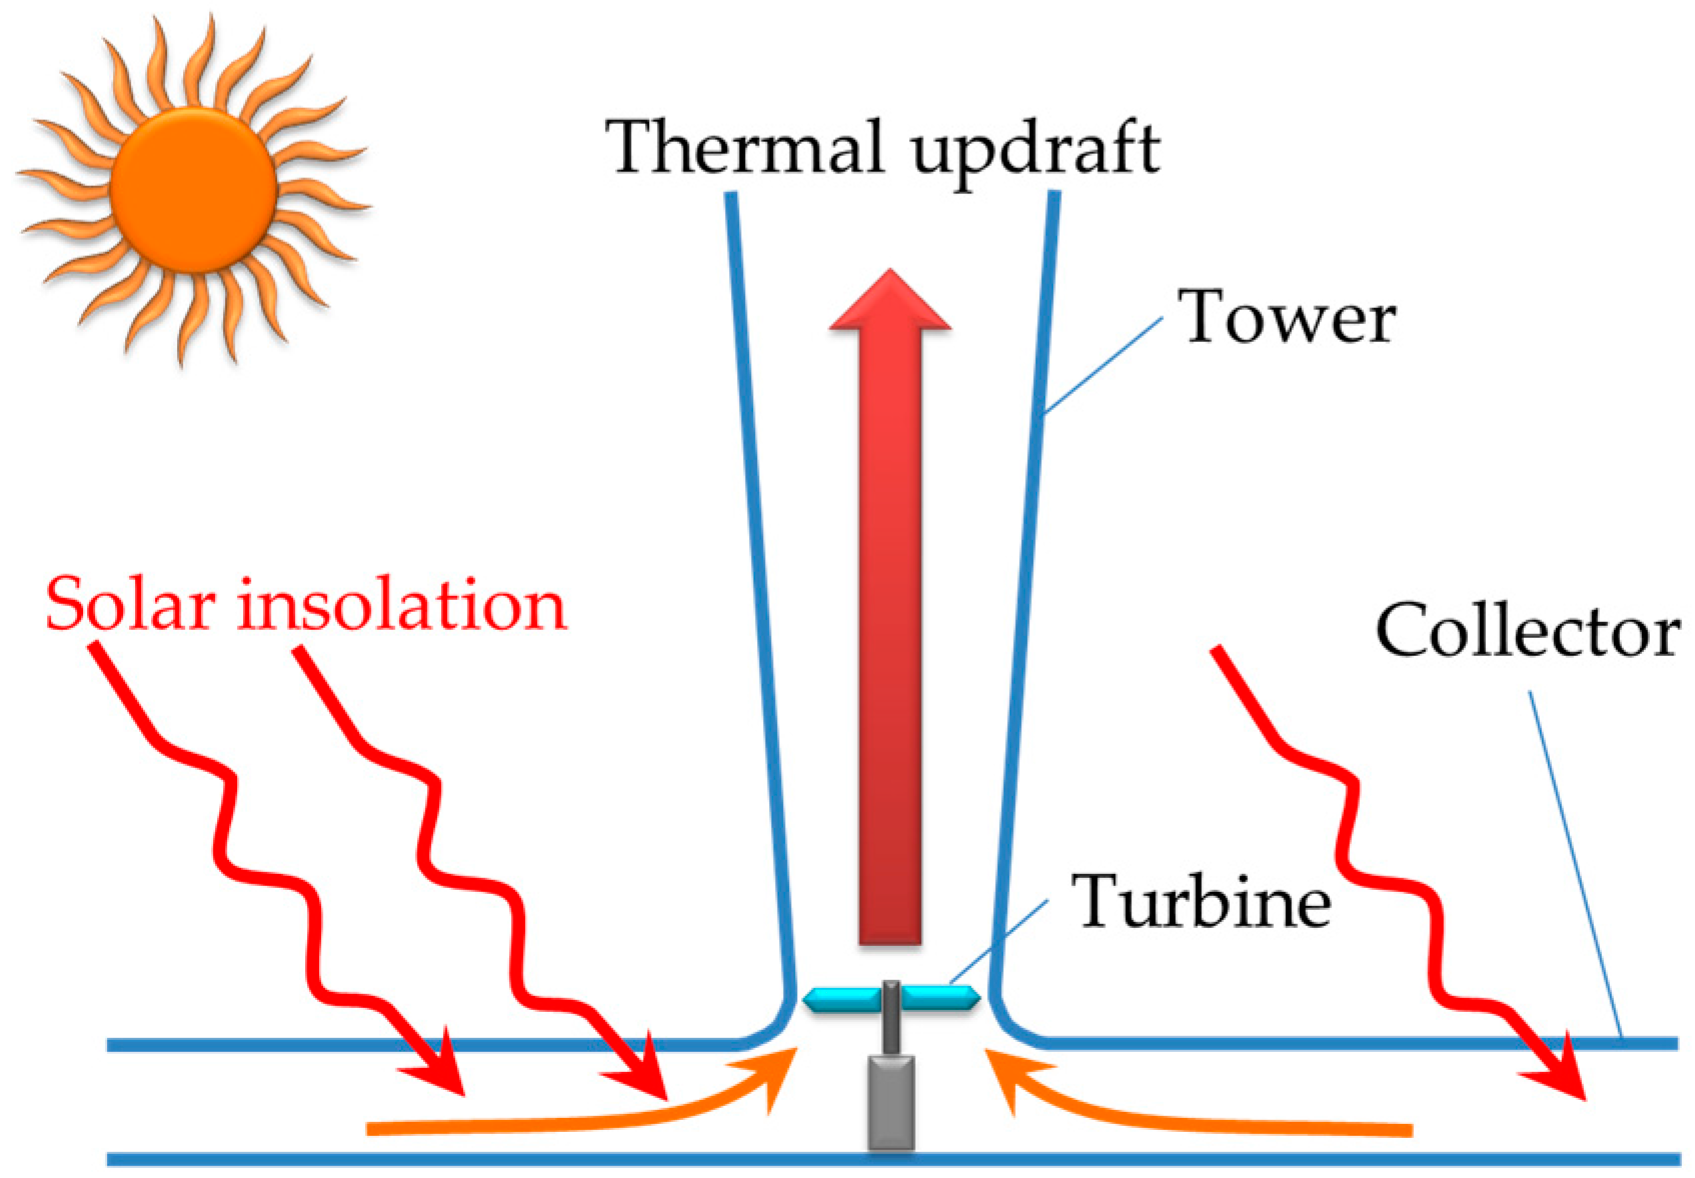
1]. This system uses a basic principle of physics, the fact that hot air rises, to generate wind. The configuration of the solar chimney consists of a transparent solar thermal collector, high-rise cylindrical tower, and a wind turbine installed inside the bottom of the tower. The transparent solar collector heats the air between the collector and ground, causing a greenhouse effect. This induces a thermal updraft within the cylindrical tower placed at the center of the solar collector. This updraft turns a wind turbine at the base of the tower to produce electricity (
Figure 1).
A 100-kW prototype system was verified and operated in Manzanares, Spain, from 1982 to 1989 [
1,
2,
3,
4,
5,
6]. This prototype successfully achieved 50 kW of power. The verification test of the prototype showed that the updraft generated from solar thermal energy is sufficient for power generation during both daylight and nighttime, as long as the residual heat accumulated during daylight hours is adequate to generate the updraft. Of 3157 h of generation time, 3067 exceeded 150 W/m
2 radiation levels, showing that intermittency of the updraft is minimal during hours with sufficient solar radiation. The disclosed data of the prototype suggests that the solar chimney can be used to generate wind for stable continuous power generation during daylight hours.
Nonetheless, Trieb [
7] summarized disadvantages of the solar chimney in comparison to analogous solar energy power generation systems, as follows: (1) very low solar-to-electricity conversion efficiency; (2) very tall chimneys necessary for high power output; (3) large, completely flat areas required for the collector; (4) large material requirement for the chimney and collector; (5) restricted full-load hours; (6) hybridization not being possible. These disadvantages were well known at the time of publication, but were tolerated because of the simplicity and extremely low cost of construction and operation.
Since the pilot plant in Manzanares, Spain was completed, further development worldwide has been minimal, although scientific technical studies have been carried out [
8,
9,
10,
11,
12,
13,
14,
15,
16,
17,
18,
19,
20,
21]. However, the Manzanares solar tower still has the potential to play a role in future renewable energy. Recently, with priorities such as non-nuclear power generation and CO
2 reduction, renewable energy sources have been attracting attention in the search for energy security. Consequently, other renewable energy sources, such as wind-generated electricity (where there is adequate wind) and solar cells (where there is adequate sunshine), are generally recognized as the most promising options. Fundamental experiments on how much power is generated, depending on size of the basic component of the solar tower, have not been fully performed (power generation expectation and optimization study [
11,
12,
13,
14,
15,
16,
17,
18,
19,
20,
21,
22,
23,
24,
25]). Few reports have discussed the tower shape regarding a diffuser type [
13,
14] and hardly any research has discussed the effect of crosswind around a solar chimney [
17,
18,
25].
If the performance in power generation can be improved in some fashion, the solar tower may become competitive with other renewable energy systems. In the present study, an example of optimizing tower shape is shown in terms of its fluid dynamic characteristics, to improve its power generation efficiency. In a trial to increase power generation, a diffuser shape was used as the first step in optimizing the tower. An experiment was performed to compare the updraft wind speed flowing through a diffuser-shaped tower with a typical cylindrical tower [
22]. The next experiment was conducted with a larger-scale model to confirm that the results complied with the scaling law. This demonstrated that when upsizing, the scaling law remained valid [
23].
Using the large model in the laboratory experiment, the present research investigated the optimum shape of a diffuser tower. The optimum diffuser open angle and relationships between thermal updraft speed and tower height or temperature difference were investigated. Specifically, using a tower model 2 m in height, the updraft performance of a diffuser tower model with 0° (cylindrical model) to 6° semi-open angle was studied. Updraft speed for diffuser towers of 1.0–2.6 m height was also investigated. The results show that a diffuser model with a 4° semi-open angle is optimum for a solar tower in the present experiment, and the updraft speed is proportional to the square root of tower height or the temperature difference between the inside collector and ambient air aloft, following the theory discussed in
Section 2.
Furthermore, as an alternative method to supplement the experimental results for generating wind in a laboratory room, computational fluid dynamics (CFD) analysis was done for the flow field surrounding indoor-scale models. The augmented ratio of the updraft speed of the diffuser-type tower compared with the cylindrical-type tower, effects of the semi-open angle, and height of the diffuser models are discussed using the experimental results, along with the expected updraft speed and power output estimation of the large-scale structure using dynamic similitude of the flow field.
2. Dynamic Similitude of Flow Field for Thermal Updraft Generation
The flow field in this research on thermal updrafts is induced by the temperature difference between the heated ground and ambient air aloft. The ambient wind surrounding the structure that affects the updraft inside the tower is neglected. Therefore, the flow field is naturally convection-driven by the temperature difference between the heated ground and ambient air aloft. In a natural-convection flow field, the governing equations are those of continuity, momentum and energy, under the Boussinesq approximation as follows. Here, ui, velocity components; P, pressure; θ, temperature; xi, three-dimensional components; i and j, three-dimensional components of Cartesian coordinate system (i = 1, 2, 3, j = 1, 2, 3).
Dynamic similitude of the flow field holds when the non-dimensional parameter in the governing equations of that flow field is equivalent across scales. In a natural-convection flow field, there are three non-dimensional parameters (the Reynolds Re, Richardson Ri, and Prandtl Pr numbers). However, these parameters are seldom the same for two different geometric scales. In a natural-convection flow field, the buoyancy term in the equation of momentum governs the flow field dynamic; therefore, the Richardson number becomes the representative non-dimensional parameter of the flow field. Here, the Prandtl number is 0.7 for the air. It is assumed that the Reynolds number effect is small. The relationship of characteristic velocity and length between the two scales is shown in Equation (4). Furthermore, when the characteristic temperature is equivalent between the two scales, the speed of the large-scale structure can be estimated by the product of the speed of the small-scale model and square root of the length ratio, as shown by Equation (5). Here, g, gravity acceleration; l and L, characteristic lengths; w and W, characteristic speeds, updraft speeds in vertical (z) direction; x, y, and z, streamwise, spanwise and vertical directions; θ and Θ, temperatures; Δθ and ΔΘ, temperature differences (= heated air temperature near ground in collector Θ2—ambient air temperature Θ1); Θ0 is the representative ambient air temperature.
3. Previous Laboratory Experiments
3.1. Laboratory Experiment Using a Mini-Model with a 0.4-m Tower Height—1st Step
Preliminary laboratory experiments were conducted on mini-models of a solar tower [
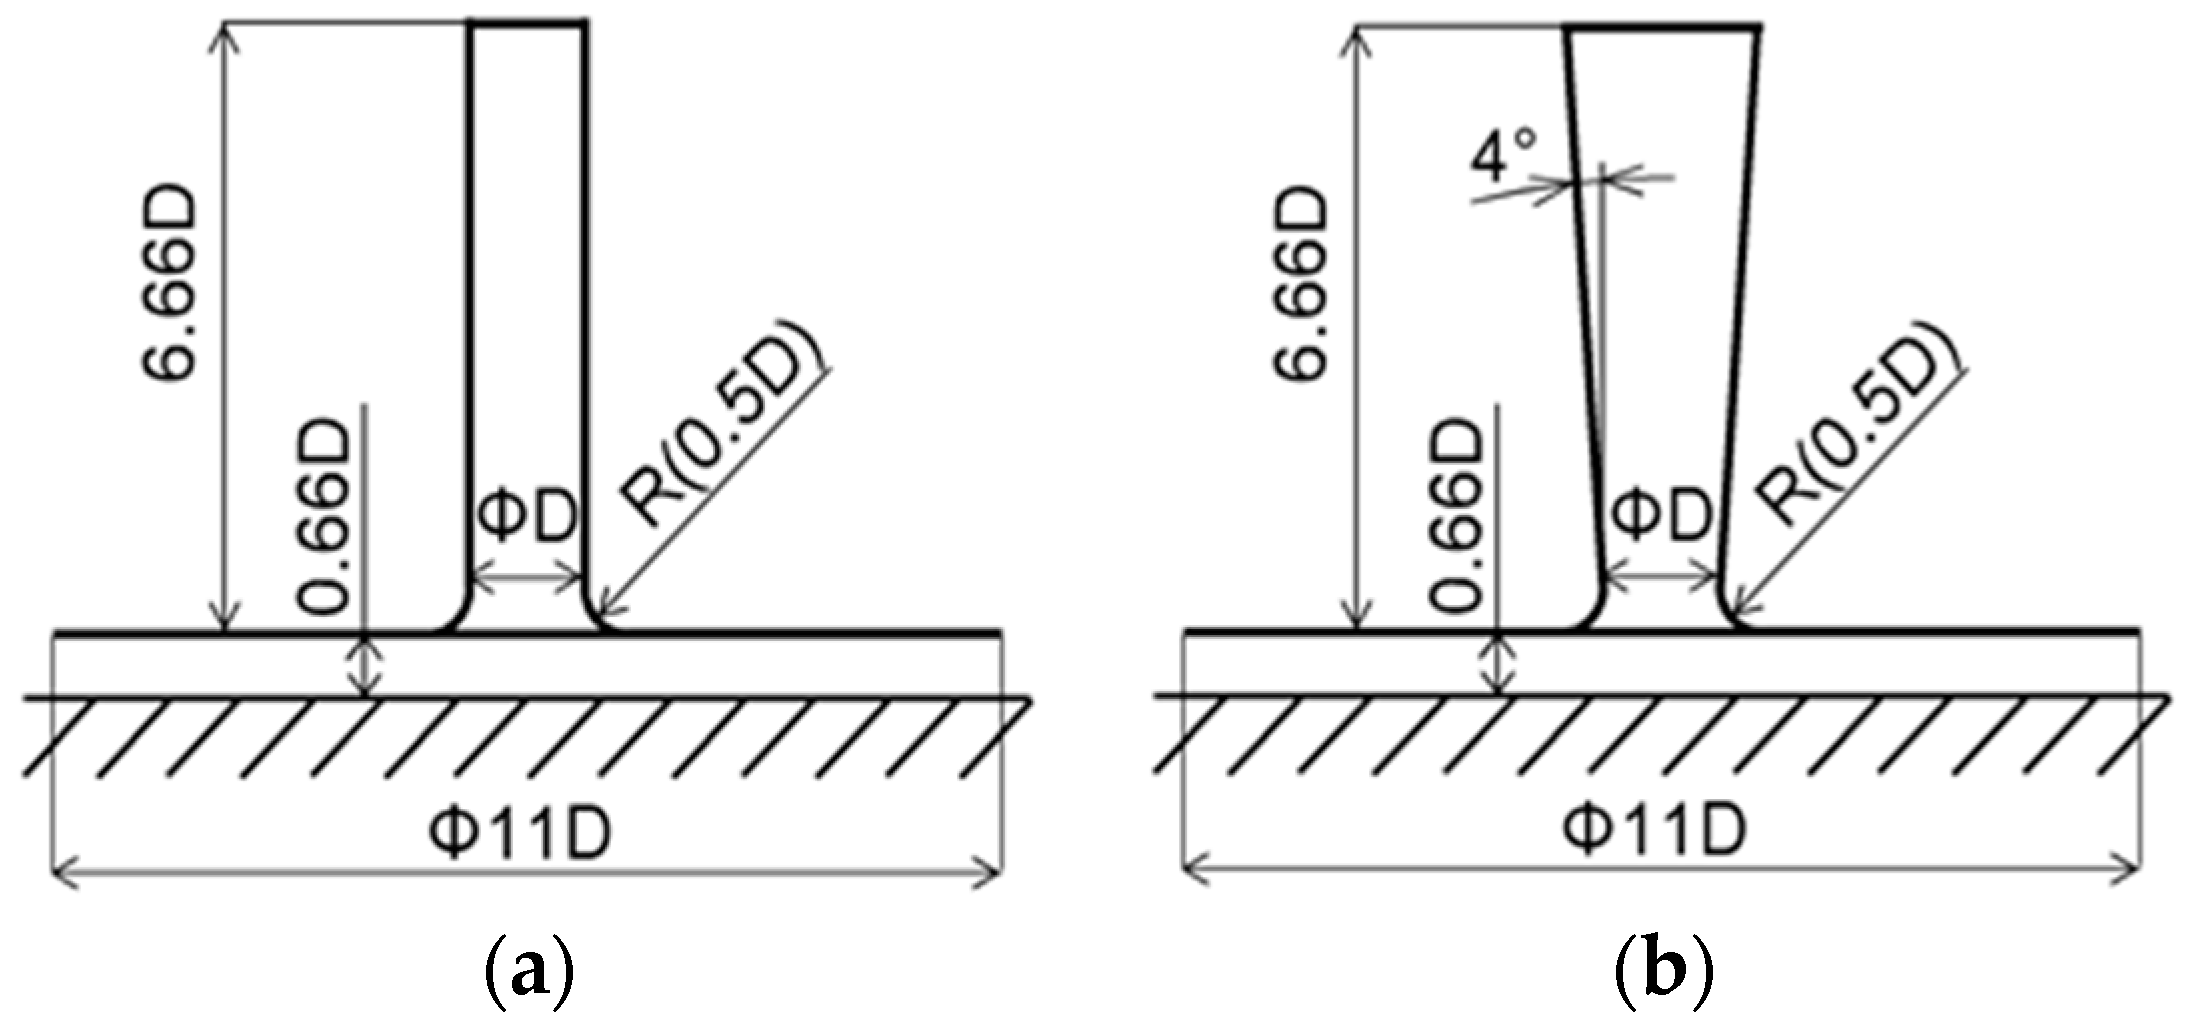
22]. The mini-models consisted of cylindrical and diffuser models with a 0.66-m radius collector and a tower 0.4-m high. The diameter of the throat of the diffuser-type tower was designed so that it was the same as that of the cylindrical-type tower. The height of both towers was 6.66
D. The diffuser-type tower had a 4° open area ratio. This open ratio was established as the initial study to avoid flow separation inside the tower, while still having a diffuser effect. Model dimensions are shown in
Figure 2. In this laboratory experiment, the flow field is naturally convection-driven by the temperature difference Δ
Θ between flow temperature
Θ2 from the controlled floor surface temperature at the bottom of the tower and ambient temperature
Θ1 (Δ
Θ =
Θ2 −
Θ1). The latter is defined as the temperature surrounding the tower exit.
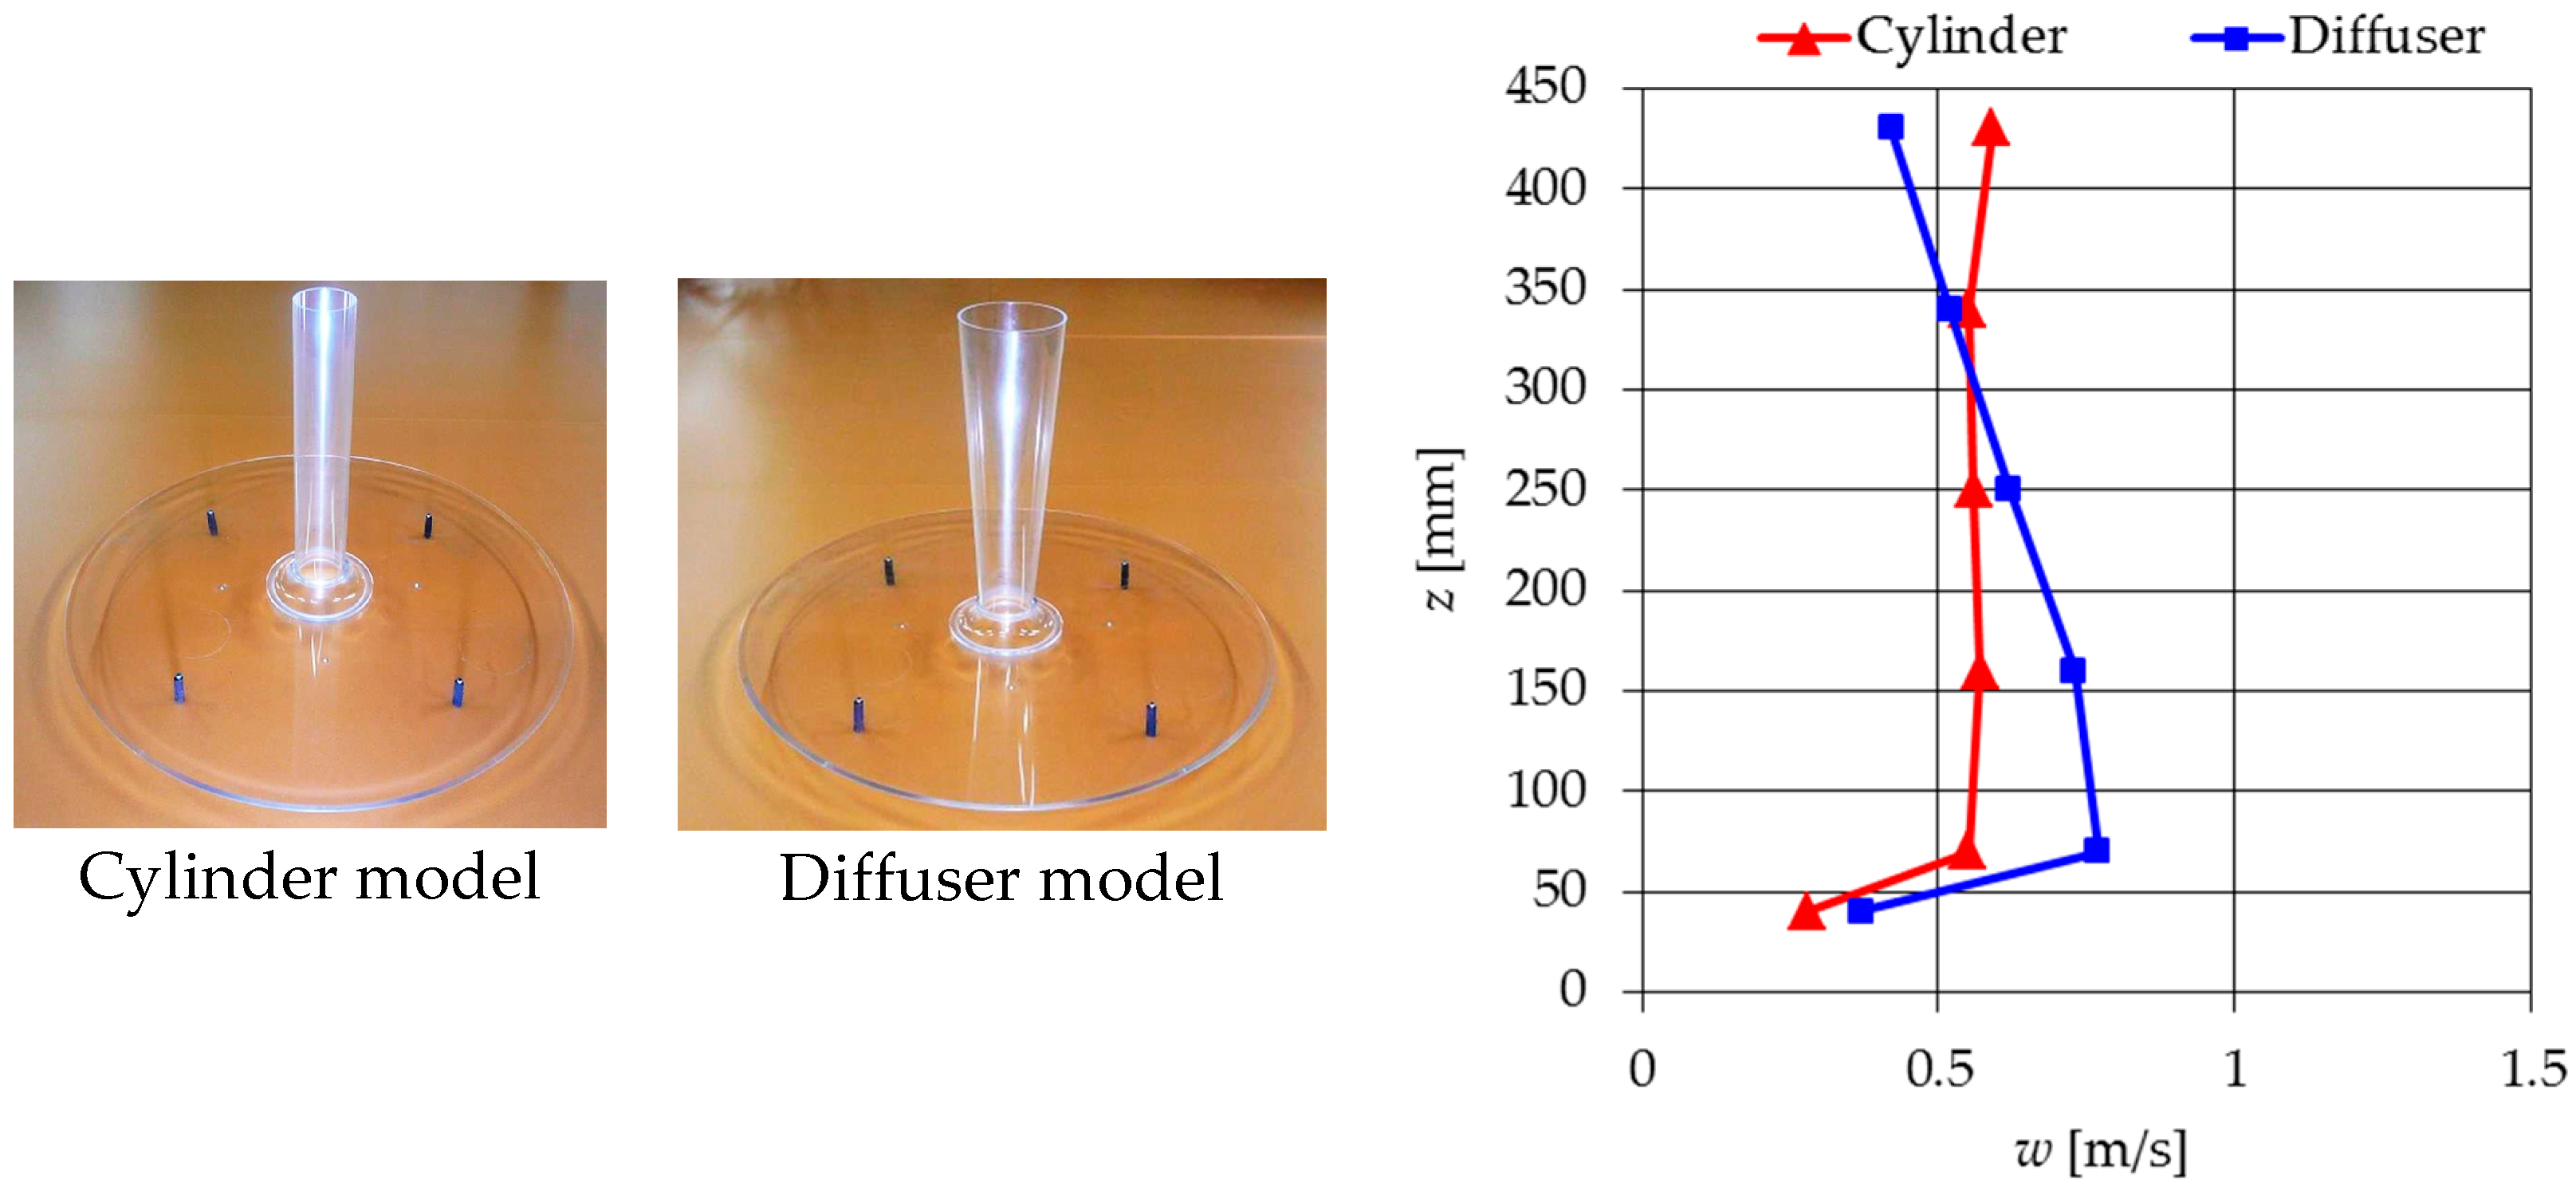
Figure 3 shows experimental results from measuring the updraft speed. In the cylindrical tower, the speed at 70 mm above the heated floor is 0.55 m/s. In the diffuser tower, the speed at the same point is higher (0.77 m/s) for a ∆
Θ of ~20 K. The laboratory experiment shows that the proposed diffuser-type tower with a 4° open ratio induces a speed approximately 1.38 to 1.44 times greater than the conventional cylindrical type.
3.2. Laboratory Experiment Using a 2-m Tower—Second Step
As with the mini-model experiment summarized in
Section 3.1, the second-step experiment on a solar tower was also done in a laboratory [
23]. The solar tower model was made up to five times larger than the mini-model, with a 2-m high and 3-m square collector part. Using a wind turbine model, the power output was measured and verified it. The diffuser model had a 4° open area ratio. Initially, the updraft speeds of the diffuser and cylindrical towers without a wind turbine were measured. As a result, those speeds were 1.2 m/s for the cylindrical model and 1.85 m/s for the diffuser model, for ∆
Θ = 20 K. As with the mini-model experiment, updraft speed for the diffuser tower was greater than for the cylindrical tower, by a factor of 1.5–1.7, without a turbine.
W-speeds in these enlarged models were almost
times greater than those in the mini-models (1.2/0.55 = 2.18 for cylinder; 1.85/0.77 = 2.40 for diffuser; at ∆
Θ = 20 K, data of 0.55 m/s (cylinder) and 0.77 m/s (diffuser) for the mini-model are given in
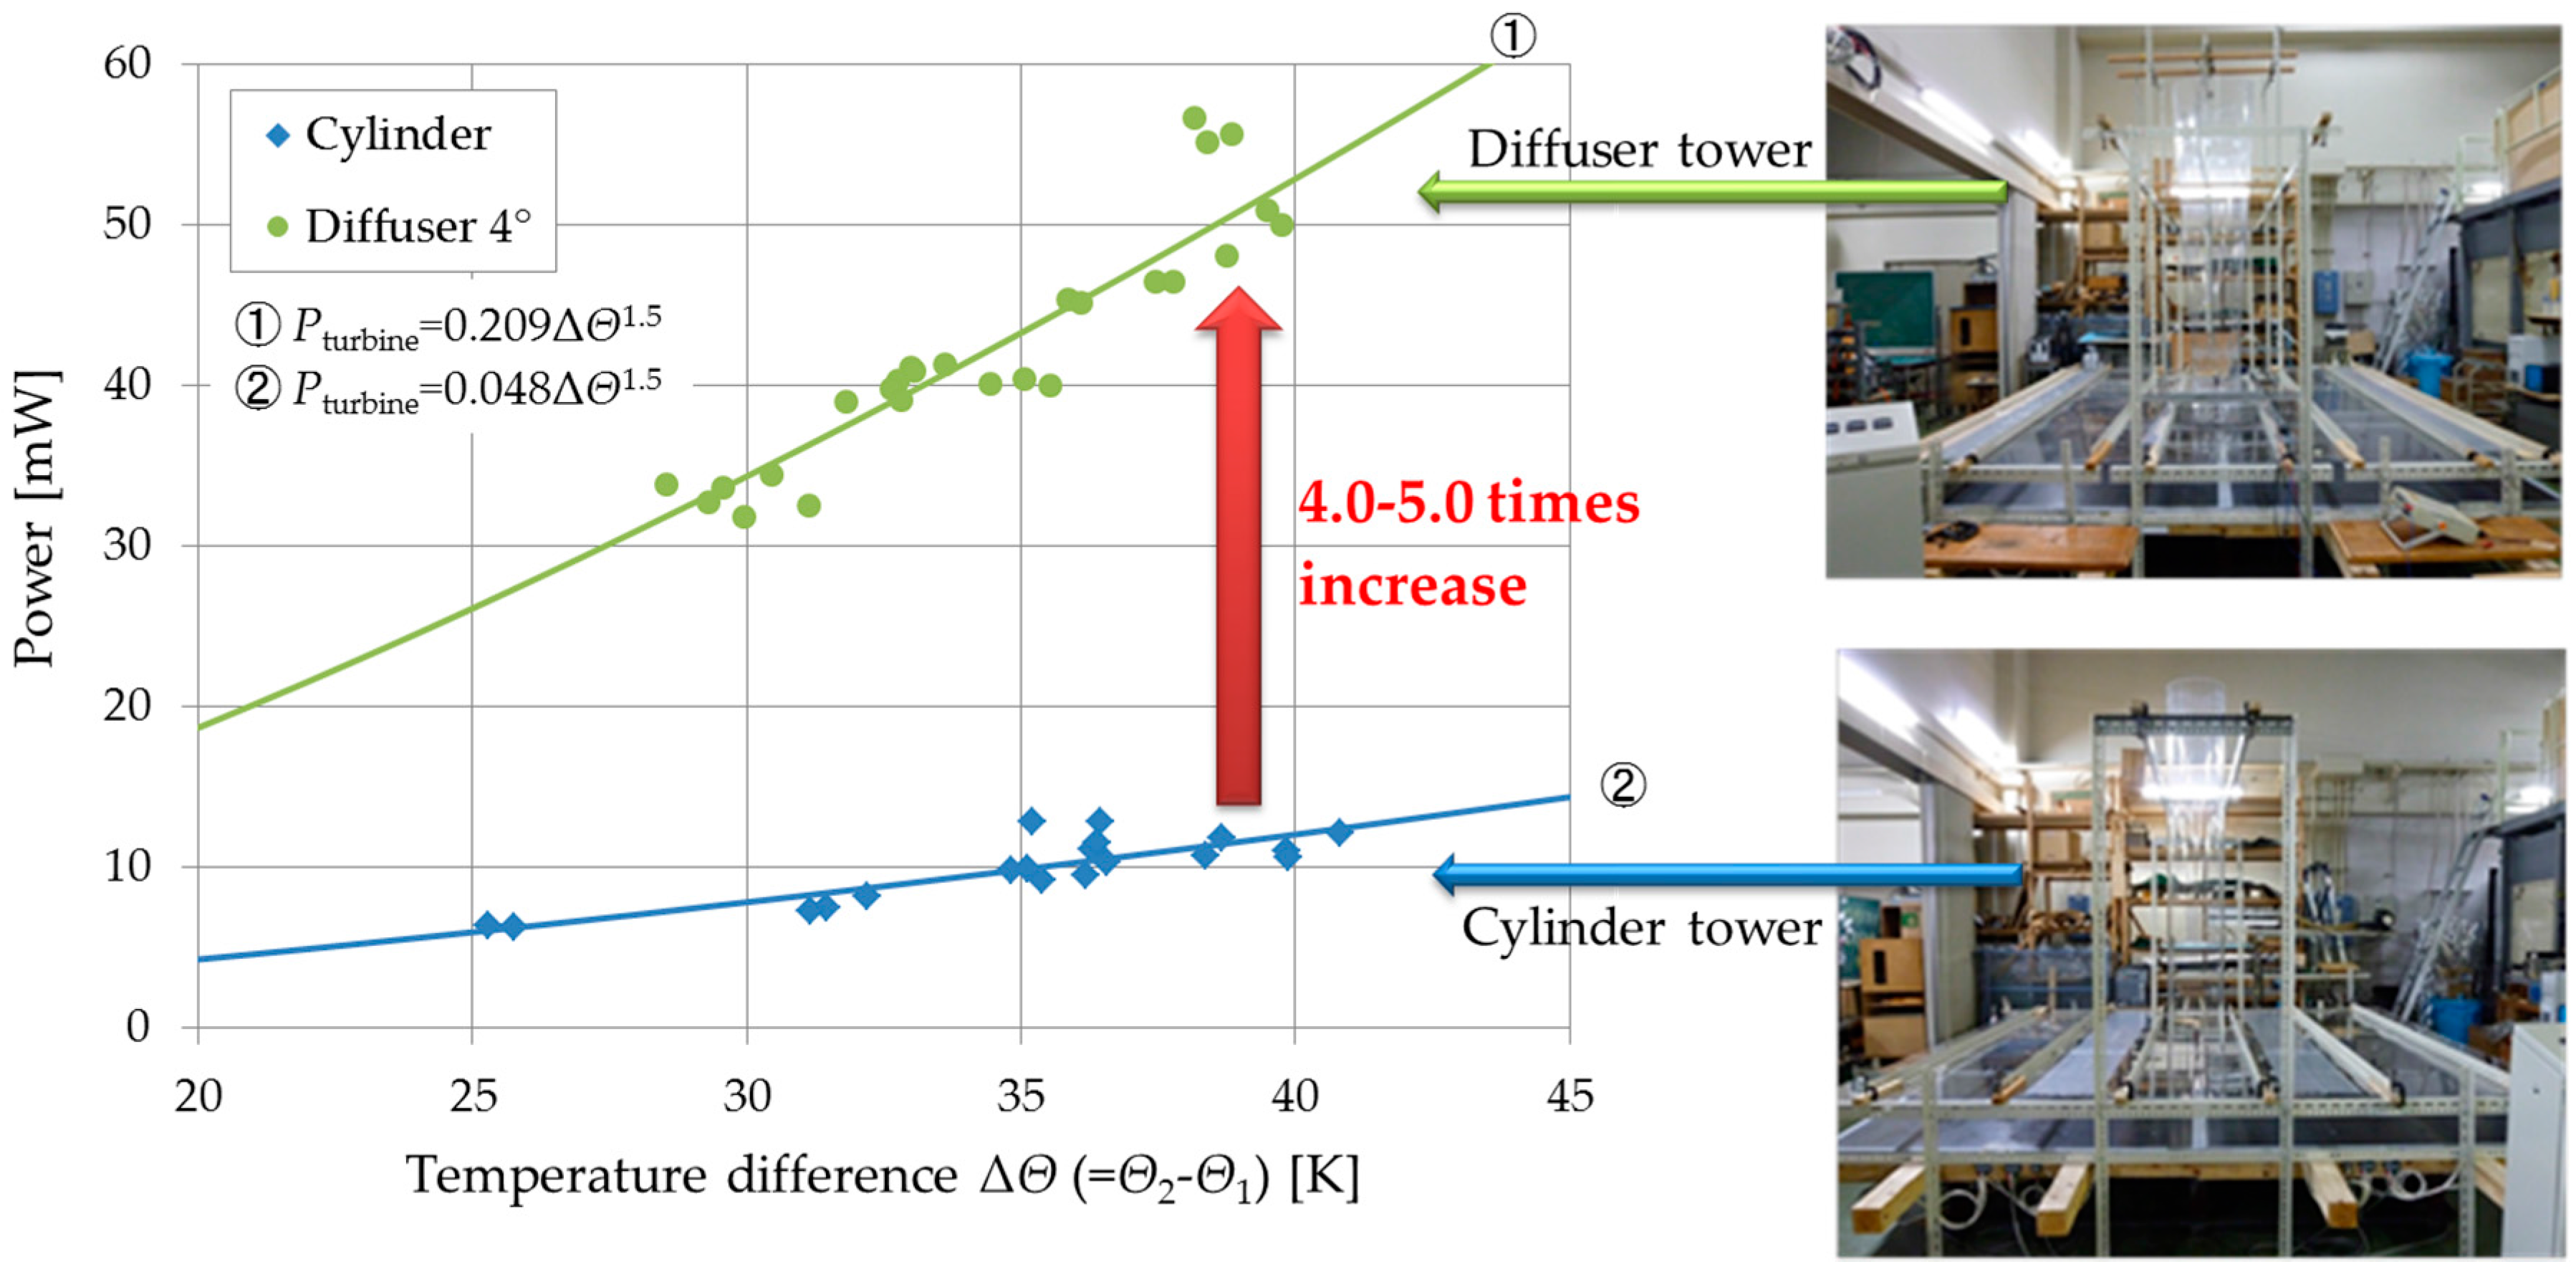
Section 3.1). A scaling law shown by Equation (5) was confirmed by the present solar tower experiment. Next, by installing a wind turbine with rotor diameter 0.29 m, changes in speed and power output were measured at each optimum tip speed ratio. The ratio of w-speed between the diffuser and cylindrical towers was almost 1.4–1.5, similar to the case for the Δ
Θ without a turbine. Power outputs obtained in the diffuser tower were 4–5 times greater than those of the cylindrical tower (
Figure 4).
4. Investigation of Optimal Tower Configuration
4.1. Experimental Setup
Based on the results of previous laboratory experiments [
22,
23], to find an optimal tower configuration, a series of experiments were conducted indoors, as described below. In these experiments, the surface temperature of a heater plate at each set point was controlled to maintain
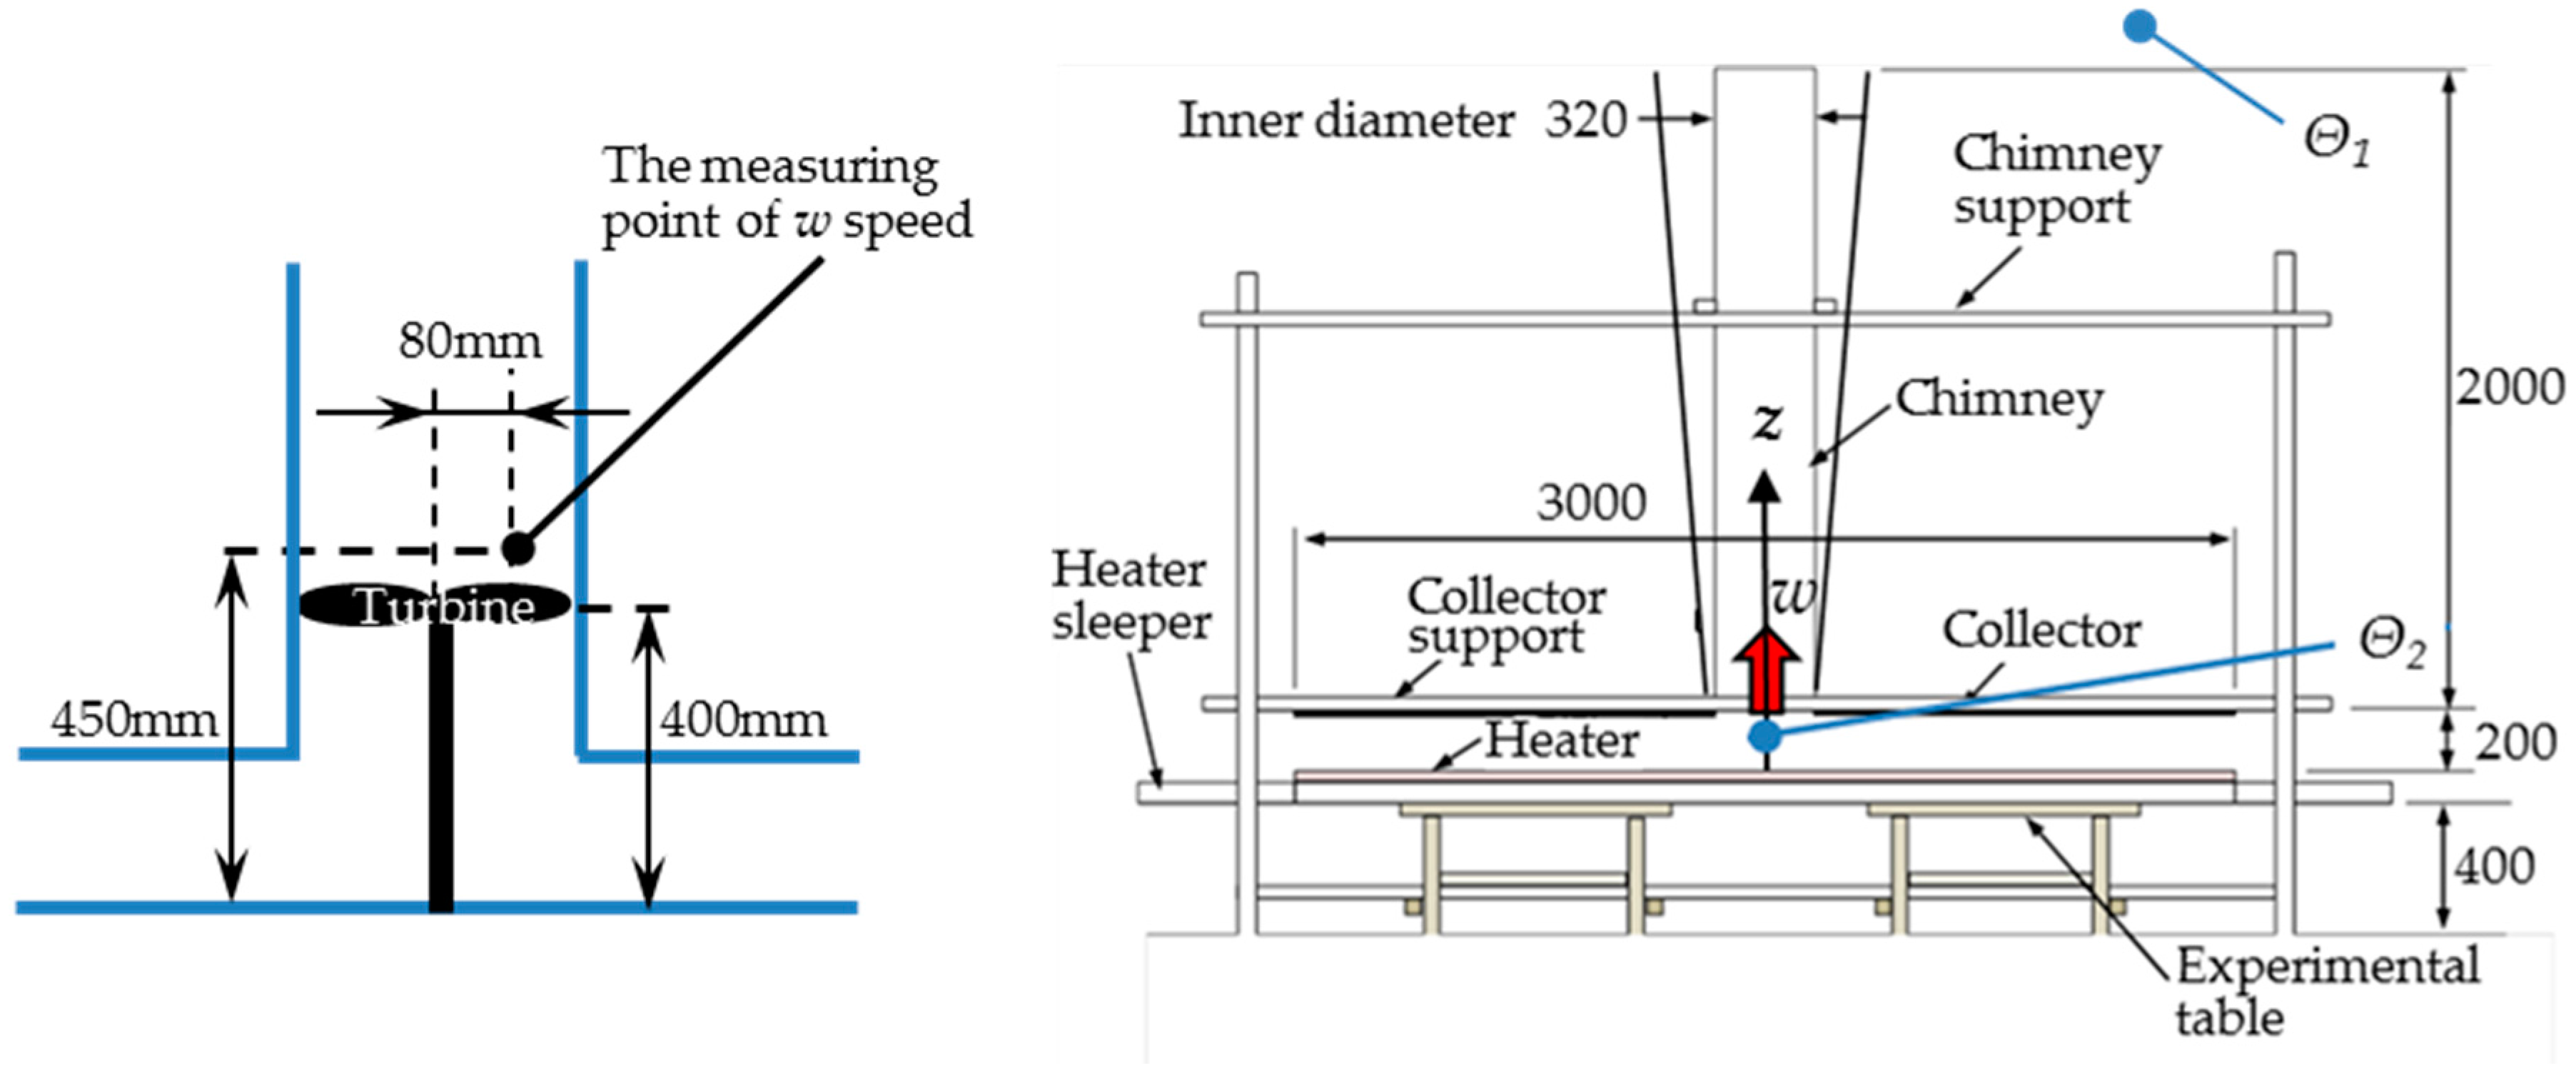
Θ2 constant adjacent to the hot plate. Therefore, all the measurements were made under almost steady thermal conditions. The time histories of physical quantities were recorded for 30 s and its time-mean values were evaluated in the present experiments. An ultrasonic anemometer was installed 50 mm above the wind turbine (
Figure 5). The signal from the anemometer was entered in a PC and monitored by a FFT analyzer. The solar tower model was placed at the center of the collector. The origin of the Cartesian coordinate system was defined to be the intersection of the central line of the tower and the temperature-controlled surface. The
z-axis was defined as the height direction along the tower’s center line. The temperature distribution and updraft flow speed were measured along the tower center line (
z-axis). A wind turbine with rotor diameter 290 mm was inserted near the bottom of the tower model. The power output of the wind turbine was measured using a simple electrical circuit. Varying the resistance, the maximum power output was found at the optimum tip speed ratio.
4.2. Effect of a Diffuser Tower with Various Semi-Open Angles
A cylinder-shaped tower and diffuser-shaped towers of height
h = 2 m were used. The diffuser-shaped towers had 2°, 4° and 6° semi-open angles.
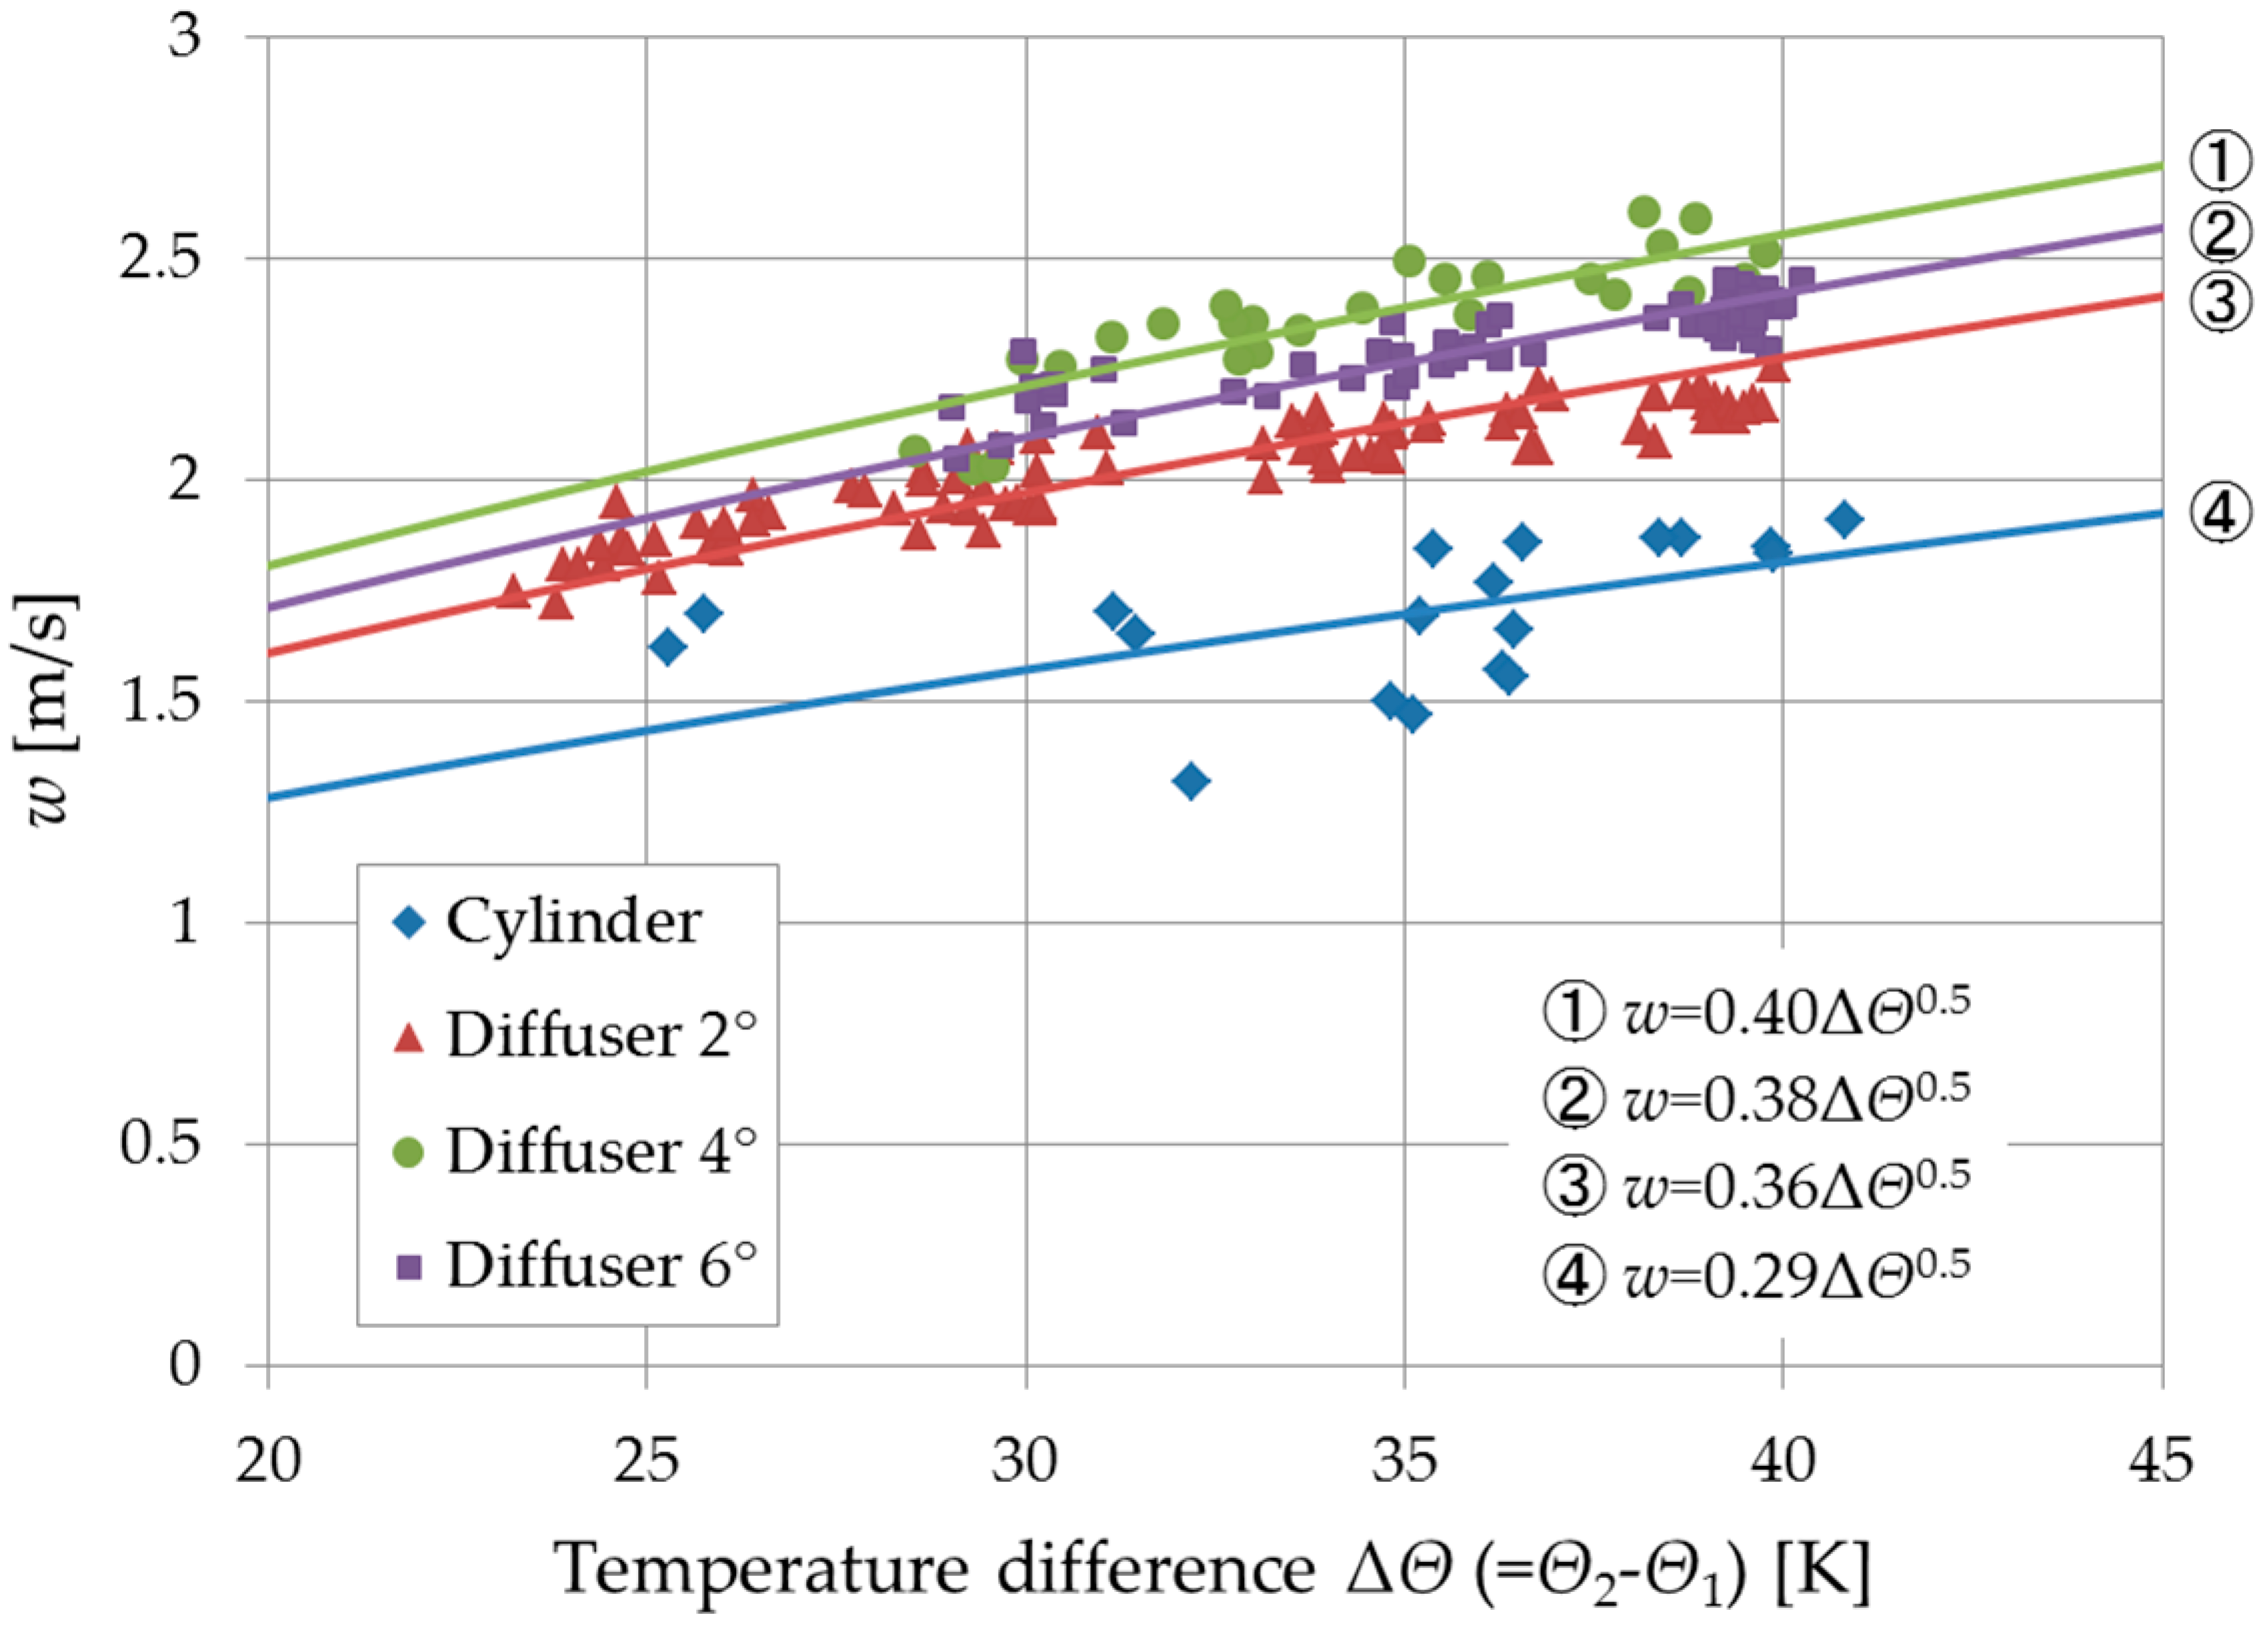
Figure 6 shows results of thermal updraft speed
w with temperature difference ∆
Θ. In all cases,
w inside the tower increased with the temperature difference. The largest
w was seen for a diffuser with 4° semi-open angle in the present experiment.
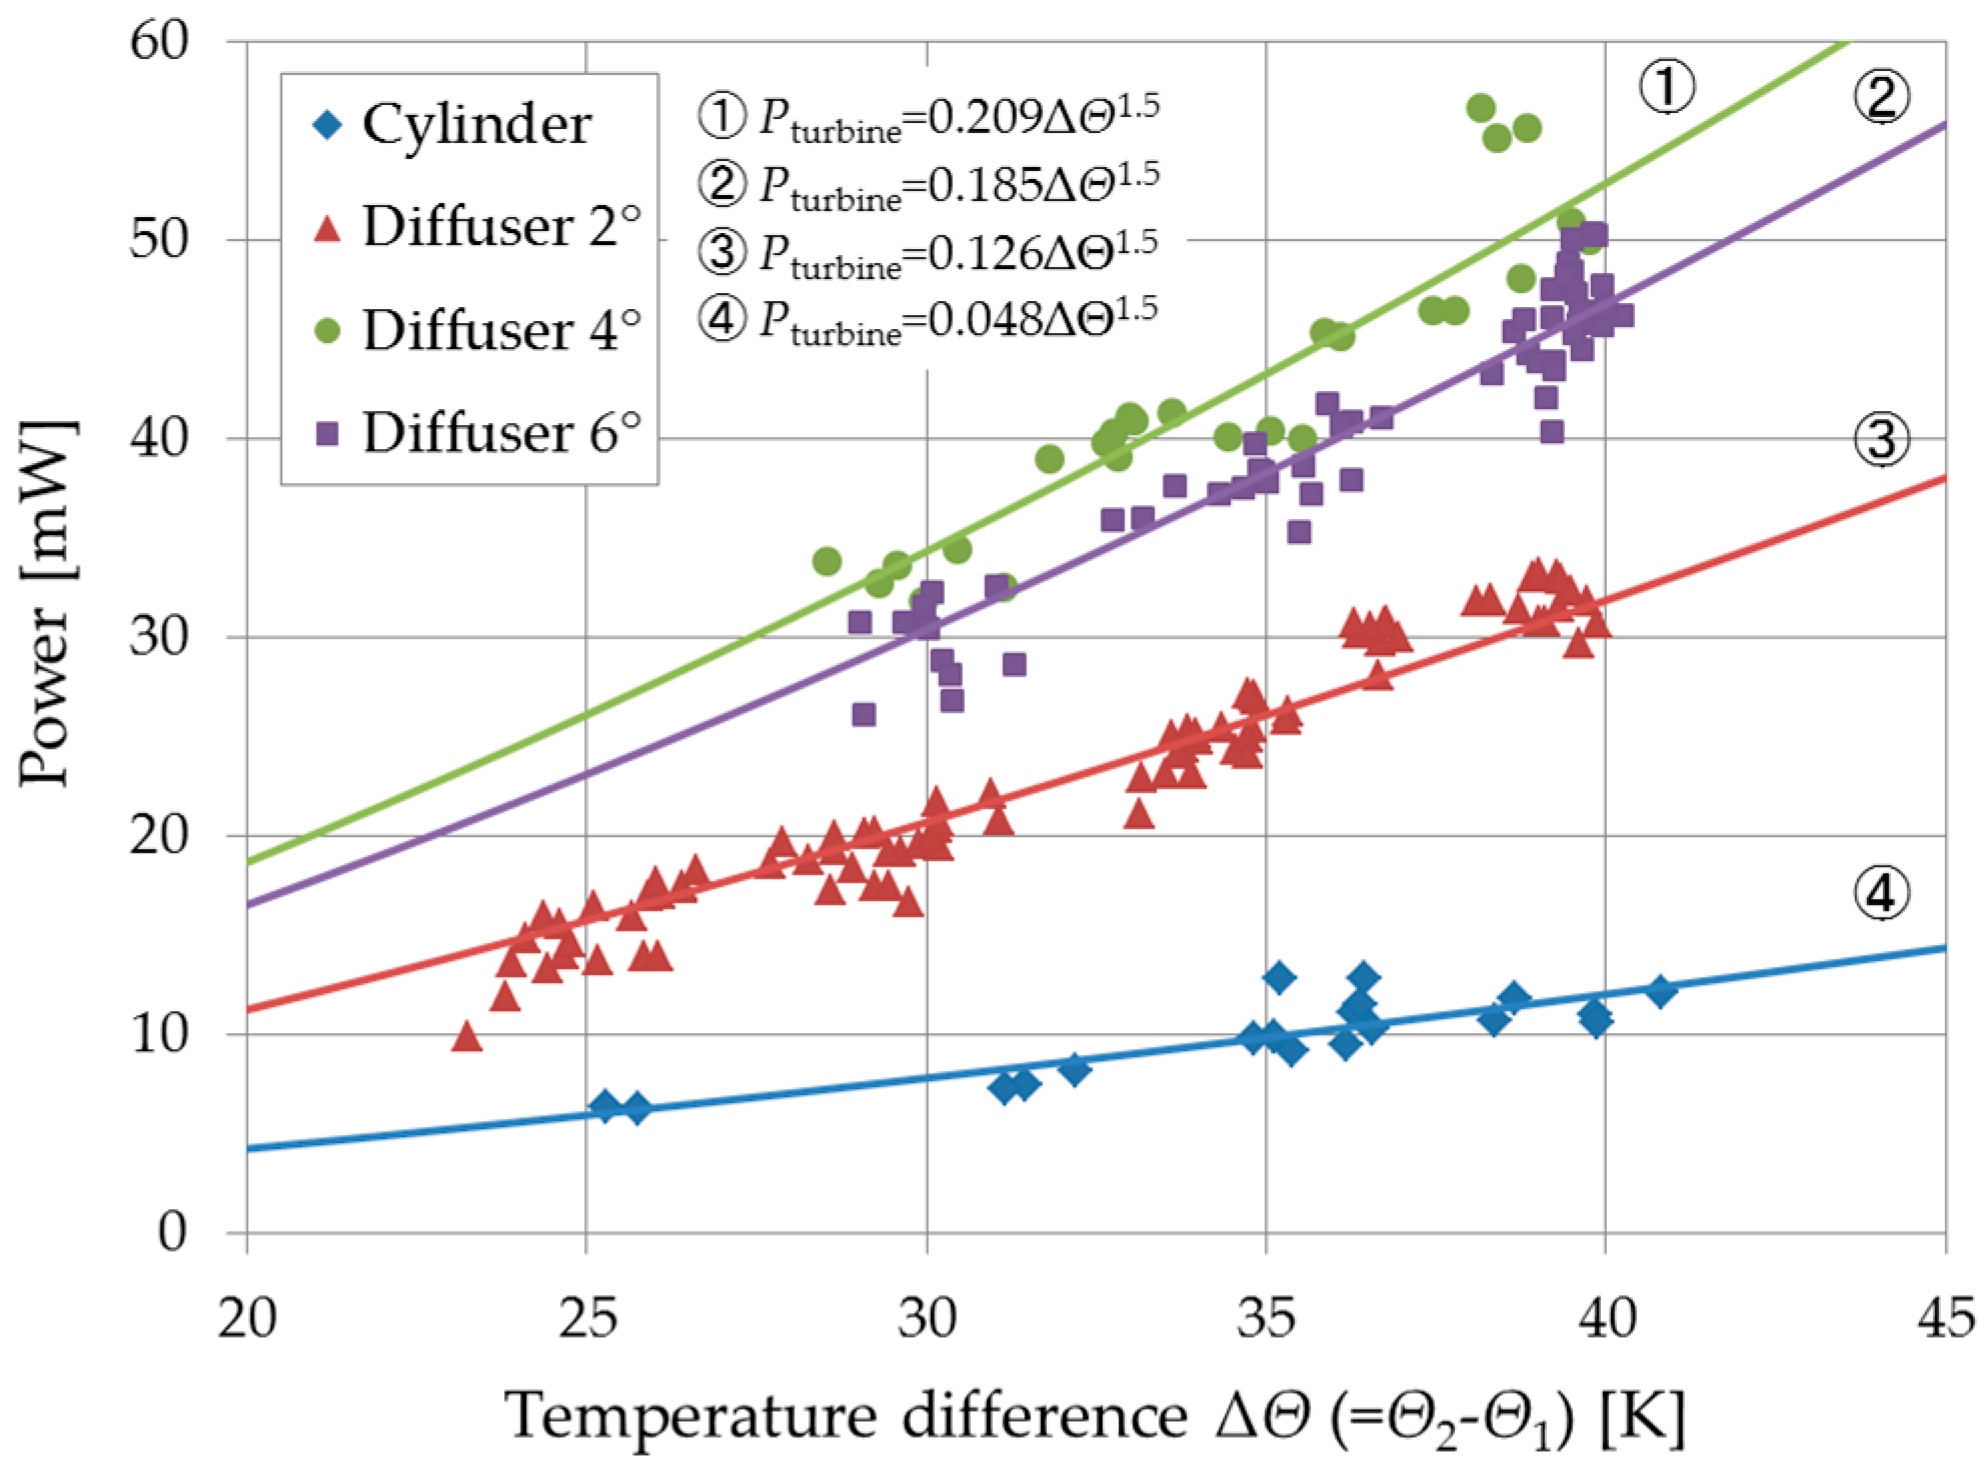
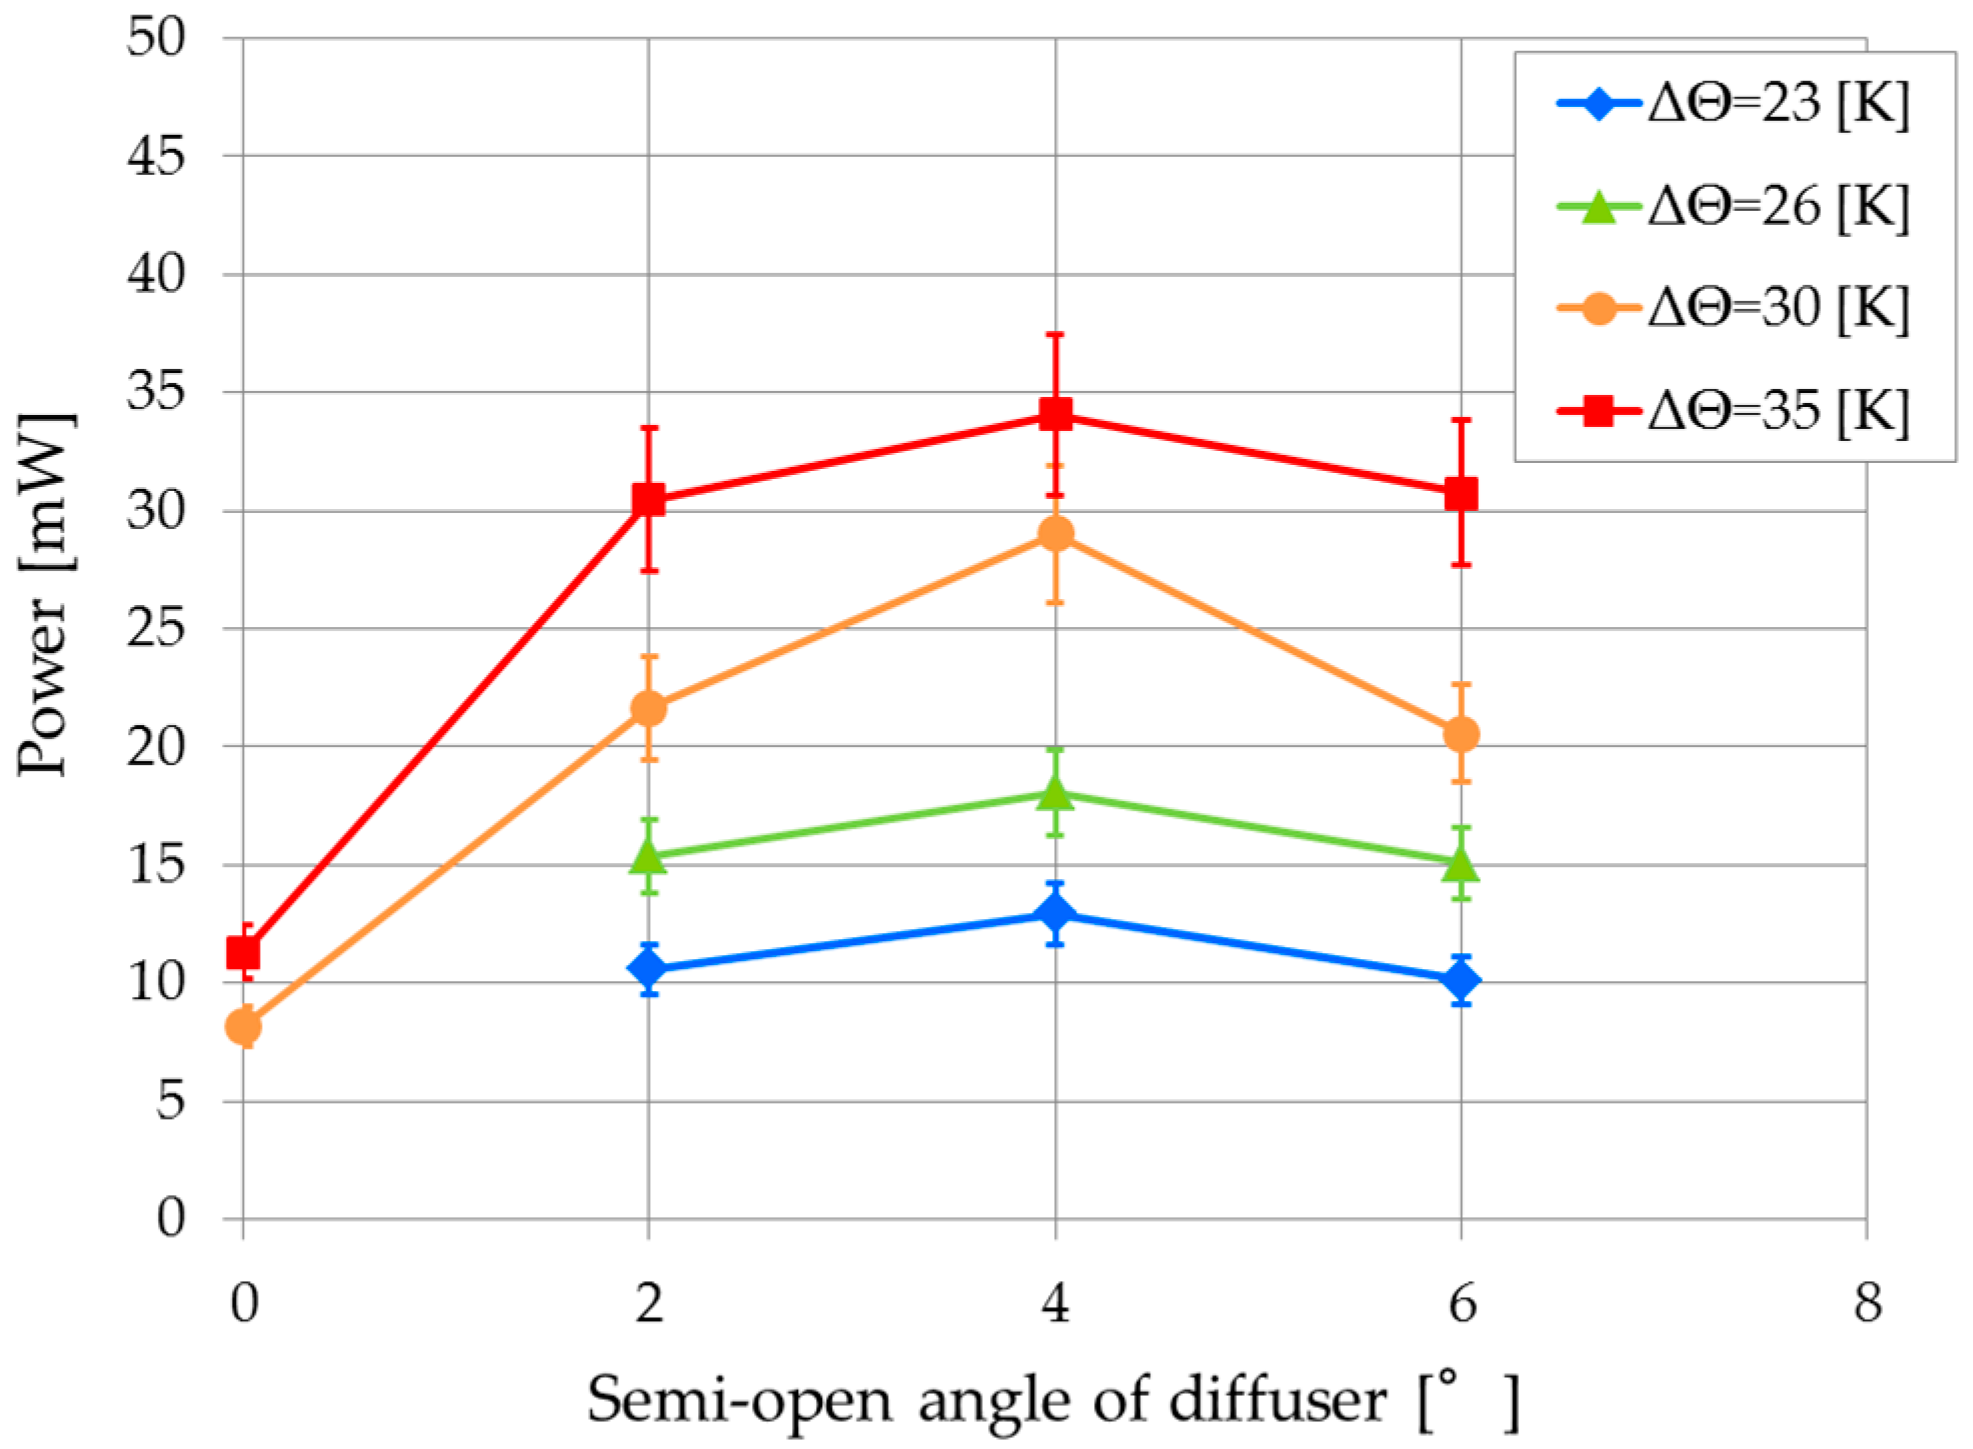
Power output results are shown in
Figure 7. Compared with the outputs of a cylindrical tower, those of the diffuser tower with a 4° semi-open angle show a 4–5 times increase, with the largest values among the diffuser models. Describing the results in another form (
Figure 8), it is clear that the diffuser tower with a semi-open angle of 4° is optimum for the solar tower in the present experiment.
4.3. Effect of Diffuser Tower of Various Heights
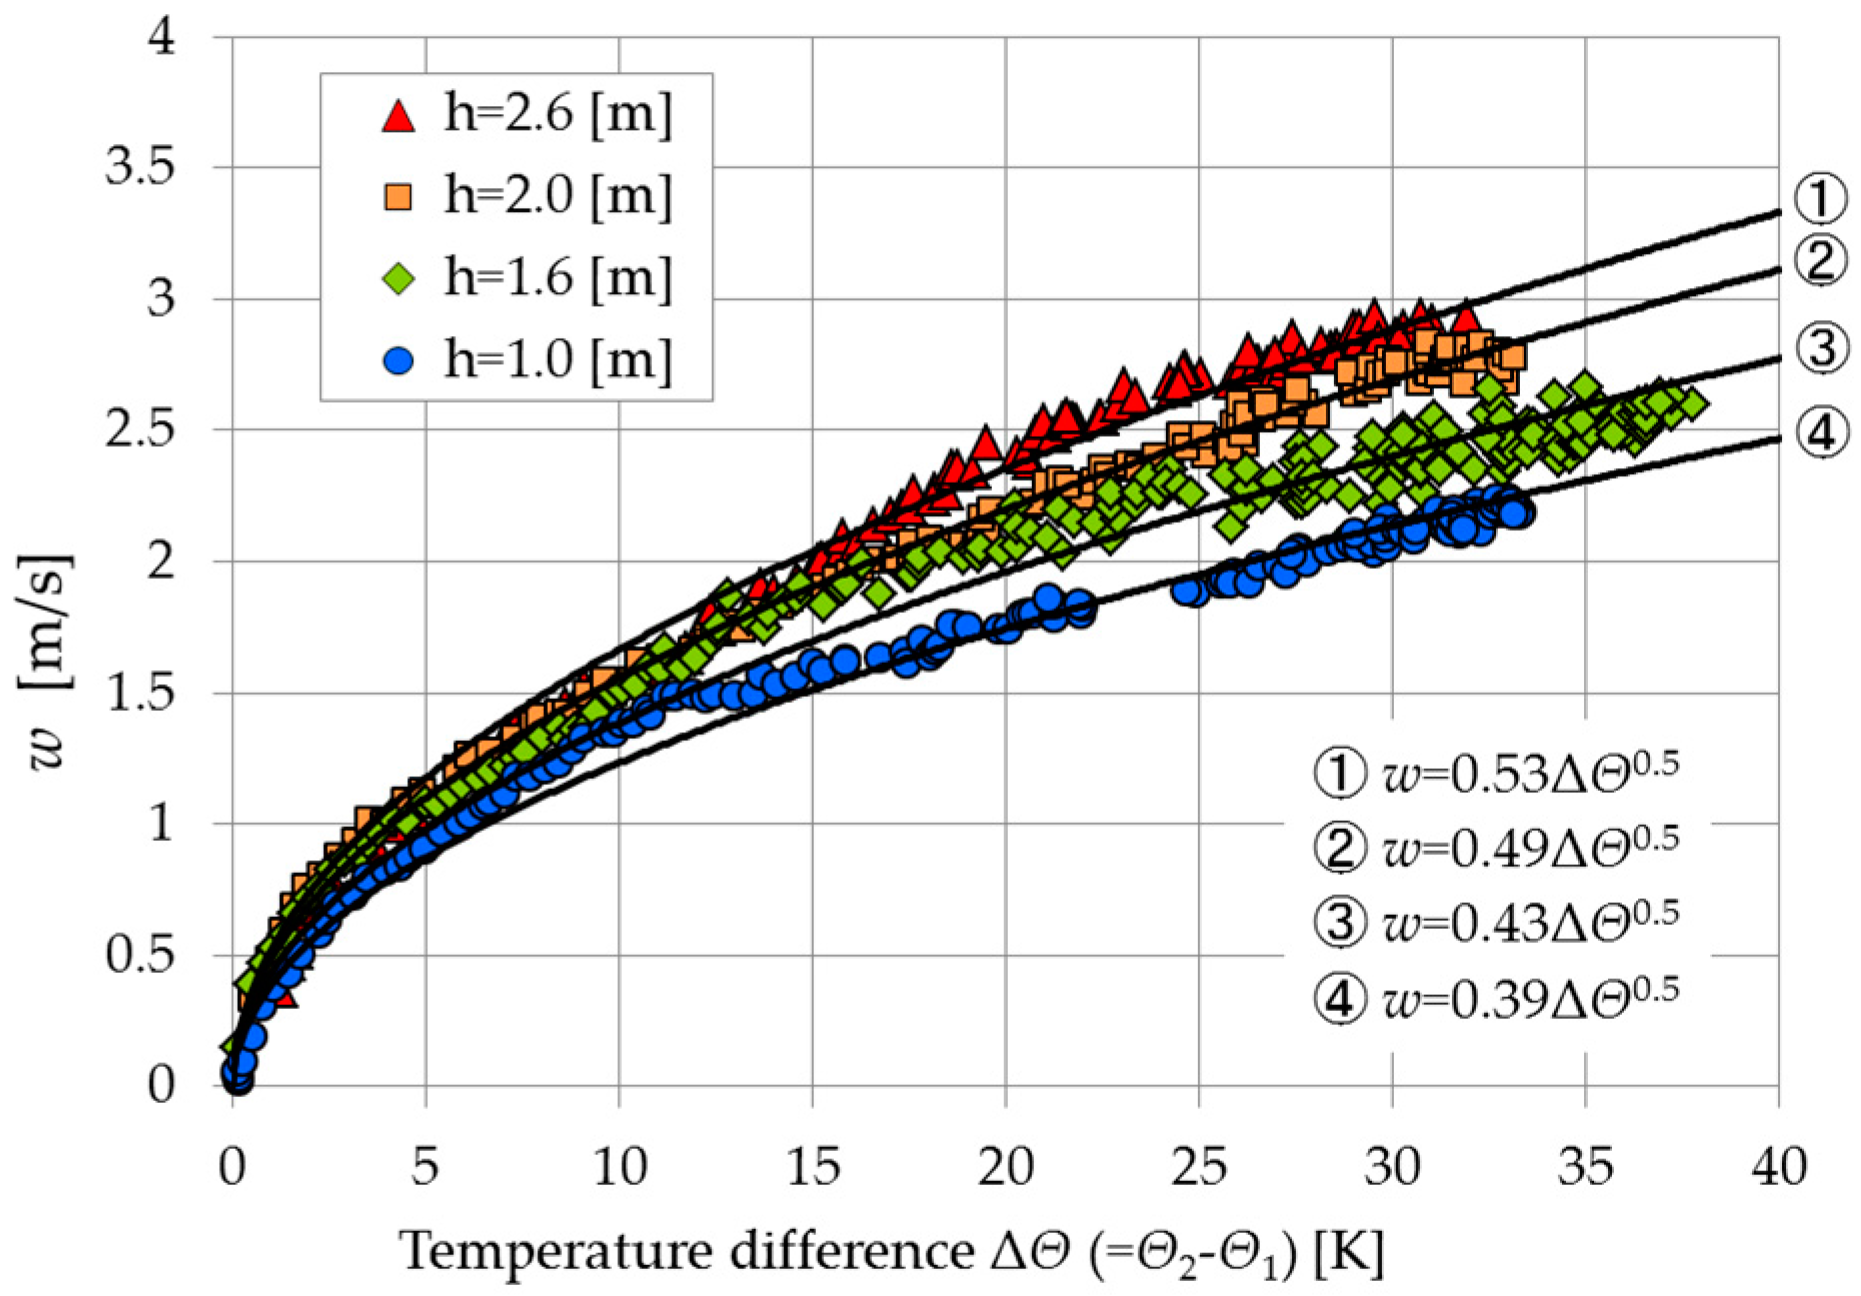
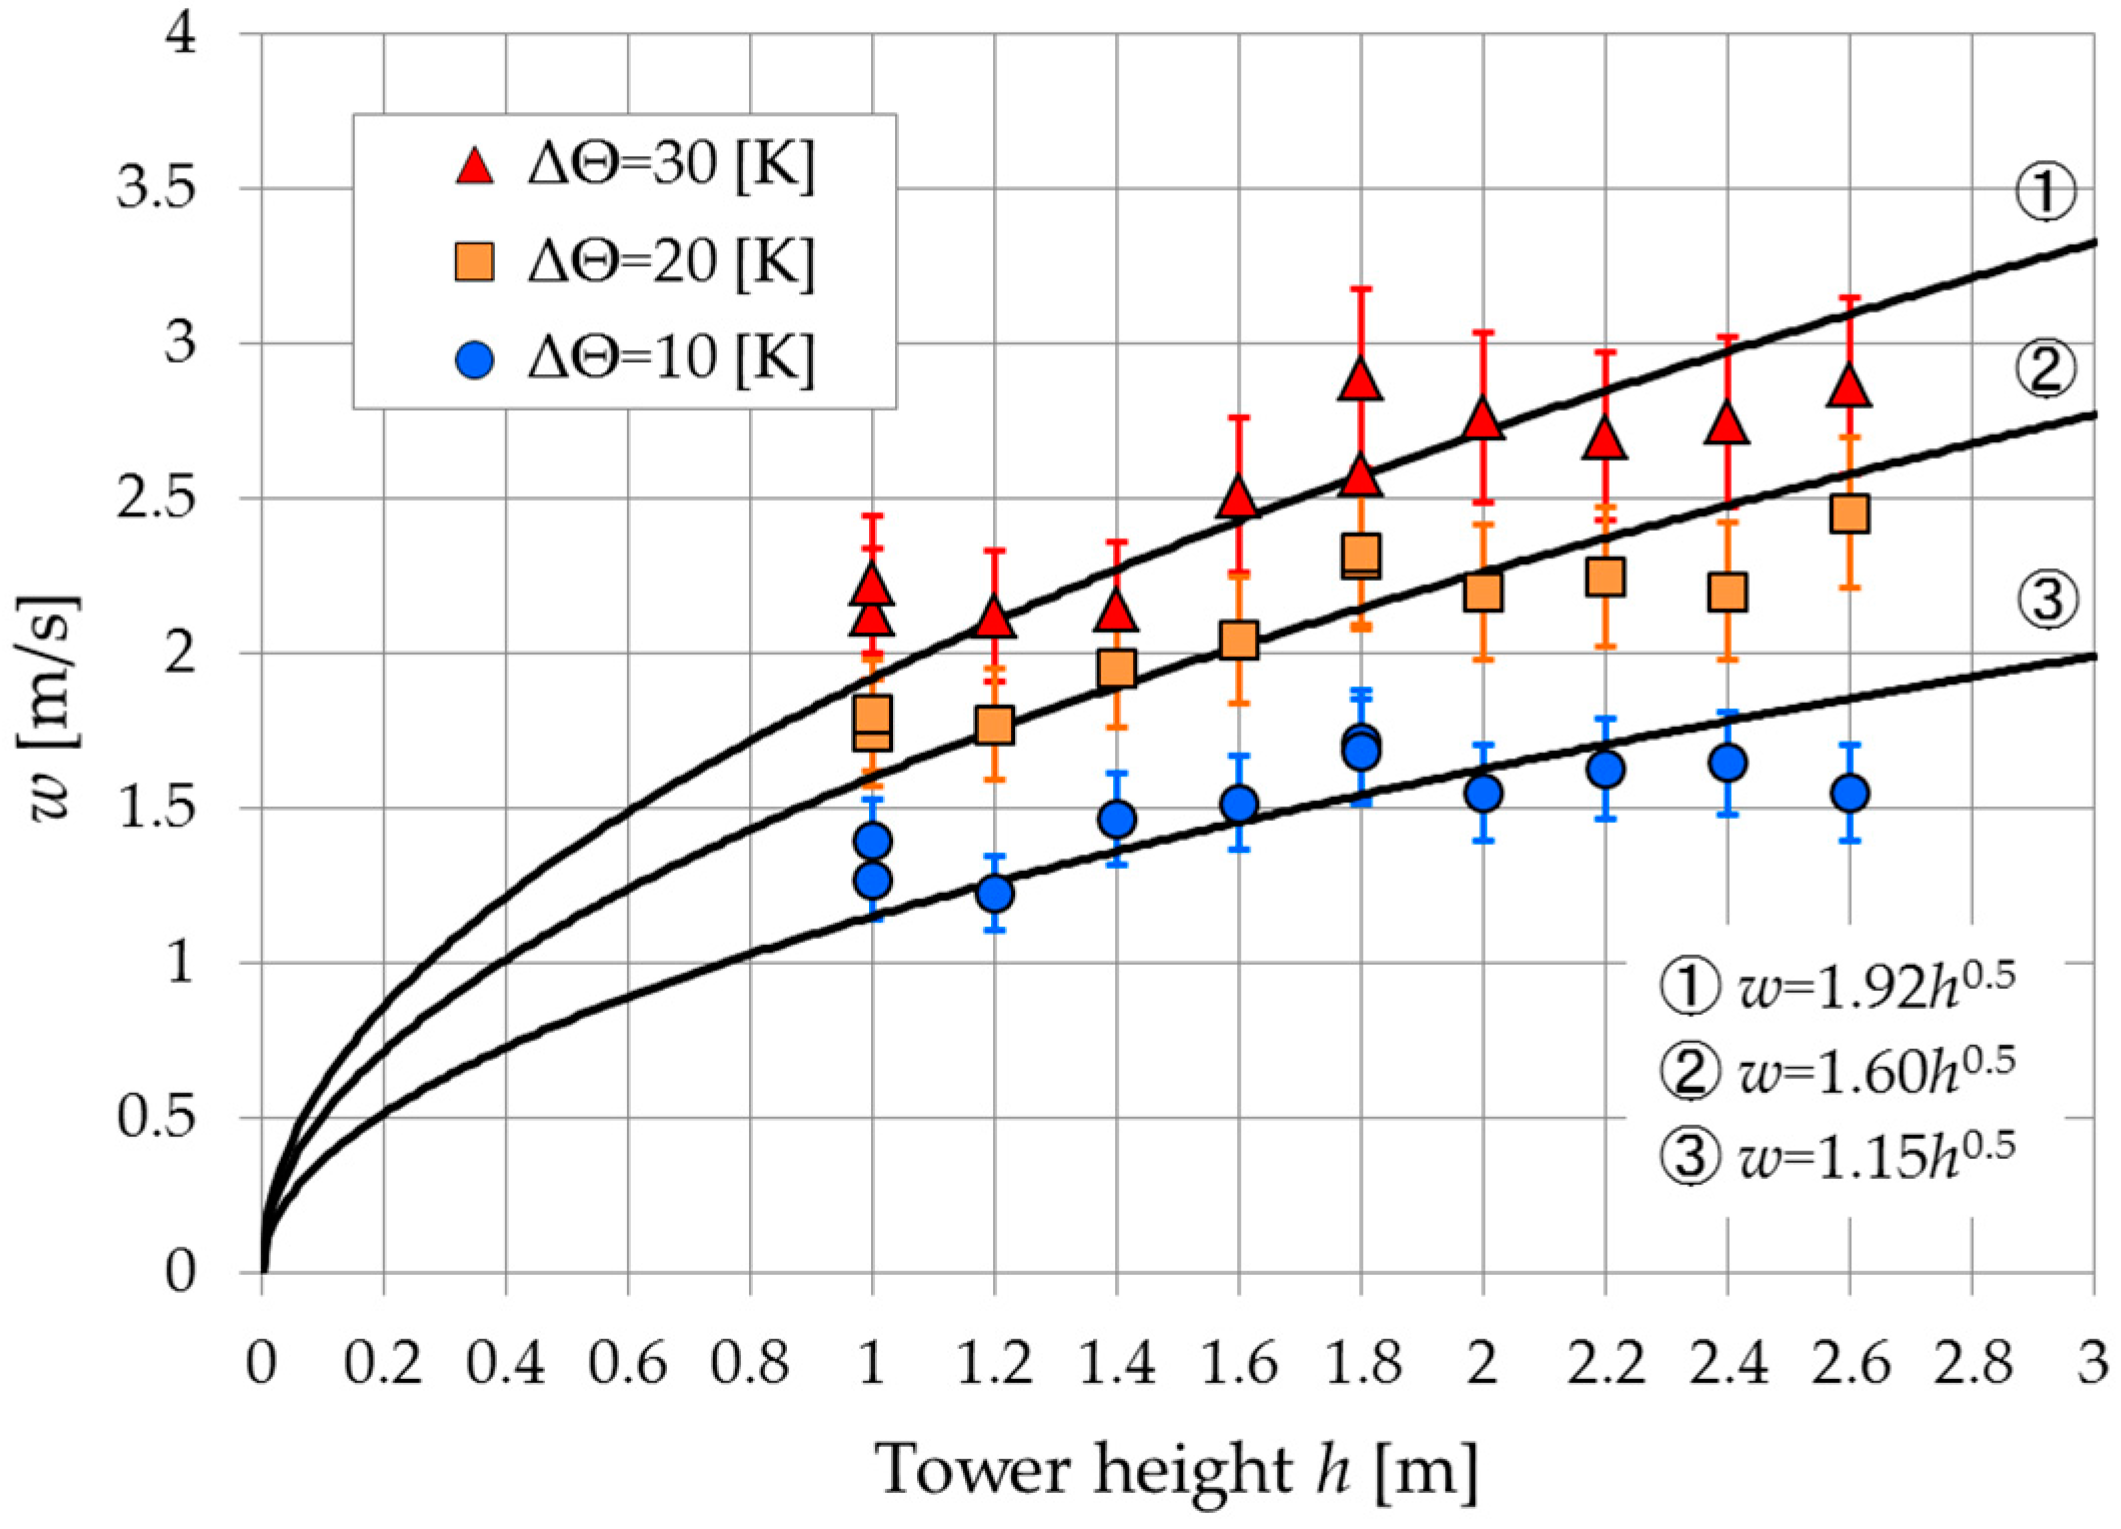
The tower height of the diffuser model with 4° semi-open angle was varied in the range 1.0–2.6 m to investigate the relationship between thermal updraft speed and tower height. The results are shown in
Figure 9 and
Figure 10. From these figures, it is clear that
w is proportional to the square root of temperature difference and square root of tower height
h, i.e.,
w and
w .
5. Numerical Analyses
5.1. Computational Method
Flows around a solar tower system and inside it without a turbine were numerically simulated using a three-dimensional DNS based on the finite difference method [
24]. The governing equations were the continuity and Navier-Stokes equations.
Table 1 summarizes details of the approach and other information relevant to the simulation. A first-order explicit method was used for time marching. A second-order central scheme was applied to the convective term.
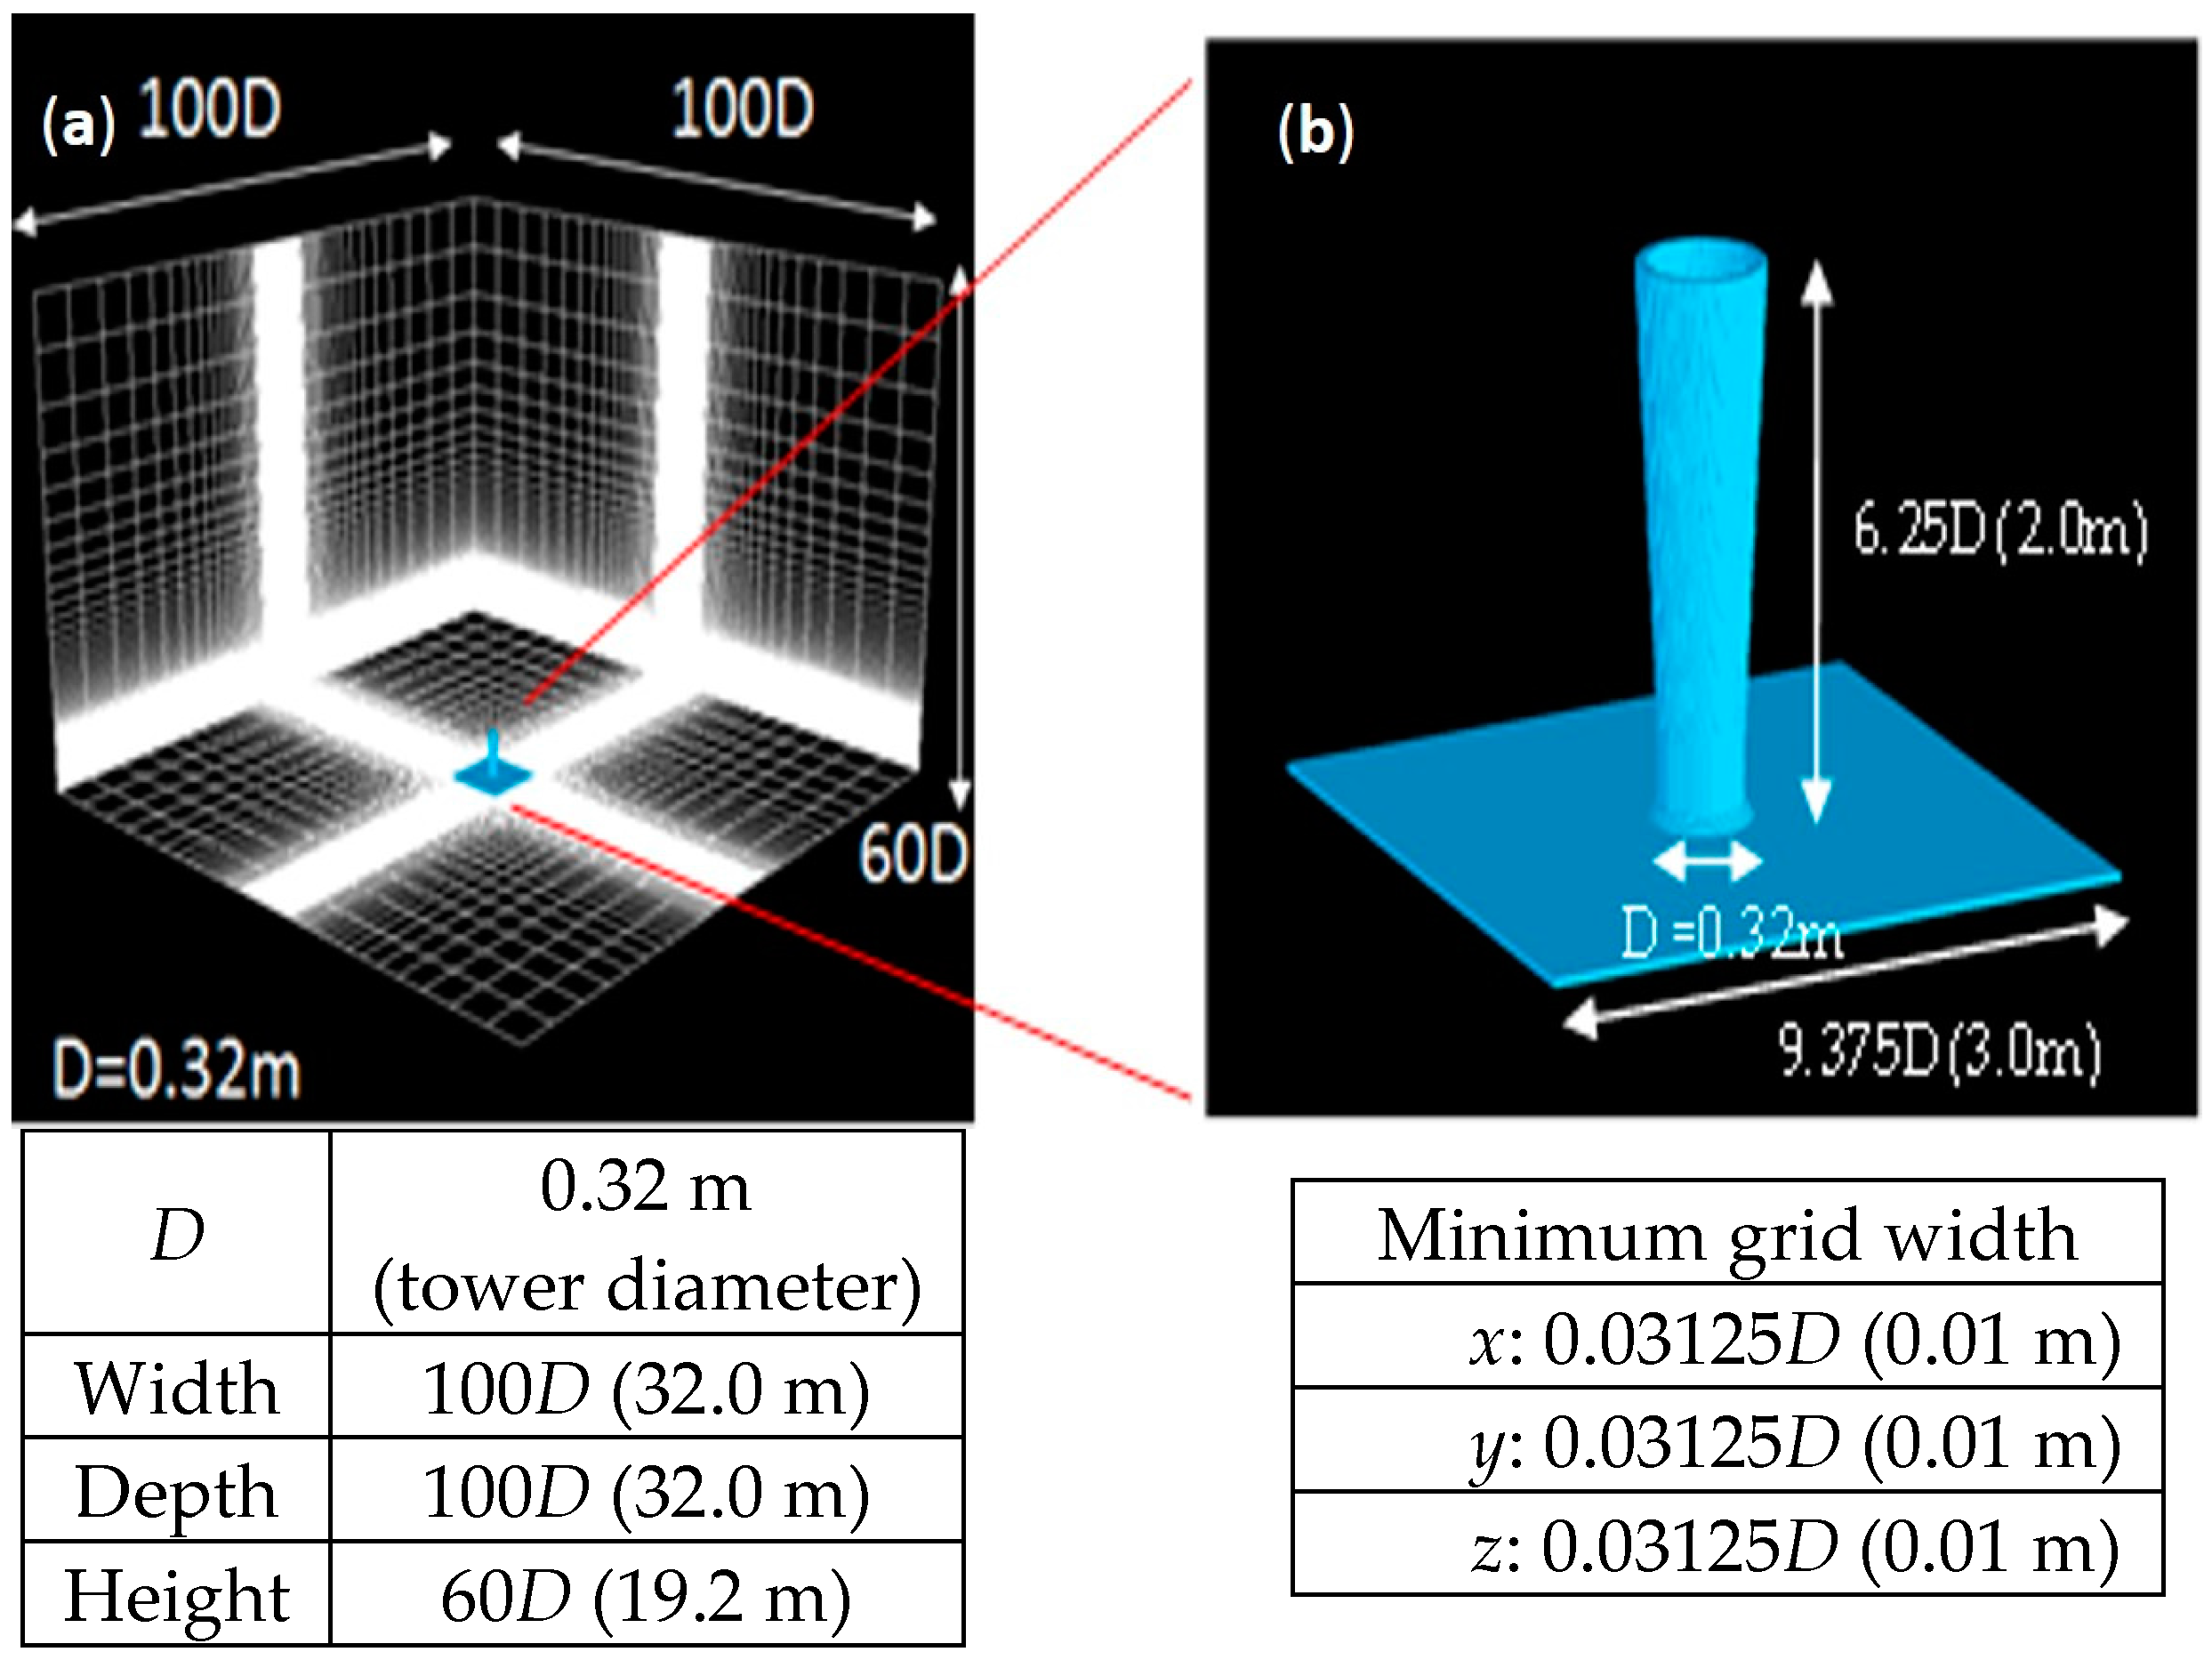
Figure 11 illustrates the entire computational domain and computational grids around a solar tower model, respectively. In the simulations, the Reynolds number Re, which is based on the inner diameter of the bottom of the diffuser tower
D (0.32 m;
Figure 11b), were the same as those in the laboratory experiment. To establish an almost steady thermal condition around the solar tower, a very large computational domain of 32 m (100
D) × 32 m (100
D) × 19.2 m (60
D) was adopted. To investigate the grid resolution dependence, two kinds of grid systems of 121 × 121 × 131 and 141 × 141 × 151 were tested for the computational domain. The latter grid system in the present simulation showed the same flow rate between the bottom and top of the tower. Namely, the simulation using 141 × 141 ×151 grid points was confirmed to provide numerical results with high accuracy. As discussed later, there was good agreement in terms of profiles of updraft speed and static pressure inside the tower between laboratory experiment and simulation. From these results, it was concluded that there was no essential difference between from the simulated and laboratory experiment flows in the given Re range. Boundary conditions were defined as follows. For velocity, the no-slip conditions were set for the ceiling, bottom and body. For the four sides, the periodical conditions were assumed. For temperature, on the bottom, the Dirichlet condition of 100 °C on the heated plate was set, and the other bottom field to 17 °C. The adiabatic conditions for the body and ceiling, and periodic conditions for the four sides were assumed. For pressure, the Neumann condition was established for the bottom and ceiling, and the periodic conditions for the four sides.
5.2. Computational Results
5.2.1. Effect of a Diffuser Tower with Various Semi-Open Angles
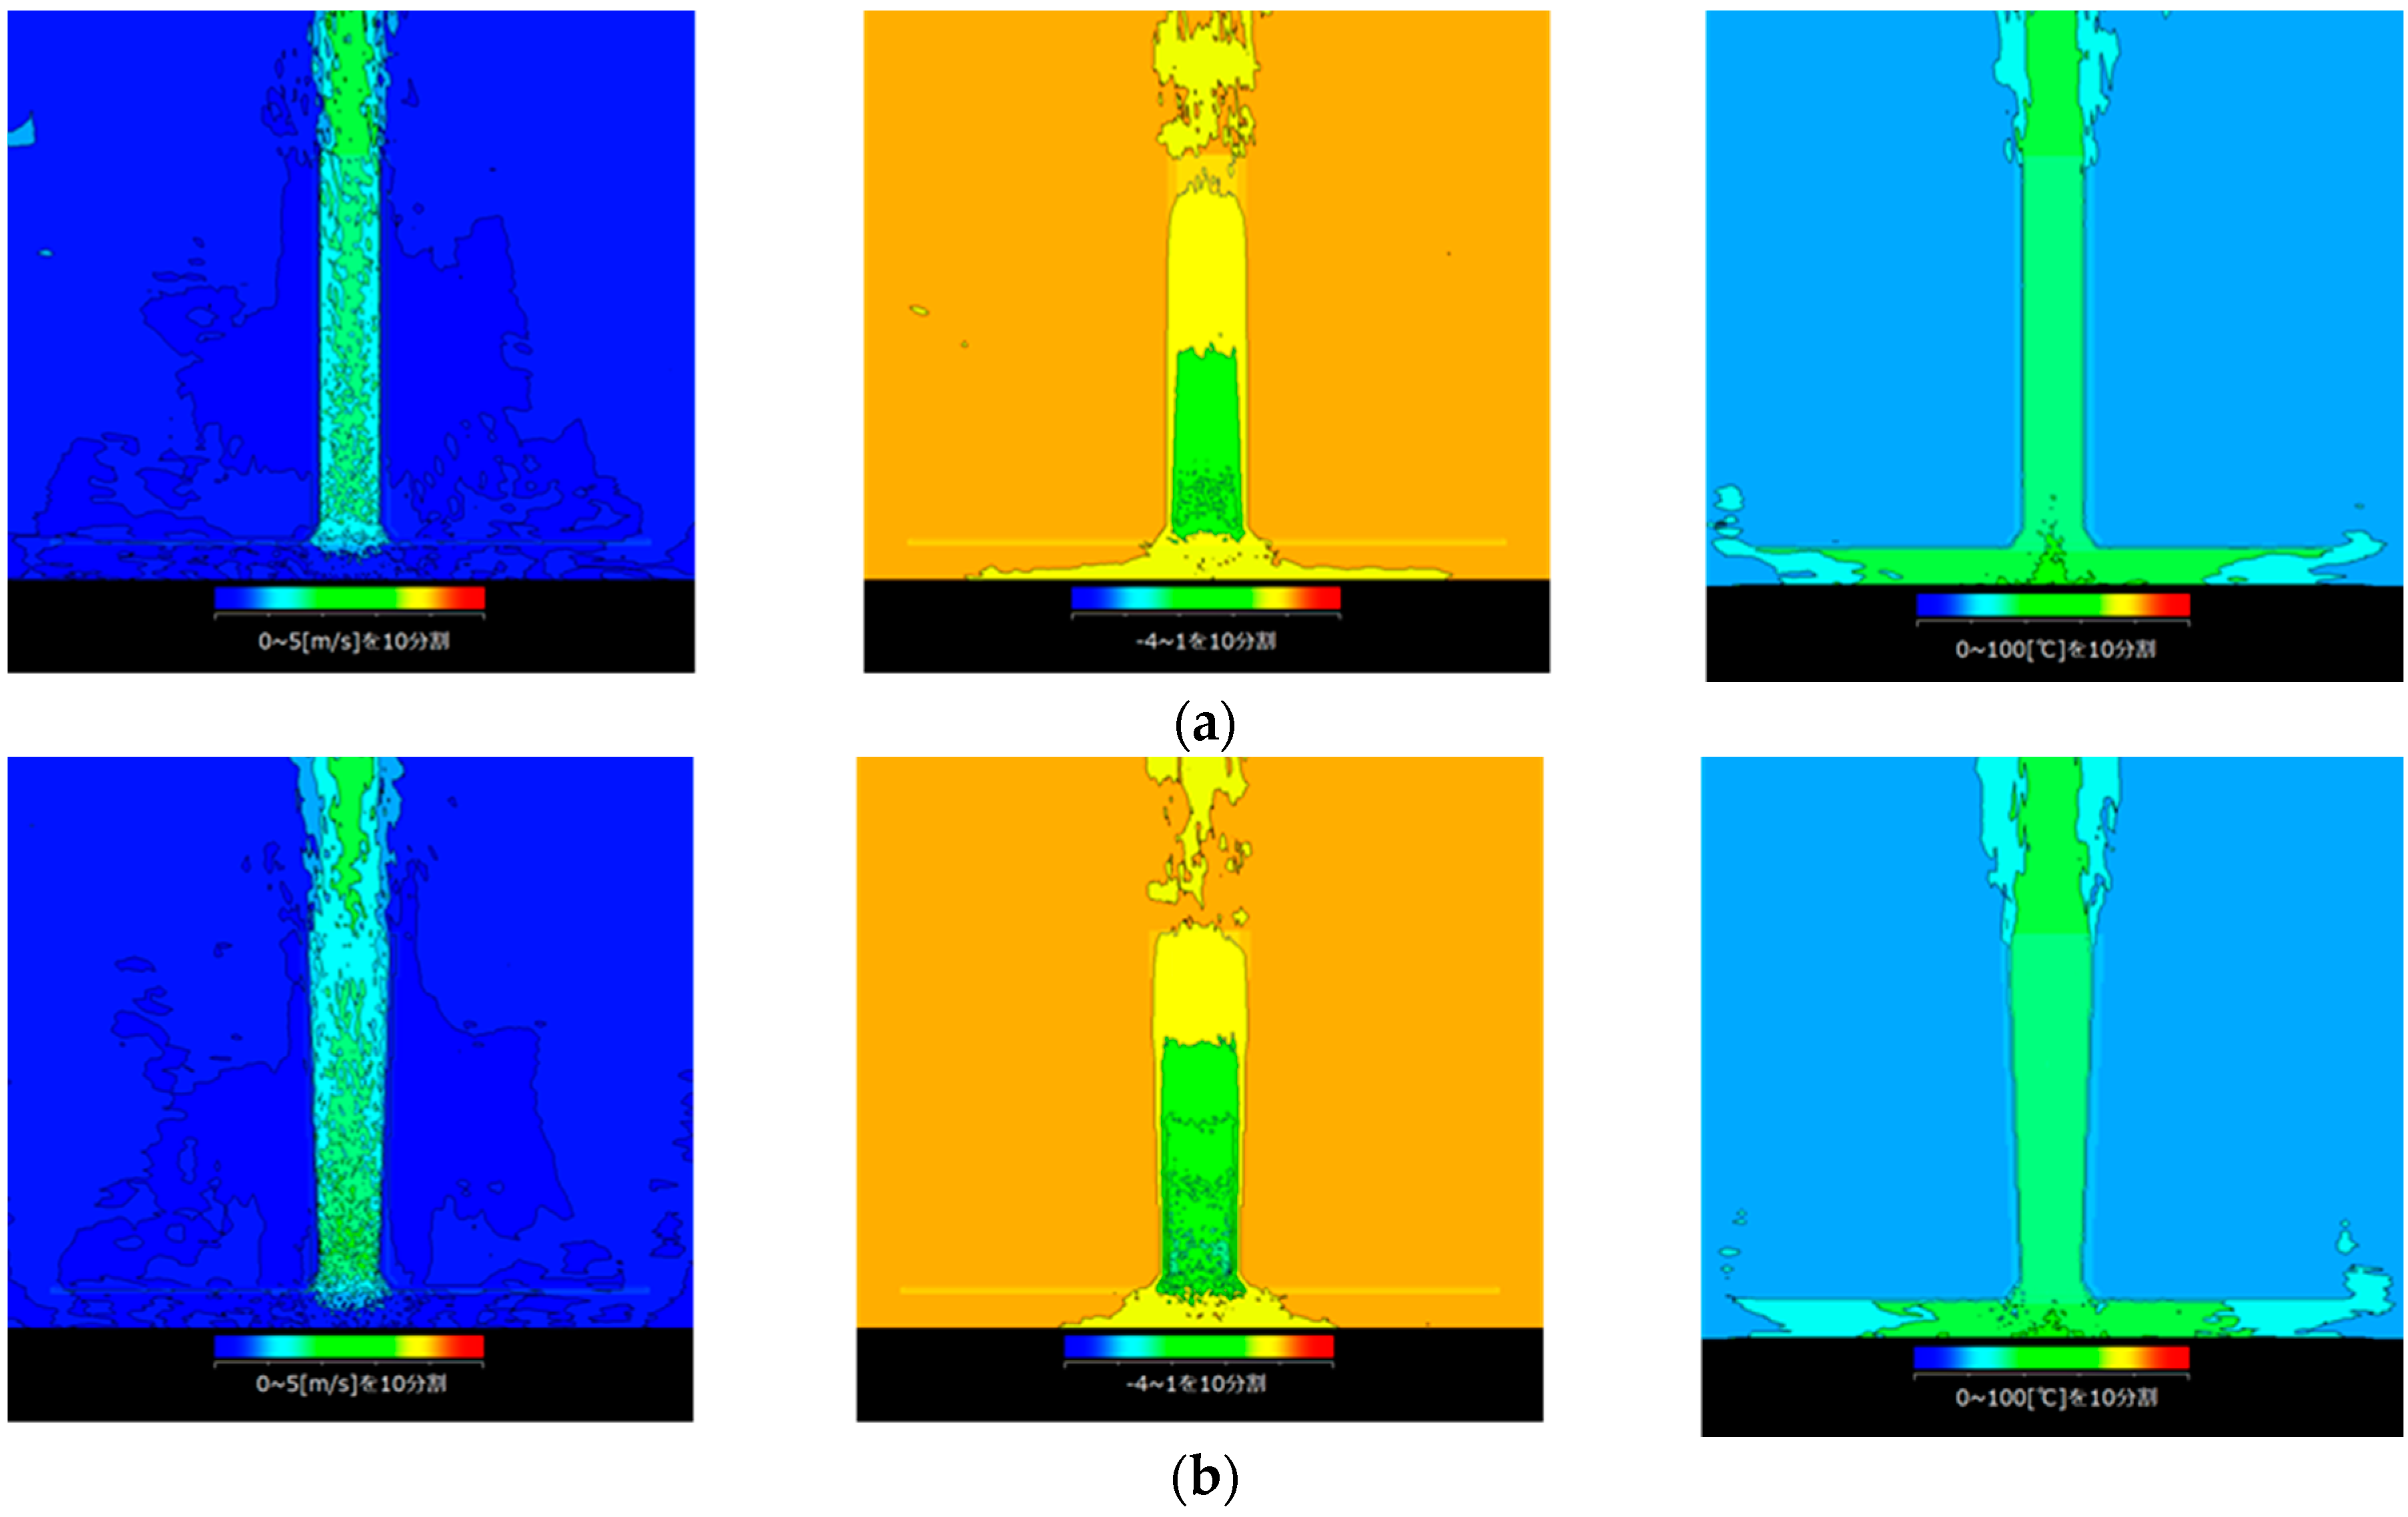
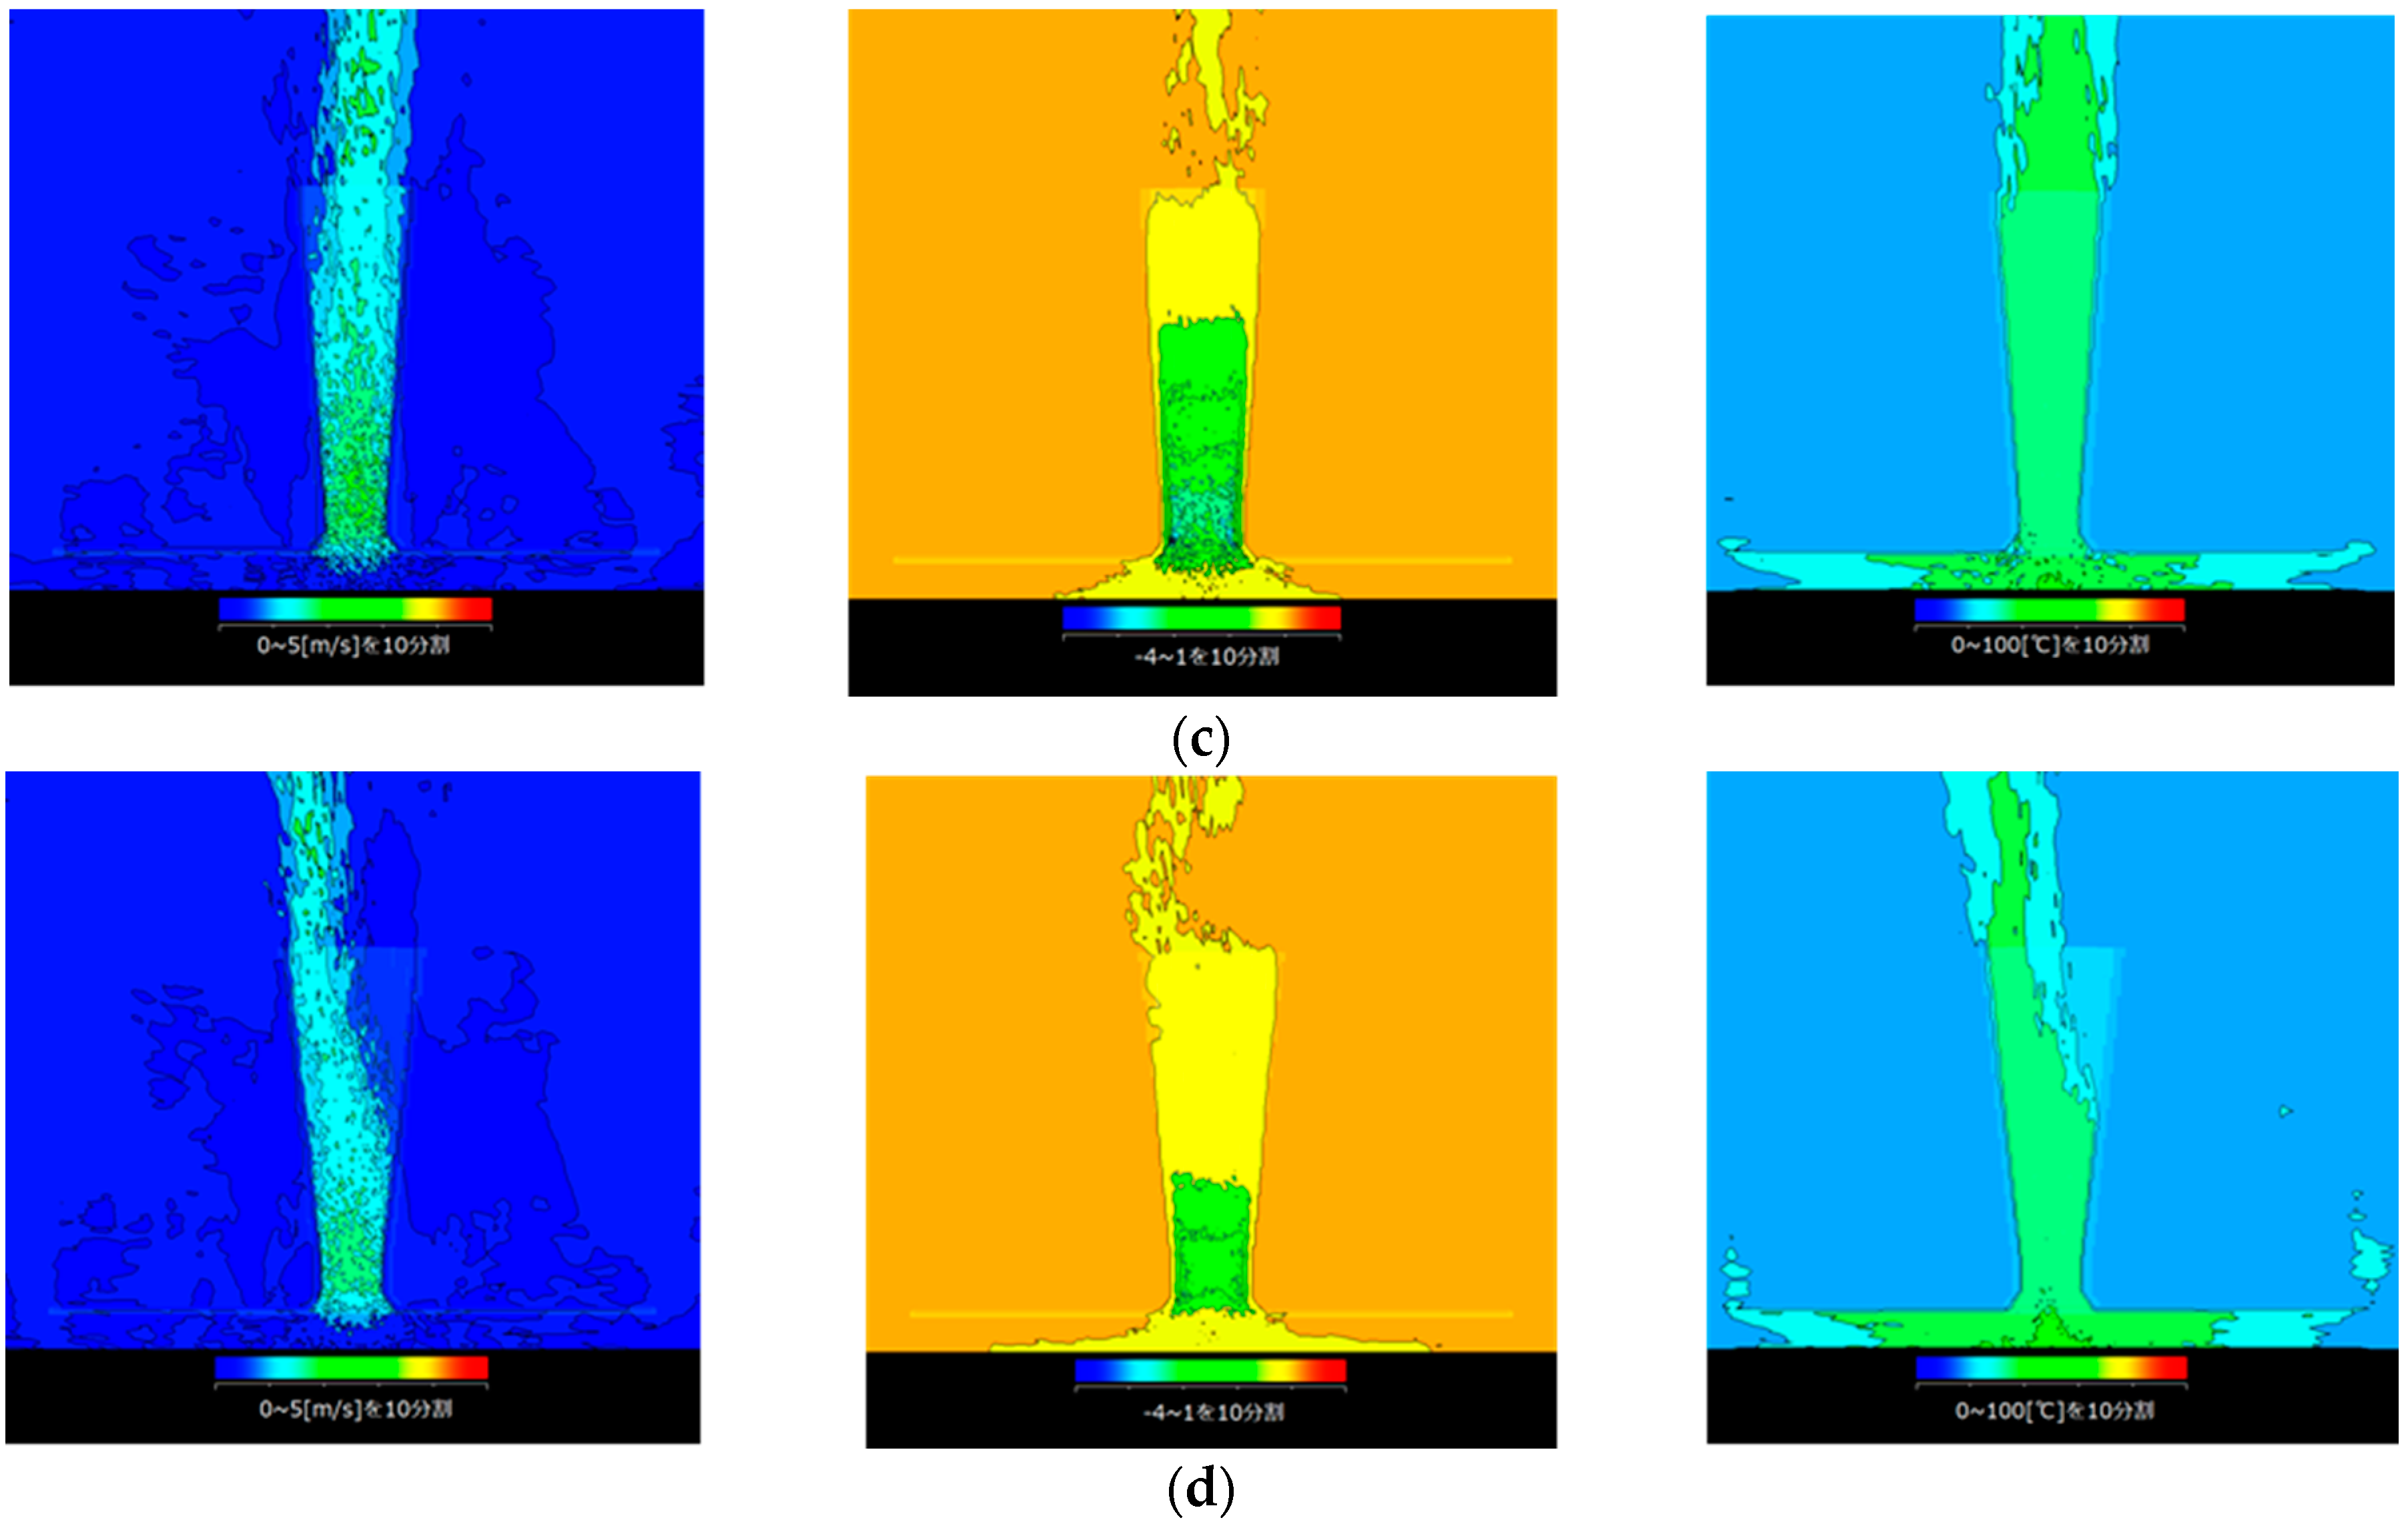
Figure 12 shows computational results of the instantaneous speed, static pressure and temperature fields of the updraft (
w field) inside the tower with the height
h = 2.0 m for each semi-open angle of 0° (cylinder), 2°, 4° and 6°. For the case of 4° (
Figure 12c),
w is larger and the static pressure is lower near the bottom of the tower, compared to other semi-open angles. For the case of 6° (
Figure 12d), the updraft is separated from the inside wall of the tower, showing a pressure loss.
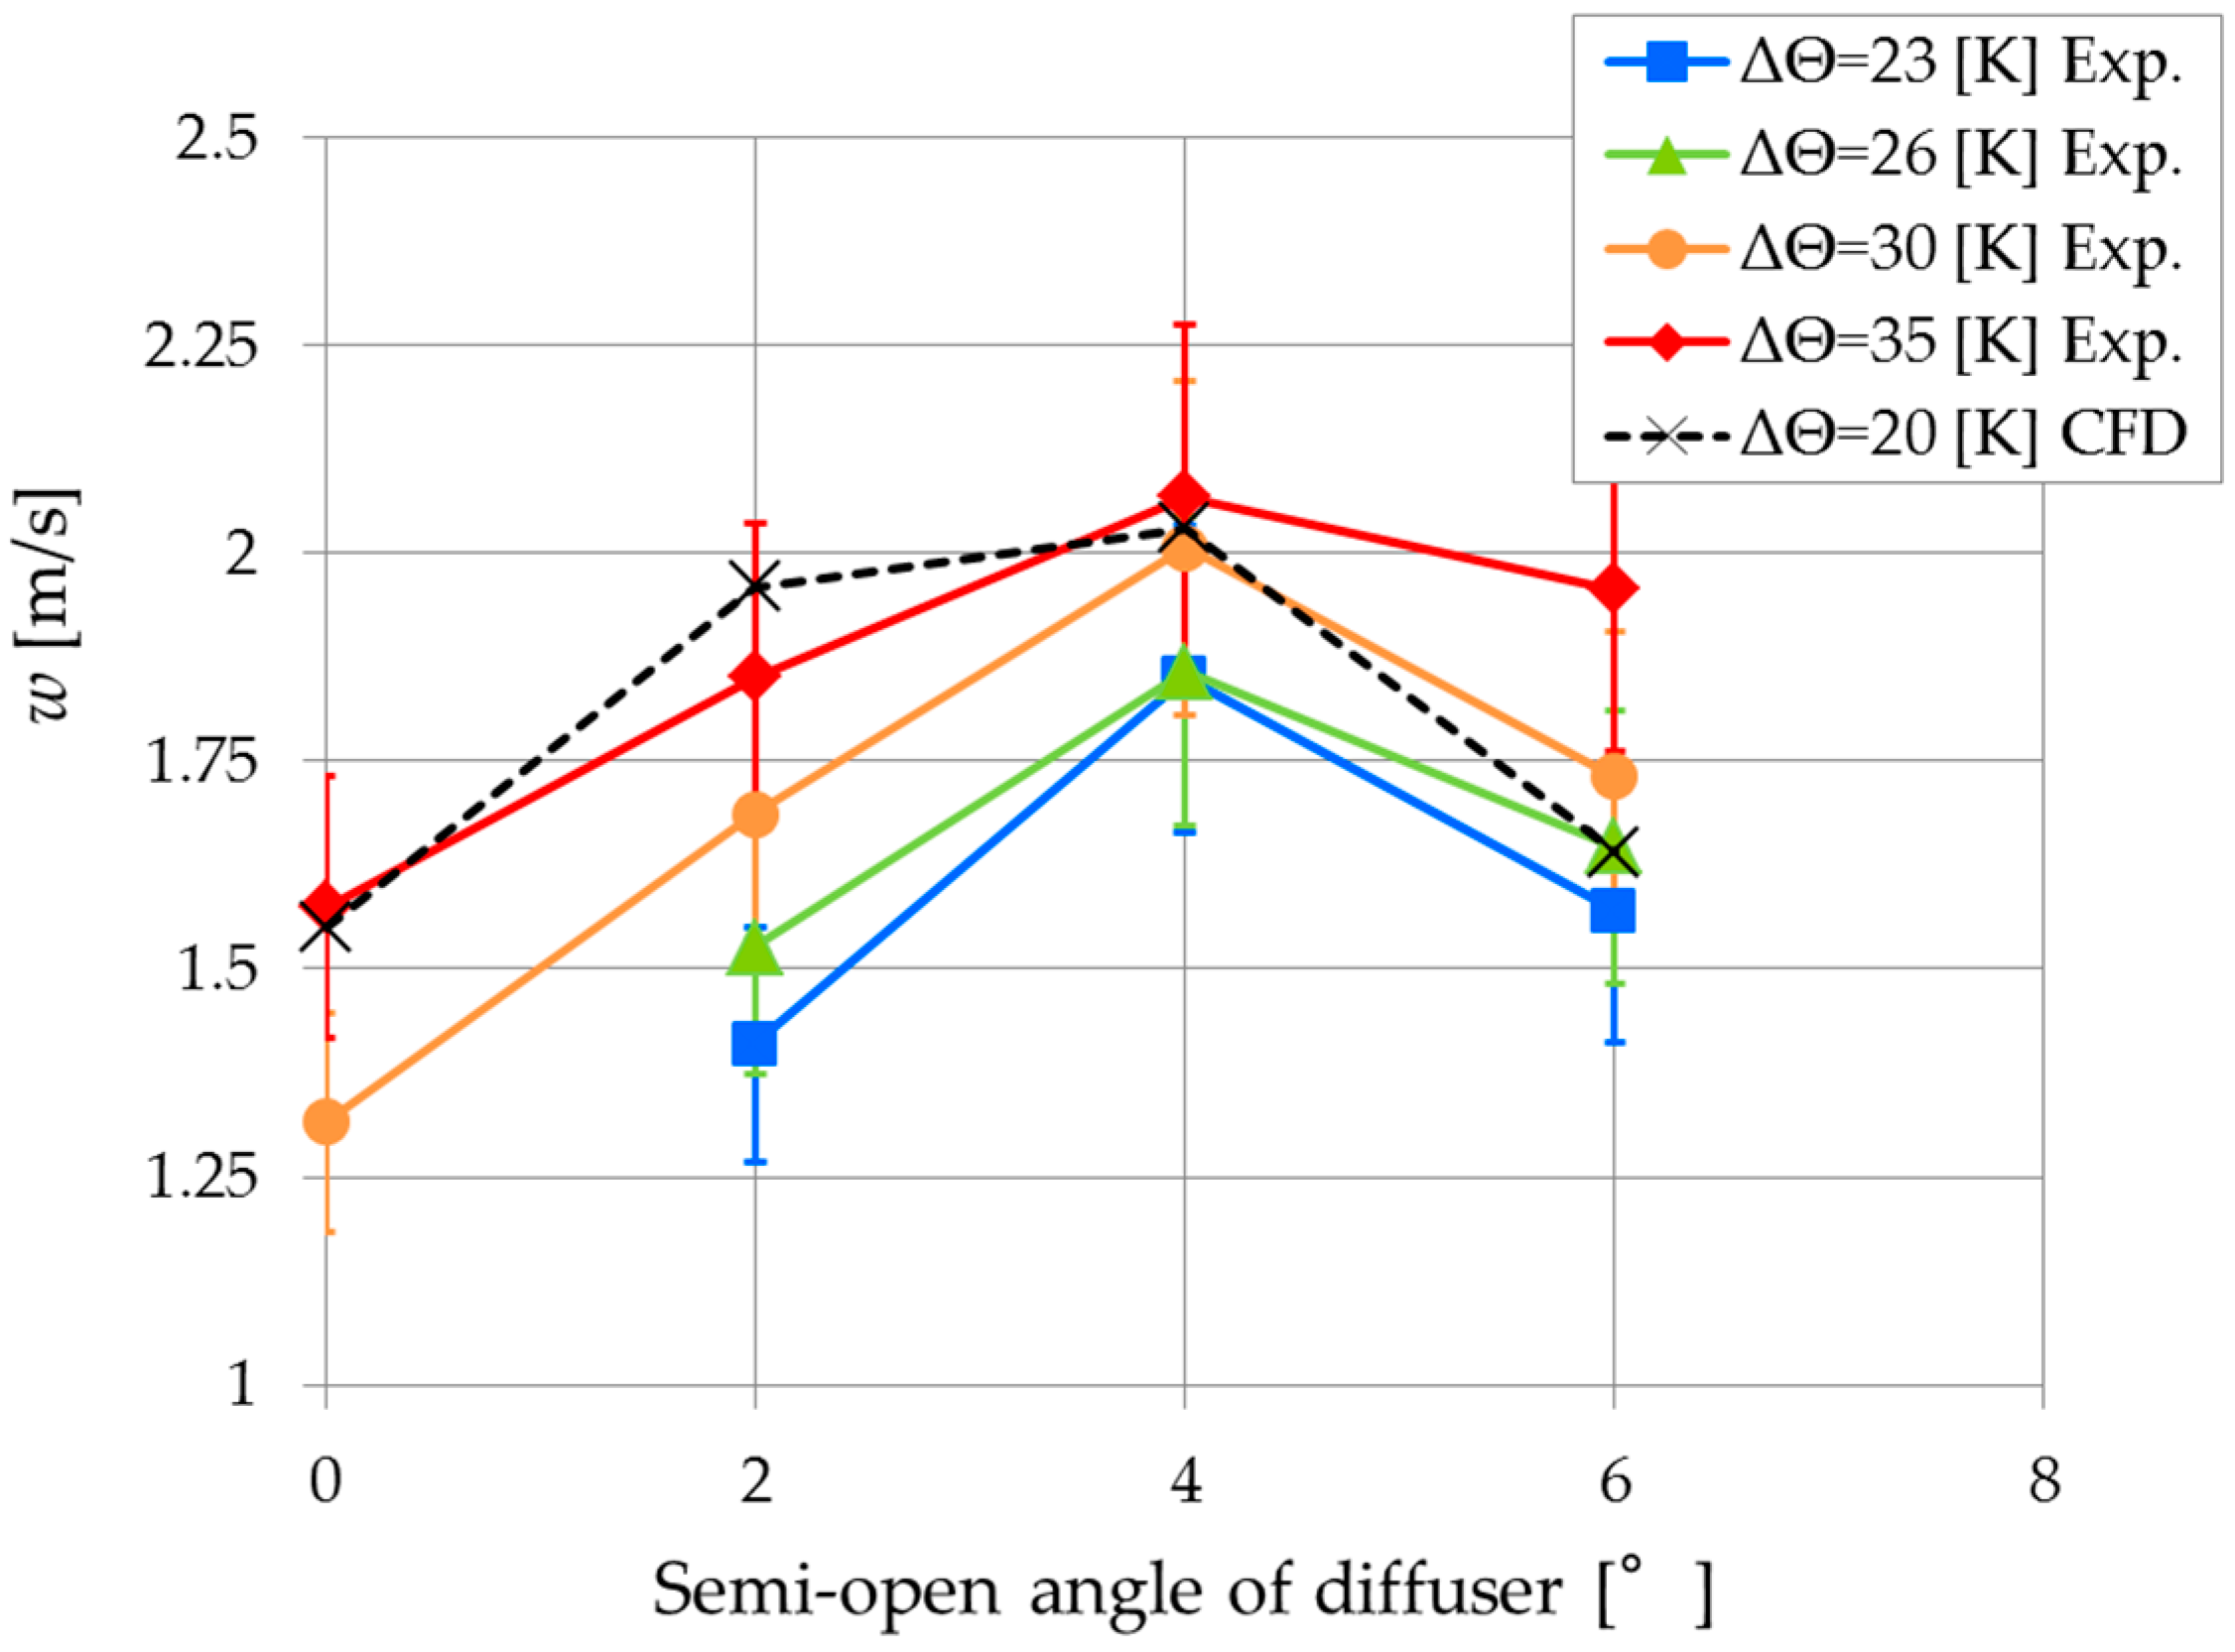
Figure 13 shows
w at a height of
z = 450 mm (the same position as that in the experiments;
Figure 5) with the semi-open angle, together with the experimental results. Both the CFD and experiment showed similar tendencies, with a maximum
w for the semi-open angle of 4°. This is therefore a suitable semi-open angle for the solar tower.
5.2.2. The Effect of a Diffuser Tower at Various Heights
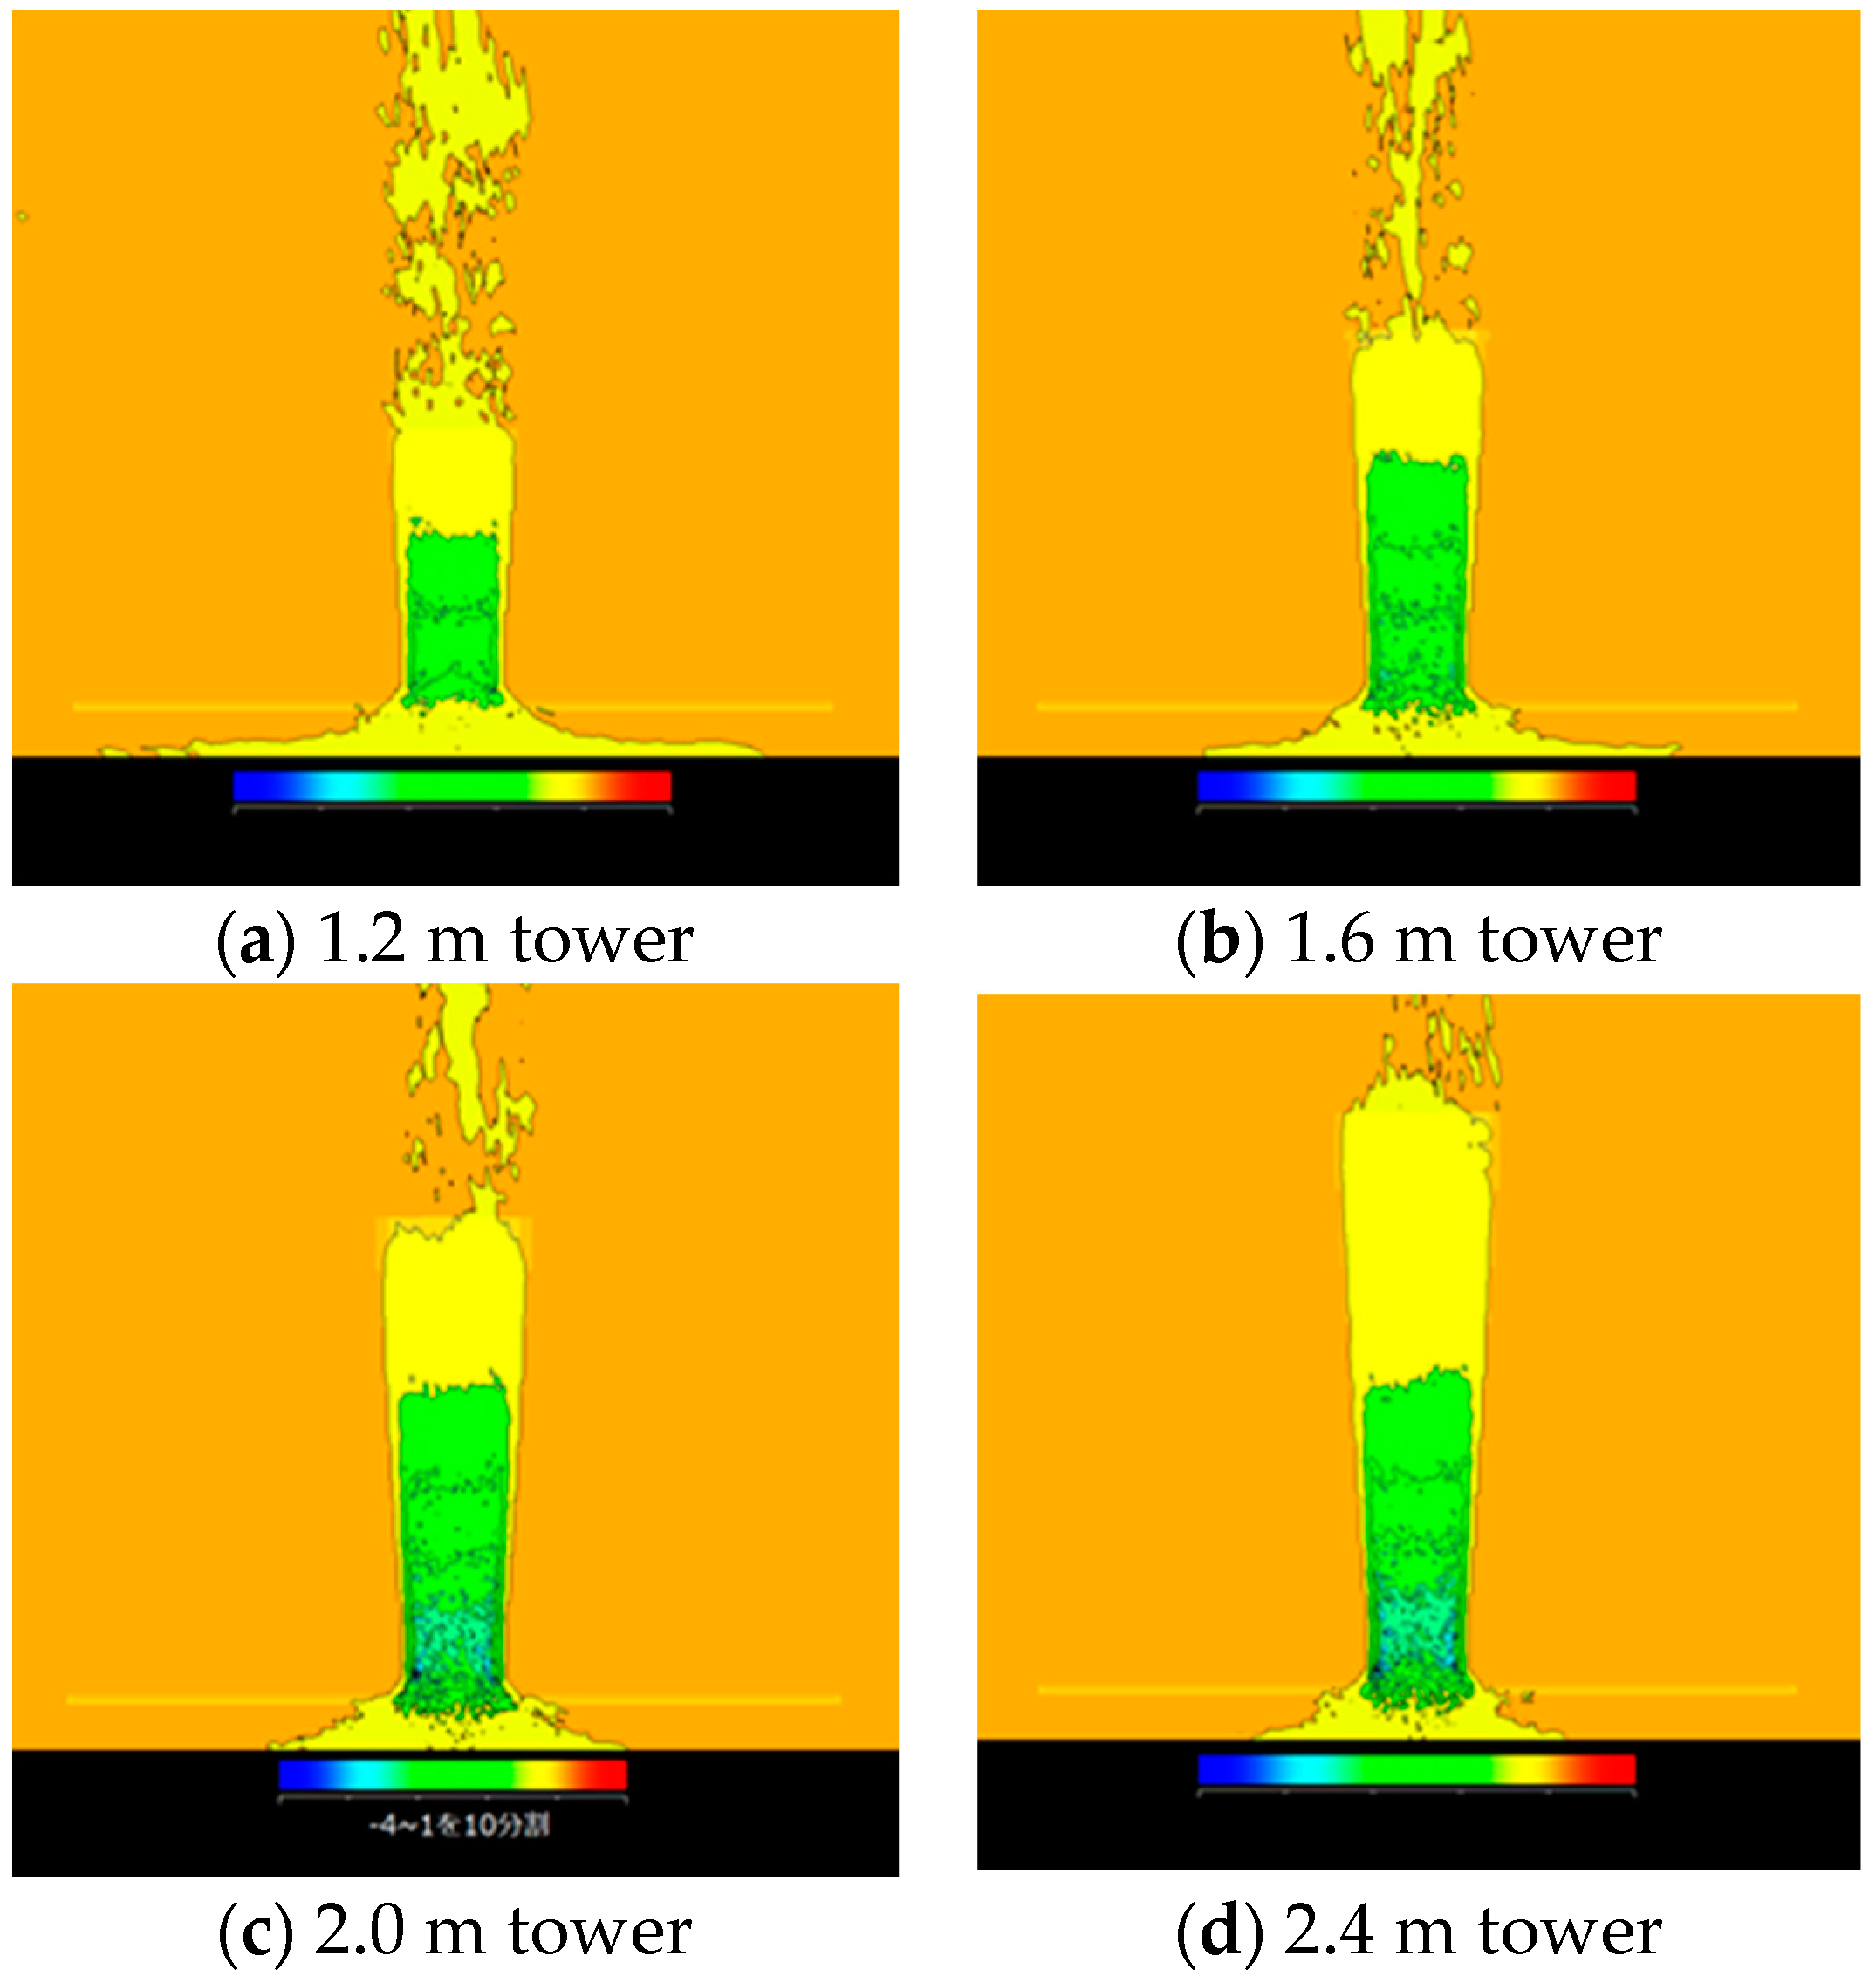
Figure 14 shows computational results for the instantaneous pressure field of the updraft inside the tower for each
h of 1.2, 1.6, 2.0 and 2.4 m. The pressure field near the bottom of each tower reaches lower values with
h, as seen in
Figure 14a–d.
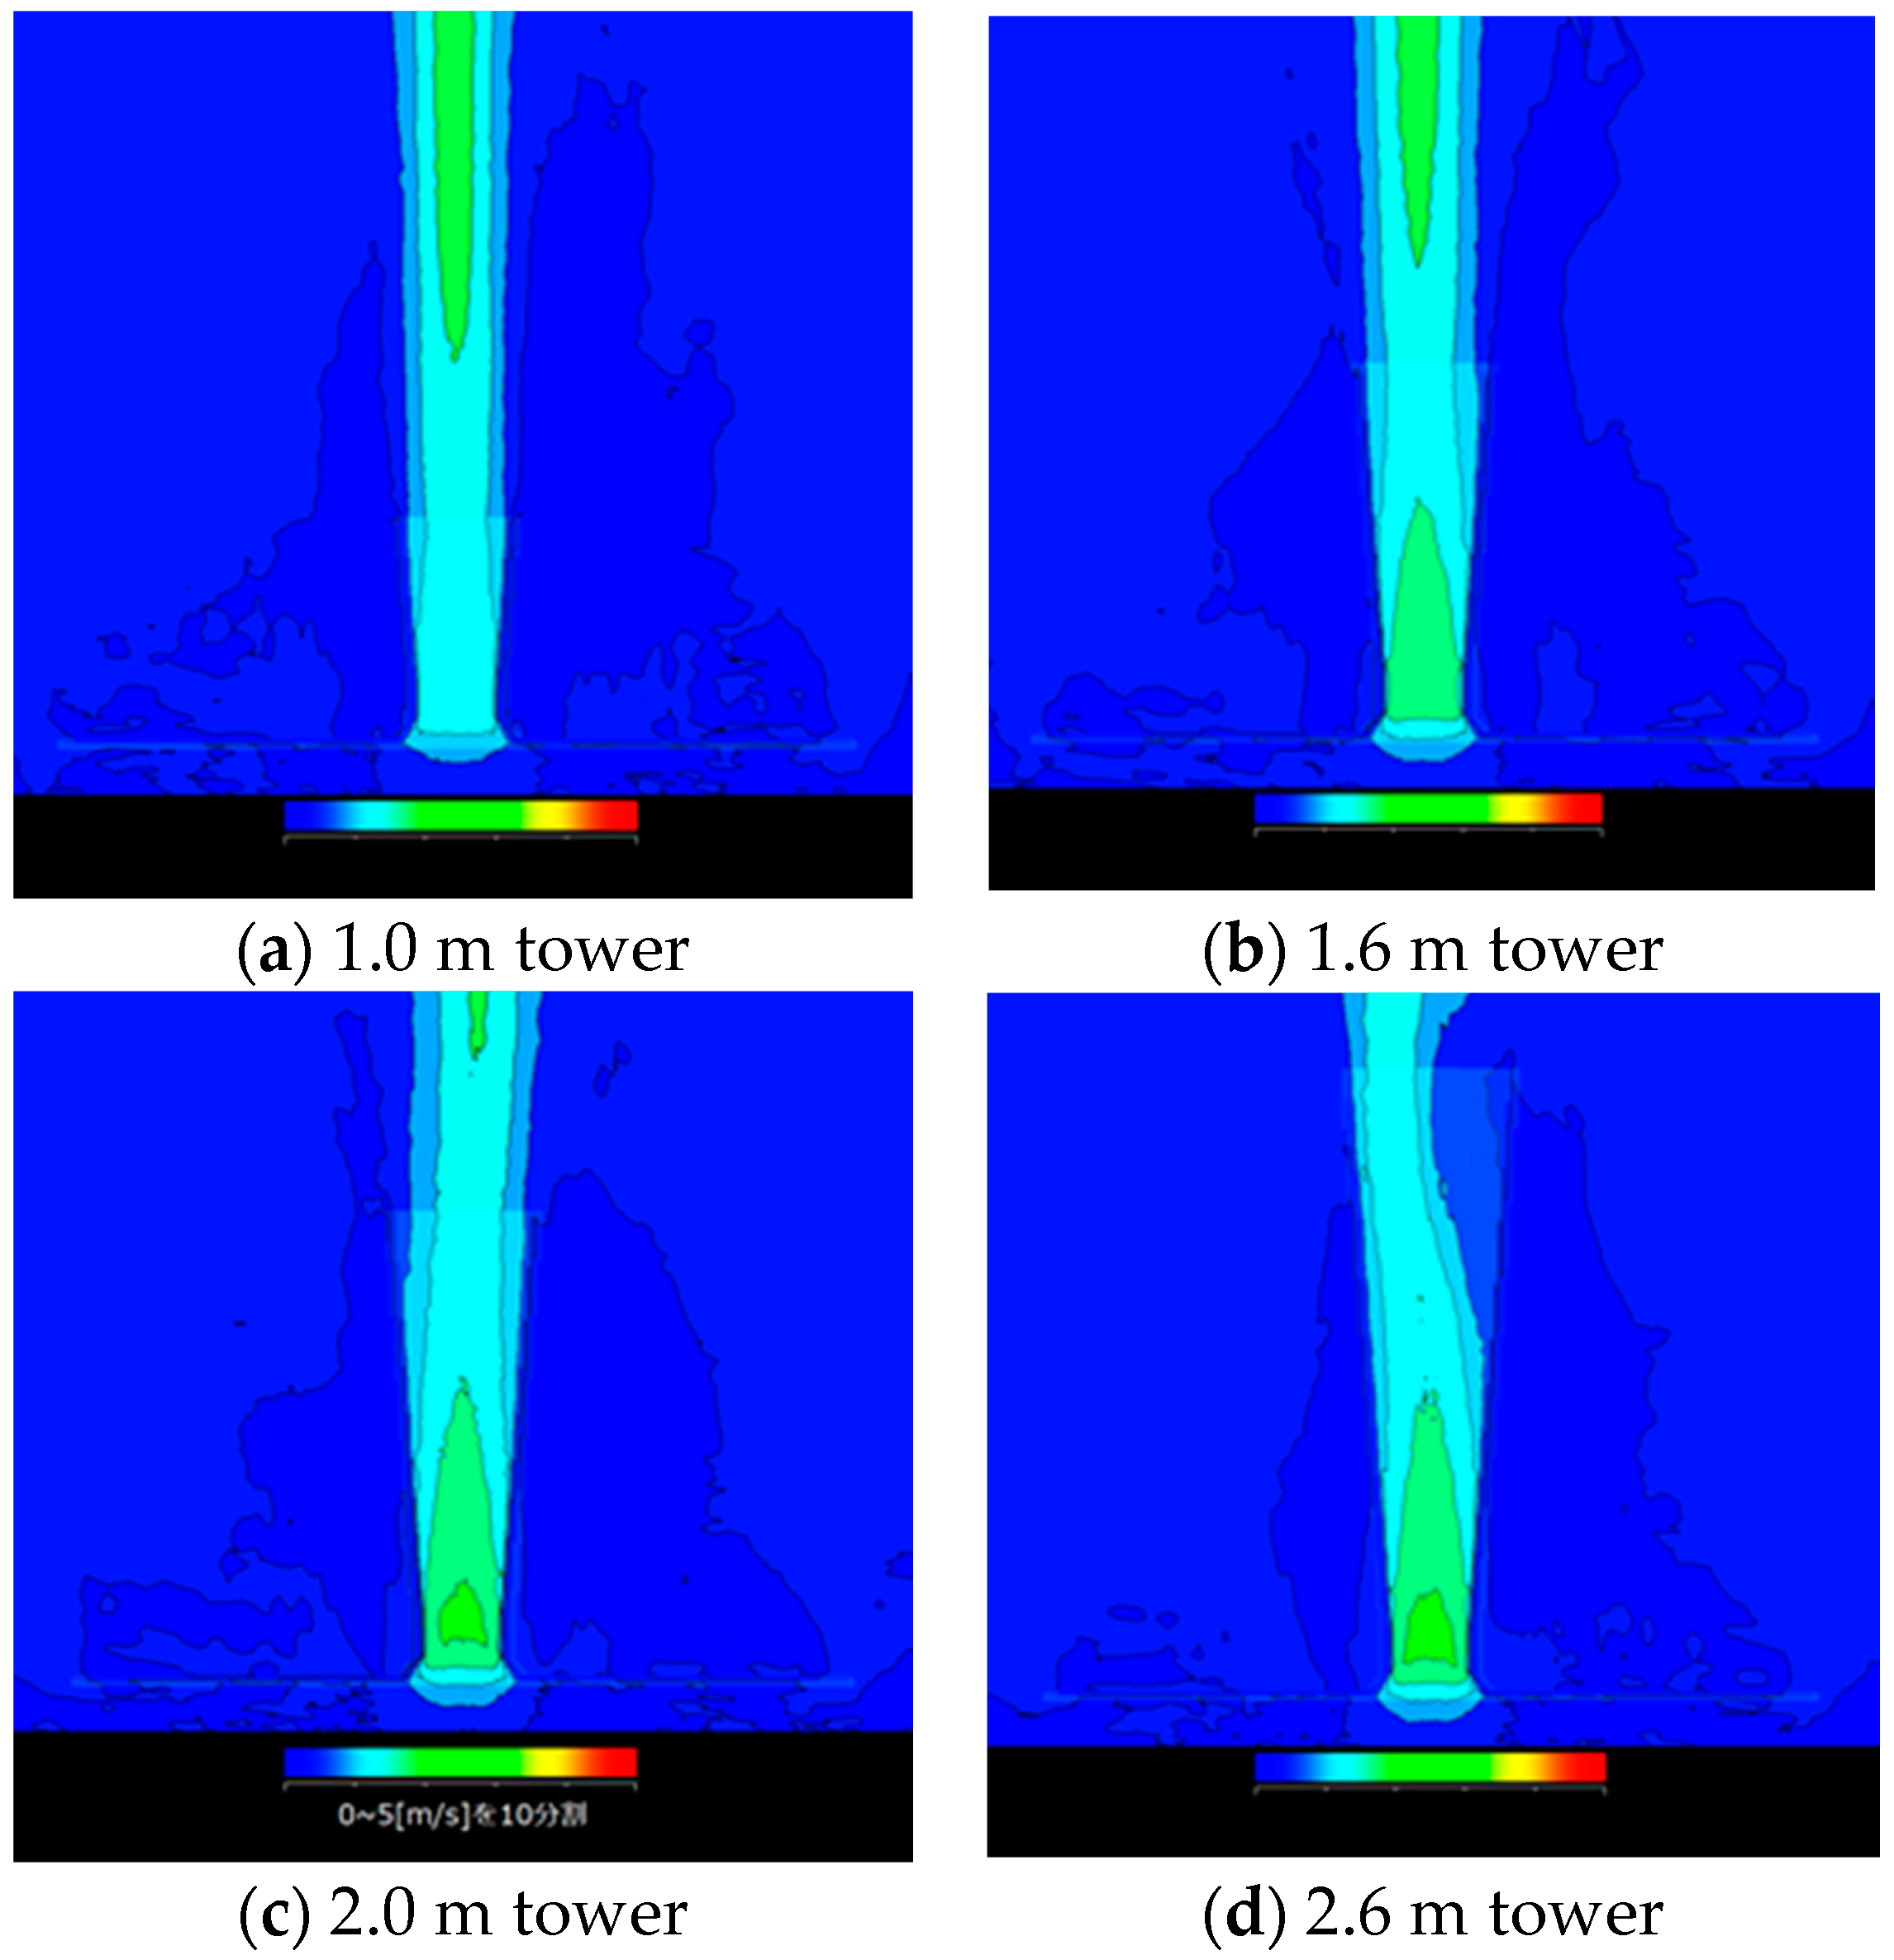
Figure 15 shows time-mean
w inside the tower at heights of 1, 1.6, 2.0 and 2.6 m. It was found that the mean
w near the bottom of each tower increases with
h. However, for the case of
h = 2.6 m shown in
Figure 15d, the updraft is separated from the inside wall in the upper part of the tower.
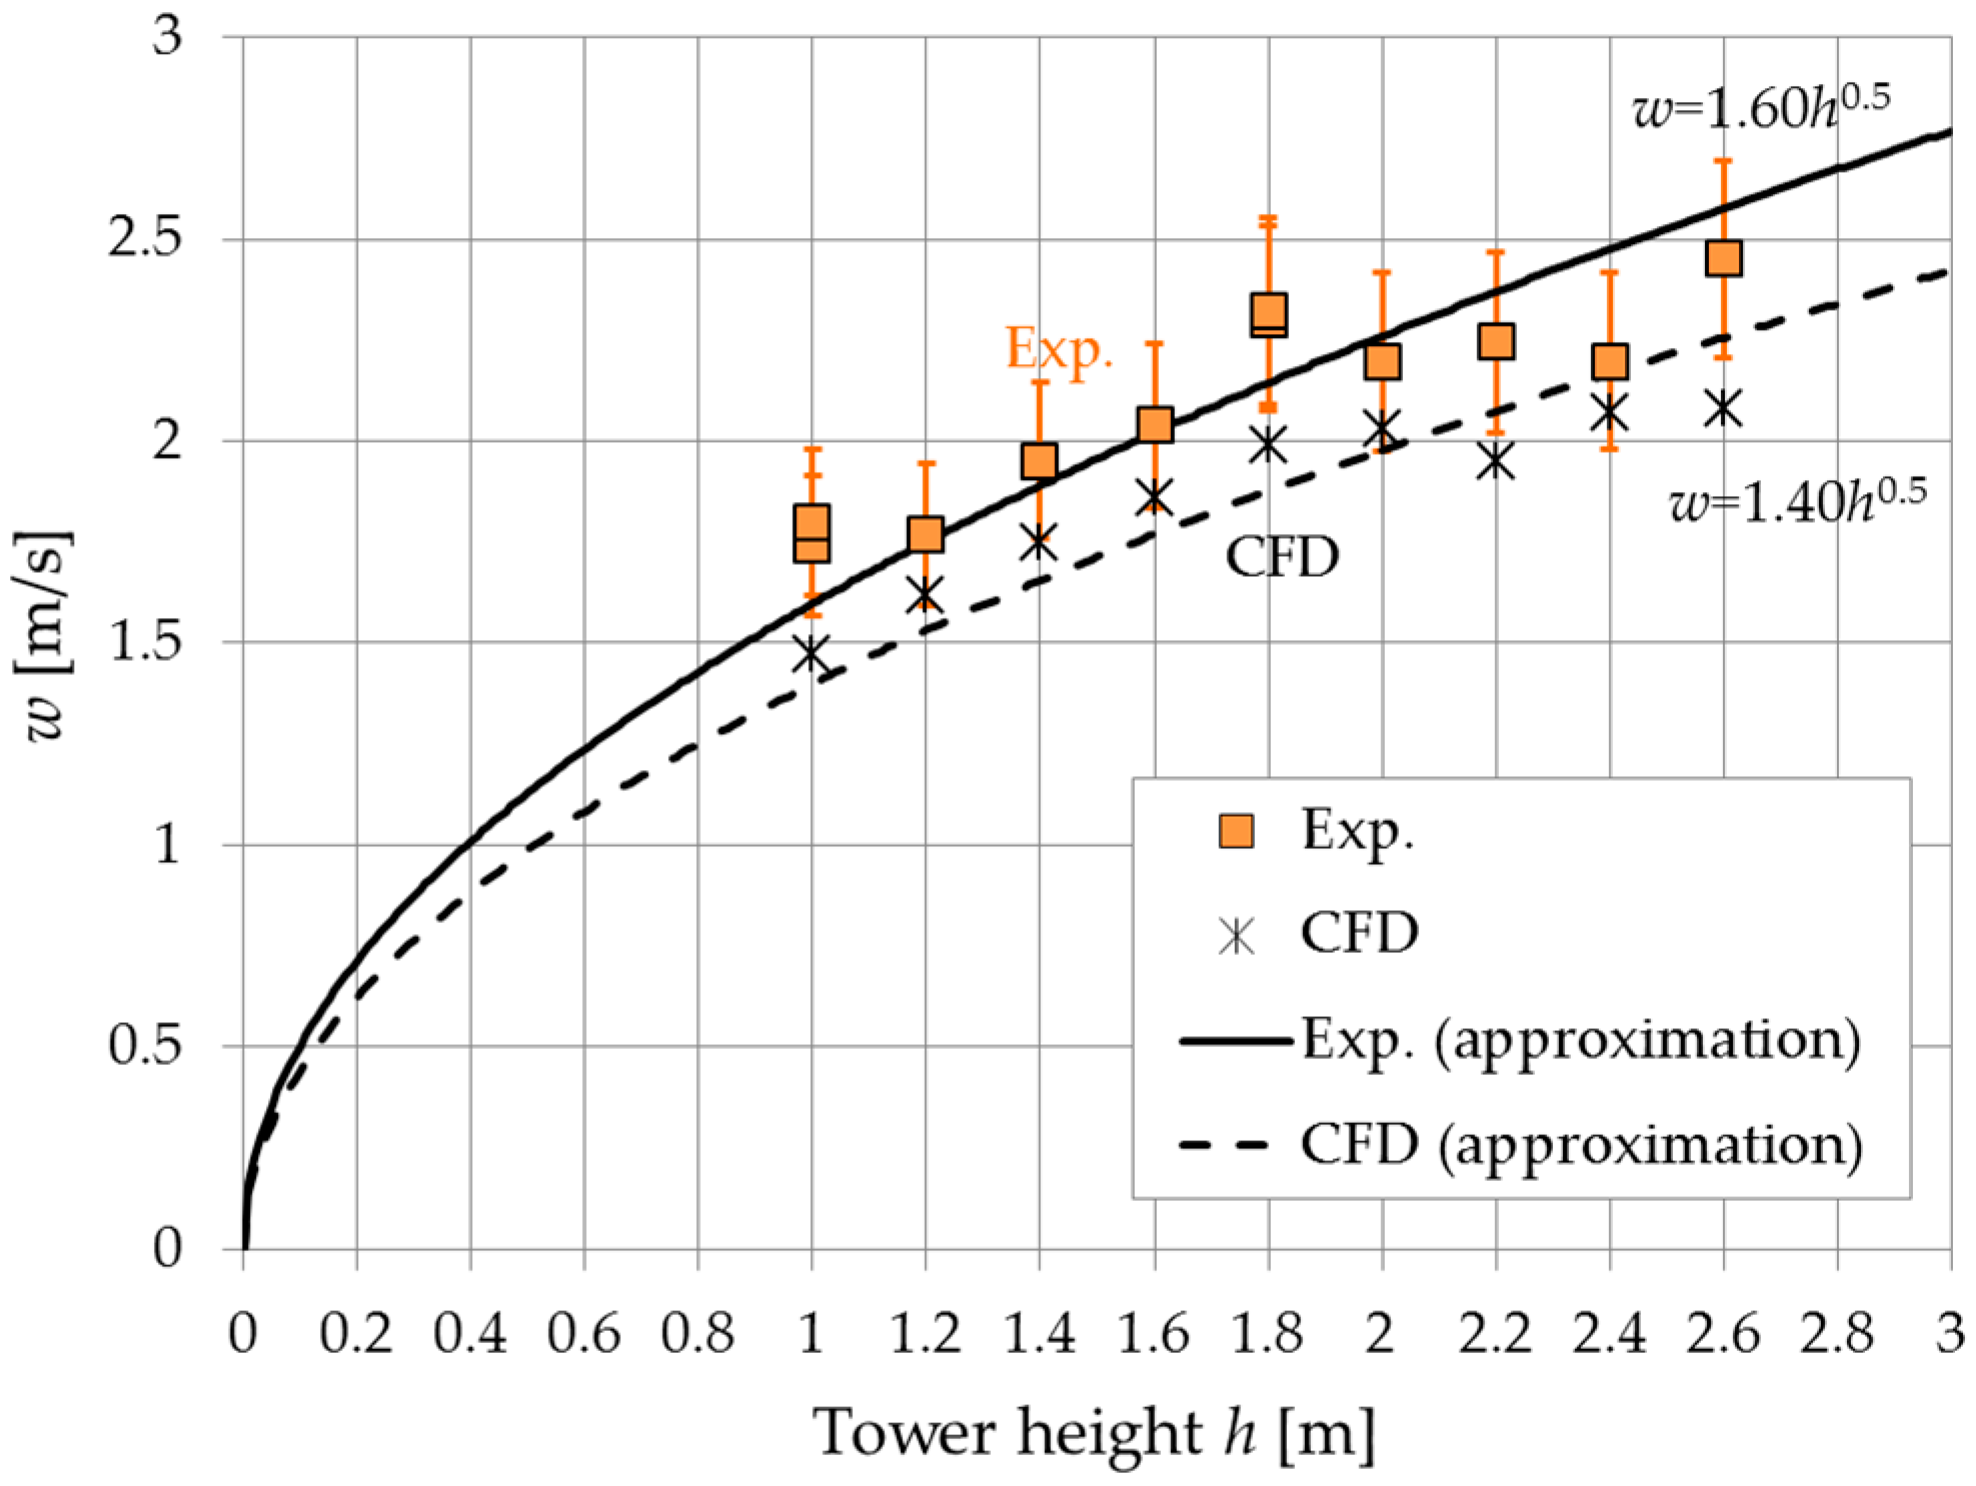
Figure 16 displays curves of the relationship between
w and
h, which includes the experimental data.
w was proportional to the square root of
h in both the experiment and CFD results, i.e.,
w .
6. Conclusions
Laboratory experiments and numerical analyses (CFD) for a solar tower were performed. For the experiments indoors, a solar tower model with height of h = 2 m was used as the basic model. To determine the optimal configuration for the tower, the effects of the semi-open angle of a diffuser tower and the tower height, h, on updraft speed, w, were investigated.
First, earlier results from our laboratory were confirmed; namely, for solar energy utilization using a solar tower, diffuser-shaped towers increase power output by 4–5 times relative to conventional cylinder-shaped towers. ]
The scaling law predicted by a simple theory from the Navier-Stokes equation under the Boussinesq assumption was confirmed by the experiments, i.e., the updraft speed w inside the tower is proportional to the square root of the ratio of a larger tower height h to a smaller one.
Second, a suitable diffuser shape with a semi-open angle was found varying that angle from 0° (cylinder) to 2°, 4° and 6°. The diffuser tower with 4° is the optimal shape, producing the fastest w at each temperature difference ∆Θ between the inside collector and ambient air aloft in both the present laboratory experiment and CFD results.
Third, the relationships between w and h, and between w and ∆Θ were studied. The laboratory experiments and CFD results both showed that w is proportional to the square root of h and also ∆Θ, i.e., w and w .
Incidentally, based on the laboratory experiments and numerical analyses described above, a prototype of a solar tower with 10 m height was constructed in the field. Many data from the field experiment are being obtained, showing a scaling law from 2 m to 10 m tower height. At the same time, this solar tower can also utilize wind energy. As was suggested by Okada et al. [
25], a newly designed solar tower can also be used to harness wind energy as well as solar energy. A prospective renewable energy facility, called a wind solar tower (WST), that can use sunshine energy and wind energy simultaneously is proposed. We intend to report those results in future papers.
Acknowledgments
We gratefully acknowledge our laboratory staff, Keiji Matsushima and Kenichiro Sugitani, Research Institute for Applied Mechanics, Kyushu University, for their great cooperation in the experiments and data analysis. The research was financially supported by two Grant-in-Aids for Scientific Research, Nos. 14205139 and 24246161, sponsored by the Ministry of Education, Science and Culture, Japan (for the first author).
Author Contributions
Yuji Ohya and Masaki Wataka performed the experiments, analyzed the data, CFD and wrote the manuscript. Koichi Watanabe supported with fruitful discussions about the experimental results and general knowledge of thermodynamics. Takanori Uchida contributed fundamental information about CFD.
Conflicts of Interest
The authors declare no conflict of interest. The funding sponsors had no role in the design of the study, the collection, analyses or interpretation of data, the writing of the manuscript, and the decision to publish the results.
References
- Schlaich, I. The Solar Chimney; Edition Axel Menges: Stuttgart, Germany, 1995. [Google Scholar]
- Richards, R. Spanish solar chimney nears completion. Mod. Power Syst. 1981, 6, 21–23. [Google Scholar]
- Richards, R. Hot air starts to rise through Spain’s solar chimney. Electr. Rev. 1982, 210, 26–27. [Google Scholar]
- Haaf, W.; Friedrich, K.; Mayr, G.; Schlaich, J. Solar Chimneys Part I: Principle and construction of the pilot plant in Manzanares. Int. J. Sol. Energy 1983, 2, 3–20. [Google Scholar] [CrossRef]
- Haaf, W. Solar chimneys Part II: Preliminary test results from the Manzanares pilot plant. Int. J. Sol. Energy 1984, 2, 141–161. [Google Scholar] [CrossRef]
- Schlaich, J.; Bergermann, R.; Schiel, W.; Weinrebe, G. Design of commercial solar updraft tower systems—Utilization of solar induced convective flows for power generation. J. Sol. Energy Eng. 2005, 127, 117–124. [Google Scholar] [CrossRef]
- Trieb, F.; Langnib, O.; Klaib, H. Solar electricity generation—A comparative view of technologies, costs and environmental impact. Sol. Energy 1997, 59, 89–99. [Google Scholar] [CrossRef]
- Dhahri, A.; Omri, A. A review of solar chimney power generation technology. Int. J. Eng. Adv. Technol. (IJEAT) 2013, 2–3, 1–17. [Google Scholar]
- Altman, T.; Carmel, Y.; Guetta, R.; Zaslavsky, D.; Doytsher, Y. Assessment of an “energy tower” potential in Australia using a mathematical model and GIS. Sol. Energy 2005, 78, 799–808. [Google Scholar] [CrossRef]
- Gannon, A.J.; von Backström, T.W. Solar chimney cycle analysis with system loss and solar collector performance. J. Sol. Energy Eng. 2000, 122, 133–137. [Google Scholar] [CrossRef]
- Koonsrisuk, A.; Chitsomboon, T. Dynamic similarity in solar chimney modeling. Sol. Energy 2007, 81, 1439–1446. [Google Scholar] [CrossRef]
- Koonsrisuk, A.; Lorente, S.; Bejan, A. Constructal solar chimney configuration. Int. J. Heat Mass Transf. 2010, 53, 327–333. [Google Scholar] [CrossRef]
- Koonsrisuk, A.; Chitsomboon, T. Effects of flow area changes on the potential of solar chimney power plants. Energy 2013, 51, 400–406. [Google Scholar] [CrossRef]
- Patel, S.K.; Prasad, D.; Ahmed, M.R. Computational studies on the effect of geometric parameters on the performance of a solar chimney power plant. Energy Convers. Manag. 2014, 77, 424–431. [Google Scholar] [CrossRef]
- Bilgen, E.; Rheault, J. Solar chimney power plants for high latitudes. Sol. Energy 2005, 79, 449–458. [Google Scholar] [CrossRef]
- Ghalamchi, M.; Ghalamchi, M.; Ahanj, T. Numerical simulation for achieving optimum dimensions of a solar chimney power plant. Sustain. Energy 2013, 1–2, 26–31. [Google Scholar]
- Ming, T.; Gui, J.; Richter, R.K.; Pan, Y.; Xu, G. Numerical analysis on the solar updraft power plant system with a blockage. Sol. Energy 2013, 98, 58–69. [Google Scholar] [CrossRef]
- Shen, W.; Ming, T.; Ding, Y.; Wu, Y.; Richter, R.K. Numerical analysis on an industrial-scaled solar updraft power plant system with ambient crosswind. Renew. Energy 2014, 68, 662–676. [Google Scholar] [CrossRef]
- Gholamalizadeh, E.; Mansouri, S.H. A comprehensive approach to design and improve a solar chimney power plant: A special case—Kerman project. Appl. Energy 2013, 102, 975–982. [Google Scholar] [CrossRef]
- Gholamalizadeh, E.; Kim, M.-H. Three-dimensional CFD analysis for simulating the greenhouse effect in solar chimney power plants using a two-band radiation model. Renew. Energy 2014, 63, 498–506. [Google Scholar] [CrossRef]
- Gholamalizadeh, E.; Kim, M.-H. Thermo-economic triple-objective optimization of a solar chimney power plant using genetic algorithms. Energy 2014, 70, 204–211. [Google Scholar] [CrossRef]
- Okada, S.; Uchida, T.; Karasudani, T.; Ohya, Y. Improvement in solar chimney power generation by using a diffuser tower. J. Sol. Energy Eng. 2015, 137, 031009. [Google Scholar] [CrossRef]
- Motoyama, M.; Sugitani, K.; Ohya, Y.; karasudani, T.; Nagai, T.; Okada, S. Improving the power generation performance of a solar tower using thermal updraft wind. Energy Power Eng. 2014, 6, 362–370. [Google Scholar] [CrossRef]
- Wataka, M.; Motoyama, M.; Ohya, Y.; Karasudani, T.; Uchida, T. Improvement of power generation of the wind solar tower. In Proceedings of the International Conference on Power Engineering (ICOPE-15), Yokohama, Japan, 30 November–4 December 2015.
- Okada, S.; Ohya, Y.; Uchida, T.; Karasudani, T. Convergence of wind using VT-WCONVS (Vertical type wind convergence structure). In Proceedings of the International Conference on Renewable Energy, Yokohama, Japan, 9–13 October 2006.
Figure 1.
Power generation mechanism of a solar tower.
Figure 1.
Power generation mechanism of a solar tower.
Figure 2.
(a) Cylindrical type tower; (b) Diffuser type tower.
Figure 2.
(a) Cylindrical type tower; (b) Diffuser type tower.
Figure 3.
Thermal updraft speed w (m/s) with height z (mm) for temperature difference ∆Θ of ~20 K.
Figure 3.
Thermal updraft speed w (m/s) with height z (mm) for temperature difference ∆Θ of ~20 K.
Figure 4.
Power output of wind turbine installed near the bottom of a solar tower model vs. temperature difference ∆
Θ. Refer to
Figure 5, which shows the same experimental setup.
Figure 4.
Power output of wind turbine installed near the bottom of a solar tower model vs. temperature difference ∆
Θ. Refer to
Figure 5, which shows the same experimental setup.
Figure 5.
Experimental setup. Updraft wind speed w is measured by inserting an ultrasonic anemometer from the top into the tower. The dimension units in the right figure are all (mm).
Figure 5.
Experimental setup. Updraft wind speed w is measured by inserting an ultrasonic anemometer from the top into the tower. The dimension units in the right figure are all (mm).
Figure 6.
Updraft wind speed w vs. temperature difference ∆Θ for diffuser model with tower height 2 m for each semi-open angle of 0° (cylinder), 2°, 4° and 6°.
Figure 6.
Updraft wind speed w vs. temperature difference ∆Θ for diffuser model with tower height 2 m for each semi-open angle of 0° (cylinder), 2°, 4° and 6°.
Figure 7.
Power output Pturbine vs. temperature difference ∆Θ for diffuser model with tower height 2 m, for each semi-open angle of 0° (cylinder), 2°, 4° and 6°.
Figure 7.
Power output Pturbine vs. temperature difference ∆Θ for diffuser model with tower height 2 m, for each semi-open angle of 0° (cylinder), 2°, 4° and 6°.
Figure 8.
Power output Pturbine vs. semi-open angle of diffuser model with tower height 2 m, for each temperature difference ∆Θ = 23 to 35 K.
Figure 8.
Power output Pturbine vs. semi-open angle of diffuser model with tower height 2 m, for each temperature difference ∆Θ = 23 to 35 K.
Figure 9.
Updraft speed w vs. temperature difference ∆Θ for diffuser model with a semi-open angle of 4° for each tower height h.
Figure 9.
Updraft speed w vs. temperature difference ∆Θ for diffuser model with a semi-open angle of 4° for each tower height h.
Figure 10.
Updraft speed w vs. tower height h for diffuser model with a semi-open angle of 4° for each temperature difference ∆Θ = 10, 20 and 30 K.
Figure 10.
Updraft speed w vs. tower height h for diffuser model with a semi-open angle of 4° for each temperature difference ∆Θ = 10, 20 and 30 K.
Figure 11.
(a) Computational domain and grid; (b) A diffuser tower model with 4° semi-open angle was displayed using a rectangular grid approximation technique.
Figure 11.
(a) Computational domain and grid; (b) A diffuser tower model with 4° semi-open angle was displayed using a rectangular grid approximation technique.
Figure 12.
Instantaneous w (left); static pressure (center); and temperature (right) fields of updraft inside the tower with the height h = 2.0 m for each semi-open angle of (a) 0° (cylinder); (b) 2°; (c) 4° and (d) 6°. w, static pressure and temperature is expressed by 10 intervals between 0 and 5 m/s (w speed), −4 and 1 (dimensionless static pressure), 0 and 100 °C (temperature), respectively.
Figure 13.
Updraft speed
w at height
z = 450 mm (the same position as that in the experiments;
Figure 5) vs. semi-open angle of the diffuser model with tower height
h = 2 m, for each temperature difference ∆
Θ = 20 K (CFD), 23–35 K (experiment).
Figure 13.
Updraft speed
w at height
z = 450 mm (the same position as that in the experiments;
Figure 5) vs. semi-open angle of the diffuser model with tower height
h = 2 m, for each temperature difference ∆
Θ = 20 K (CFD), 23–35 K (experiment).
Figure 14.
Instantaneous static pressure field of updraft inside the tower with a semi-open angle 4° for each tower height of (a) 1.2 m; (b) 1.6 m; (c) 2.0 m; and (d) 2.4 m. The static pressure is expressed by 10 intervals between dimensionless pressure −4 (blue) and 1 (red).
Figure 14.
Instantaneous static pressure field of updraft inside the tower with a semi-open angle 4° for each tower height of (a) 1.2 m; (b) 1.6 m; (c) 2.0 m; and (d) 2.4 m. The static pressure is expressed by 10 intervals between dimensionless pressure −4 (blue) and 1 (red).
Figure 15.
Time-mean updraft speed w vs. tower height h for diffuser models with a semi-open angle 4° and temperature difference ∆Θ = 20 K. The w field is expressed by 10 intervals between 0 (blue) and 5 m/s (red). (a) 1.0 m; (b) 1.6 m; (c) 2.0 m; (d) 2.6 m tower height.
Figure 15.
Time-mean updraft speed w vs. tower height h for diffuser models with a semi-open angle 4° and temperature difference ∆Θ = 20 K. The w field is expressed by 10 intervals between 0 (blue) and 5 m/s (red). (a) 1.0 m; (b) 1.6 m; (c) 2.0 m; (d) 2.6 m tower height.
Figure 16.
Updraft speed w vs. tower height h for diffuser model with a semi-open angle 4° and temperature difference ∆Θ = 20 K.
Figure 16.
Updraft speed w vs. tower height h for diffuser model with a semi-open angle 4° and temperature difference ∆Θ = 20 K.
Table 1.
Computational Method.
Table 1.
Computational Method.
| Direct Numerical Simulation Based on Finite Difference Method |
|---|
| Method for time proceeding | Euler explicit 1st order |
| Poisson’s equation | Successive Over Relaxation (SOR) |
| Spatial terms | 2nd order central difference |
| Convective terms | 2nd order central difference |
| Grid, variables | 141 × 141 × 151 grid points, Staggered arrangement |
| Body | Rectangular grid approximation |
© 2016 by the authors; licensee MDPI, Basel, Switzerland. This article is an open access article distributed under the terms and conditions of the Creative Commons Attribution (CC-BY) license (http://creativecommons.org/licenses/by/4.0/).


