
Scenario Analysis of Carbon Emissions of China’s Electric Power Industry Up to 2030


Department of Economics and Management, North China Electric Power University, Baoding 071003, China
*
Author to whom correspondence should be addressed.
Energies 2016, 9(12), 988; https://doi.org/10.3390/en9120988
Submission received: 28 October 2016
/
Revised: 20 November 2016
/
Accepted: 22 November 2016
/
Published: 25 November 2016
(This article belongs to the Special Issue Electric Power Systems Research 2017)
Abstract
:In this paper, the Long-range Energy Alternatives Planning (LEAP) model is constructed to simulate six scenarios for forecasting national electricity demand in China. The results show that in 2020 the total electricity demand will reach 6407.9~7491.0 billion KWh, and will be 6779.9~10,313.5 billion KWh in 2030. Moreover, under the assumption of power production just meeting the social demand and considering the changes in the scale and technical structure of power industry, this paper simulates two scenarios to estimate carbon emissions and carbon intensity till 2030, with 2012 as the baseline year. The results indicate that the emissions intervals are 4074.16~4692.52 million tCO2 in 2020 and 3948.43~5812.28 million tCO2 in 2030, respectively. Carbon intensity is 0.63~0.64 kg CO2/KWh in 2020 and 0.56~0.58 kg CO2/KWh in 2030. In order to accelerate carbon reduction, the future work should focus on making a more stringent criterion on the intensity of industrial power consumption and expanding the proportion of power generation using clean energy, large capacity, and high efficiency units.
1. Introduction
The fundamental reason for global climate warming are CO2 and other greenhouse gases from the consumption of fossil energy, which seriously hinders the sustainable development of human beings. By 2050 the CO2 emissions from the energy field will be more double than that of today if effective approaches to reduce them are not adopted [1]. China is faced with increasing international pressure to reduce carbon emissions [2]. Thus, energy conservation and emission reduction will to become an essential way for the achievement of the sustainable development of human society. As the largest greenhouse gas emitter in the world [3,4], China has pledged that in 2020 the carbon emission intensity per Gross Domestic Product (GDP) will be lower than that of 2005 by 40%~45%, and the proportion of non-fossil energy in the primary energy mix will be increased to 15% [5]. According to the statistics of International Energy Agency (IEA), in 2010 CO2 emissions from the production of China’s electric power and thermal energy reached 35.8 million tons, accounting for 49.3% of the total CO2 emissions [6]. Therefore, it might be of great significance to promote carbon mitigation by the power industry for China and the whole world to achieve the carbon mitigation targets. During the 11th Five-Year Plan of China, the power industry achieved a CO2 reduction of about 17.4 million tons through developing non-fossil energy sources, decreasing net coal consumption, and reducing line losses [7]. China’s power industry has achieved certain effects with respect to CO2 emission reduction, but it might still be unable to realize the proposed carbon reduction targets. Consequently, there is an urgent need for delving further into carbon mitigation policies.
There is abundant literature on China’s carbon mitigation policies, most of which has been published in the past few years. Concerning the research methods, scenario simulation has been extensively applied in the field of carbon reduction issues. The modelling approaches of these studies can be classified into three categories: top-down (MARKet ALlocation (MARKAL) models, Computable General Equilibrium (CGE) models) models, bottom-up models and hybrid models [8]. For instance, Chen [9] employed three MARKAL models to investigate China energy system’s carbon mitigation strategies and the corresponding impacts on the economy. Cheng [10] analyzed the impacts of the low-carbon policy in the power sector of Guangdong Province in China on its energy and carbon emission targets by 2020 using a regional CGE model. Li [11] assessed the influences of CO2 mitigation measures in China during the period of 2010–2050 by using a CGE method. Xiao [12] explored the impacts of the environmental tax on China’s economy in light of a dynamic recursive multi-sector CGE model. Chi [13] studied the impacts on China’s economic growth, energy consumption, and carbon emissions under the carbon tax policy scenarios on the basis of the dynamic CGE model. Top-down models can investigate the broader economy and incorporate feedback effects among different markets triggered by policy-induced changes in relative prices and incomes, but they generally cannot provide technological details of energy production or conversion [8].
Moreover, top-down models might have some limitations in terms of application. For example, the design idea of the CGE model is mainly based on the general equilibrium of the macro-economy, thus it seems to be only applicable to the research on national or regional carbon emission reduction rather than the issue of individual industries. Furthermore, the simulation policies of CGE models with having a global impact on the economy generally may be very difficult to evaluate some major emission reduction measures regarding the inner structure of specific industries. In addition, the input-output relationship of production function in MARKAL models and CGE models can be constant or obtained by the extrapolation method, which cannot accurately reflect the technical changes in reality, and cannot be utilized for technique policy simulation.
However, the Long-range Energy Alternatives Planning (LEAP) model developed by the Stockholm Environment Institute can effectively address the issues of MARKAL models and CGE models. The LEAP model, which is a bottom-up model, can describe current and prospective technologies in detail, making it suited to analyze specific changes in technology or policies [14]. Researchers can flexibly establish various policy models according to the specific problems to be studied using the LEAP model. The model can not only be widely used in urban, regional, national and even global energy and environmental analysis, but also can be applied to the research on energy demand and greenhouse gas emission reduction of various sectors of the national economy. The LEAP model can identify the department-level techniques or policies effectively by analyzing the matters such as the energy demand, conversion, transmission and distribution, end use, and the impacts on energy environment from diverse sectors under different policies or technology simulation scenarios [8]. In the present study, since it can be used to set the parameters and model structures according to the characteristics of problem and the availability of data, the LEAP model is widely utilized to identify potential problems, and estimate the possible impacts of energy policies on various areas [15,16]. This is evident from more than 75 country studies with LEAP model for energy and environmental systems. Bala [17] assessed rural energy supply and demand with the LEAP model, and studied the global warming contributions from Bangladesh caused by the drawbacks of traditional biomass fuels uses in rural areas of the country. Shin [18] estimated and analyzed the impacts of landfill gas electricity generation on the energy market in Korea using a LEAP model. Song [19] accomplished an environmental and economic assessment in Korea based on the energy policy changes for climate change agreements and an increase of CO2 mitigation technology according to operating data for the CO2 chemical absorption pilot plant that is installed in the Seoul coal steam power plant. Tao [20] employed three scenarios to simulate China’s low-carbon economic development level in 2050 by using the LEAP model. Takase [21] studied various alternative paths for nuclear power development and GHG emission abatement in Japan. Amirnekooei [22] conducted demand and supply side analysis for Iran through developing different scenarios. Roinioti [23] explored the impacts of electricity generation scenarios on environmental emissions in Greece by using LEAP model. Pan [24] applied the LEAP model to forecast the reduction effects of main atmospheric pollutants and GHG in Beijing under different scenarios. Kale [25] developed electricity demand and supply scenarios for the state of Maharashtra in India using the LEAP model.
In contrast to the wealth of studies on carbon mitigation policies from a national or regional level, there has been less research looking at the carbon mitigation policies of the power industry in China. In the previous literature, Zhang [26] assessed the CO2 reduction potentials for China’s electricity sector under different CO2 emission scenarios by using the LEAP model. Huang [27] estimated China’s future power demand according to the degree of electrification using the LEAP model. Yuan [28] constructed two energy conservation and emissions reduction scenarios to probe the 2020 energy conservation potential of China’s power industry.
The contributions of this paper may be summarized as follows: considering the objects of the total electricity demand and carbon mitigation comprehensively, the LEAP model is constructed to simulate the various scenarios for carbon mitigation potential of China’s power industry through forecasting electricity demand and carbon emissions. The results can simulate the future trend of China’s electricity demand and CO2 emissions, as well as provide some general insights on the effectiveness of measures aimed at energy savings and carbon reduction of China’s power industry, which will be beneficial for future energy planning and policy making.
The rest of this paper is organized as follows: Section 2 describes the method of this study in detail, including the structure of LEAP model, and the major steps of the analysis. In Section 3 the scenario description and the parameters setting of electricity demand and carbon emission are presented. Then, in Section 4 the forecasting results of electricity demand and carbon emissions are obtained by using the LEAP model. The future carbon emissions intensity of the power industry is analyzed and assessed. Finally, Section 5 offers some conclusions and recommendations of the whole research.
2. Method
2.1. LEAP Model
The Long-range Energy Alternatives Planning (LEAP) system is an energy-economy- environment model developed by the Stockholm Environment Institute [29]. The model, which is a scenario-based modeling tool for energy policy analysis and climate change assessment, can develop different scenarios for future energy demand and environmental impact in the light of how energy is consumed, converted, and produced in a given region or economy under the assumption of a range of values for parameters such as population increase, economic development, technology utilization, and inflation [30]. Also, the model can be adopted for a scenario analysis of the energy consumption and CO2 emissions, and the policy or technology effects can be obtained on the basis of the comparative analysis of the simulation results under various scenarios.
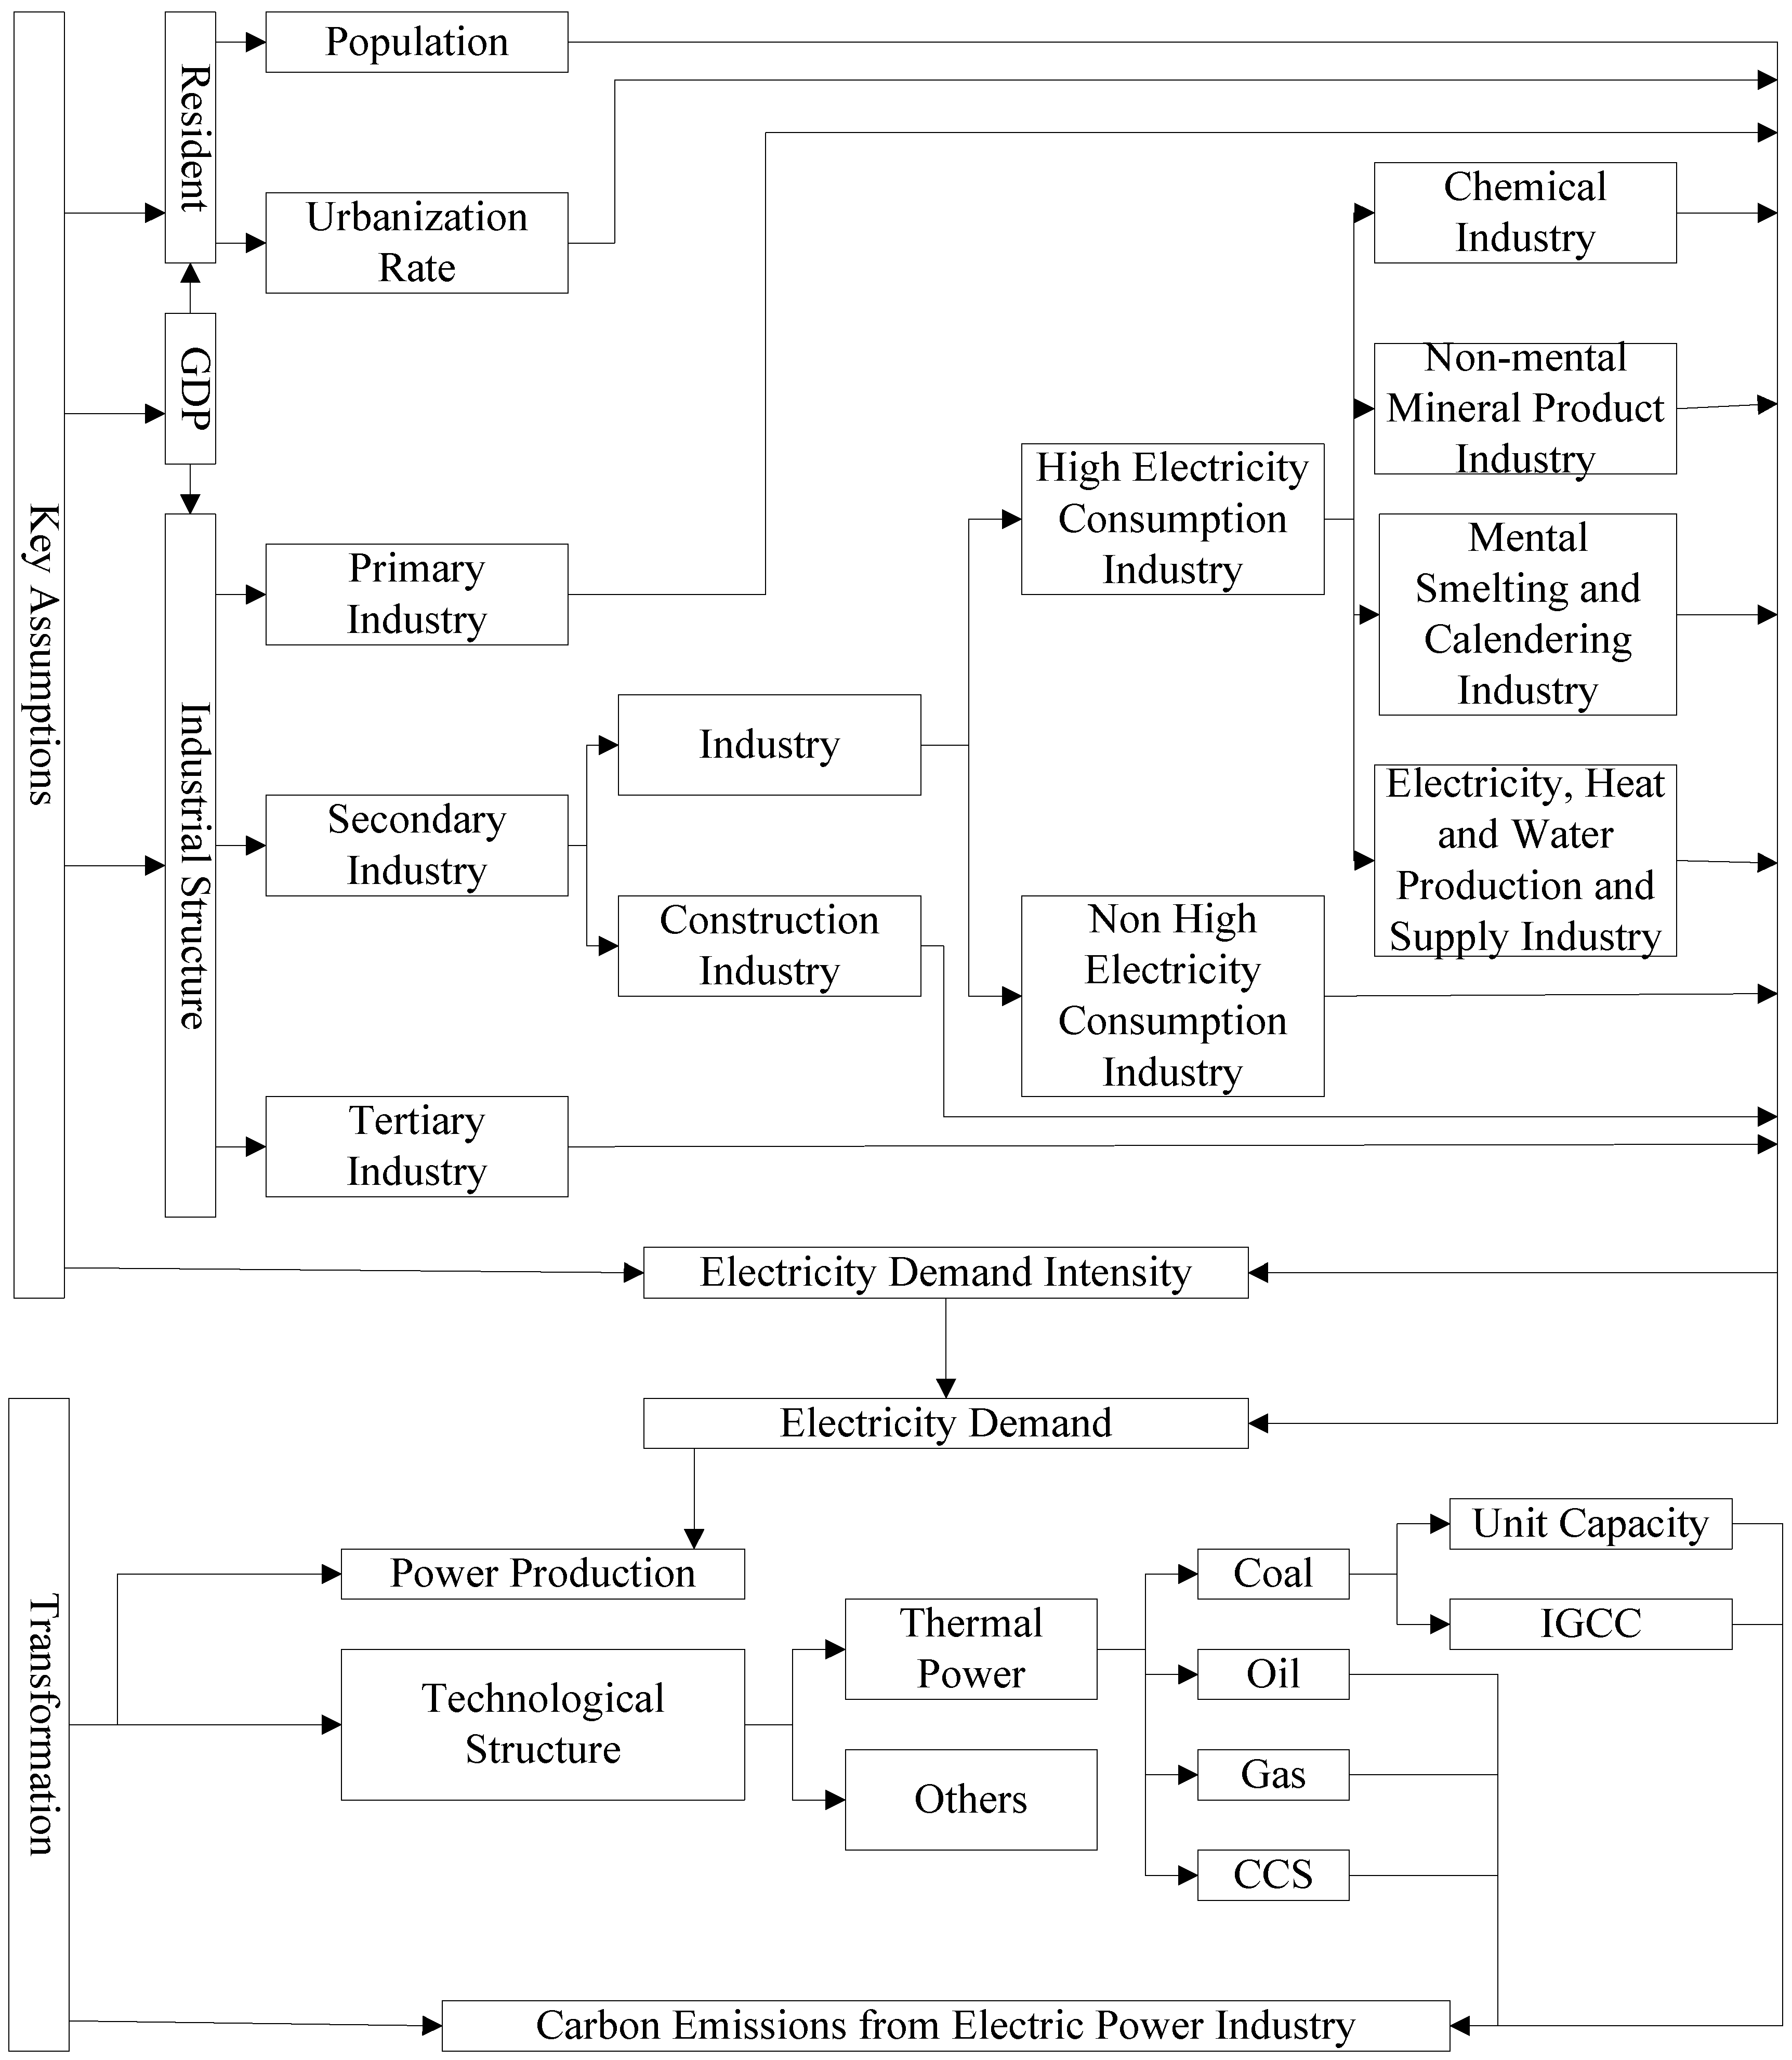
The structure of the LEAP model is described in Figure 1. There are two major steps to conduct the analysis of this study:
(1) Electricity demand forecasting. Electricity demand includes household electricity demand and industrial electricity demand. Taking into account the difference between urban residents and rural residents, future electricity demand of urban residents and rural residents are respectively calculated on the basis of predicting the total population in the future. In order to analyze the distribution situation and industrial electricity demand, the secondary industry is divided into industry and construction industry. In this paper, industry in turn is divided into high electricity consumption industries and non-high electricity consumption industries. The high electricity consumption industries include the chemical industry, non-metal mineral product industry, metal smelting and calendering industry, and the electric, heat, and water production and supply industry. According to the GDP growth rate and the elastic coefficient of industrial GDP, the future production and industrial structure of each industry can be calculated. Then, the electricity demand under the assumptions of different power intensity can be obtained.
(2) CO2 forecasting of the electric power industry. Assuming that the future electricity production meets future electricity demand and only thermal power generates CO2, power production technology can be divided into thermal power and other power generation technologies. Thermal power fuels include coal, oil and gas. Moreover, coal-fired power generation is classified according to unit capacity and whether to use the Integrated Gasification Combined Cycle (IGCC) technology. Furthermore, the proportion of thermal power units using Carbon Capture and Storage (CCS) technology is predicted, and CO2 generated by thermal power can be captured and stored on the basis of the ratio using CCS technology.
2.2. Electricity Demand Forecasting
Household electricity demand and industrial electricity demand constitute the total electricity demand:
where is the total electricity demand in the th year; is the industrial electricity demand in the th year; is the household electricity demand in the th year.
(1) Industrial electricity demand:
where is the added value of the th industry in the th year; is the electricity consumption intensity of the th industry in the th year.
where is the added value of the th industry in the baseline year; is the growth rate of GDP in the th year; is the elasticity coefficient of GDP of the th industry. In this paper, the baseline year is 2012:
where (industrial structure) is the ratio of the added value of the th industry to the total added value in the th year.
(2) Household electricity demand:
where represents urban residents; represents rural residents; is the population of urban area (rural area) in the th year; is the per-capita household electricity consumption intensity of urban area (rural area) in the th year.
where is the population in the baseline year; is the growth rate of population; is the urbanization rate.
where is the coefficient of household electricity consumption and the per-capita income; is the per-capita income of urban area (rural area) in the th year; is the per-capita income of urban area (rural area) in the baseline year.
2.3. CO2 Forecasting of Electric Power Industry
In this paper, it is assumed that the total generated energy just meets the electricity demand of the whole society. Total energy demand and carbon dioxide emissions of the power industry in the future are calculated in two steps:
(1) Energy demand from the power industry:
where represents the generated energy of the equipment due to transformation; represents the total generated energy; is the proportion of the generated energy of the conversion equipment accounting for the total generated energy:
where is the total energy demand of power industry; is the energy conversion efficiency of the equipment using the primary energy .
(2) CO2 emissions from the power industry: The calculation approaches of carbon emissions can be divided into three categories: practical measure methods, model methods, and conservation algorithms. Based on the scientific sampling and continuous monitoring, practical measure methods are difficult to apply widely since there have some issues, such as high monitoring cost and poor reliability. The model methods are utilized to estimate and predict the carbon emissions by using system models or comprehensive evaluation models. For instance, Mi [4] employed an input-output model to calculate consumption-based CO2 emissions for thirteen Chinese cities in terms of both overall and per capita carbon emissions. Mi [31] also employed an optimization model based on the input-output model to assess the CO2 emissions of Beijing. Mi [32] further developed a Climate Change Mitigation Index (CCMI) with 15 objective indicators and performed a complex assessment of China’s provincial performance in climate protection using the Similarity to Ideal Solution (TOPSIS) method. However, in the model methods, the uncertainties of model setting and parameter selection have direct implications on estimation accuracy. Based on the law of mass conservation, the conservation algorithm considers that the quality of carbon in oxygen combustion is equal to the sum of carbon and oxygen before combustion, and the sensitivity of the conservation algorithm to the different combustion technologies and combustion conditions of various countries is relatively low. Carbon emission factors can be computed by using the carbon contents of unit calorific value of different fuels. Therefore, the IPCC employed the data collected from different countries to obtain emission factors of unit calorific value, which have been widely used in the study.
Conservation algorithms can be classified into two kinds: reference approaches and sectorial approaches. The reference approaches are top-down calculation methods without considering the intermediate conversion of fossil fuels and distinguishing the consumption of the fuels of various types in different sectors. Compared with the sectorial approach, the reference methods make it easier to obtain relevant data, they are convenient and calculations are simple, so they are regarded as a default methods recommended by the IPCC. In this paper, in order to study the carbon emissions in the process of power production, the sectorial approach of IPCC is applied to calculate carbon emissions. The calculation formula is as follows:
where is the total CO2 emission from power industry; is the CO2 emission factor from the primary energy using the conversion equipment .
The emission factors provided by the IPCC are based on calorific value units, and in practice the consumption of primary energy is generally counted as a quality. However, there is a big difference in the the fuel calorific value of the same quality among different countries. Hence, CO2 emission factor of primary energy of unit mass can be calculated according to the average low calorific value in China of primary energy of unit mass. The equation can be described as follows:
where is the carbon content of unit calorific value of primary energy , which is the default value provided by the IPCC [33]; is the average low calorific value of primary energy of unit mass; is the carbon oxidation rate of primary energy , and in this study the value is 1; is the molecular weight ratio of CO2 to C.
3. Scenario Design
3.1. Scenario Description
3.1.1. Scenario Description of Electricity Demand
From the previous literature, it can be seen that the factors affecting electricity demand mainly include economic growth rate, industrial electricity consumption intensity, industrial structure, population, and per-capita household electricity consumption intensity. According to Equations (3) and (4), the faster the economic growth rate is, the faster industrial structure changes under the assumption that the elasticity coefficient of GDP is constant. Moreover, based on the Equations (7) and (8), the faster the economic growth rate is, the higher the per-capita income and per-capita household electricity consumption intensity are. Industrial structure and per-capita household electricity consumption intensity can be considered as the derived variables of economic growth rate. Therefore, in this paper six scenarios are designed for future electricity demand on the basis of economic growth rate and industrial electricity consumption intensity, and the specific description is shown in Table 1.
3.1.2. Scenario Description of CO2 Emission
In order to determine future carbon emissions, the highest electricity demand and the lowest electricity demand among the six scenarios are selected to conduct the scenario analysis of carbon emissions. The new capacity of power industry in the future is expected to focus on large capacity and high efficiency units. As the future electricity demand increases, the faster the proportion of large capacity and high efficiency raises, the faster the power generation technical structure adjusts. Thus, two scenarios are designed to analyze carbon emissions, as shown in Table 2.
3.2. Parameter Setting
3.2.1. Parameter Setting of Electricity Demand
(1) Economic growth. According to the estimation results of China’s average annual GDP growth rate from International Energy Agency, Citibank, World Bank Hong Kong and Shanghai Banking Corporation in 2010–2020 and 2020–2030, the highest prediction value amongst them is selected as the economic growth rate under the scenarios of economic grows with a high speed, the lowest value is chosen as the economic growth rate under the scenarios of economic grows with a low speed, and the average value is regarded as the economic growth rate under the scenarios of economic grows with a medium speed [34].
(2) Industrial structure. Industrial added value and the proportion of industrial structure consider 2012 as the baseline year. The elasticity coefficient of GDP of each industry is assumed to be constant, and adopts the average value of GDP elasticity coefficient in 2007–2012. Under the assumption that the GDP elasticity coefficient of each industry is invariable, the faster the economic growth rate is, the faster the adjustment of the industrial structure is since that the economy is designed for high speed, medium speed and low speed growth of three scenarios. Therefore, industrial structure will be set for high, medium and low speed changes in three scenarios.
(3) Industrial electricity consumption intensity. Industrial electricity consumption intensity can be defined as the electricity consumption per unit value added of each industry. Under the restraint of energy saving and emission reduction policies, the electricity consumption intensity of all the industries in China has been declining. However, from the point view of margin, the speed of descent of industrial electricity consumption intensity should be decreasing. Therefore, in this study the change rate of industrial electricity consumption intensity under the scenario of the rapid decline of electricity consumption intensity should be the 50% of the average annual descent speed of 2007–2012, and the change rate under the scenario of the low decline of electricity consumption intensity is 30% of the average annual descent speed of 2007–2012.
(4) Population growth. The average annual growth rate of China's population was approximately 0.5% in 2006–2015. The Fifth Plenary Session of the 18th Central Committee of the Communist Party of China proposed in October 2015 that each family can now raise two children. According to the fertility willingness survey of the National Health and Family Planning Commission of China, it can be seen that about 15 million–20 million couples conform to the new policy, and only 50%–60% couples have the fertility willingness with the increment of newborns reaching 7.5 million–12 million in the short term. If the fertility target can be achieved within 5 years, the annual increase of newborns will be 1.5 million–2.4 million. Then, the birth rate will increase to 1.3%–1.4%, and the annual mortality rate will be around 0.7%. China's future population growth rate will be around 0.6%–0.7%. Hence, in this study the average annual growth rate of population is supposed to be 0.65% in the future.
(5) Urbanization rate. Regarding the large differences of income level and the amount of electricity consumption between China’s rural and urban areas, there is an assumption about the future trend of urbanization. In the “New National Urbanization Planning”, China’s State Council announced that the goal of about 60% urbanization rate should be achieved by 2020. According to “Report of State Council on the Work of the Construction of Urbanization”, till 2030 the urbanization rate will reach about 70%.
(6) Per-capita household electricity consumption intensity. Per-capita household electricity consumption intensity depends on per-capita income. According to the per-capita household electricity consumption published by China Electricity Council and the per-capita Gross National Income (GNI) announced by World Bank in 2011, this paper calculates the correlation coefficient between the per-capita living electricity consumption and per capita GNI, and estimate the per-capita household electricity consumption intensity of China at different economic grow rates.
3.2.2. Parameter Setting of Carbon Emissions in the Power Industry
(1) Generated energy. In this paper, the maximum of electricity demand forecasting results is considered as the maximum of future power production, which can be defined as the rapid power industry development scenario; the minimum of the electricity demand forecasting results is considered as the minimum of future power production, which can be defined as the slow power industry development scenario.
(2) Technical structure of power generation. The increment of the proportion of clean energy generation and the change of new high efficient coal-fired units in generation structure can be employed to reflect the adjustment of technical structure of power generation. According to “the Plan of Action of Energy Saving Coal Upgrading and Transformation (2014–2020)”, the average coal consumption of power supply of the new coal-fired generating units should be lower than 300 g/KWh. The net coal consumption of conventional air cooling units and circulating fluidized bed boilers are higher than 300 g/KWh. To achieve the average standard of 300 g/KWh, China’s new conventional coal projects in the future should focus on (ultra)-supercritical units (600 thousand kilowatts and above).
In this paper, 60–100 and more than 100 of the ultra-supercritical units are respectively assumed to be accounted for 50% of the new capacity, and the rest of the generating capacity remains at the status of 2012. Under the scenario of the high speed development of electric power production, the increment of the proportion of the new units is correspondingly fast, which is defined as the rapid adjustment of technical structure; under the circumstances of the low speed development of electric power production, the raise of the proportion of new units is correspondingly slow, which is defined as the slow adjustment of the technical structure. Technical parameters of power generation are described in Table 5.
4. Results Analysis
4.1. Results of Electricity Demand Forecasting
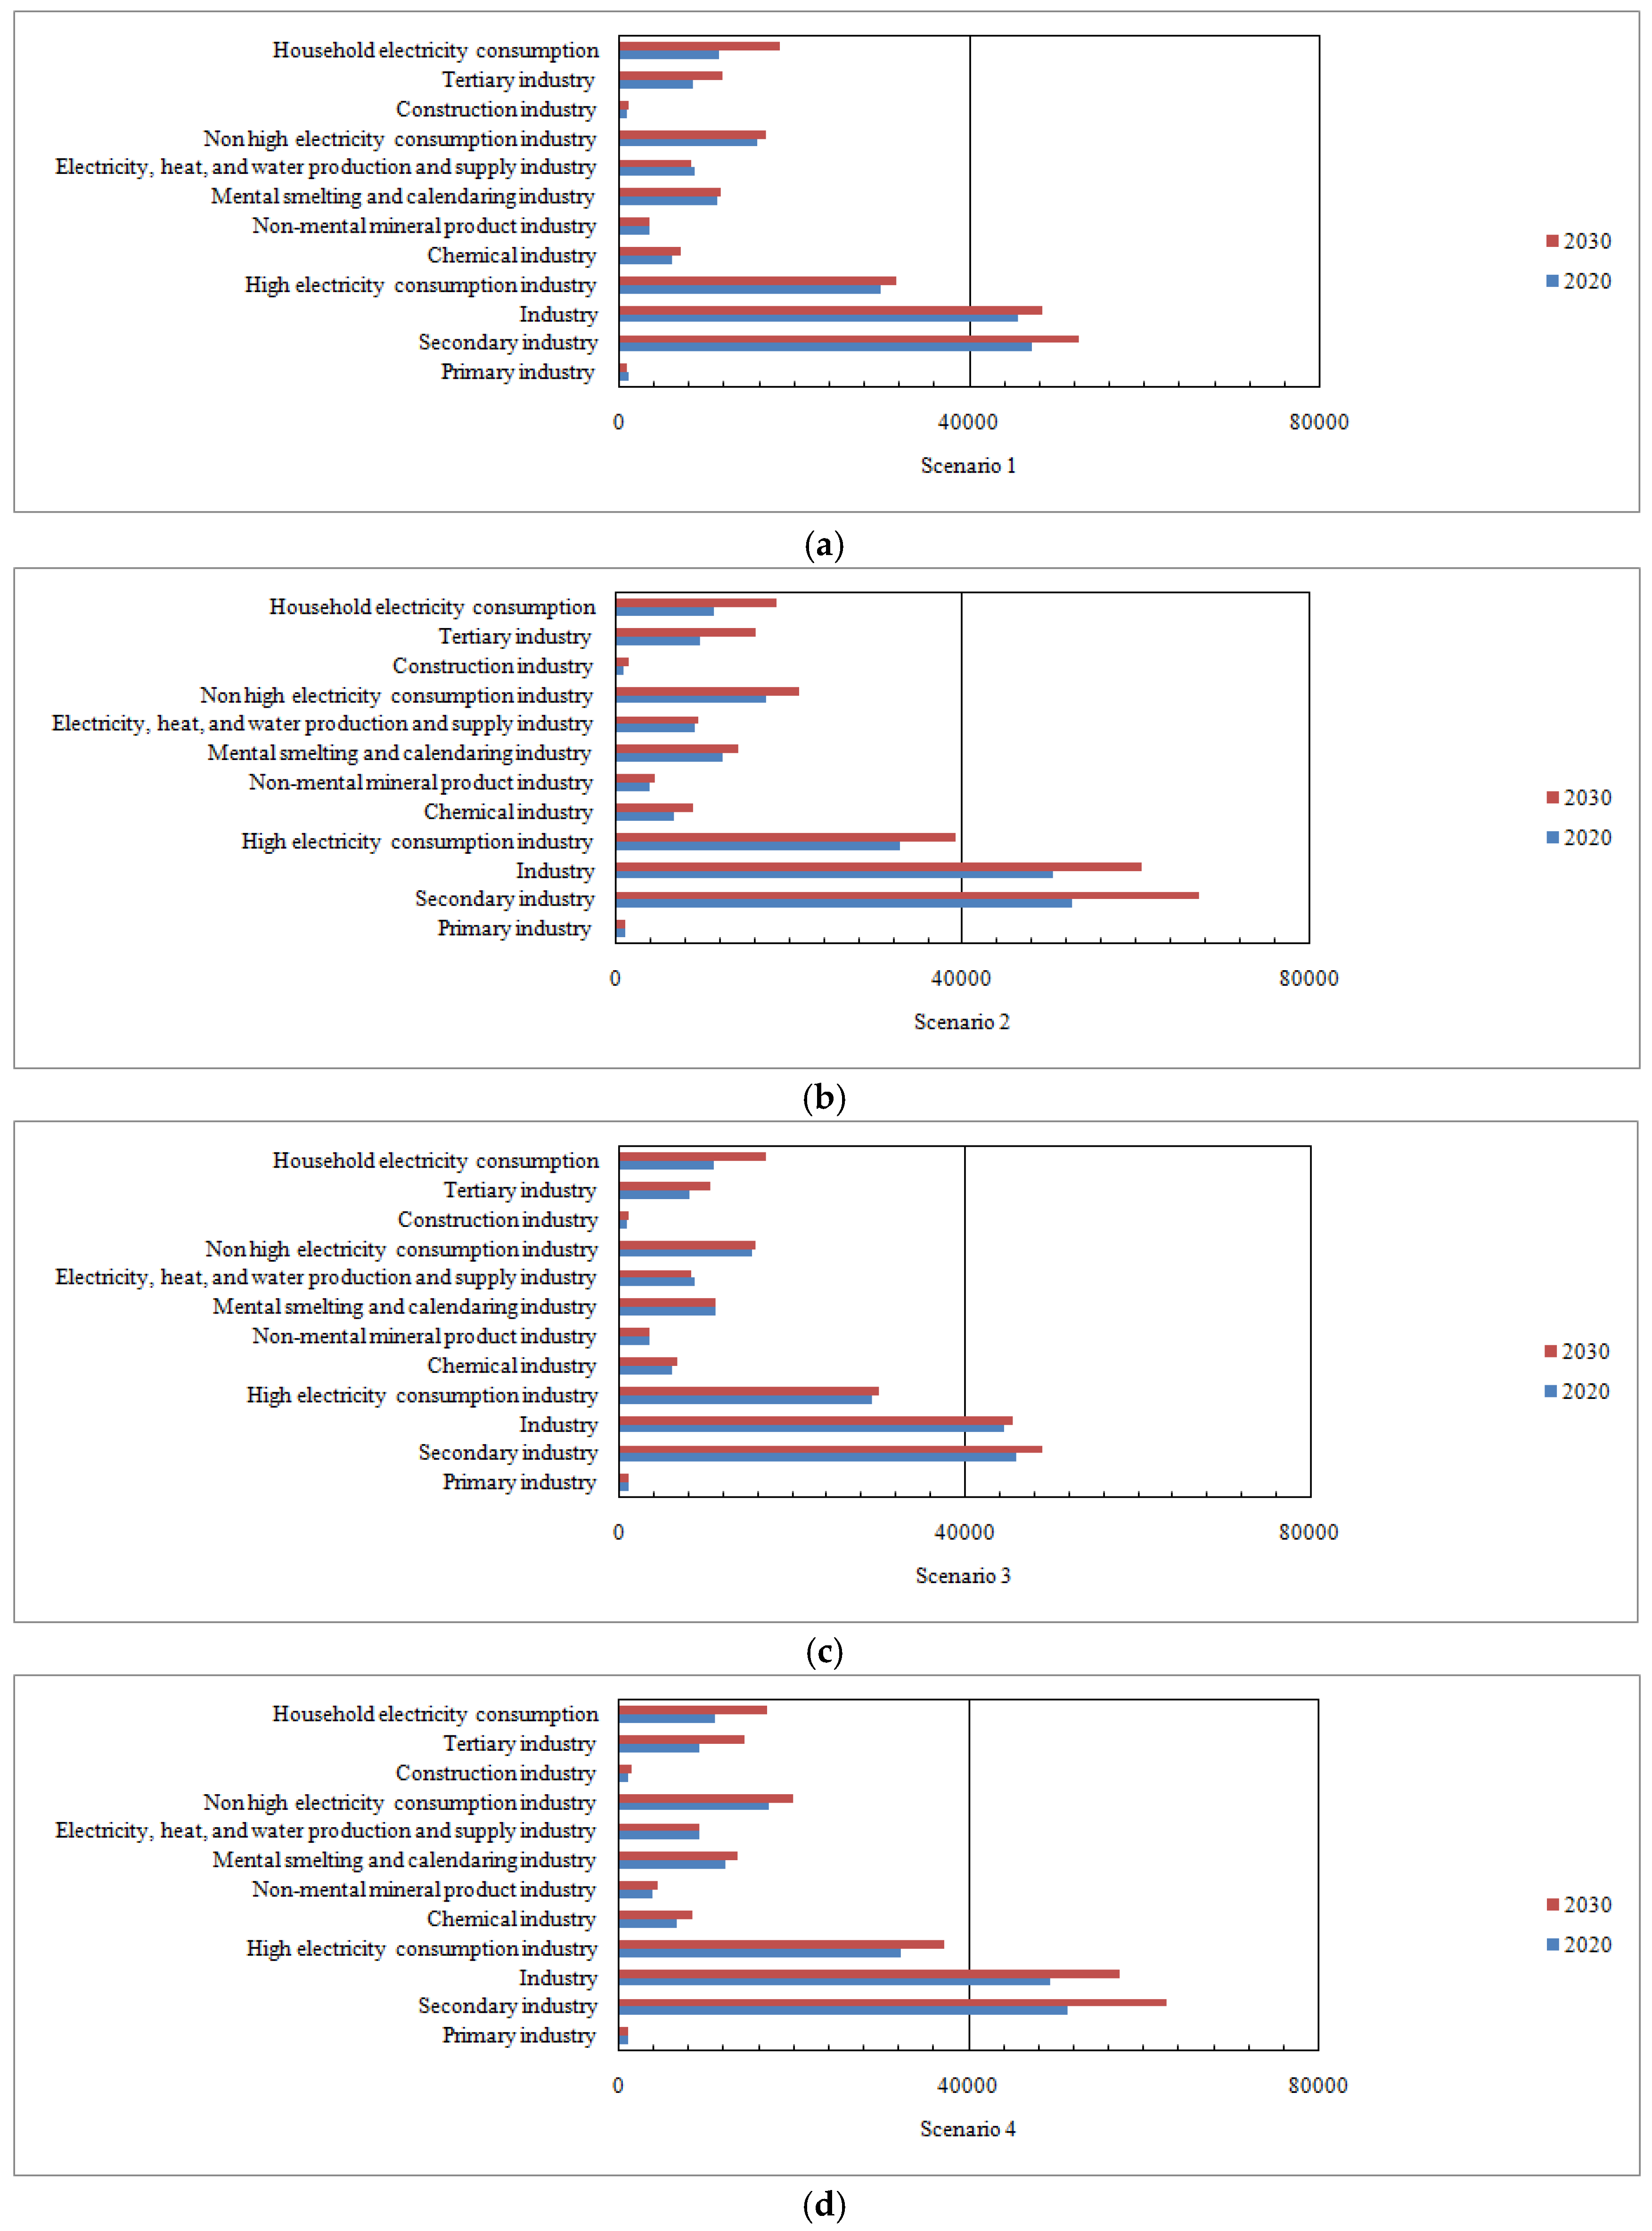
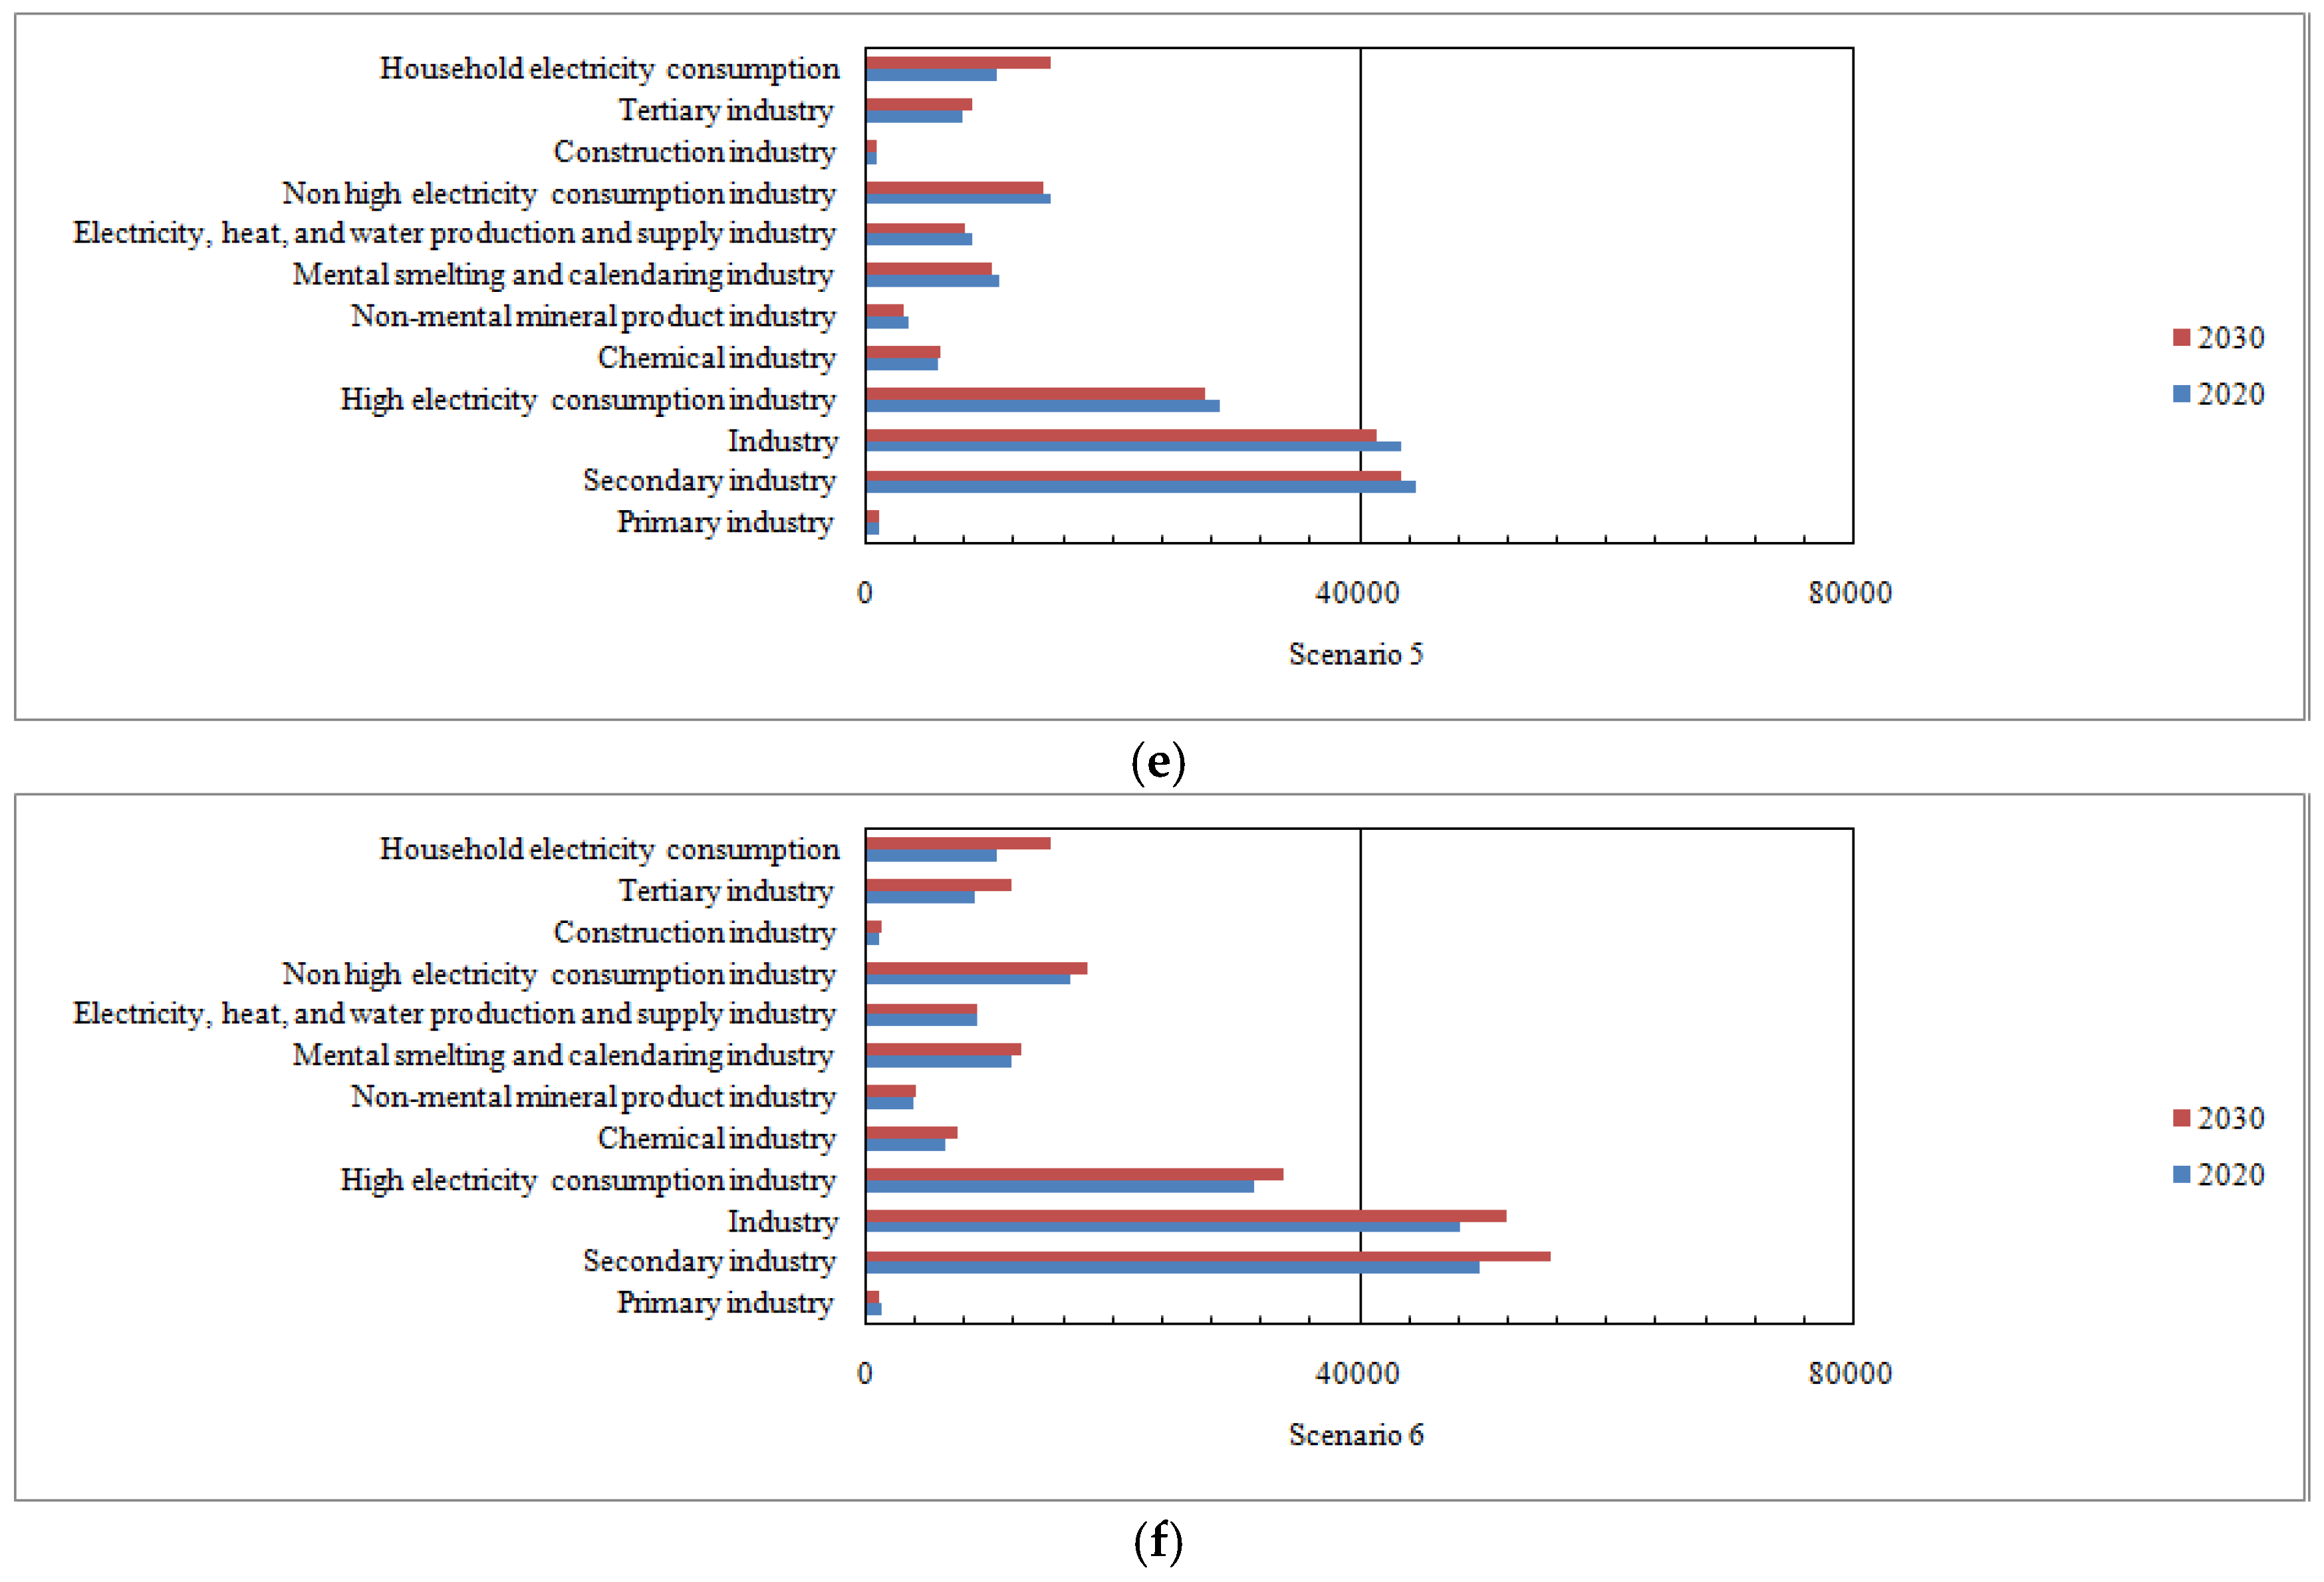
Figure 2 describes the forecasting results of electricity demand under six different scenarios. From Figure 2, it can be seen that the minimum of electricity demand occurs in Scenario 5, and the forecasting values in 2020 and 2030 are 6407.9 and 6779.9 billion KWh, respectively. The main reason may be that the slow growth of economy and the rapid decline of electricity consumption intensity restrain the growth of electricity demand. Moreover, the maximum of electricity demand exists in Scenario 2, and the estimation values in 2020 and 2030 are 7491.0 and 10,313.5 billion KWh, respectively. There is a paramount reason for this phenomenon, namely that the rapid growth of economy and the slow decline of electricity consumption intensity prompt the growth of electricity demand.
Furthermore, it can be seen that the absolute amount of electricity demand of the primary industry has declined under the six scenarios, and the absolute amount of electricity demand of other sectors has increased under Scenarios 1, 2, 3, 4, and 6. Only in Scenario 5 the slow growth of economy and electricity demand intensity stimulate the decline of electricity demand of the secondary industry. A possible explanation may be that industrial electricity consumption has decreased from 4343.2 billion KWh in 2020 to 4128.6 billion KWh in 2030. The electricity consumption of high electricity consumption industry has decreased from 2859.1 billion KWh in 2020 to 2736.9 billion KWh in 2030. The electricity consumption of non high electricity consumption industry has decreased from 1478.0 billion KWh in 2020 to 1427.4 billion KWh in 2030. However, the electricity demand of chemical industry is rising. Therefore, except for Scenario 5, China's power industry will continue to show a trend of continuous expansion in the other scenarios.
Table 6 reflects the electricity demand structure of various sectors. From Table 6, it can be concluded that the proportions of the electricity consumption of the primary, secondary and their breakdown industries all display a downward trend. The proportions of electricity demand of the tertiary industry and households show an upward trend. Specifically, in 2020 the ratio of electricity demand to the total electricity demand of the primary industry is about 1.56%~1.68%. The proportion of the secondary industry is about 69.23%~70.68%, and the proportion of the tertiary industry is approximately 12.09%~12.94%.
The share of household electricity demand is about 15.10%~16.73%. The largest proportion of secondary industry is industry, accounting for 66.93%~70.51%. The share of high electricity consumption industry is 43.87%~44.62%. Till 2030, the ratio of electricity demand to the total electricity demand is about 1.11%~1.41%. The proportion of the secondary industry is about 62.60%~66.75%, and the proportion of the tertiary industry is approximately 12.73%~15.64%. The share of household electricity demand is about 17.81%~22.05%. The largest proportion of the secondary industry is industry, accounting for 57.59%~62.34%. The share of high electricity consumption industry is 37.85%~40.61%.
Furthermore, the change of electricity consumption intensity has greatly positive implications on reducing the total electricity demand of the whole society. In this paper, with the same economic growth rate, the difference of electricity demand under the two scenarios of rapid decline and slow decline of industrial electricity consumption intensity is applied to measure the potential for reducing energy consumption.
The average potential of high, medium and low speed of economic growth has been shown in Table 7. Compared the decline rate of 30%, the abatements of electricity demand in 2020 and 2030 are 660.132 and 1705.184 billion KWh, respectively, when the electricity consumption intensities of all industries decrease at the 50% annual average decline rate in 2007–2012. The contribution of the decline in industrial power consumption is the most prominent, and the potentials of reducing energy consumption are 476.130 and 1242.590 billion KWh, respectively, accounting for 7.20% and 16.28% in the total electricity demand of the whole society in 2020 and 2030. In 2020 and 2030, the potentials of reducing energy consumption of the high electricity consumption industry are 287.87 and 744.701 billion KWh, respectively, accounting for 4.35% and 9.75% in the total electricity demand of the whole society.
4.2. Forecasting Results of Carbon Emissions
Carbon emissions from the power industry in two different scenarios are shown in Table 8. In Scenario 1, power industry carbon emissions will reach 4692.52 and 5812.28 million tCO2 in 2020 and 2030. In Scenario 2, carbon emissions will reach 4074.16 and 3948.43 million tCO2 till 2020 and 2030. Moreover, solely considering the contribution of power generation structure adjustment, the rapid adjustment of power generation structure can achieve a reduction of 0.7045 million tCO2 in 2020 and 194.05 million tCO2 in 2030 compared with the slow adjustment of the power generation structure.
From Table 8, it can be seen that carbon emission intensity of electric power production has a downward trend in the two scenarios. In 2020, carbon emission intensity from power production decreased by 38.83% and 37.86% of 2005 in Scenarios 1 and 2, a decrease of 45.63% and 43.69% till 2030. The Chinese government put forward that in 2020 and 2030 unit GDP carbon emissions intensity will decrease by 40%~45% and 60%~65% compared to that of 2005. Moreover, according to the statistical result of International Energy Organization (IEA), in 2013 CO2 emissions from China's electric power and thermal energy production reached 4.39 billion ton, accounting for 48.86% of China's total CO2 emissions [6]. Considering the high proportion of carbon emissions of China's power industry, the possibility of successfully achieving the overall reduction targets in 2020 and 2030 it seems very grim. Therefore, in order to ensure the realization of the emission reduction targets, in the future more stringent industrial electricity intensity targets should be developed, while speeding up the structure adjustment of power generation technology, and continuously improve the proportion of clean energy generation, large capacity, and high efficiency units.
5. Conclusions
On the basis of the LEAP model, this paper establishes a scenario analysis model of China’s electricity demand and carbon emissions. In line with the industrial segmentation and overall consideration of the influence factors of China's electric power demand, the electricity demand of China in 2020 and 2030 is simulated by setting six different scenarios. Based on the power generation scale and the adjustment speed of technical structure, two kinds of carbon emission scenarios are set to predict the carbon emission in 2020 and 2030, and the corresponding carbon emission intensity is calculated. The results display that the whole society’s electricity consumption in 2020 will be 6407.9~7491.0 billion KWh, and will reach 6779.9~10313.5 billion KWh in 2030; carbon emissions will be 4074.16~4692.52 million tCO2 in 2020 and 3948.43~5812.28 million tCO2 in 2030, respectively; carbon emission intensity will reach 0.63~0.64 kg CO2/ KWh in 2020 and 0.56~0.58 kg CO2/ KWh till 2030. The task of decreasing carbon emission intensity by 40%~45% in 2020 and 60%~65% in 2030 compared to that of 2005 will be very arduous. The focus of China's future emissions reduction programs should be to develop more stringent industrial power targets, as well as to accelerate the pace of structural adjustment of power generation technology, stimulate the improvement of the ratio of clean energy with large capacity and high efficiency units.
Acknowledgments
This study is supported by the Humanities and Social Sciences Planning Foundation of the Ministry of Education of China (Grant No. 16YJA790052).
Author Contributions
Qunli Wu designed this paper and provided overall guidance; Chenyang Peng wrote the whole manuscript.
Conflicts of Interest
The authors declare no conflict of interest.
References
- Dai, P.; Zhou, J.; Tian, J.; Liu, T.; Zhou, H. Integrated optimization of CO2 emission mitigation in China power sector. Autom. Electr. Power Syst. 2013, 37, 1–6. [Google Scholar]
- Ye, B.; Yang, P.; Jiang, J.; Miao, L.; Shen, B.; Li, J. Feasibility and economic analysis of a renewable energy powered special town in China. Resour. Conserv. Recycl. 2016, in press. [Google Scholar] [CrossRef]
- Ye, B.; Jiang, J.; Miao, L.; Yang, P.; Li, J.; Shen, B. Feasibility study of a solar-powered electric vehicle charging station model. Energies 2015, 8, 13265–13283. [Google Scholar] [CrossRef]
- Mi, Z.; Zhang, Y.; Guan, D.; Shan, Y.; Liu, Z.; Cong, R.; Yuan, X.-C.; Wei, Y.-M. Consumption-based emission accounting for Chinese cities. Appl. Energy 2016, in press. [Google Scholar] [CrossRef]
- Ding, R.; Kang, C.; Zhou, T.; Chen, X.; Li, X. Analysis and prospecton technical approaches for low carbon power grid. Power Syst. Technol. 2011, 35, 1–8. [Google Scholar]
- International Energy Agency. CO2 Emissions from Fuel Combustion 2015; OECD Publishing: Paris, France, 2015. [Google Scholar]
- Council, C.E. Annual Development Report of China Electric Power Industry 2011; China Market Press: Beijing, China, 2011. [Google Scholar]
- Yu, H.; Pan, S.-Y.; Tang, B.-J.; Mi, Z.-F.; Zhang, Y.; Wei, Y.-M. Urban energy consumption and CO2 emissions in Beijing: Current and future. Energy Effic. 2014, 8, 527–543. [Google Scholar] [CrossRef] [Green Version]
- Chen, W.; Wu, Z.; He, J.; Gao, P.; Xu, S. Carbon emission control strategies for china: A comparative study with partial and general equilibrium versions of the China markal model. Energy 2007, 32, 59–72. [Google Scholar] [CrossRef]
- Cheng, B.; Dai, H.; Wang, P.; Xie, Y.; Chen, L.; Zhao, D.; Masui, T. Impacts of low-carbon power policy on carbon mitigation in Guangdong province, China. Energy Policy 2016, 88, 515–527. [Google Scholar] [CrossRef]
- Li, W.; Li, H.; Sun, S. China’s low-carbon scenario analysis of CO2 mitigation measures towards 2050 using a hybrid AIM/CGE model. Energies 2015, 8, 3529–3555. [Google Scholar] [CrossRef]
- Xiao, B.; Niu, D.; Guo, X.; Xu, X. The impacts of environmental tax in China: A dynamic recursive multi-sector CGE model. Energies 2015, 8, 7777–7804. [Google Scholar] [CrossRef]
- Chi, Y.; Guo, Z.; Zheng, Y.; Zhang, X. Scenarios analysis of the energies’ consumption and carbon emissions in china based on a dynamic cge model. Sustainability 2014, 6, 487–512. [Google Scholar] [CrossRef]
- Böhringer, C.; Rutherford, T.F. Integrated assessment of energy policies: Decomposing top-down and bottom-up. J. Econ. Dyn. Control 2009, 33, 1648–1661. [Google Scholar] [CrossRef]
- Lin, J.; Cao, B.; Cui, S.; Wang, W.; Bai, X. Evaluating the effectiveness of urban energy conservation and ghg mitigation measures: The case of Xiamen city, China. Energy Policy 2010, 38, 5123–5132. [Google Scholar] [CrossRef]
- Cai, W.; Wang, C.; Chen, J.; Wang, K.; Zhang, Y.; Lu, X. Comparison of CO2 emission scenarios and mitigation opportunities in China's five sectors in 2020. Energy Policy 2008, 36, 1181–1194. [Google Scholar] [CrossRef]
- Bala, B.K. Computer modeling of the rural energy system and of CO2 emissions for bangladesh. Energy 1997, 22, 999–1003. [Google Scholar] [CrossRef]
- Shin, H.-C.; Park, J.-W.; Kim, H.-S.; Shin, E.-S. Environmental and economic assessment of landfill gas electricity generation in Korea using leap model. Energy Policy 2005, 33, 1261–1270. [Google Scholar] [CrossRef]
- Song, H.; Lee, S.; Maken, S.; Ahn, S.; Park, J.; Min, B.; Koh, W. Environmental and economic assessment of the chemical absorption process in Korea using the leap model. Energy Policy 2007, 35, 5109–5116. [Google Scholar] [CrossRef]
- Tao, Z.; Zhao, L.; Changxin, Z. Research on the prospects of low-carbon economic development in China based on leap model. Energy Procedia 2011, 5, 695–699. [Google Scholar] [CrossRef]
- Takase, K.; Suzuki, T. The Japanese energy sector: Current situation, and future paths. Energy Policy 2011, 39, 6731–6744. [Google Scholar] [CrossRef]
- Amirnekooei, K.; Ardehali, M.M.; Sadri, A. Integrated resource planning for Iran: Development of reference energy system, forecast, and long-term energy-environment plan. Energy 2012, 46, 374–385. [Google Scholar] [CrossRef]
- Roinioti, A.; Koroneos, C.; Wangensteen, I. Modeling the greek energy system: Scenarios of clean energy use and their implications. Energy Policy 2012, 50, 711–722. [Google Scholar] [CrossRef]
- Pan, L.J.; Xie, Y.B.; Li, W. An analysis of emission reduction of chief air pollutants and greenhouse gases in Beijing based on the leap model. Procedia Environ. Sci. 2013, 18, 347–352. [Google Scholar] [CrossRef]
- Kale, R.V.; Pohekar, S.D. Electricity demand and supply scenarios for maharashtra (India) for 2030: An application of long range energy alternatives planning. Energy Policy 2014, 72, 1–13. [Google Scholar] [CrossRef]
- Zhang, Y.; Wang, C.; Wang, K.; Chen, J. CO2 emission scenario analysis for china's electricity sector based on leap software. Tsinghua Sci. Technol. 2007, 47, 365–368. [Google Scholar]
- Huang, J. Scenario analysis of chinese power demands and uncertainty assessment based on the leap model. Resour. Sci. 2012, 34, 2124–2132. [Google Scholar]
- Yuan, J.; Na, C.; Hu, Z.; Li, P. Energy conservation and emissions reduction in China’s power sector: Alternative scenarios up to 2020. Energies 2016, 9. [Google Scholar] [CrossRef]
- Wei, Y.M.; Wu, G.; Fan, Y.; Liu, L.C. Progress in energy complex system modelling and analysis. Int. J. Glob. Energy Issues 2006, 25, 109–128. [Google Scholar] [CrossRef]
- Institute, S.E. User Guide, Leap:Long Range Energy Alternative Planning System; Stockholm Environment Institute: Boston, MA, USA, 2011. [Google Scholar]
- Mi, Z.-F.; Pan, S.-Y.; Yu, H.; Wei, Y.-M. Potential impacts of industrial structure on energy consumption and CO2 emission: A case study of Beijing. J. Clean. Prod. 2015, 103, 455–462. [Google Scholar] [CrossRef]
- Mi, Z.-F.; Wei, Y.-M.; He, C.-Q.; Li, H.-N.; Yuan, X.-C.; Liao, H. Regional efforts to mitigate climate change in china: A multi-criteria assessment approach. In Mitigation and Adaptation Strategies for Global Change; Springer: Berlin, Germany, 2014; pp. 1–22. [Google Scholar]
- Intergovernmental Panel on Climate Change. 2006 IPCC Guidelines for National Greenhouse Gas Inventories; Intergovernmental Panel on Climate Change: Hayama, Japan, 2006. [Google Scholar]
- Han, Z.; Li, Z. Analysis of economic comparison between china and the United States. J. Quant. Tech. Econ. 2014, 31, 115–133. [Google Scholar]
- National Bureau of Statistics of China (NBSC). China Statistics Yearbook; China Statistics Press: Beijing, China, 2005.
- National Bureau of Statistics of China (NBSC). China Statistics Yearbook; China Statistics Press: Beijing, China, 2006.
- National Bureau of Statistics of China (NBSC). China Statistics Yearbook; China Statistics Press: Beijing, China, 2007.
- National Bureau of Statistics of China (NBSC). China Statistics Yearbook; China Statistics Press: Beijing, China, 2008.
- National Bureau of Statistics of China (NBSC). China Statistics Yearbook; China Statistics Press: Beijing, China, 2009.
- National Bureau of Statistics of China (NBSC). China Statistics Yearbook; China Statistics Press: Beijing, China, 2010.
- National Bureau of Statistics of China (NBSC). China Statistics Yearbook; China Statistics Press: Beijing, China, 2011.
- National Bureau of Statistics of China (NBSC). China Statistics Yearbook; China Statistics Press: Beijing, China, 2012.
- National Bureau of Statistics of China (NBSC). China Statistics Yearbook; China Statistics Press: Beijing, China, 2013.
- Chinese Power Statistical Yearbook 2013; China Electric Power Press: Beijing, China, 2013.
- Xian, Z.; Shisen, X.; Shaoping, S.; Baomin, W.; Jianzhao, W. Study on heat and power cogeneration IGCC plant with waste heat recovery. Proc. CSEE 2014, 34, 101–104. [Google Scholar]
- Cai, W.; Wang, C.; Wang, K.; Zhang, Y.; Chen, J. Scenario analysis on CO2 emissions reduction potential in China’s electricity sector. Energy Policy 2007, 35, 6445–6456. [Google Scholar] [CrossRef]
Figure 1.
The structure of the LEAP Model.

Figure 2.
Estimations of electricity demand in different sectors of 2020 and 2030 under various scenarios (100 million KWh), (a) Scenario 1; (b) Scenario 2; (c) Scenario 3; (d) Scenario 4; (e) Scenario 5; (f) Scenario 6.
Figure 2.
Estimations of electricity demand in different sectors of 2020 and 2030 under various scenarios (100 million KWh), (a) Scenario 1; (b) Scenario 2; (c) Scenario 3; (d) Scenario 4; (e) Scenario 5; (f) Scenario 6.


| Scenarios | Scenarios Assumption of the Factors Affecting Electricity Demand |
|---|---|
| Scenario 1 | Economy grows at a high speed; industrial structure changes at a high speed; industrial electricity consumption intensity decreases at a high speed; population and urbanization rates grow steadily; per-capita household electricity consumption intensity increases at a high speed |
| Scenario 2 | Economy grows at a high speed; industrial structure changes at a high speed; industrial electricity consumption intensity decreases at a low speed; population and urbanization rates grow steadily; per-capita household electricity consumption intensity increases at a high speed |
| Scenario 3 | Economic grows at a medium speed; industrial structure changes at a medium speed; industrial electricity consumption intensity decreases at a high speed; population and urbanization rates grow steadily; per-capita household electricity consumption intensity increases at a medium speed |
| Scenario 4 | Economic grows at a medium speed; industrial structure changes at a medium speed; industrial electricity consumption intensity decreases at a low speed; population and urbanization rates grow steadily; per-capita household electricity consumption intensity increases with a medium speed |
| Scenario 5 | Economic grows at a low speed; industrial structure changes at a low speed; industrial electricity consumption intensity decreases at a high speed; population and urbanization rates grow steadily; per-capita household electricity consumption intensity increases at a low speed |
| Scenario 6 | Economic grows at a low speed; industrial structure changes at a low speed; industrial electricity consumption intensity decreases at a low speed; population and urbanization rates grow steadily; per-capita household electricity consumption intensity increases at a low speed |
| Scenarios | Scenarios Assumption of the Factors Affecting Carbon Emissions |
|---|---|
| Scenario 1 | Power industry develops at a high speed; technical structure adjusts at a high speed |
| Scenario 2 | Power industry develops at a low speed; technical structure adjusts at a low speed |
| Parameters | 2012–2020 | 2021–2030 |
|---|---|---|
| Economic growth rate (%) * | (8.2, 7.5, 6.7) | (6.2, 5.5, 4.2) |
| Population growth (%) | 0.65 | 0.65 |
| Urbanization rate (%) | 60 | 70 |
| Per-capita household electricity consumption in the urban area () ** | (980, 942, 902) | (1450, 1317, 1143) |
| Per-capita household electricity consumption in the rural area () *** | (533, 521, 519) | (684, 641, 600) |
* the numbers in the bracket are respectively economic growth rates under the scenarios of high speed, medium speed, and low speed; ** the numbers in the bracket are respectively per-capita household electricity consumption in the urban area under the scenarios of high speed, medium speed, and low speed; *** the numbers in the bracket are respectively per-capita household electricity consumption in the rural area under the scenarios of high speed, medium speed, and low speed; all numbers in the bracket are calculated on the basis of the data from China Statistics Yearbook (2005–2013) [35,36,37,38,39,40,41,42,43].
| Industries | Industrial Structure * (%) | Electricity Consumption Intensity ** (KWh/Yuan) | ||
| 2020 | 2030 | 2020 | 2030 | |
| Primary industry | (5.8, 5.9, 6.1) | (3.5, 3.8, 4.4) | (0.0247, 0.0264) | (0.0203, 0.0234) |
| Secondary industry | (43.9, 44.2, 44.5) | (37.7, 38.7, 40.3) | (0.1401, 0.1565) | (0.0996, 0.1277) |
| Industry | (36.6, 37.0, 37.4) | (29.1, 30.3, 32.3) | (0.1625, 0.1799) | (0.1187, 0.1492) |
| High electricity consumption industry | (12.0, 12.1, 12.3) | (9.3, 9.7, 10.4) | (0.3259, 0.3580) | (0.2437, 0.3010) |
| Chemical industry | (4.5, 4.5, 4.5) | (3.9, 4.0, 4.1) | (0.1806, 0.1994) | (0.1329, 0.1661) |
| Non-mental mineral product industry | (2.0, 2.0, 2.0) | (1.5, 1.6, 1.7) | (0.2356, 0.2634) | (0.1668, 0.2145) |
| Mental smelting and calendaring industry | (3.6, 3.7, 3.7) | (2.7, 2.8, 3.1) | (0.4065, 0.4448) | (0.3074, 0.3765) |
| Electricity, heat, and water production and supply industry | (1.9, 2.0, 2.0) | (1.2, 1.3, 1.5) | (0.5844, 0.6185) | (0.4900, 0.5566) |
| Non high electricity consumption industry | (24.6, 24.8, 25.1) | (19.8, 20.6, 21.8) | (0.0835, 0.0926) | (0.0606, 0.0765) |
| Construction industry | (7.3, 7.2, 7.2) | (8.6, 8.4, 8.1) | (0.0155, 0.0183) | (0.0094, 0.0136) |
| Tertiary industry | (50.3, 49.9, 49.4) | (58.8, 57.5, 55.3) | (0.0220, 0.0251) | (0.0145, 0.0196) |
* the numbers in the bracket are respectively the change of industrial structure under the scenarios of high speed, medium speed, and low speed; ** the numbers in the bracket are respectively the decline of industrial electricity consumption intensity under the scenarios of high speed, and low speed; all numbers in the bracket are calculated on the basis of the data from China Statistics Yearbook (2005–2013) [35,36,37,38,39,40,41,42,43].
| Years | 2012 | 2020 | 2030 | |
|---|---|---|---|---|
| Unit Types | Net Coal Consumption (gce/KWh) * | Proportion of Total Power Generation (%) | Proportion of Total Power Generation (%) *** | Proportion of Total Power Generation (%) *** |
| 1 Thermal power units | 318 | 78.72 | 75 | 70 |
| 1.1 Coal-fired units | 326 | 74.59 | 69.5 | 62.5 |
| 1.1.1 >1 million KW | 292 | 5.72 | (10.0, 13.5) *** | (7.5, 15.5) |
| 1.1.1.1 CS/UCS unit | 283 | 4 | (8.7, 12.4) | (6.3, 14.7) |
| 1.1.1.2 Subcritical unit | 315 | 1.72 | (1.3, 1.1) | (1.2, 0.8) |
| 1.1.2 0.6–1 million KW | 313 | 24.23 | (24.4, 25.8) | (21.2, 24.5) |
| 1.1.2.1 CS/UCS unit | 296 | 5.57 | (9.9, 13.4) | (7.5, 15.5) |
| 1.1.2.2 Subcritical unit | 318 | 18.66 | (14.5, 12.4) | (13.7, 9.0) |
| 1.1.3 0.3–0.6 million KW | 322 | 26.20 | (20.4, 17.4) | (19.3, 12.7) |
| 1.1.4 0.2–0.3 million KW | 342 | 4.84 | (3.8, 3.2) | (3.6, 2.3) |
| 1.1.5 0.1–0.2 million KW | 348 | 5.82 | (4.5, 3.9) | (4.3, 2.8) |
| 1.1.6 <0.1 million KW | 381 | 7.56 | (5.9, 5.0) | (5.6, 3.7) |
| 1.1.7 IGCC unit | 263 | 0.2 | 0.5 | 1 |
| 1.2 Oil-fired unit | 209 | 0.1 | 0.1 | 0.1 |
| 1.3 Gas generator unit | 138 | 2.2 | 2.2 | 2.2 |
| 1.4 Others | 228 | 1.83 | 2.2 | 3.2 |
| 1.5 CCS technology ** | - | 0 | 1 | 2 |
| 2 Other generating units | - | 21.28 | 25 | 30 |
| Total | - | 100 | 100 | 100 |
* the data of net coal consumption of various types of units are obtained from “Chinese power statistical yearbook 2013” [44]; the net coal consumption of IGCC technology can be seen in [45]; the net coal consumption of oil, gas, and other thermal power can be seen in [46]; ** technical efficiency of CCS technology is assumed to be 90%; *** the first figure in the brackets is the proportion of generated energy when the technical structure adjusts rapidly, and the second figure in the brackets is the proportion of generated energy when the technical structure adjusts slowly.
| Scenarios | Scenario 1 | Scenario 2 | Scenario 3 | Scenario 4 | Scenario 5 | Scenario 6 | ||||||
|---|---|---|---|---|---|---|---|---|---|---|---|---|
| Sectors | 2020 | 2030 | 2020 | 2030 | 2020 | 2030 | 2020 | 2030 | 2020 | 2030 | 2020 | 2030 |
| Primary industry | 1.61 | 1.18 | 1.56 | 1.11 | 1.64 | 1.26 | 1.59 | 1.19 | 1.68 | 1.41 | 1.63 | 1.32 |
| Secondary industry | 69.23 | 62.60 | 70.29 | 65.31 | 69.45 | 63.22 | 70.51 | 65.96 | 69.61 | 63.93 | 70.68 | 66.75 |
| Industry | 66.93 | 57.59 | 67.36 | 58.91 | 67.36 | 58.96 | 67.79 | 60.31 | 67.78 | 60.89 | 68.22 | 62.34 |
| High electricity consumption industry | 43.92 | 37.85 | 43.87 | 38.04 | 44.27 | 38.87 | 44.21 | 39.07 | 44.62 | 40.37 | 44.56 | 40.61 |
| Chemical industry | 9.06 | 8.57 | 9.09 | 8.72 | 9.08 | 8.66 | 9.11 | 8.81 | 9.08 | 8.74 | 9.12 | 8.90 |
| Non-mental mineral product industry | 5.20 | 4.27 | 5.28 | 4.46 | 5.23 | 4.38 | 5.32 | 4.58 | 5.27 | 4.54 | 5.36 | 4.76 |
| Mental smelting and calendaring industry | 16.54 | 13.80 | 16.46 | 13.75 | 16.70 | 14.28 | 16.62 | 14.24 | 16.87 | 15.01 | 16.78 | 14.98 |
| Electricity, heat, and water production and supply industry | 12.77 | 9.96 | 12.29 | 9.21 | 13.02 | 10.60 | 12.53 | 9.80 | 13.29 | 11.66 | 12.79 | 10.79 |
| Non high electricity consumption industry | 23.12 | 19.99 | 23.31 | 20.54 | 23.25 | 20.44 | 23.44 | 21.00 | 23.38 | 21.05 | 23.57 | 21.65 |
| Construction industry | 1.28 | 1.35 | 1.37 | 1.58 | 1.26 | 1.30 | 1.35 | 1.53 | 1.24 | 1.21 | 1.33 | 1.43 |
| Tertiary industry | 12.43 | 14.17 | 12.94 | 15.64 | 12.28 | 13.64 | 12.78 | 15.05 | 12.09 | 12.73 | 12.59 | 14.05 |
| Total industrial consumption | 83.27 | 77.95 | 84.79 | 82.05 | 83.37 | 78.12 | 84.88 | 82.19 | 83.39 | 78.06 | 84.90 | 82.13 |
| Household electricity consumption | 16.73 | 22.05 | 15.21 | 17.95 | 16.63 | 21.88 | 15.12 | 17.81 | 16.61 | 21.94 | 15.10 | 17.87 |
| Total | 100.00 | 100.00 | 100.00 | 100.00 | 100.00 | 100.00 | 100.00 | 100.00 | 100.00 | 100.00 | 100.00 | 100.00 |
Table 7.
The potential of the change of industrial electricity consumption intensity to reduce the total electricity demand of the whole society.
| Industry | Saving Electricity (Billion KWh) | Ratio of Saving Electricity to Total Electricity Demand (%) | ||
|---|---|---|---|---|
| 2020 | 2030 | 2020 | 2030 | |
| Primary industry | 7.147 | 19.789 | 0.11 | 0.26 |
| Secondary industry | 535.460 | 1376.171 | 8.10 | 18.03 |
| Industry | 476.130 | 1242.590 | 7.20 | 16.28 |
| High electricity consumption industry | 287.878 | 744.701 | 4.35 | 9.75 |
| Chemical industry | 62.430 | 161.174 | 0.94 | 2.11 |
| Non-mental mineral product industry | 40.845 | 106.681 | 0.62 | 1.40 |
| Mental smelting and calendaring industry | 104.150 | 272.937 | 1.58 | 3.58 |
| Electricity, heat, and water production and supply industry | 50.215 | 138.560 | 0.76 | 1.81 |
| Non high electricity consumption industry | 167.524 | 438.686 | 2.53 | 5.75 |
| Construction industry | 14.732 | 41.531 | 0.22 | 0.54 |
| Tertiary industry | 117.526 | 309.224 | 1.78 | 4.05 |
| Total | 660.132 | 170.5184 | 9.98 | 22.34 |
| Scenarios | 2005 | 2020 | 2030 |
|---|---|---|---|
| Scenario 1 | 2200.21 | 4692.52 | 5812.28 |
| Scenario 2 | 4074.16 | 394 8.43 |
© 2016 by the authors; licensee MDPI, Basel, Switzerland. This article is an open access article distributed under the terms and conditions of the Creative Commons Attribution (CC-BY) license (http://creativecommons.org/licenses/by/4.0/).
Share and Cite
MDPI and ACS Style
Wu, Q.; Peng, C. Scenario Analysis of Carbon Emissions of China’s Electric Power Industry Up to 2030. Energies 2016, 9, 988. https://doi.org/10.3390/en9120988
AMA Style
Wu Q, Peng C. Scenario Analysis of Carbon Emissions of China’s Electric Power Industry Up to 2030. Energies. 2016; 9(12):988. https://doi.org/10.3390/en9120988
Chicago/Turabian StyleWu, Qunli, and Chenyang Peng. 2016. "Scenario Analysis of Carbon Emissions of China’s Electric Power Industry Up to 2030" Energies 9, no. 12: 988. https://doi.org/10.3390/en9120988
Note that from the first issue of 2016, this journal uses article numbers instead of page numbers. See further details here.