1. Introduction
The evolution of electrical transmission and distribution systems in recent years into something smarter has been conceptualized as the smart grid, which can be seen as a programme for making the grid more secure, economical, efficient, resilient and sustainable in the long run under challenging scenarios. In order to assess the potential of smart grid innovations models of various complexity and scale need to be designed and tested under multiple scenarios. Some of the cross-domain processes and mechanisms that could be modelled include dynamic response of demand to price signals, transmission pricing and congestion management [
1], technology adoption under subsidized regimes [
2], active network management under high penetration of distributed generation (DG) [
3], market reforms and new trading strategies [
4]. Traditional equation-based and statistical modelling methods have limitations when it comes to representing the complex real world with interactions that are typically dynamic, non-linear, history-dependent, multi-scale and multidimensional in nature. The various entities not only interact amongst themselves, but also with their environment. Additionally these entities might be heterogeneous and evolve in time to make their own intelligent decisions to maximize payoffs.
Agent based modelling (ABM) specifically supports richer descriptions of complex interactions between large numbers of heterogeneous entities and therefore lends itself naturally to the description of electricity networks as they evolve into more complex distributed systems with bidirectional information and power flows between diverse users. The methodology of agent-based computational economics is one such paradigm [
5]. Heterogeneous entities such as generators, suppliers, market operators can be represented as interacting, decision making agents to capture the nonlinear and adaptive nature of electricity markets. Most criticisms of the ABM approach such as the absence of generality, or the difficulty of estimation have been proved largely unwarranted [
6] and verification and validation techniques are being developed to allay quality assurance concerns [
7].
While engineering models of grid operation have been well developed, they are hardly open-sourced or flexible enough to incorporate economic or social aspects of the system. On the other hand, models of electricity markets typically have limited engineering foundations. In this paper we shall present a modelling framework that precisely addresses this issue. We present an object-oriented distribution network analysis methodology and an agent-based model for a short-term electricity market, both of which are flexible enough to be integrated at multiple levels. The models work individually to address issues specific to their domain or in synchronism to address cross-domain themes. While the distribution system analysis module is developed in Java, the electricity market operations are developed in Java-based recursive porous agent simulation toolkit (Repast) toolkit [
8].
The various elements of the smart grid can be represented by heterogeneous agents interacting with each other in a socio-technical and economic environment towards achieving the desired level of smartness in system operations. One such representation is shown in
Figure 1, where information such as voltage and power profiles and price signals are passed around using state-of-the-art communications technology and appropriate protocols. The prosumers, distributed generators and aggregators are examples of heterogeneous agents that learn from their behaviour and adapt to the evolving conditions such as new market trading strategies for maximizing welfare to the community. The engineering and market models depicted towards the left hand side of the diagram encompass these agents and their interactions. In this work, we have focused on the distribution side of the engineering module and the short-term side of the market module.
Figure 1.
Agent based modelling (ABM) framework of a smart grid. Arrows indicate flow of power, information or cash between agents or entities. Aggregation of prosumers is introduced. The aggregator could be of physical and/or commercial nature.
Figure 1.
Agent based modelling (ABM) framework of a smart grid. Arrows indicate flow of power, information or cash between agents or entities. Aggregation of prosumers is introduced. The aggregator could be of physical and/or commercial nature.
2. Distribution System Module
We begin by representing the core elements of a distribution system such as transformers, lines and buses of different types. Additional elements included in the object oriented model are composite loads, voltage regulators, capacitor banks, switches, and DGs that are participative in nature and crucial in the ability of the system operator (SO) to manage and control the system. Crucial to such a design are relationships between objects/class such as associations, aggregations and compositions that are invoked to model the various physical elements. The class diagram in the case of modelling of a distribution system with its components is shown in
Figure 2. The methodology supports analysis of three phase four wire networks with unbalanced loads.
Figure 2.
A simplified class diagram of the distribution system analysis framework.
Figure 2.
A simplified class diagram of the distribution system analysis framework.
The framework comprises of abstract classes that act as templates for the various components. At the top most level are the two generic abstract classes:
PhysicalElement and
TopologicalElement. The mid-level abstract classes that are derived from the
PhysicalElement are
SeriesElement and
ShuntElement. Further sub-classes of the
SeriesElement are Transformers, Voltage Regulators, Transmission/Distribution Lines and Switches. Based on the construction of the transformer the concrete classes
CentreTappedTransformer and
BankConnectedTransformer are derived. Similarly,
TransmissionLine sub-classes are
OverHeadLine,
TapeShieldCable and
ConcentricNeutralCable from which objects are initialized. The objects of the
SeriesElement class are identified in the
TopologyProcessor through
Branch, which is an Interface, and is processed through primary data such as
fromBus and
toBus. The sub-classes of the
ShuntElement class are
DistributedGenerator,
Load and
CapacitorBank which are identified by the
TopologyProcessor once again through the
Branch interface. The
toBus for these elements is the ground. A three-tiered data representation for a distribution line is given in
Table 1 below. The data structure is stored and processed as hashmaps.
Table 1.
Sample data structure relating to distribution lines.
Table 1.
Sample data structure relating to distribution lines.
| Data | Keys | Values |
|---|
| Primary | lineID | fromBus, toBus, length, configID |
| Secondary | configID | phasing, phaseSize, phaseStranding, phaseMaterial, neutralSize, neutralStranding, neutralMaterial, conductorDiam, conductorGMR, capacity, resistance, reactance, spacingID |
| Tertiary | spacingID | distancePh_AB, distancePh_BC, distancePh_CA, distancePh_AN, ……… |
The parent-child relationship between buses is extracted through a TopologyProcessor class which helps in restricting the power flow algorithm to the TopologicalElement class. The TopologyProcessor reads the location of buses, series elements, shunt elements and their connected buses respectively. It also reads the normal position of series elements such as switches, being “open” or “closed”. For switches that are closed, the SeriesElement is typecast as a “DummyLine” such that the end buses are effectively the same. Next the voltage regulator is processed and depending on where it is located, an additional bus is created. The consequence of processing the topology of the network is that a comprehensive data is built that forms the basis for the power flow algorithm, especially the backward/forward sweep method, to preform efficiently. The parent-child relationship of buses in a predominantly radial network is made use while generating such data. A layer is made up of buses and hence is useful in power flow methods such as the sweep techniques. A typical parent-child data block consists of ArrayLists such as bus_ID, layer_ID, parentBus_ID, childBus_ID_List[], parentBranch_ID, childBranch_ID_List[], childBranch_Cat_List[], shuntElem_ID_List[], shuntElem_Cat_List[].
Distribution lines usually have high R/X ratio and are mostly untransposed. Additionally, the highly unbalanced nature of the loads and the predominantly radial structure of the network mean that the power flow algorithm used needs to be rigorous and specific instead of the Newton-Raphson and Gauss-Siedel methods employed for meshed Transmission networks. The algorithm that we employ is largely based on the well-known backward/forward sweep strategy [
9,
10] that makes effective use of the Parent-Child topology of radial networks. The algorithm is as follows:
- (1)
Initialize voltages at each individual Bus.
- (2)
Go through the backward-forward sweeps till power mismatch at each bus is within tolerance. The backward sweep begins from the last Layer and the Buses in this layer and ends at the top most layer that has the root Bus, such as a substation or a generating source.
The appropriate method, within the shunt element class, for calculating the current injections is called depending on whether the object is an instance of capacitor bank or load.
The appropriate method, within the series element class, for source-side line currents on the branch is called depending on whether the object is an instance of transformer, voltage regulator, or a line. The forward sweep begins from the top most layer and proceeds towards the buses in the last layer. The three phase voltages of buses in each layer are updated.
The appropriate method, within the series element class, for load-side line currents on the branch is called upon depending on whether the object is instance of transformer, voltage regulator, or a Line.
d. Bus power withdrawals:
Real and reactive power mismatches of all the buses are evaluated between consecutive iterations and the procedure is terminated if within a prescribed tolerance limit.
2.1. Transmission/Distribution Lines
Due to the untransposed nature of distribution lines the mutual coupling between phases is unequal resulting in an unsymmetrical impedance matrix. For this reason we model the lines from first principles,
i.e., calculate the individual elements of the impedance matrix through the composition data of the cables and wires used on each line segment of the feeder. A four wire system results in a 4 × 4 primitive impedance matrix which is reduced to a 3 × 3 standard impedance matrix via Kron’s reduction. Carson’s equations are employed for deriving the primitive phase impedances of these lines [
11]. We model overhead lines as well as underground distribution cables such as tape shield and concentric neutral.
2.2. Distribution Transformers
Distribution transformers of different configurations such as Δ −
YG and
YG − Δ are modelled in three phase [
12]. Two types of step-down transformers are modelled for the test feeder case. The type of connection of the source and load-sides of the transformer determines the [a], [b], [c], [d] matrices (as derived in [
12]) for transforming the voltages and currents from one side to the other.
2.3. Voltage Regulators
Voltage regulators are used as a means to regulating the voltage such that the customer voltage levels are kept within reasonable limits. There have been limited attempts at modelling step voltage regulators in view of their significance in distribution networks [
13]. These devices are nothing but autotransformers with a load tap-changing mechanism. The change in voltage is obtained by switching the tap positions up or down by prescribed levels, usually in 32 steps with a regulation of ±10% giving 5/8% or 0.00625 p.u. change per step. This is equivalent to 0.75 Volts on a 120 V base.
is the desired voltage level around which are prescribed the lower band (LB) and upper band (UB) voltage limits as follows:
VLB =
Vset − 0.5 BW,
VUB =
Vset + 0.5 BW. A line drop compensation (LDC) circuit is used to control the changing of taps. Since the regulator is located at the end of a distribution line, the LDC is used to estimate the drop in the line voltage beyond regulator such that Δ
V =
Icomp(
Rset +
jXset) and
VLDC =
Vreg − Δ
V. The following protocol is then applied to change taps at each
pth step:
2.4. Composite Loads
Finally, we adopt the concept of component-based load aggregation predominantly at the 4.16 kV/480 V transformer, which will support the increasing adoption of demand management strategies by utility companies that require time-step analysis of appliance models. Appliances that form a part of the Load class are modelled as individual elements of either the exponential or the ZIP type (
Z—constant impedance,
I—constant current,
P—constant power). These are then aggregated to define a composite load model for use in the algorithm. ZIP models are of the form,
and
with the coefficients depending on the type of the load/appliance. Here, we consider a combination of loads that is best represented by a ZIP model with aggregated parameters. This is done by clustering a combination of appliances in each of the three phases downstream to the transformers. This not only induces unbalance across the phases but also allows for changing the composition of loads at each time step. The parameters of the aggregate load model are calculated as the weighted average of the respective parameters of the
appliances in the group. For example:
The aggregated load model is now:
where
Pagg and
Qagg are the real and reactive parts of the aggregated load, respectively.
3. Short-Term Electricity Market Module
ABM techniques have been used worldwide to model newly restructured markets [
14] and some even to aid policy makers about the pros and cons of specific trading arrangements. Examples include the AMES (ABM of electricity systems) framework where the US electricity market was simulated on a day-ahead and real-time scale [
15], the electricity market complex adaptive system (EMCAS), developed by Argonne national laboratory [
16] and the Australian national electricity market simulator (NEMSIM) [
17]. In the UK electricity market context, agent-based approaches have previously been used specifically to study the transition of trading arrangements from the pool to a discriminatory-pricing auction system [
18]. The ABM framework of short-term market presented here provides a good basis for simulating complex world of market arrangements while at the same time allowing the modeler to analyze the influences of varying auction structures, adopting intelligent bidding strategies and scenario testing over multiple time-scales and geographical locations.
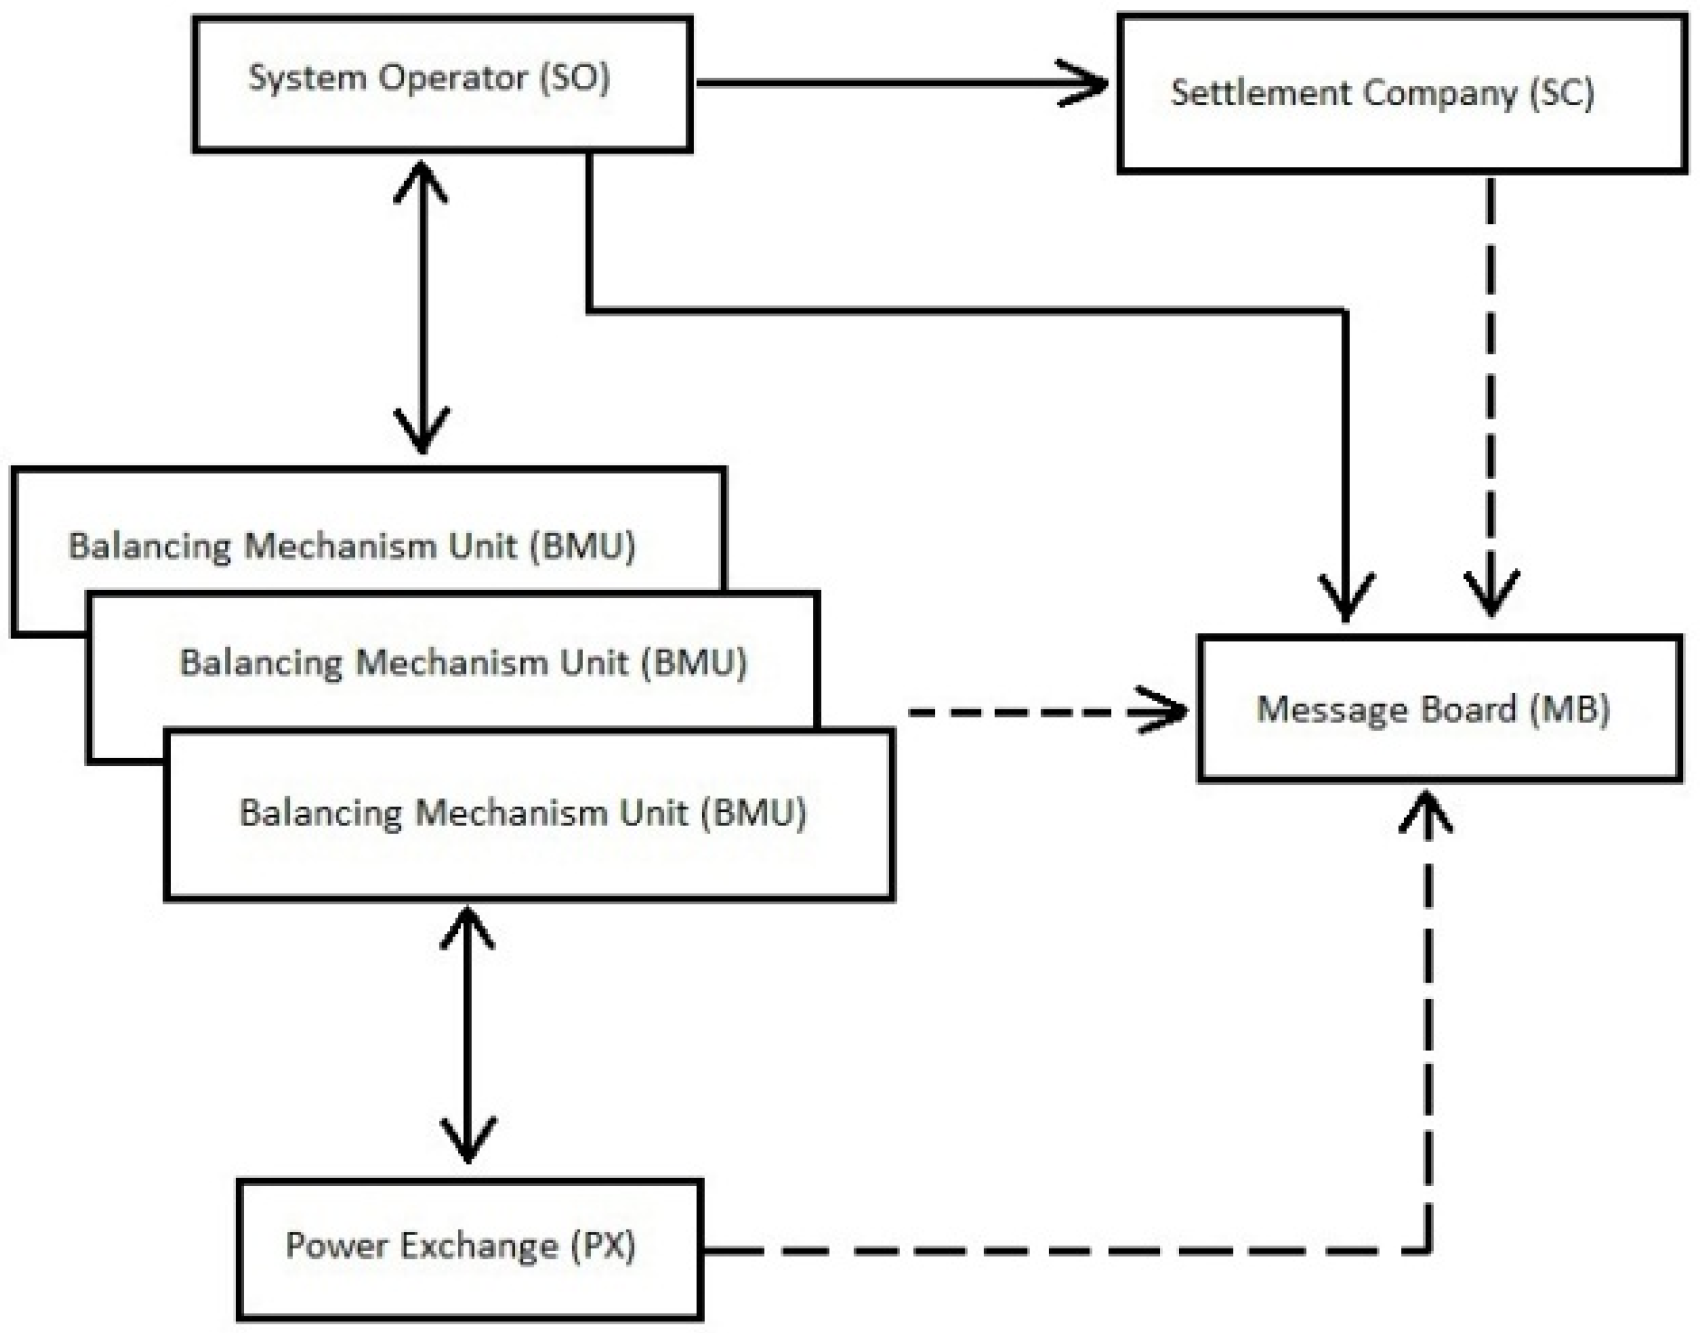
The entities involved in the balancing mechanism are the power eXchange (PX), SO, settlement company (SC) and finally the various types of balancing mechanism units (BMUs). They are more than mere classes / components of a whole system in the way that they evolve and adapt to their environment, sometimes deriving new rules of play. The SO, for example, maintains a history of the reliabilities of BMUs and acts accordingly while issuing bilateral balancing services and some reserve services. On the other hand, the BMUs, whose profits depend on the reliable prediction of their physical positions at the time of delivery, try to evolve strategies to minimize risk and maximize profits. They would ideally process the historic bid-offer-data (BOD) of other BMUs and their acceptance rates by SO. In our model we start off with a simple Roth-Erev learning strategy [
19] applied to evolve optimal or strategically efficient offer/bid prices, especially by looking at successful bids and offers.
Figure 3 is an outline of the class diagram depicting the interaction between the agents. The model is implemented using the Java-based modelling toolkit environment repast simphony [
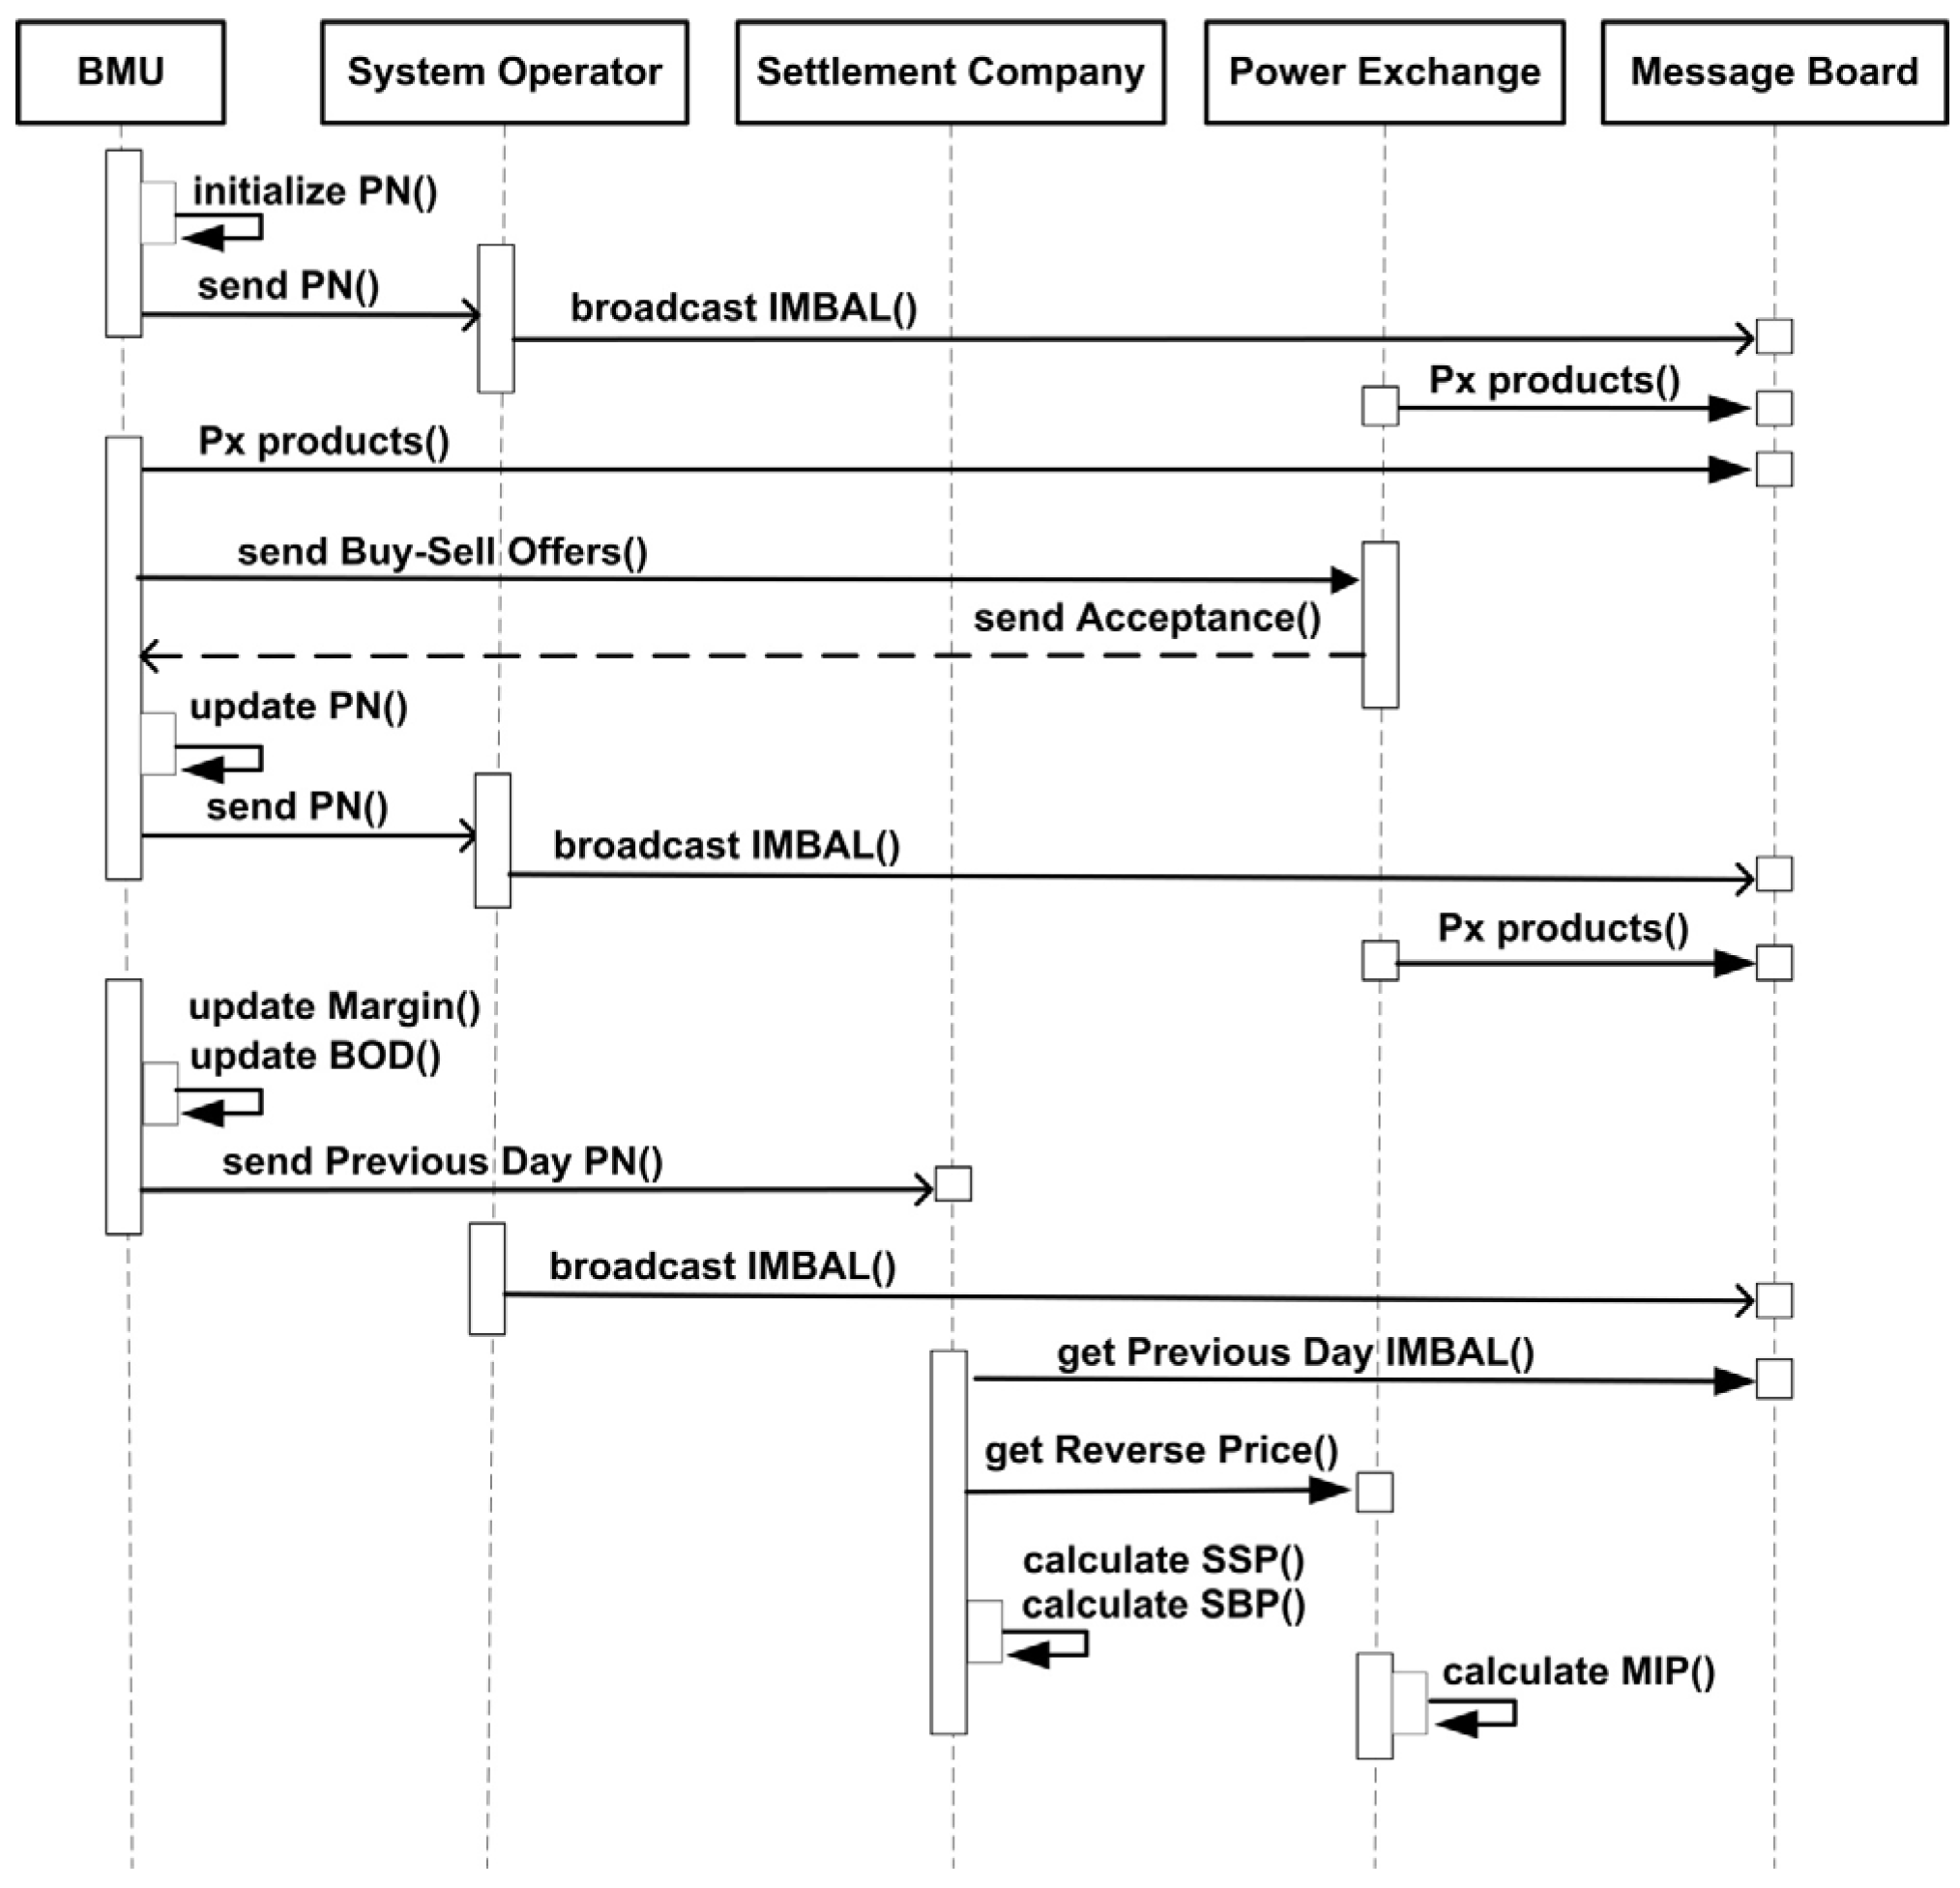
13]. The message board (MB) is a passive agent used to broadcast and transfer information between agents. Information typically broadcast is indicated margin (INDMAR), imbalance (IMBAL) of the system, final physical notifications (FPNs) and BOD. The BMUs access this information and subsequently participate in the PX and trade on the day-ahead of actual delivery. BMUs also submit BODs to the SO who in turn generates acceptances by flagging off the cheapest offers and the costliest bids in the initial round (in case of IMBAL < 0 for that settlement period (SP)). The bid-offer acceptances (BOAs) are transmitted to the SC for calculation of system buy and sell prices. A brief scheduling diagram is given in
Figure 4. The methods are named for convenience of readability.
Figure 3.
Agents interacting in the short term electricity market. The balancing mechanism units (BMU) could range from big generating units to aggregated demand units.
Figure 3.
Agents interacting in the short term electricity market. The balancing mechanism units (BMU) could range from big generating units to aggregated demand units.
Figure 4.
Sequencing chart depicting the scheduled message passing between agents.
Figure 4.
Sequencing chart depicting the scheduled message passing between agents.
The PX in our model operates with standardized products, on a day-ahead basis, with a double-auction discriminatory pricing method. The IMBAL profile for the next day is converted into arrays of standardized products. We consider HH, 2 h (2HR) and 4 h (4HR) products spanning over the next day resulting in 48-HH, 12-2HR and 6-4HR products per day. The different products are convenient for parties to trade according to the actual IMBAL over each SP or a range of consecutive SPs. For example, a positive IMBAL from the 5th SP onwards for 2 h and a negative IMBAL for 4 h from the 9th SP would require bids on 2HR and 4HR products for sensible trading.
3.1. Balancing Mechanism Units
BMUs are the smallest controllable group of production or consumption units. They could be single units in power plants or an entire set of generating units, or a supplier’s consumers comprised within a grid supply point. Pumped hydro storage units and interconnectors that produce/import or consume/export energy at various times of the day could also be classified as participating BMUs. We consider three types of generator BMUs based on their fuel type-coal, closed cycle gas turbine (CCGT) and wind farms, and two types of supplier BMUs—large and small demand sites. To start out with, we adopt baseline profiles for each of the above BMUs that are in sync with typical winter profiles (November 2011) of the BMUs in the UK market [
20]. We use an average profile corresponding to each type of BMU and use a shrinkage factor based on the capacities to obtain the baseline profile for each of the BMUs. The actual FPNs of various supplier BMUs were collated from the real data and were classified broadly into large and small demand sites.
3.2. System Operator
The SO is responsible for matching supply to demand on the timescale of minutes and seconds. The SO does this by calling on various energy balancing services that are contracted bilaterally with reliable parties weeks and days in advance and are also called upon by issuing suitable tenders. They become operational in the short-term in the time scale of hours before the GC to 2 s before the actual time of delivery. The SO also takes actions after gate closure, known as system balancing actions that are required to maintain the integrity of the system by letting it to operate in stable conditions and under non-contingency conditions. The prices of such actions are excluded from the calculation of SPs.
Pre-gate closure processes:
Estimates the transmission system demand forecast.
Receives PNs from each BMU for the period from and including day 2 to day 14 ahead.
Broadcasts the indicated margin INDMAR:
where
is the number of exporting BMUs and
and
are the maximum exporting limit and physical notifications of the
BMU for the
SP.
where
is the number of importing units, which in this case are suppliers.
Receives Initial PNs from BMUs at 11:00 day-ahead and then on continuously over the next day. This step and the following step are activated in the model at three times of the day, not every SP.
Continuously broadcasts updated INDMAR and IMBAL.
Receives FPNs at 23:00 day-ahead.
Receives BOD from participating BMUs.
Post-gate closure processes:
Assessment of system IMBAL before actual delivery.
Issuance of BOAs to relevant BMUs.
Broadcast of historic BOAs to the message board.
Transfer of call to the SC at the end of the concerned SP.
3.3. Settlement Company
The difference between the metered volumes and the contracted positions, including the bids and offers made by that BMU, are cashed out at the system buy price (SBP) if the difference was a deficit. These prices encourage participants to stick to their FPNs and not get exposed to prices determined by other market players. If IMBAL > 0, the system sell price (SSP) is set at the price derived through trades in the balancing mechanism (BM) market (also called as main price), while the market reverse price (MIP) (or reverse price) becomes the SBP. This would mean that the players who are found to be in deficit have to pay at the MIP thus encouraging cautious trading on the PX. Similarly, if the system IMBAL is negative, SBP = main price and the SSP = MIP. The SC calculates a “reverse” energy imbalance price for each SP to reflect the price of electricity traded in the PX. The SC provides guidelines to the PX on providing it with a MIP that is the volume weighted average price of the selected trades expressed in £/MWh. APX Commodities Ltd and NASDAQ OMX Stockholm AB are the current MIP providers for the SC in UK.
4. Applications and Results
A generic 4.16 kV network that is predominantly radial in structure and extending up to and including the 4.16 kV/480 V secondary distribution transformers is used to assess the algorithm. The network is unbalanced in the composition of the loads and capacitors on different phases of the system. These loads are supplied either by three phase, two phase or single phase lines. The total number of buses is 123. The institute of electrical and electronics engineers (IEEE) test feeder is shown as a single line diagram in
Figure 5 [
21].
Figure 5.
Institute of electrical and electronics engineers (IEEE) 123-bus test feeder. Position of switches is set for a radial configuration.
Figure 5.
Institute of electrical and electronics engineers (IEEE) 123-bus test feeder. Position of switches is set for a radial configuration.
4.1. Voltage Regulation Using Genetic Algorithm
We demonstrate the effectiveness of the distribution system module by addressing the issue of voltage regulation on the above IEEE test system [
22,
23]. The objectives are to minimize voltage unbalance on each node and to simultaneously reduce the total power losses on the entire network. The quality of voltage can be measured using various indices. For example, in [
24] a voltage deviation index was used that measured the deviation both from the minimum and maximum specified values, weighted by power injections at the nodes. The constraints to the objective funtion are voltage limits of nodes, the power limits of the DG units and power balance equations of injected power at each node. The decision variables are the tap positions of voltage regulators (VR), status of capacitors (CP), and the optimal reactive power generated by the DG units. The outcome of this method is that the SO is provided with an optimal set of tap positions of voltage regulators, status and switchable capacities for shunt capacitors in conjunction with a control strategy for the reactive power generated through DG sources. The result is a combination of traditional distribution network operator (DNO) voltage control and reactive power control strategy for mitigating voltage rise. The multi-objective optimization problem (MOP) to be solved is:
where
and
which is the total voltage unbalance index (VUI) of the system. The unbalance at each node is given by:
where
and the total power loss across the system is:
where
is the voltage and
is the current injected at node
i.The decision variables of the MOP are as follows:
Voltage regulators:
where
,
.
Capacitors:
where
1,
.
DG reactive power:
where
,
.
The constraints for the MOP are as follows:
where
and
are the total generated and load powers at node
i, and
is the impedance of the line
. This constraint is automatically satisfied on running the power flow algorithm.
The objectives and constraints are described in the abstract class
Problem in an analytical form. However, in our case, since such an analytical relation between the decision variables and the objective functions is difficult to derive, we use Equations (10) and (12) where voltages act as the secondary decision variables. The abstract class Problem is implemented as a power flow algorithm
“DSOpti” that is run for different values of the decision variables. The voltages obtained are used to evaluate the objective functions. Once the constraints are evaluated, each
solution is added to the
solutionSet and crossover, mutation and selection applied to obtain the Pareto optimal set. Non-dominated sorting genetic algorithm (NSGA)-II which is a Pareto optimal based elitist algorithm [
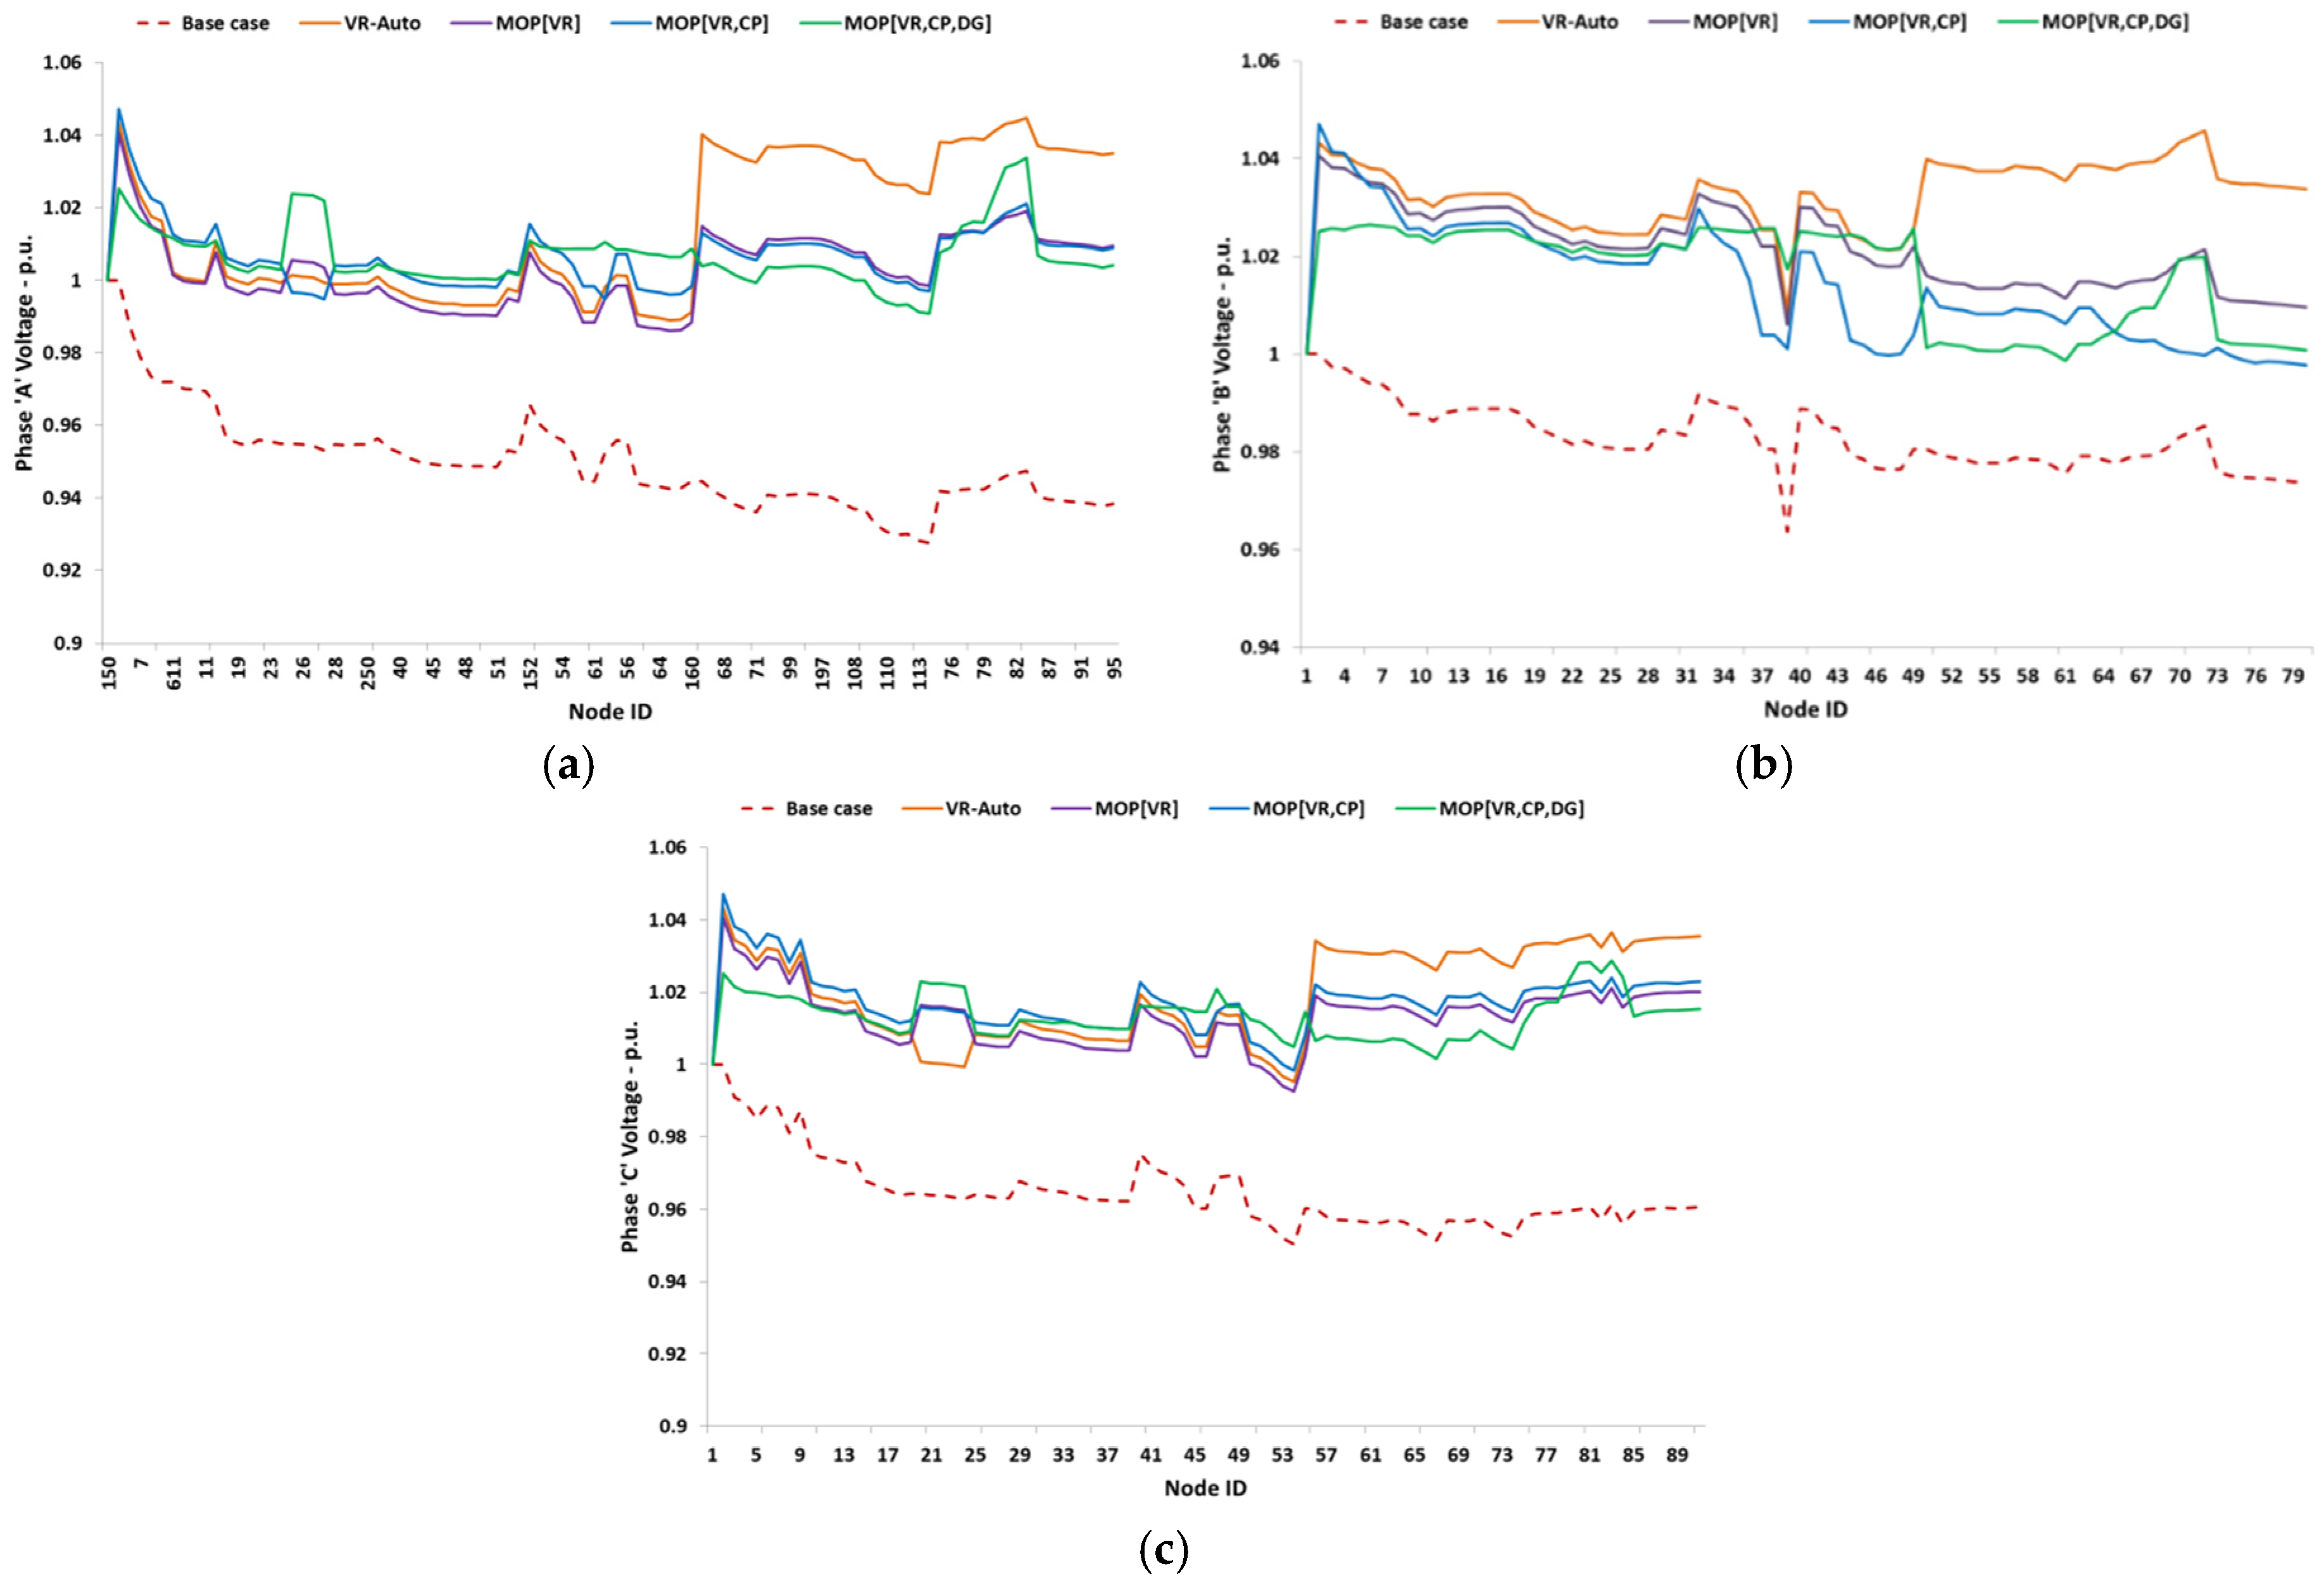
25] is employed to sort the solution set for Pareto optimality and all the objectives simultaneously. The Pareto front consists of values for the decision variables, that when used in distribution system module gives a balanced voltage profile as shown in
Figure 6 with minimal power loss. We observe that for the case with inclusion of all the decision variables, the voltage profiles across all the three phases are much more balanced and closer to 1 p.u. than as compared to the other cases. The NSGA part was implemented by using a freely available library called Metaheuristic algorithms in Java (jMetal). jMetal is a framework for solving MOPs with metaheuristic techniques [
26]. It is made up of abstract classes for
Algorithms, Operators, Problems and
SolutionType,
etc.
Figure 6.
(a) Node voltages on phase ‘a’ of IEEE 123-bus test feeder for different cases of voltage regulation; (b) node voltages on phase ‘b’ of IEEE 123-bus test feeder for different cases of voltage regulation; and (c) node voltages on phase ‘c’ of IEEE 123-bus test feeder for different cases of voltage regulation.
We test the methodology on five different cases with each case employing advanced control variables. For example, the base case is one where voltage is unregulated and the final case where voltage regulators, capacitors, and the DG units are optimized to achieve the said objectives. DG units are installed at nodes 8, 44 and 81 initially working at unity pf and are switched to Q-control mode when the voltage is sufficiently high for a significant amount of time. This strategy works in coordination with the VR tap changers and the shunt capacitors such that the latter get the initial preference for voltage regulation. In addition, the DG units absorb reactive power at around 0.95 lag to pull the voltages towards 1.0 p.u and further reduce VUI and P_Losses (
Figure 7).
Figure 7.
Values of objective functions of Pareto optimal solutions for each case of voltage regulation.
Figure 7.
Values of objective functions of Pareto optimal solutions for each case of voltage regulation.
With the use of intelligent electronic devices (IEDs) within the substation and at other remote locations on the network, voltage control in distribution networks is fast becoming a reality. For example remote and local control at the substation is possible using IEDs for on-load tap changer (OLTC) control operations using IEC 61850 standard. Experiences in Europe [
27] and in Australia [
28] have shown that such real-time control is possible for OLTC operations. A real-world example of controlling voltage through enhanced network devices was provided through a project called customer led network revolution (CLNR) in the UK [
29]. They demonstrate a grand unified scheme control that provides a supervisory control functions to effectively manage the enhanced network devices of which the voltage regulators form a part. The approach presented in this paper can be readily deployed within such intelligent control systems.
4.2. Effect of High Wind Penetration on Balancing Market
We use the short-term market module described in
Section 3 to investigate the effect of intermittent sources of energy such as wind on the outcome of the balancing mechanism [
30]. Intermittent electricity supply can result in a higher variation of the system imbalance. Schemes such as the renewable obligation certificates in the UK and other similar schemes throughout Europe encourage production from renewable sources [
31]. For example, [
32] look into various regulations within Germany, Spain and UK that support integration of wind power producers into the market, while [
33] look at balancing market integration in northern european context. Under such a scenario, entry of bulk intermittent power into all aspects of the electricity market is going to happen sooner than anticipated. We study two cases in particular with varying levels of wind generation:
Case 1: The level of wind generated power is considered to be around the current levels of that in the UK. Wind power is at 3%, CCGT at 52% and power generated from coal at 45% of the total permissible capacity of about 11 GW. The proportion of large
versus small supplier BMUs is 80% to 20% of their total combined capacity. The imbalance volumes over a period of 5 days with the learning phase completed are shown in
Figure 8a. There is surplus energy over the entire 5 day period and the imbalances at the day-ahead stage for each cycle are in the range of 600 MW to 1400 MW. This surplus of energy is then traded on the PX in consecutive rounds, comprising of HH, 2HR and 4HR products. At the end of trading all the BMUs that traded on the PX update their physical notifications and this information is dispatched to the SO at 23:00 on the day before actual delivery. Since there is a surplus amount of energy at gate closure for every SP of the entire 5 day period, the SSP is set by the Main Price while the SBP is set by the MIP. These prices are shown in
Figure 8b.
Figure 8.
(a) System imbalance (IMBAL) at day-ahead and gate-closure positions; and (b) the system sell and system buy prices (SSP, SBP) over the corresponding time period. Case1: coal plants = 4, closed cycle gas turbine (CCGT) plants = 7, wind farms = 3.
Figure 8.
(a) System imbalance (IMBAL) at day-ahead and gate-closure positions; and (b) the system sell and system buy prices (SSP, SBP) over the corresponding time period. Case1: coal plants = 4, closed cycle gas turbine (CCGT) plants = 7, wind farms = 3.
Case 2: The capacity of wind generated power is now set at 60% of the total combined capacity of around 11 GW, resulting in 44 units of wind generated power stations and two of coal and three of CCGT. The number of supplier units remains the same. The IMBAL at the day-ahead stage is now in the range of 600–1300 MW, which at GC significantly reduces to the range from +200 MW to −700 MW (
Figure 9a). The difference over the previous case is the increased variability in the IMBAL due to the high proportion of wind power. Since there is considerable IMBAL at GC, thus influencing the selection of BODs in the balancing market, the prices are volatile as seen in
Figure 9b. The prices range from 22 £/MWh up to 55 £/MWh.
Figure 9.
(a) System imbalance (IMBAL) at day-ahead and gate-closure positions; and (b) the system sell and system buy prices (SSP, SBP) over the corresponding time period. Case2: coal plants = 2, CCGT plants = 3, wind farms = 44.
Figure 9.
(a) System imbalance (IMBAL) at day-ahead and gate-closure positions; and (b) the system sell and system buy prices (SSP, SBP) over the corresponding time period. Case2: coal plants = 2, CCGT plants = 3, wind farms = 44.
A comparable alternative to our modelling approach is given in [
34] where the modelling is in steps including the day-ahead and real-time balancing market models. Here, the day-ahead market is modelled as a perfect common market, neglecting market power issues, for the whole European continent. All the generators are assumed to be price-takers and bid their marginal cost. The mathematical model for this market is based on the DC optimal power flow. On the other hand, the balancing market is modelled with power dispatch in real-time that uses the output dfrom the day-ahead market. Both the markets are modelled as optimization problems for minimizing dispatch costs. A quite different approach to modelling prices from electricity markets is through the use of hidden Markov models (HMMs) where the market is in different states and the set of observations are the market clearing prices [
35]. The explanatory variables in this model are the loads, different types of generations and price values for each hour of the day. Along with price predictions, these models provide dynamic information about the market. The authors in [
36] provide another good but alternative approach for studying the effect of wind penetration on balancing prices in the UK. However they rely on econometric and cost function approach rather than simulation. The drawback of this approach is that the learning behaviour and strategies employed by market players cannot be effectively modelled. Our agent-based approach not only aims at quantifying the economic cost of incorporating wind but is also capable of testing various strategies employed by generators in balancing markets.
4.3. Aggregated Demand Response to Price Signals
One of the ambitions of a smart grid is that consumers could aggregate in some fashion to respond to real time price signals so that their demand could be controlled. Such an aggregated demand response is crucial for the success of the grid especially with ever-increasing demand and high penetrations of renewable and distributed resources. We use the combined framework of
Section 2 and
Section 3 in investigating one such simple form of aggregated demand response with varying levels of elasticity [
36]. The demand aggregators would respond to real time price signals from the short term electricity market according to their respective price elasticities. The SBP of the balancing market is the price paid by the BMU if it generates less than what it bid, and paid by the demand BMU if it consumes more than what it offered. This is sufficient enough reason for choosing SBP as the price signal for which the aggregated demand BMU responds. This would encourage the demand BMUs to reduce their actual consumption and in turn reduce the imbalance between supply and demand. Additionally, this change in the demand profiles proliferates into the total imbalance between supply and demand as seen by the market, which in turn influences the bidding strategies of the players in the market. The market players such as generating units would then alter their bids based on their previous bidding experience and a goal to minimize their operating costs. The consequence of the above processes would give rise to the right proportion of a mixture of generation technologies in a competitive electricity market based on the price elasticity of aggregated demand sites.
Using the ABM framework and the methodology as described in
Section 2 and
Section 3, respectively, we investigate the scenario with four coal plants, seven CCGT plants and three wind farms. The training phase for building a reference price signal is 100 days, during which period the demand sites do not respond to the price signal. Once the reference price signal is built, all the five LARGE_DEM and three SMALL_DEM sites are allowed to respond to the actual price signal which is the SBP of the previous day. We test the scenario with aggregated elasticity factors of 10% and 30% respectively. An estimate of the aggregated demand is supplied by each demand BMU to the SO who in turn evaluates the total imbalance of the system for the next day. Suppose that
D0 is the baseline demand which is an estimate of the next-day demand. This estimate is largely based on the present day demand. Each demand BMU is now allowed to respond to a price signal
P which is supplied by the market module, which is compared with the reference price signal
P0, which is an average of the SBPs taken over
N number of days. Therefore the reference price for the
ith SP is:
The new demand is given by
, where
and
e is the price elasticity of that particular demand BMU. The aggregated demand at each
ith settlement period of a given day is therefore:
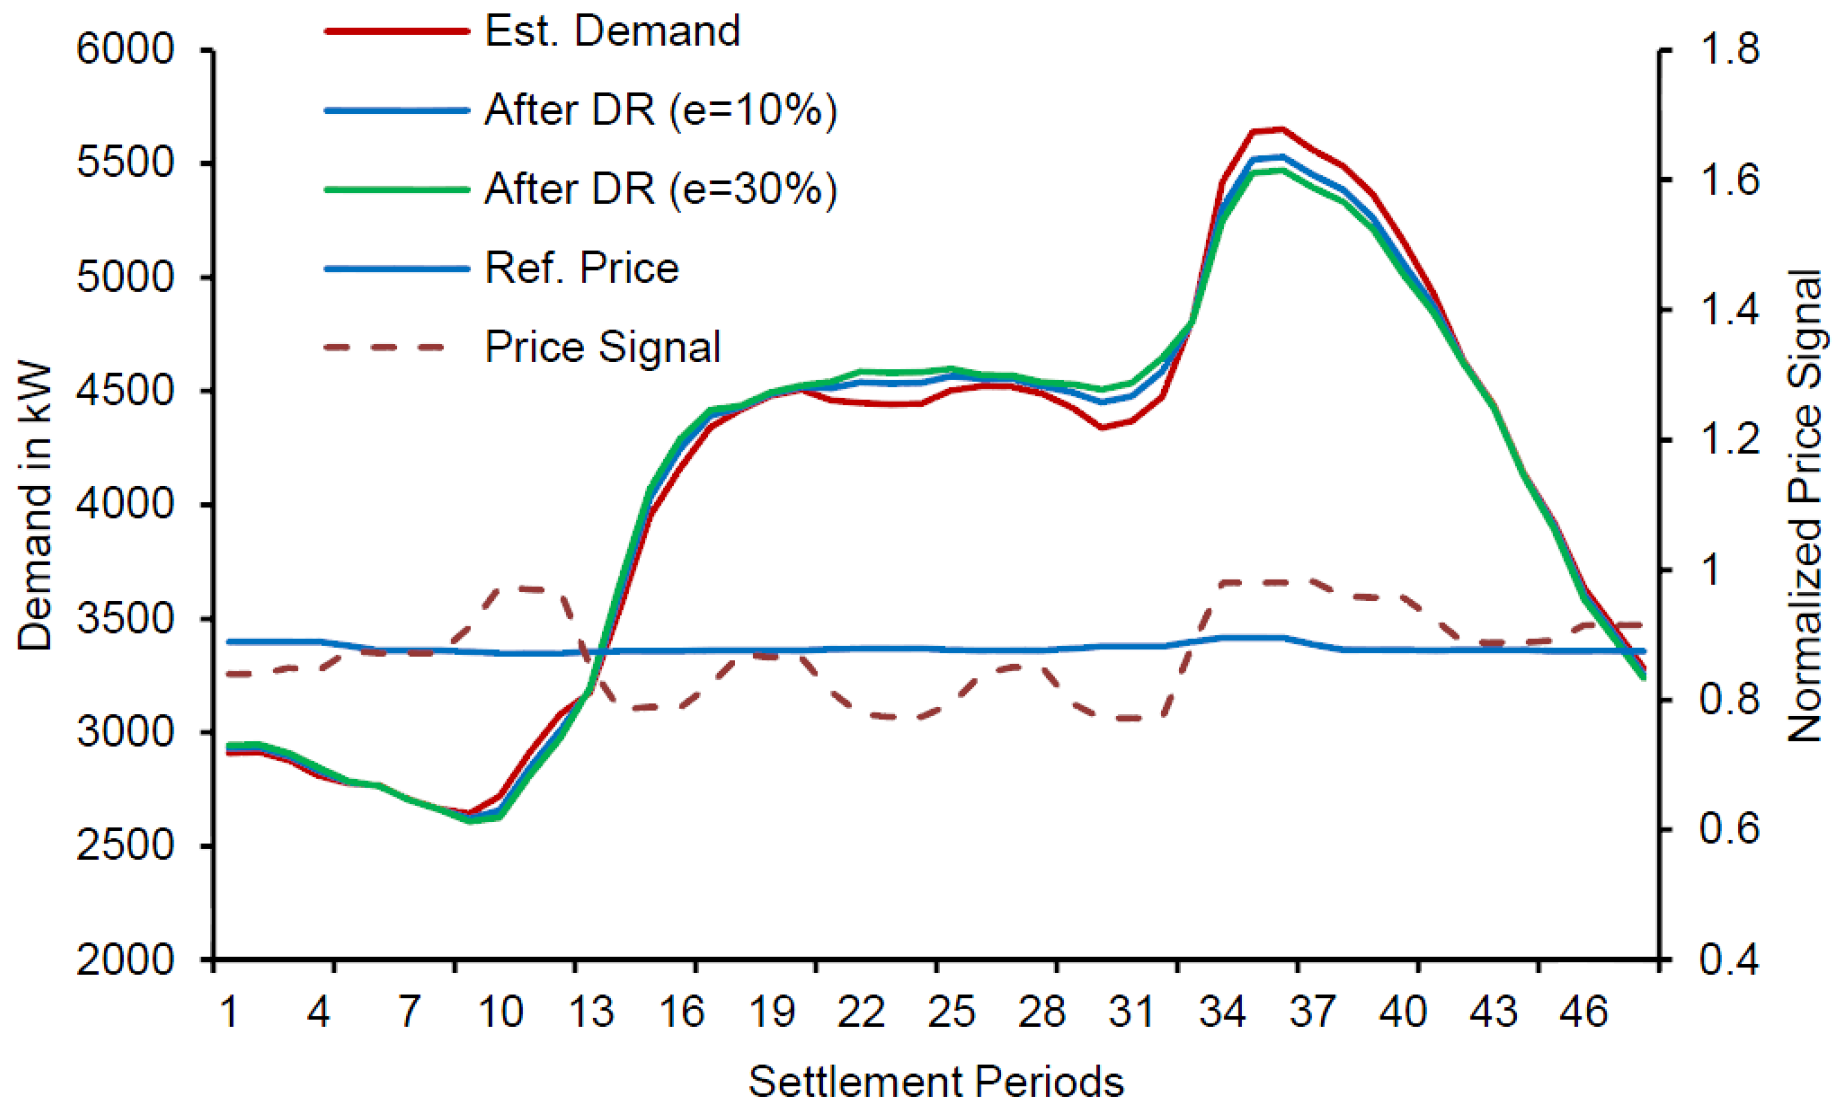
The price signals and the total aggregated demand curves are shown in
Figure 10. We notice that as the actual price signal varies around the reference price, the demands respond appropriately,
i.e., for increase in price from the reference, the demand reduces in volume. The peak demand reduction with the above price signal was between 2% and 3%. The reduction could be substantial if we employ a time-of-use (TOU) or critical-peak-pricing (CPP) mechanism within the above price signaling framework. Of the many pilot projects on demand response done in the US market, the peak demand reduction was found to range from 3% to 6% for TOU and much higher reductions of 10%–40% for CPP mechanisms. The elasticities were found to be anywhere between 7% and 21% [
37,
38,
39].
Figure 10.
Aggregate demand response curves for aggregated elasticities of 10% and 30% respectively. The reference price and the actual price signals are normalized between 0 and 1.
Figure 10.
Aggregate demand response curves for aggregated elasticities of 10% and 30% respectively. The reference price and the actual price signals are normalized between 0 and 1.
5. Conclusions
The Smart Grid environment is an enabler and a pre-requisite for achieving seamless coordination between a variety of resources that are distributed, variable and price-sensitive for the benefit of all the players involved. The concept of virtual power plants (VPPs) and microgrids are examples of frameworks within the smart grid domain [
40]. There have been numerous efforts at developing models within these frameworks for addressing various issues relevant to the smart grid philosophy. Equation based models have been used for simulation or optimization purposes. Market allocation (MARKAL), Wein automatic system planning (WASP), combined gas and electricity networks (CGEN) are examples of optimization models in the field of energy systems [
41]. Such modelling methods are used with bottom-up reductionist approaches unable to capture complex interactions of the system being modelled. Feedback and emergence are not properly captured by these modelling approaches. On the other hand, agent based models focus on behaviour and action of individual agents through which system-level behaviour emerges. Due to the ease and flexibility of development, the agent-based approaches have become the mainstay of the modelling exercises. For example, authors in [
42] present a multi-agent framework for the VPP concept within which they address the issue of collaborative forecasting of disaggregated energy demand. Similarly, agent philosophy has been used to address issues such as microgrid dispatch and control [
43,
44], coordinated charging of electric vehicles [
45] or dispatch of DG units for voltage support [
46].
Distribution networks have unique features with respect to the type of components and the complexity involved in analyzing this network. Analysis of such networks would act not only as a conventional planning tool, but also in investigating the robustness of the distribution network to new features such as the introduction of smart meters, new market mechanisms at the distribution level, responsive loads, etc. Towards this end, in this work we have developed an object-oriented modelling framework capable of analyzing medium to low voltage (MV/LV) distribution systems. The framework can flexibly and efficiently accommodate changes such as the integration of DG, automated demand side management strategies and various new technologies associated with the concept of the smart grid. The design of the framework is flexible so as to include operations of the electricity market such as auctions and bidding processes.
Voltage control in distribution systems is one of the core operational issues for present day utilities due to the nature of loads and high penetration of DGs. We have presented here a coordinated strategy for regulating voltage by means of tap changing VRs, switching capacitors and reactive control by DG units themselves. The two-fold objective of balancing the voltages and reducing power losses is solved via a genetic based non-dominated sorting approach (NSGA-II) and a power flow solver. The results show that a very good balanced voltage profile and a high degree of control over each phase is possible through coordination of different variables.
We also described the design and development of an ABM Framework for the day-ahead market and the intraday balancing mechanism specific to the UK. The results of the ABM are based on the optimal bid/offer actions obtained after convergence in the learning strategy. Further work needs to be done on the model presented here to give it greater flexibility and capacity to capture complex system effects. In the future we intend to include a reserve market that operates hours before GC, a more realistic representation of the PXs, and various types of BMUs such as interconnectors and embedded generating units. We also intend to include other characteristics of the BMUs such as their location and production cost. The availability of rich sources of data would be useful to validate such models.
In the present work we have applied the ABM methodology to assess the impact of increasing levels of penetration of wind power on the short term market. The imbalance experienced at the time of GC is more volatile as the levels of wind power output increase as a percentage of the total power generated on the grid. This in turn allows for an increase in the range of selection of BODs in the balancing market, thus contributing towards volatility in SSP and SBP. Since the balancing costs are allocated as pay-as-bid, the wind power generators would ideally earn more profits in such a situation. On the other hand, they would lose out on the trades in the PX market to their competitors. With better forecasting and wind modelling tools and with access to energy storage units the owners of wind generators can devise strategies for optimally allocating their trades between the PX and the balancing markets. The imbalance costs as measured by SSP and SBP are allocated amongst the BMUs once the actual time of delivery has elapsed. It therefore makes sense for the power generators to get their imbalance predictions right every time. A physical or commercial aggregator of such producers could be a viable solution for the above issues.
Finally, we described an application based on the combined frameworks of the engineering and market modules with models for generation and aggregated demand sites. These demand sites are allowed to be elastic in response to price signals from the market. Similarly, the generators are allowed to alter their bids and offers in a dynamic market environment. The change in the demand is influenced by its response to system buy price that is a direct consequence of the bids and offers of the generating demand units. The bidding strategies employed by the generators are guided by the operating cost of the generation technology employed. Thus a feedback loop is formed between the demand and the profitability of the generators resulting in some generation technologies prevailing over the others in the longer term. Using the above framework we can therefore assess the effect of varying proportions of generation technology mix on the response of demand aggregators through price signals from the market. This would give us an idea of the right proportion of technology mix for sustaining a required amount of demand response, thereby allowing the generators to put faith in the bidding curves that they submit in the market. In the model we take into account generator characteristics such as generating profiles, market behaviour and cost of generation of individual technologies, while on the demand side, the emphasis is on aggregated demand profiles and price elasticity within a particular range.
Abbreviations
| DG | Distributed generation |
| ABM | Agent based models |
| AMEN | Agent-based modelling of electricity networks |
| ACE | Agent-based computational economics |
| PROSUMER | An agent who is both a PROducer and ConSUMER of Electricity. For example, a household with rooftop PV installed. However, a pure generator or a pure consumer is also classified as a prosumer in our modelling framework. |
| DNO | Distribution network operator |
| MV | Medium voltage |
| LV | Low voltage |
| CCGT | Closed cycle gas turbine |
| VR | Voltage regulator |
| CP | Capacitor |
| LDC | Line drop compensation |
| BM | Balancing mechanism market |
| PX | Power eXchange |
| MB | Message board |
| SO | System operator |
| SC | Settlement company |
| BMU | Balancing mechanism unit |
| BOD | Bid offer data |
| BOA | Bid offer acceptance |
| SSP | System sell price |
| SBP | System buy price |
| MIP | Market index price |
| HH | Half hour |
| SP | Settlement period (1/2 h in the UK electricity market) |
| GC | Gate closure |
| LARGE_DEM | Large demand site |
| SMALL_DEM | Small demand site |
| INDMAR | INDicated MARgin |
| IMBAL | IMBALance in the demand and supply of electricity |
| PN/FPN | Physical notification / final physical notification |
| MEL | Maximum export limit |
| MOP | Multi-objection optimization problem |
| NSGA | Non-dominated sorting genetic algorithm |
| jMetal | Metaheuristic algorithms in java |
| DSOpti | An implementation of the power flow algorithm |
| VUI | Voltage unbalance index |
| P_Losses | Real power losses across the distribution network |
| VPP | Virtual power plant |
| TOU | Time-of-use |
| CPP | Critical peak pricing |
Acknowledgments
This work was conducted as part of the AMEN (Agent-based Modelling of Electricity Networks) project, funded by the Engineering and Physical Sciences Research Council (UK) under grant number: EP/K033492/1. The authors wish to thank the reviewers for their useful comments.
Author Contributions
Pakka, V.H. designed the study, developed the methodology and software packages, performed the analysis and wrote the manuscript. Rylatt, R.M. helped design the study and develop the methodology, and contributed to sections 1, 4.3 and 5.
Conflicts of Interest
The authors declare no conflict of interest.
References
- Hogan, W.W. Contract networks for electric-power transmission. J. Regul. Econ. 1992, 4, 211–242. [Google Scholar]
- De Groot, H.L.F.; Mulder, P.; Van Soest, D.P. Subsidising the Adoption of Energy-Saving Technologies: Analyzing the Impact of Uncertainty, Learning and Maturation; Tinbergen Institute: Rotterdam, The Netherlands, 2004. [Google Scholar]
- Ochoa, L.F.; Dent, C.J.; Harrison, G.P. Distribution Network Capacity Assessment: Variable DG and Active Networks. IEEE Trans. Power Syst. 2010, 25, 87–95. [Google Scholar] [CrossRef]
- Brand, H.; Thorin, E.; Weber, C.; Madlener, R.; Kaufmann, M.; Kossmeier, S. Market Analysis and Tool for Electricity Trading. Technical Report for Optimisation of Cogeneration Systems in a Competitive Market Environment. Available online: http://www.oscogen.ethz.ch/reports/oscogen_d5_1a_250602.pdf (accessed on 10 April 2011).
- Tesfatsion, L. Agent-based computational economics: Growing economies from the bottom up. Artif. Life 2002, 8, 55–82. [Google Scholar] [CrossRef] [PubMed]
- Leombruni, R.; Richiardi, M. Why Are Economists Sceptical about Agent-based Simulations? Phys. A Stat. Mech. Appl. 2005, 355, 103–109. [Google Scholar] [CrossRef]
- Macal, C.M.; North, M.J. Validation of an agent-based model of deregulated electric power markets. In Proceeding of the North American Association for Computational and Social Organization (NAACSOS) Conference, Notre Dame, IN, USA, 22–23 June 2006.
- The Repast Suite. Available online: http://repast.sourceforge.net/ (accessed on 10 April 2011).
- Shirmohammadi, D.; Wong, H.W.; Semlyen, A.; Luo, G.X. A Compensation-Based Power Flow Method for Weakly Meshed Distribution and Transmission Networks. IEEE Trans. Power Syst. 1998, 3, 753–762. [Google Scholar] [CrossRef]
- Augugliaro, A.; Dusonchet, L.; Favuzza, S.; Ippolito, M.G.; Sanseverino, E.R. A backward sweep method for power flow solution in distribution networks. Electr. Power Energy Syst. 2010, 32, 271–280. [Google Scholar] [CrossRef]
- Kersting, W.H.; Green, R.K. The Application of Carson’s Equation to the Steady-State Analysis of Distribution Feeders. In Proceeding of the IEEE/PES Power Systems Conference and Exposition, Phoenix, AZ, USA, 20–23 March 2011.
- Kersting, W.H.; Phillips, W.H.; Carr, W. A new approach to modeling three-phase transformer connections. IEEE Trans. Ind. Appl. 1999, 35, 169–175. [Google Scholar] [CrossRef]
- Gallego, L.A.; Padilha-Feltrin, A. Voltage Regulator Modeling for the Three-Phase Load Flow in Distribution Systems. In Proceeding of the IEEE/PES Transmission and Distribution Conference and Exposition, Bogota, Colombia, 13–15 August 2008.
- Weidlich, A.; Veit, D. A critical survey of agent-based wholesale electricity market models. Energy Econ. 2008, 30, 1728–1759. [Google Scholar] [CrossRef]
- Sun, J.; Tesfatsion, L. Dynamic testing of wholesale power market designs: an open-source agent-based framework. Comput. Econ. 2007, 30, 291–327. [Google Scholar] [CrossRef]
- Conzelmann, G.; Boyd, G.; Koritarov, V.; Veselka, T. Multi-agent power market simulation using EMCAS. IEEE Power Eng. Soc. Gen. Meet. 2005, 3, 2829–2834. [Google Scholar]
- Batten, D.; Grozev, G. Complex science for a complex world: Exploring human ecosystems with agents. In NEMSIM: Finding Ways to Reduce Greenhouse Gas Emissions Using Multi-Agent Electricity Modelling; ANU EPress: Canberra, Australia, 2006; pp. 227–252. [Google Scholar]
- Bower, J.; Bunn, D. Experimental analysis of the efficiency of uniform-price versus discriminatory auctions in the England and Wales electricity market. J. Econ. Dyn. Control 2001, 25, 561–592. [Google Scholar] [CrossRef]
- Erev, I.; Roth, A.E. Predicting how people play games: reinforcement learning in experimental games with unique, mixed-strategy equilibria. Am. Econ. Rev. 1998, 88, 848–881. [Google Scholar]
- Neta—The New Electricity Trading Arrangements. Available online: http://www.bmreports.com/ (accessed on 10 April 2011).
- IEEE Distribution Test Feeders. Available online: http://www.ewh.ieee.org/soc/pes/dsacom/testfeeders/ (accessed on 21 October 2012).
- Pakka, V.H.; Rylatt, M. An NSGA-II based Multi-Objective Approach for Distribution System Voltage Control. In Proceeding of the CIRED Workshop on Challenges of Implementing Active Distribution System Management, Rome, Italy, 11–12 June 2014.
- Pakka, V.H.; Rylatt, M. An object-oriented framework for analysis of MV/LV distribution systems. In Proceeding of the 13th Spanish-Portuguese Conference on Electrical Engineering, Valencia, Spain, 3–5 July 2013.
- Hooshmand, R.; Soltani, S.H. Simultaneous optimization of phase balancing and reconfiguration in distribution networks using BF-NM algorithm. Electr. Power Energy Syst. 2012, 41, 76–86. [Google Scholar] [CrossRef]
- Deb, K.; Pratap, A.; Agarwal, S.; Meyarivan, T. A Fast and Elitist Multiobjective Genetic Algorithm: NSGA-II. IEEE Trans. Evol. Comput. 2002, 6, 182–197. [Google Scholar] [CrossRef]
- Durillo, J.J.; Nebro, A.J. jMetal: A Java framework for multi-objective optimization. Adv. Eng. Softw. 2011, 42, 760–771. [Google Scholar] [CrossRef]
- Gajic, Z.; Aganovic, S.; Benovic, J.; Leci, G.; Gazzari, S. Using IEC 61850 analogue goose messages for OLTC control of parallel transformers. In Proceeding of the 10th IET Intl Conference on Managing the Change Developments in Power System Protection (DPSP 2010), Manchester, UK, 29 March–1 April 2010.
- Li, Y.; Nair, N.C.; Nguang, S.K. Improved coordinated control of On-load Tap Changers. In Proceeding of the 20th Australasian Universities Power Engineering Conference (AUPEC), Christchurch, New Zealand, 5–8 December 2010.
- Hollingworth, D.; Birch, A.; Miller, D. Demonstrating enhanced automatic voltage control for today’s low carbon network. In Proceeding of the CIRED 2012 Workshop Integration of Renewables into the Distribution Grid, Lisbon, Portugal, 29–30 May 2012.
- Pakka, V.H.; Ardestani, B.M.; Rylatt, M. Agent-based modelling of the UK short term electricity market: Effects of intermittent wind power. In Proceeding of the 9th International Conference on the European Energy Market (EEM), Florence, Italy, 10–12 May 2012.
- Hiroux, C.; Saguan, M. Large-scale wind power in European electricity markets: Time for revisiting support schemes and market designs? Energy Policy 2010, 38, 3135–3145. [Google Scholar] [CrossRef]
- Klessmann, C.; Nabe, C.; Burges, K. Pros and cons of exposing renewables to electricity market risks—A comparison of the market integration approaches in Germany, Spain, and the UK. Energy Policy 2008, 36, 3646–3661. [Google Scholar] [CrossRef]
- Farahmand, H.; Doorman, G.L. Balancing market integration in the Northern European continent. Appl. Energy 2012, 96, 316–326. [Google Scholar] [CrossRef]
- Gonzalez, A.M.; Roque, A.M.S.; Garcia-Gonzalez, J. Modeling and Forecasting Electricity Prices with Input/Output Hidden Markov Models. IEEE Trans. Power Syst. 2005, 20, 13–24. [Google Scholar]
- Swinand, G.P.; Godel, M. Estimating the impact of wind generation on balancing costs in the GB electricity markets. In Proceeding of the 9th International Conference on the European Energy Market (EEM), Florence, Italy, 10–12 May 2012.
- Pakka, V.H.; Ardestani, B.M.; Rylatt, M. An Agent Based Model for Optimal Generation Mix based on Price Elasticity of Aggregated Consumer Demand. In Proceeding of the 13th Spanish-Portuguese Conference on Electrical Engineering, Valencia, Spain, 3–5 July 2013.
- Faruqui, A.; Sergici, S. Household Response to Dynamic Pricing of Electricity: A Survey of 15 Experiments. J. Regul. Econ. 2010, 38, 193–225. [Google Scholar] [CrossRef]
- Harry, C. Network Price Reform. In Proceeding of the BCSE Energy Infrastructure and Sustainability Conference, Sydney, Australia, 7–8 December 2006.
- Final Report for the myPower Pricing Segments Evaluation; PSE&G and Summit Blue Consulting: Newark, NJ, USA; 21–22 December 2007.
- Asmus, P. Microgrids, Virtual Power Plants and Our Distributed Energy Future. Electr. J. 2010, 23, 72–82. [Google Scholar] [CrossRef]
- Skea, J.; Ekins, P.; Winskel, M. Energy 2050 Making the Transition to a Secure Low Carbon Energy System, 1st ed.; Earthscan: London, UK, 2011. [Google Scholar]
- Hernandez, L.; Baladron, C.; Aguiar, J.M.; Carro, B.; Sanchez-Esguevillas, A.J.; Lloret, J.; Chinarro, D.; Gomez-Sanz, J.J.; Cook, D. A multi-agent system architecture for smart grid management and forecasting of energy demand in virtual power plants. IEEE Commun. Mag. 2013, 51, 106–113. [Google Scholar] [CrossRef]
- Dimeas, A.L.; Hatziargyriou, N.D. Operation of a Multiagent System for Microgrid Control. IEEE Trans. Power Syst. 2005, 20, 1447–1455. [Google Scholar] [CrossRef]
- Longenthiran, T.; Srinivasan, D.; Khambadkone, A.M.; Aung, H.N. Multiagent System for Real-time Operation of a Microgrid in Real-time Digital Simulator. IEEE Trans. Smart Grid 2012, 3, 925–933. [Google Scholar] [CrossRef]
- Papadopoulos, P.; Jenkins, N.; Cipcigan, L.M.; Grau, I.; Zabala, E. Coordination of the Charging of Electric Vehicles Using a Multi-Agent System. IEEE Trans. Smart Grid 2013, 4, 1802–1809. [Google Scholar] [CrossRef]
- Baran, M.; El-Markabi, I. A Multiagent-based Dispatching Scheme for Distributed Generators for Voltage Support on Distribution Feeders. IEEE Trans. Power Syst. 2007, 22, 52–59. [Google Scholar] [CrossRef]
© 2016 by the authors; licensee MDPI, Basel, Switzerland. This article is an open access article distributed under the terms and conditions of the Creative Commons by Attribution (CC-BY) license (http://creativecommons.org/licenses/by/4.0/).


