Article

Technical, Economical and Social Assessment of Photovoltaics in the Frame of the Net-Metering Law for the Province of Salta, Argentina

by
Luis Ramirez Camargo
1,2,*,
Judith Franco
3,4,
Nilsa María Sarmiento Babieri
3,
Silvina Belmonte
3,
Karina Escalante
5,
Raphaela Pagany
1 and
Wolfgang Dorner
1
1
Applied Energy Research Group, Technology Campus Freyung, Deggendorf Institute of Technology, Freyung 94078, Germany
2
Institute of Spatial Planning and Rural Development, University of Natural Resources and Life Sciences, Vienna 1180, Austria
3
Instituto de Investigaciones en Energías No Convencionales (INENCO), Consejo de Investigaciones Científicas y Técnicas (CONICET), Universidad Nacional de Salta, Salta CP4400, Argentina
4
Facultad de Ciencias Exactas, Universidad Nacional de Salta, Avda, Bolivia 5150, Salta CP 4400, Argentina
5
Instituto Nacional de Tecnología Industrial (INTI), Centro Salta, Avda, Durañona 822, Salta CP 4400, Argentina
*
Author to whom correspondence should be addressed.
Energies 2016, 9(3), 133; https://doi.org/10.3390/en9030133
Submission received: 16 December 2015 / Revised: 11 February 2016 / Accepted: 16 February 2016 / Published: 26 February 2016
(This article belongs to the Special Issue Multi-Disciplinary Perspectives on Energy and Sustainable Development)

Abstract

:
Central and Northern Argentinean regions possess a high potential for the generation of solar energy. The realization of this potential is an alternative to alleviate the strong dependence on imports of fossil energy and to reduce the CO2 emissions of the country. However, the adoption of photovoltaics (PV) is still in an incipient state. It is undermined by a context of heavily subsidized electricity prices, high equipment and installation costs and a lack of information, training and experience in handling PV technology. This paper presents a techno-economical assessment of the application of the recently enacted net-metering law for promoting renewable energies (RE) in the Province of Salta (Northwest Argentina) for the case of PV. The assessment shows under which conditions and for which types of consumers it is profitable to adopt PV in the context of the law. This analysis is supported by a participatory planning approach as a study of stakeholders’ attitudes towards RE, intentions to adopt PV and their knowledge about the law. The results of this study and the economical analysis serve to provide recommendations aimed at increasing the level of PV adoption in the province.

1. Introduction

Energy systems planning processes play a fundamental role for the promotion and incorporation of renewable energies (RE) into national energy matrices and also to develop solutions for energy access at a local level. A wide variety of examples around the world—India [1], China [2] and countries from the European Union [3]—show their importance.
Nowadays, this topic plays a crucial role in Argentina since different public policies for environmental and social inclusion issues have recently been implemented, especially planning strategies, projects and laws to promote RE. The national Law 26190 to promote the use of RE sources for electric energy generation was passed in 2006. It establishes as an objective a coverage of 8% of the national electricity demand by 2016 through RE sources. The law introduces feed in tariffs for wind, biomass, small scale hydro, tidal, geothermal and solar power for a period of 15 years [4]. However, at the end of 2014, RE represent only 1% of the total electricity supply and 1.7% of the installed generation capacity. While wind contributed 265 MW, and biomass 1.150 MW, only 1 MW was provided by PV [5]. The poor results motivated a new law enacted in September 2015. It is the national Law 27191, which provides financial arrangements and establishes new RE penetration goals. The 8% objective for national electricity demand coming from RE should now be achieved by 2017, but there is also a new mid-term objective of 25% RE penetration by 2025 [6]. Furthermore, several provinces of the country decided to take their own measures and enacted their own laws for promoting RE.
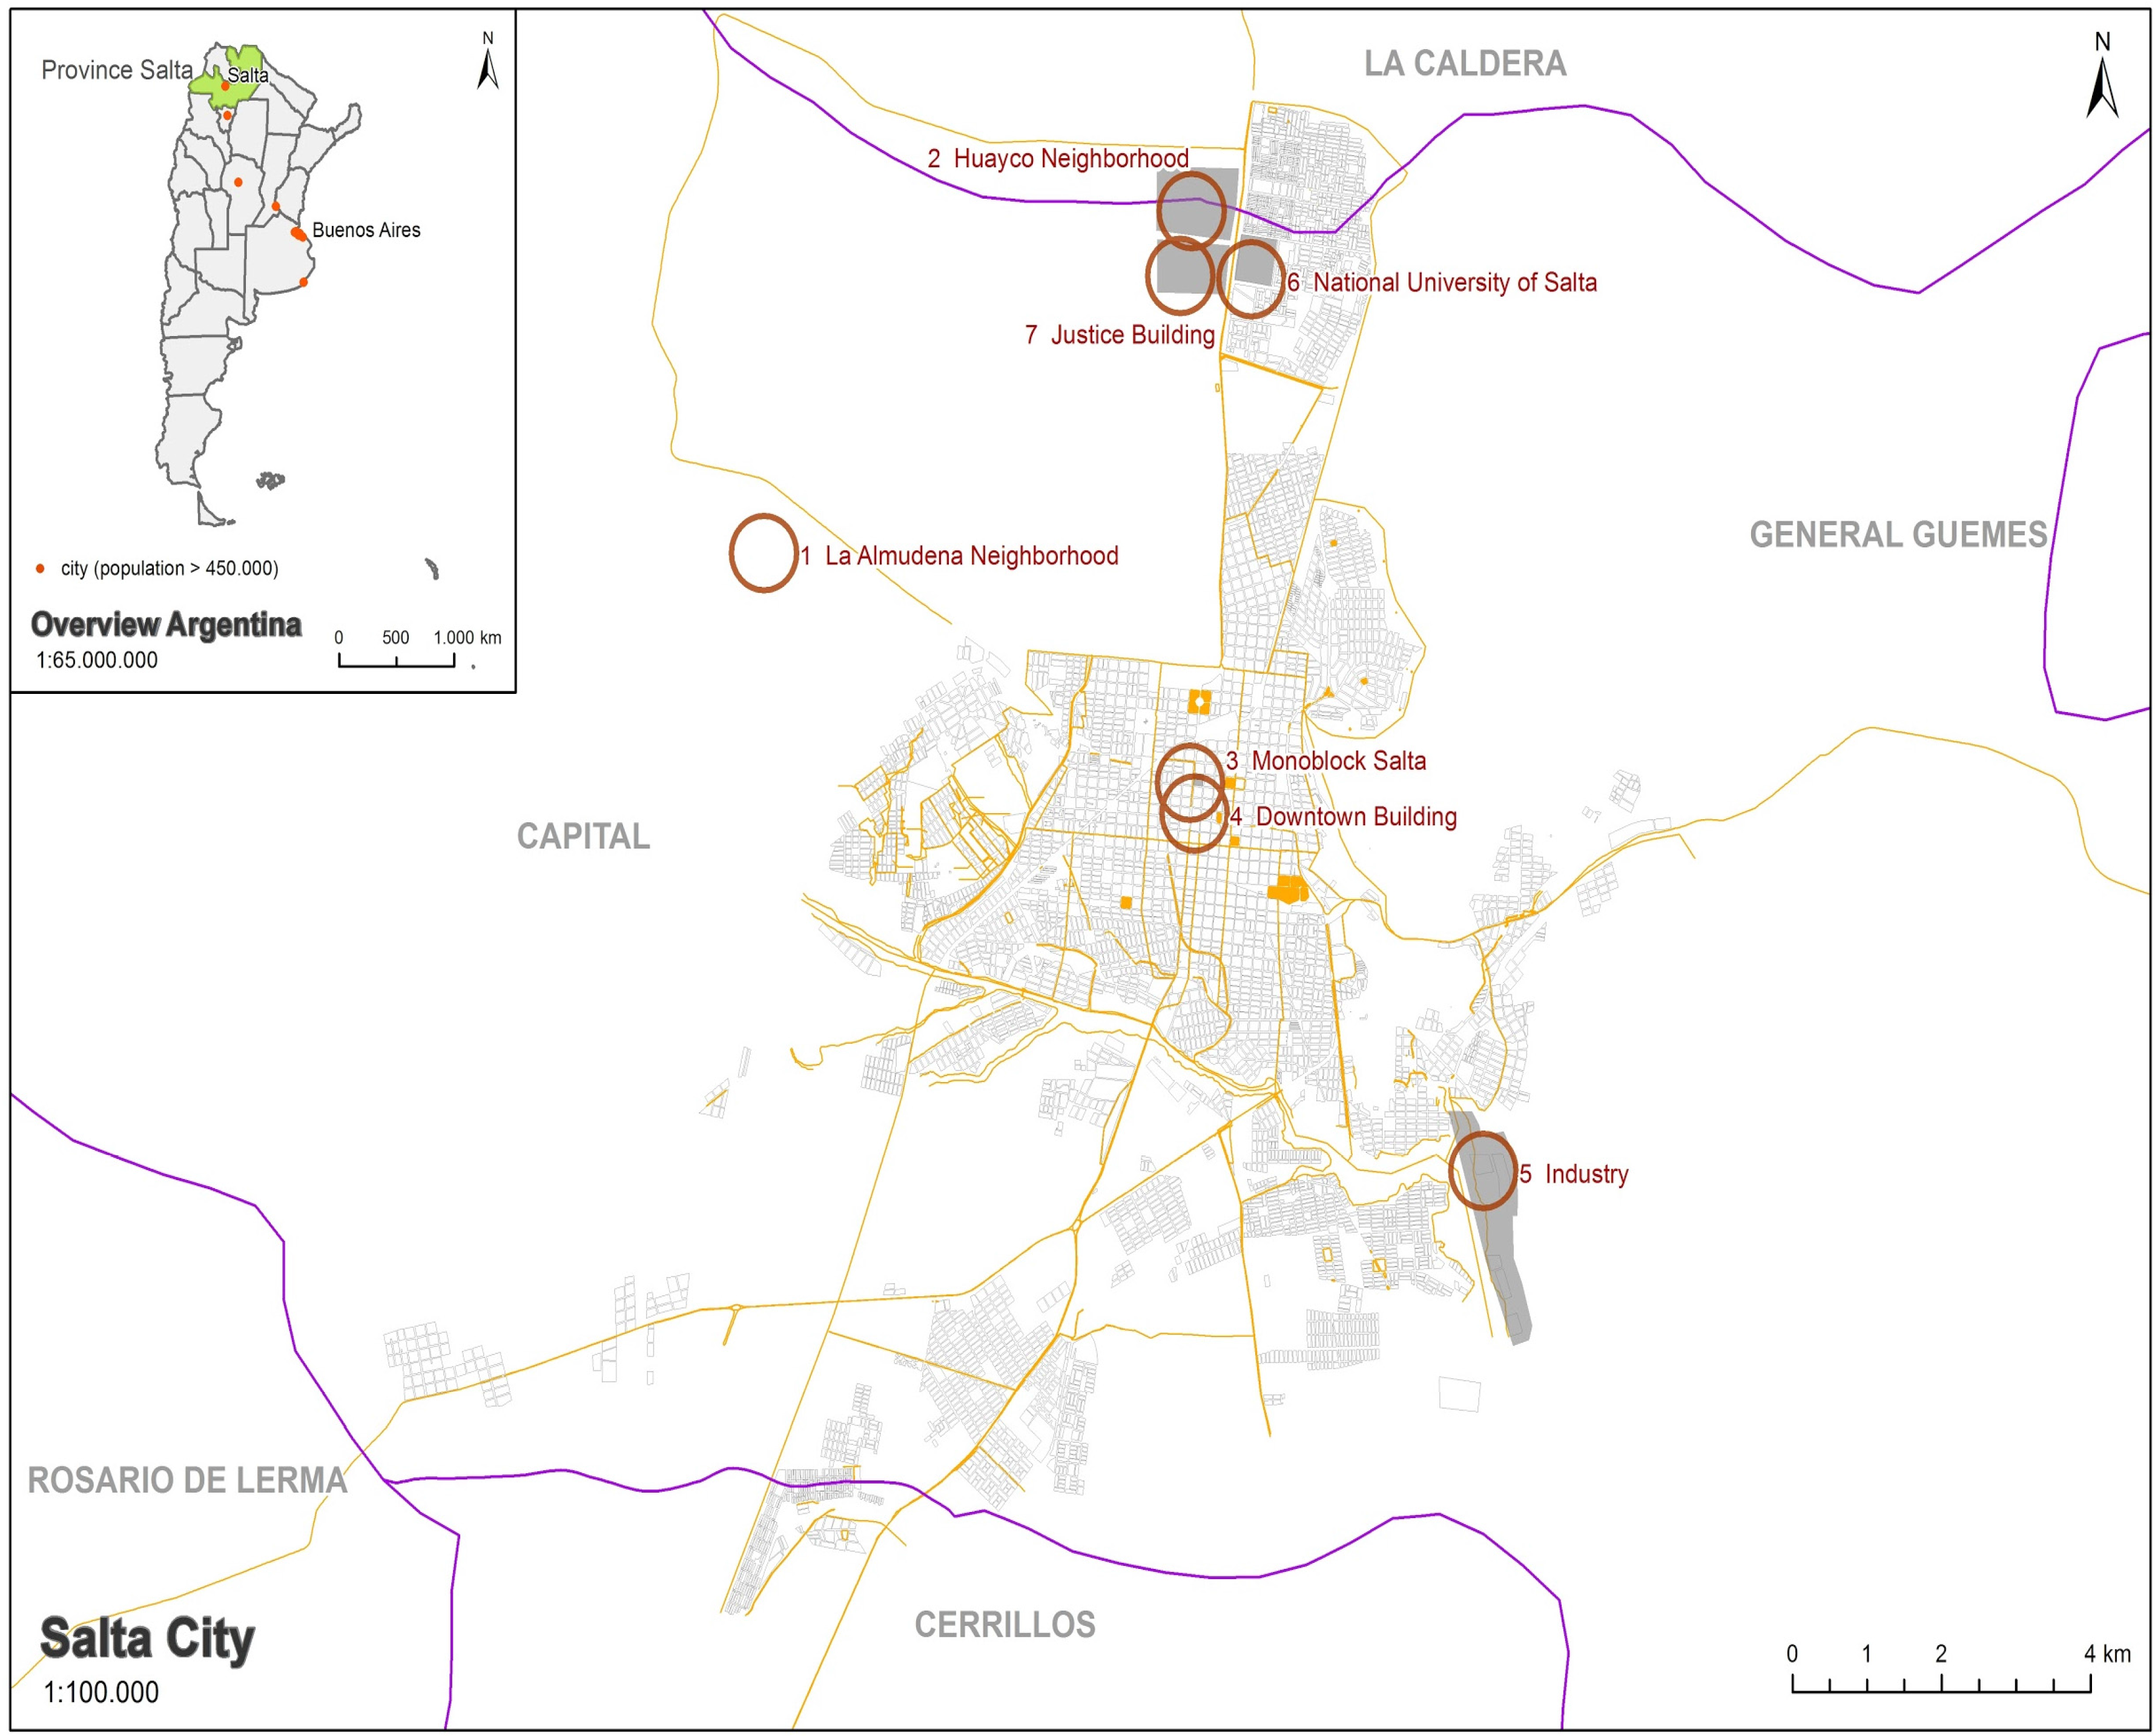
In this paper, a technical, economical and social assessment of the photovoltaics (PV) energy supply potential for the Province of Salta in the frame of a net-metering law is presented. The province is located in the northwest of the country and has a high potential for energetic exploitation, principally of solar and biomass resources [7]. The strategy that has been followed by this province includes a RE plan, a law for RE promotion and a net-metering law. The objective of the present study is to analyze the PV potentials and provide recommendations to activate this potential, while considering technical, economical and social constraints, derived from a participatory process.
The paper is structured as follows: First, the rest of the Introduction Section is dedicated to the explanation of the RE promotion framework in the Province of Salta and to the state of the art of PV potential evaluation. Second, the methodology for the participatory consultation, and the PV technical and economical assessment is explained. Third, the results are presented and discussed. Fourth, in the final section, conclusions are drawn and recommendations are given.

1.1. Renewable Energy Promotion Framework in the Province of Salta

In the Province of Salta, a planning process was set up to promote and encourage the use of RE sources. This process began in 2011, lead by the secretary of energy of the province and with the participation of various public and private institutions [8]. The first result of this process was a RE plan for the province that appeared in 2014. This plan seeks to promote the generation and use of RE to meet the energy requirements of the inhabitants of the province, diversify the energy matrix and improve industrial competitiveness and quality of life [7]. One of the initial objectives of the plan was to establish a reliable framework to strengthen public and private investment to adopt clean energy sources. Two laws were enacted in this context: law No. 7823—“Régimen de Fomento para las Energías Renovables” (Promotion scheme for Renewable Energies) and law No. 7824 “Balance Neto. Generadores residenciales, Industriales y productivos” (Net metering. Residential and industrial electricity generators). Both laws were enacted in 2014 and their corresponding regulations were completed in February 2015.
The law No. 7823 promotes the use, production, research, development and sustainable use of RE. The government gives different benefits to natural or legal persons who develop, manufacture and/or install technologies for harnessing RE. The most important include: (1) exemption from provincial taxes (up to 100% for a 10 year period); (2) tax credits for up to 70% of the value of the investment in equipment, with five years of grace and without interest; and (3) the provincial government assists to obtain credits and helps with technological, economic, financial and administrative aspects.
The net-metering law addresses residential and industrial electricity generators with the intention of motivating the installation of RE generation plants. The notion of “Net Balance”, in the legislation of the Province of Salta, refers to the difference between the amount of electricity consumed from the grid and the amount of generated RE energy that is fed into the grid by a certain user during a certain period of time. The law promotes the installation of RE electric generators in private homes, businesses and industries (installation of up to 30 kWp for residential users and up to 100 kWp for businesses and industries). All electricity generated beyond own needs and fed into the grid is bought by the local electricity company at a differential rate. This rate varies depending on the RE source and is in general higher than the current energy final price for consumers. The highest of the rates is the one paid for energy produced with PV, which is currently around ten times higher than the final price paid for electricity by average users. Users wishing to access the net-metering mode must have the installation with all technical requirements and allow for supervision by the energy distribution company. The obligation of the users includes the payment of an initial connection fee and yearly inspection fee. The law contemplates as additional promotion measure that all energy generated by the user will be bought at the differential rate for the first two years. The users continue paying the usual energy price for every kWh that they are receiving from the grid. It is only from the third year that the net balance is adopted.

1.2. State of the Art of Photovoltaic Potential Evaluation

The evaluation of PV potential usually follows a top-down approach in which the theoretical, the technical and the economic PV potential are estimated consecutively [9]. The theoretical potential concerns the evaluation of solar radiation availability. The technical potential is a fraction of the theoretical one and incorporates the consideration of energy transformation efficiency of the PV-panels, inverters and further components of the installation. The economic potential is based on “soft” factors which may change over time [10]. This presents the amount of energy that can be generated by PV-installations under the current or expected local costs structure, legislation and the public acceptance of the technology [9].
In situ measurements of solar radiation, satellite data, GIS-based procedures, reanalysis data or a combination of these are common data sources to estimate the theoretical and technical PV energy generation potential. The use of a data source depends on the study area. In situ measurements are considered the most accurate sources and normally serve to validate the other alternatives [11]. However, their availability is limited and their access is restricted. Even European weather station networks, recording solar radiation data, are not dense enough in order to provide proper coverage [12,13] and data sets are not necessarily freely accessible for the broad public. On the other hand, global solar radiation and temperature data derived from satellite images are available for most part of the world in temporal resolutions higher than hours, at no cost in many cases, but their accuracy depends strongly on the algorithms used to deal with cloud coverage and to derive the variables of interest from the sensors. Algorithms such as the Heliosat in its different versions [14] and the one used by the Land Surface Analysis Satellite Application Facility (LSA-SAF) have been validated in multiple locations [15,16,17,18,19] but there are accuracy problems in mountainous regions [20,21]. Reanalysis data sets provide global coverage and there are several freely available data sources (see, e.g., [22]), but these have relatively low spatial and temporal resolutions compared to data derived from satellite images. Moreover, solar radiation models integrated in GIS tools have been widely used to estimate solar radiation and PV technical potential in areas with complicated topography and in urban environments [23,24,25,26]. These rely, however, on other atmospheric variables that must be retrieved from in situ measurements, satellite images and/or reanalysis data. Examples of methodologies combining different sources have been proposed for the whole world [27], Europe [28], for several detailed studies of cities and municipalities (e.g., [29,30,31]), and for comparing different types of technologies and incentive programs for PV (e.g., [32,33,34]).
The calculation of PV technical potential varies widely in scientific literature. On the one hand, there are studies where the PV yield is calculated by merely multiplying the total solar energy cumulated in a surface in a year by a certain efficiency factor (see, e.g., [35]). On the other hand, there are cases where the yield is calculated in high temporal resolution, considering effects of shadowing, ambient and roof-top temperature (see, e.g., [36,37,38]).
Economic PV potential is assessed taking into consideration in-time-changing factors that are decisive for the realization of projects and the adoption of PV. Regulatory mechanisms as feed in tariffs and net-metering laws as well as the local cost structure (installation, capital and electricity costs) are quantitative factors that are usually used for the economic PV potential evaluation [39]. An attractive economic potential based on these factors is necessary, but does not guarantee the market success of PV [40]. Diffusion and acceptance barriers perceived by potential PV investors must be also identified and overcome. Participatory processes constitute a widely applied strategy to identify these barriers and propose alternatives to overturn them [41,42,43,44].
Concerning only the quantitative factors of the economic potential, existing literature relies either on cost-related or on investment attractiveness figures [45]. The levelized cost of electricity (LCOE) is the widest used cost-related indicator, but is also target of strong criticism [46]. LCOE serves to compare the costs of different energy sources while correcting differences in the operation and investment time horizons. This requires, however, assumptions about discount rates, which are difficult to make in context of high uncertainty [47]. Typically, investment attractiveness figures for PV are payback periods, net present value (NPV) and internal rate of return (IRR). NPV allows an intuitive assessment of individual projects, but has the same drawback as LCOE, since it depends strongly on the applied discount rates. The other two indicators do not require assumptions about discount rates, but still have their own limitations. Payback periods tend to overestimate future returns, because they do not incorporate the time value of money. IRR does consider the time value of money, but is not an appropriate indicator, when evaluating projects with different time horizons and scales [45].

2. Methodology

The methodology is divided into four subsequent stages (see Figure 1). First, a participatory consultation is conducted with a wide range of stakeholders from the Province of Salta, Argentina. This is analyzed and serves as an input for the further stages. Second, a series of case studies to assess the application of the law are defined. These correspond to different types of consumers (households, business, industry and institutions connected to the grid) and levels of electricity consumption. Third, the technical potential for PV installations in the locations of the case studies is calculated. Solar global radiation and temperature time series are retrieved from the ECMWF era-interim reanalysis model data. These serve as input for a PV energy generation model that delivers hourly energy generation data. This output is cumulated to monthly data to match the temporal resolution of the demand data. Fourth, an economical assessment for every case study is performed.

2.1. Participatory Consultation

The planning process for RE in the province was defined from the beginning as dynamic [7]. In this context, it was decided to conduct a participatory consultation with an inclusive and constructive approach to local users and/or institutions of the energy sector [48]. Two reflection and consultation activities were designed: a population survey online and an inter-agency workshop.

2.1.1. Survey: Renewable Energy in Salta

The aim of the survey was to collect information about the knowledge of the population of the City of Salta regarding the RE plan and new RE laws. Additionally, the intention behind it is to analyze the possibility of improving the integration of the RE at the local level.
The survey was divided into five sections with brief introductory explanations:
  • General knowledge of RE plan and laws.
  • Knowledge of RE sources, and technologies and opinion about the possibility of promoting them in Salta.
  • Promotion of RE in Salta. Key to achieving greater promotion and main restrictive aspects.
  • Applicability of the net-metering law: General interest. Reasons to promote or reject an RE project at home or own business.
  • General personal data: localization, educational level, occupation, age, and gender.
To achieve a wide dissemination, the survey was developed in an online platform [49]. It was distributed from the institutional email and Facebook page. The survey was available for 30 days (July 2015).

2.1.2. Workshop: Contributions to Promote Renewable Energies in Salta: Actions, Projects and Proposals

The meeting was held in September 2015 in Salta City. The objective of this workshop was to ponder the implementation of actions to promote RE in the province, and to provide recommendations to promote RE in the local context. The intention was also to motivate deliberation and discussion by presenting to the participants the German case, a country that is considered in the international context as a leader in the global transition to a renewable energy future [50].
The workshop was structured in two parts: a discussion board of experts and a discussion in working groups. On the first one, experts presented an overview of the advances done on implementing the Renewable Energy Plan and law promotion in Province of Salta, effects and status report of implementing RE laws in Germany, and the findings of the survey Renewable Energy in Salta. Presentations were lead by members from the Secretary of Energy of the Province Salta, the Deggendorf Institute of Technology and the Energy Planning and Land Management Group of the Argentinian Institute for non-conventional Energy Research (INENCO).
The second stage, group work, was held based on the progress and findings exposed by the board and the own personal and institutional experiences. The discussion was centered on analyzing the potential, limitations and promotion in the current local context of RE and to propose actions to promote a wider application of RE in Salta.

2.2. Definition of Case Studies

The financial feasibility assessment of PV in the context of the net-metering law requires information beyond the mere expected output of a certain PV installation. Although the rates that are paid for electric energy fed into the grid by PV power plants is the same for all types of users, the expected income and savings (due to self-consumption) depend on the amount of demanded energy and the tariff that every user has to pay for it. The energy supply company of the province classifies its clients into eight different tariff classes. These are sub-divided depending on contracted energy capacity, total monthly demand and voltage that is necessary to comply with the requirements of the client. The types of users range from small demands with contracted energy capacity below 10 kW (for residential purposes and small businesses) and high demands that require supply directly from the high voltage grid (for industrial purposes). Only based on the classification of the local utility, there are in total 22 different consumer types. Taking into consideration that between users of a certain demand class could also give significant differences in their electric consumption profiles, it is expected that there are actually hundreds of consumer types, which could be considered.
To represent the diversity of consumer types, a case study approach is adopted. A survey of the energy consumption profiles of the population of the province and its clustering in consumer typologies is beyond the scope of this study. However, electric energy consumption data from 122 clients were provided by the local energy supply company. These are concentrated in the City of Salta in seven different locations (see Figure 2). The data include five years of monthly demand for electric energy from 10 single family houses, 105 apartments from two different buildings, five commercial businesses and industries of the industrial park of the city, the largest university of the province and the justice building of the province. The five years of data are summarized in one average energy consumption year time series with monthly temporal resolution for each user. The maximum consumption in a certain month is used to match each single-family house, commercial and industrial user to one of the 22 consumption classes of the local energy supply company. In cases that more than one of these users falls into one of the classes, a synthetic consumption profile was generated by averaging the monthly consumption of all users in the same class. In the cases of apartment buildings, the demand data were available for all apartments. This allows evaluating the adoption of PV for the whole building and also for one average apartment in it. The university and the justice building could serve as a benchmark for further public administration buildings and therefore are considered individually. At the end of this classification, 14 case studies remain. These are used for the technical and economical assessments and are presented in Table A1.

2.3. Technical Assessment

A top-down approach is used for calculating the technical PV potential. First, the average solar radiation in an hourly time-step basis for a year for the locations of the case studies is determined (the theoretical PV potential). Second, the solar radiation and temperature data are used as input for a PV model to calculate hourly energy yield for every location (technical potential) assuming installation size of one kWp.
The scarcity of ground measured solar radiation data in Argentina is a well known problem that obligates users to rely in other data sources [51,52]. To alleviate this, a plan to install 40 new stations able to precisely measure direct and diffuse radiation was launched in 2012 [53]. However, the net is still under construction [54] and some time will be necessary until these data become usable. To compensate the scarcity of data for the locations of the case studies, data from the ERA-Interim atmospheric reanalysis provided by European Centre for Medium-Range Weather Forecasts (ECMWF) were used. Ramirez Camargo et al. [55] validate the Surface Solar Radiation Downwards (SSRD) of this data set (equivalent to global solar radiation) for the City of Salta and compare it to data obtained with statistical procedures and from satellite imagery. These authors stated that the hourly SSRD data present only a slightly worse fit to the ground measured data compared to data obtained from processing satellite imagery and suggest to use SSRD for studies wanting to have a conservative estimation of PV potential. Although SSRD data are available from 1989 to the present [56], only data for 2013 and 2014 are downloaded. This simplifies the data processing effort without compromising the quality of the analysis. Following the conclusions of [57], two years of radiation data should suffice to represent average solar radiation patterns in the Argentinean Northwest, where the case studies are located. The SSRD data are available in three hours’ time steps and accounts for the amount of energy on the surface in J·m−2 that has been accumulated from the beginning of every day. The resampling and interpolation procedure to obtain hourly instantaneous solar radiation from the SSRD data proposed by [55] is also applied.
The instantaneous PV power output is calculated following the set of equations proposed by [36] in the adapted version adopted by [38]. This equation also requires, apart from the global irradiance, the panel efficiency, a temperature correction factor, an efficiency reduction factor due to installation type, the area of the plant, the nominal operating temperature of the PV modules and the ambient temperature. Only location dependent parameters, i.e., solar radiation and temperature cannot be retrieved from technical documentation of PV panels or literature. Analogically to the procedure for getting the solar radiation data, the temperature at two meters above the ground for the same period of time is retrieved from the ERA-Interim [56]. These are provided in three hours’ time steps and require resampling and a linear interpolation to obtain hourly values. The PV technical parameters are presented in Table A2. The panel efficiency was stated by the local vendors as the minimum achieved by the panels. Further parameters presented in Table A2 are taken from [58]. The hourly yield for 2013 and 2014 is calculated assuming that the instantaneous output remains constant every hour (i.e., solar irradiance and temperature do not change during a time step), installation size of one kWp and additional inverter and cable losses. Average monthly PV output for one year is calculated from the two years of results in order to match the temporal resolution of the electricity demand data.

2.4. Economic Assessment

The economic assessment includes cost-related and investment figures. LCOE is estimated to be compared with the current price of energy and the differential rate that is paid for energy generated by PV installations in the frame of the net-metering law. Expected income and savings (due to self-consumption), NPV and IRR are calculated to evaluate the economical feasibility of installing PV for each of the case studies. All calculations related to monetary values are performed in US dollar (USD) assuming an exchange rate of 9.728 Argentinian pesos (ARS) per USD, which is the official exchange rate at the end of November 2015. Furthermore, inflation is not considered in any of the indicators.
The LCOE is calculated following Equation (1) [59], and NPV is calculated following Equation (2) [60]. The IRR provides the discount rate at which NPV is equal to zero and therefore it is calculated by solving Equation (2) for the discount rate equal to the IRR and NPV equal to 0 [60].
LCOE = t = 1 n E x p e n d i t u r e s t ( 1 + i ) t t = 1 n E l e c t r i c i t y   g e n e r a t e d t ( 1 + i ) t   U S D M W h
where LCOE is the levelized cost of electricity generation, n is the lifetime t is the year, and i is the discount rate.
NPV = t = 1 n C F t ( 1 + i ) t   [ USD ]
where C F t is the cash flow in the corresponding year.
While the parameters electricity generated and lifetime can be defined straightforwardly, the expenditures and the discount rate require special attention in a context as the Argentinian one. The Electricity generated in time step t for all t is the sum for a year of the calculated technical PV potential corrected by a PV module degradation rate. The assumed lifetime is 25 years, and, as reported by the International energy agency [61], modules are usually guaranteed for this period of time at a minimum 80% of their rated output. The commonly used PV module degradation rate of 0.5% per year [62] is adopted also here. The expenditures correspond to the total cost of the PV plant and the yearly costs, which include operation, maintenance and a certain rate necessary to cover the cost of the inverter replacement every 10 years. Additionally, the connection (once in the lifetime of the installation) and supervision costs charged by the local utility must be also included. Currently these are 68 and 34 USD, respectively [63]. The yearly costs for operation, maintenance and inverter replacement are assumed to be 1% of the cost of the plant [62]. To determine average local total installation costs is not trivial since the Argentinian PV market is incipient and vendors are concentrated in Buenos Aires (Capital of the country located 1600 km away from Salta City). There is no industry able to produce PV cells in the country, there are only two companies that import cells to assembly panels locally, and foreign industrial products have to deal with high import taxes. From nearly a dozen of vendors and installers (including importers of PV panels manufactured in Spain and China) that were found in the country, only three provide enough information to estimate the total cost of small-scale PV-installation. The costs in USD for a 5 kWp installation including value-added taxes (10.5% for the panels and 21% for the rest of the components) are presented in Table A3. The LCOE is calculated for the different prices provided by the vendors and for an installation that costs 2800 USD/kWp. The last one is the international total average cost for residential PV systems in 2014 [64].
Establishing an appropriate discount rate is challenging since the Argentinian economy is characterized by high uncertainty [65]. A commonly used measurement for the discount rate is the weighted average cost of capital (WACC). The WACC is typically between 6% and 12% for RE projects in OECD countries and can be between 15% and 20% for projects in Africa, where a higher risk is perceived [64]. To provide an appropriate picture of the situation the calculations of financial figures depending on a discount rate (LCOE and NPV), a sensitivity analysis where WACC is varied from 0% to 20% is included.
Concerning the investment figures, the cash flows for every year during the lifetime of the PV installation are calculated as follows: First, the expenditures are calculated in the same way as it is done for the LCOE. Second, the monthly income and savings (due to self-consumption) are estimated using the net-metering tariff (0.214 USD), the current tariffs of the local utility and its corresponding subsidies (see Table A4) and the monthly consumption profiles of the case studies. Due to the lack of hourly information for the demand, some assumptions are needed. For residential case studies, 50% self-consumption rate is selected. For non-residential case studies, the monthly demand data are provided in three different demand periods. There are data for consumption in peak (6:00 p.m.–11:00 p.m.), mid-peak (11:00 p.m.–5:00 a.m.) and off-peak (5:00 a.m.–6:00 p.m.) demand periods. The best temporal match between PV energy generation and demand is given for the off-peak periods; therefore, the total amount of energy demanded during these periods is the basis for calculating savings and income.
A sensitivity analysis for income, savings, NPV and IRR figures is provided by varying total cost and sizes of the PV installation. The considered prices are the ones of the three local providers, proportionally adapted for other system sizes. The considered system sizes range from 1 kWp to 30 kWp for residential users and from 1 to 100 kWp for non-residential users. The values of 30 kWp and 100 kWp are the installation size limits established by the net-metering law to be able to participate in the incentive program for small and large electric energy consumers, respectively.

3. Results

The results are presented in the three thematic areas proposed in the methodology, social perception, technical potential and economic assessment.

3.1. Social Perceptions

3.1.1. Survey

It was possible to learn about the vision of the population in regard to RE regulations with the survey and to explore its current potential locally. In total, 324 surveys were sent and 163 were answered (response rate 50%). The socio-demographic structure of respondents was quite homogenous. The age of respondents was between 15–75 years, 66% were under 44 years old, 100% have at least high school degree, and 59% have technical/bachelor/tertiary studies.
There is a low knowledge of the RE plan and the current regulations as results from the survey showed (see Figure 3).
However, RE technologies are recognized, particularly solar energy equipment (solar PV panels 90%, cookers and water heaters 85%) and wind energy (80%). Eighty percent of the responders considered that applications of solar energy should be promoted in Salta, and 55% thought the same about biomass. In addition, 93% of people surveyed confirmed the importance of promoting RE in Salta and the remaining 7% said they do not know/no answer (i.e., no negative response was recorded). Among the named reasons to encourage RE are:
  • Environmental protection and sustainability using RE as clean energies.
  • Climate change mitigation.
  • Diversification of the energy matrix.
  • Independence of fossil fuels and energy resources imports.
  • Technological and regional development.
  • Use of local natural resources.
  • Access to energy in isolated places.
  • Improving the quality of life.
With regard to the implementation of the provincial law, the following key aspects were highlighted:
  • Dissemination, information, and awareness.
  • Economic incentives, such as tax breaks, subsidies, investments, receivables, and other benefits as well as public policies,
  • Political interest, management support, guarantees continuity applications in rural education, industry and electrical infrastructure matrix,
  • Other issues including education (different levels), research, technological development, and environmental issues.
Finally, there was strong interest in installing PV solar panels or another RE system to generate electricity (Figure 4). The main reasons for this interest are: economical (reduction of electrical power costs, reduction of equipment costs, and the ability to access an income from surplus energy generated), ‘’friendly’’ technologies for the environment, better use of urban space, saving conventional energy sources, and clean energy diffusion. Among the reasons that ‘’would cast doubts and reject the possibility of installing a RE system at a household’’ were: (1) technical aspects (amount of energy, efficiency, safety, installation, and maintenance); (2) budget (installation and maintenance costs, repayment, and investment recovery); and (3) discontinuity of policies and distrust of government. The reasons were highlighted in order of importance.

3.1.2. Workshop

The workshop constituted a space for dialogue, reflection and collective construction of knowledge and proposals. In total, 47 people attended the workshop, among them representatives of various government agencies (Departments of Government, Science and Technology, and Universities) and private organizations (Companies and NGOs).
First, presentations to contextualize the current situation regarding the implementation of the RE plan and laws in Salta were introduced, as well as the path taken by Germany in the energy sector. After that, the results of the general survey were presented as triggers to introduce the discussion.
Second, people were gathered together in groups in order to discuss the current local RE situation. The agreements built on each work-group helped to identify some keys to improve the integration of RE locally. All in all, the demand for a multidimensional and integrated approach in the energy thematic was emphasized. Environmental, economic, socio-cultural and technical issues are intrinsically related and therefore also require comprehensive and complementary responses.
Among the identified potential for the promotion of RE are: the existence of a provincial plan and specific laws, the availability of renewable resources and technologies, and also the potential for interaction between multiple actors already involved. On the other hand, the limitation issues that were determined are: lack of knowledge and diffusion, low profitability, restrictions on the concerned sectors, low confidence in government policies and also lack of local production capabilities and counseling.
The proposed actions were aimed at ensuring a coordinated interagency work, the realization of economic incentives and the promotion of new technologies and existing regulations. The proposed actions are presented in the Table 1.
A strong interest in the topic and a stated commitment from the institutions to join in inclusive and collaborative works were featured as the result of the general conclusions. Interagency and intersectoral linkages were raised as a tangible result of the workshop. The possibility of initiating concrete actions in education and dissemination of RE from all areas was prioritized.
Finally, the development of a technical and economic assessment of the PV energy supply potential for the city was found to be necessary and useful to measure the scope and the feasibility of the new net-metering law.

3.2. Technical Potential

Despite the conservative assumptions for the calculation of the PV potential, the PV yield per kWp for the locations of the case studies is very high. The total solar energy on a horizontal surface for most of the locations achieves 1884 kWh/(m2 a). The results for all locations vary only slightly (<1%) and are equal for most of the cases since the locations are relatively close to each other and the resolution of the ECMWF data is relatively low (with a pixel size of 11 km × 11 km). The yearly yield per kWp for a horizontal installed PV is around 1709 kWh. This is even higher than the PV yield reported by [62] for optimally mounted installations in South Spain or in North Africa (up to 1600 kWh/(kWp a)). The radiation and PV yield values are also far beyond the average of 1055 kWh/(m2 a) and 1000 kWh/(kWp a) that can be obtained in Germany [62]. These differences could be even higher considering that the used solar radiation data set is the one with the most conservative values compared to other sources for the same location [55]. Furthermore, the potential energy generation does not correspond to that of an optimally installed PV system (one expects that optimally installed PV systems can generate even more energy per year), and the module output degradation rate appears pessimistic when compared to empirical studies showing degradation rates around 0.1% per year [62].
The monthly solar radiation per square meter and PV yield per kWp, which are presented in Figure 5, represent well the expected output considering the typical local climatic conditions. The differences are the largest during the summer (November–February), and both solar radiation and PV yield are lower in January and February than in November and December due to the rainy season. These PV yield values per kWp are used for the economical assessment.

3.3. Economic Assessment

The LCOE based on cost information provided by the three local vendors contrasts with the LCOE calculated for the average international price (See Figure 6) and with the average LCOE calculated by [46] for a location with such a high generation potential per kWp installed capacity (considering a WACC of 6%). The difference between the LCOE for the three local vendors and the international averages is almost 0.1 USD for low WACCs and increases up to 0.41 for high WACCs and the highest total costs. This is an indicator that the high energy generation potential is overcompensated by the local cost structure for PV. In fact, the lowest of the total costs provided by the Argentinian vendors is already two times higher than the international average and it is higher than the highest international average cost when comparing it against data provided by [64].
The LCOE is only lower than the differential tariff defined by the net-metering law in a few cases and is several times higher than the final price for electricity paid by the users. The cases where the LCOE is lower than the differential tariff are the cases where the average international installation costs are being assumed, and this situation applies only for WACCs ranging from 0% to 9%. Further values of LCOE below the differential tariff are given only for the lowest of the local installation costs and for the lowest discount rates. Furthermore, low energy prices and additional subsidies for the final consumers create a relation of 1:5 between the LCOE with 0 discount rate and the final utility price for energy, when considering the lowest residential prices. The best relation is 1:3.5 for the highest final energy prices paid by the industry. These relations deteriorate rapidly when increasing the discount rate. They change to 1:10 and 1:7 for a WACC of 10% and continue increasing to 1:17 and 1:11 when assuming a discount rate of 20%.
The low final energy prices also have a strong repercussion on the income obtained by selling energy at the differential rate, as well as in the savings due to self-consumption expected from installing a certain PV system. For the residential case studies, income and savings are decoupled after a system size of 4 kWp (see Figure 7). This can be explained due to the relatively low demand of the residential case studies and it would be favorable to increase the total income generated by a PV system of a certain system size. For most of the case studies presented the income generated by selling energy to the grid is four times higher than the savings achieved due to self-consumption per kWh. This occurs despite of the differential tariff defined by the net-metering law being comparable to the feed-in tariff for energy from PV systems in Germany in 2013 [61]. In the European country, however, the feed in tariff has been sequentially decreased to reflect the total cost drop for PV systems, which already in 2013 were one of the lowest in the world [61]. For non-residential case studies, the decoupling requires much larger system sizes and, for some of these cases, the 100 kWp accepted in the net-metering law are not enough to cover the off-peak energy demand (see Figure 8). This situation leads to cases in which the income for the energy fed into the grid is lower than the savings as well as to cases where the total income is much lower than in the residential case studies.
NPV is presented in Figure 9 for residential case studies and it is consistent with the previous indicators. Positive NPV (colored green) can be found only for small-scale consumers, at low discount rates and mostly for relatively large PV system sizes. At international PV systems costs, there is a wide range of combinations between system size and discount rate that deliver a positive NPV. Furthermore, for the lowest of the local PV system costs (PV1), there are at least four combinations of WACC and PV system size that produce a positive NPV. The situation is more disadvantageous for non-residential case studies. In these case studies, only few combinations of discount rate and system sizes at the international average total PV system cost generate a positive NPV. Due to the low reward for self-consumption, PV installation would be almost unalterably an unattractive investment for non-residential users.
The IRR confirms the situation presented with the NPV. The best IRRs are obtained for the residential case with the lowest demand (Residential a), lowest total PV installation costs and largest system sizes. The calculated IRRs for all case studies and considered system sizes show positive values that are as high as 13% when considering international average total PV installation costs. There are only few cases where the IRR is above zero when considering the prices of local PV system vendors and the IRR deteriorates rapidly with increasing energy demand. An example of this trend is presented in Figure 10. For the lowest residential demand it is possible to achieve positive IRRs when considering the lowest of the total PV installations costs. For the highest residential demand (Residential e), assuming local costs, a positive IRR can only be obtained with the lowest installation costs and the maximum allowed system size. For the non-residential case studies, there is not a single combination of local costs and systems sizes that generates a positive IRR.

4. Conclusions and Outlook

The province of Salta has launched one of the first frameworks for promoting RE in Argentina. One of the keystones of this framework is law No. 7824, which introduces the net-metering concept and allows the installation of PV power plants for households and enterprises under favorable conditions. The intention of this regulation is to enable the integration of distributed grid-connected small scale RE in the province. As the participatory consultation has shown, the idea of increasing the share of RE in the energy matrix is not only supported by the policy makers but also by the population. However, only 25% of the surveyed population knew about the RE plan, only 5% knew about the net-metering law and there were several questions and doubts about the technical and economical feasibility of RE generation projects.
Assessments intended to dissipate major concerns about technical and economical feasibility of PV energy generation projects have been conducted. These reveal that the theoretical and technical PV generation potentials per·m2 and kWp installed capacity are very high. Nevertheless, the local total costs of installing PV systems are two times the international average. This deteriorates financial figures for the conducted case studies. When considering the local costs, only relatively large PV systems for households with low energy demand present positive results, in terms of investment possibilities. It has also been shown that the differential tariff defined by the net-metering law is barely able to cover the LCOE for PV installations at the lowest local price and with discount rates up to 1%. When looking at the same figures and comparing them to international PV installation prices, it becomes evident that if measures are taken to decrease the local total PV system costs there is a considerable potential for improving the financial attractiveness of projects and decreasing the LCOE. Given the high technical energy generation potential it can be argued that bringing total PV system costs closer to the international average and providing secure financial conditions, will make investments in PV systems feasible for most types of consumers.
Another motive that makes investment in PV systems unattractive in the area is the final electricity price for consumers. There is no incentive for solar energy self-consumption given the low energy prices and the additional subsidies. Any increment in final electricity prices will improve investment indicators. Increments in the electricity prices are expected for 2016. This responds to a change in political and economical policies that Argentina will adopt following recent elections [66]. Notwithstanding, an alternative strategy to make investments in PV systems more attractive would be to extend the period when users adopting net-metering mode receive the differential rate for every produced kWh (it is currently two years). This will still not motivate self-consumption but it would be less unwelcome by the population than incrementing the final energy prices. Such a measure can also have a large impact in the cash flow of the projects and therefore in the final attractiveness indicators.
It is expected that the results presented in this study are adequate for most part of the province and in the case that punctual technical assessments are required, the introduced methodology is suitable for researching locations in the whole province. This is supported in the following facts: First, electricity final prices are the same for the whole province and the variety of case studies presented covers most of existent tariffs. Second, total installation costs and technical electricity generation potential will not vary significantly for locations connected to the grid. Populations living in the mountains, where solar radiation, temperature and installation costs can drastically change, are normally not connected to the grid and therefore cannot adopt the net-metering mode. Third, the ECMWF data used for determining the PV energy generation potential have global coverage.
Finally, it is important to note that there is a positive outlook on the situation regarding RE in the province of Salta. Important steps forward can be taken by disseminating the framework that has been conceived to promote RE among the population of the province. There are viable alternatives for making financial investments in solar energy more attractive. The Total PV system costs, the major limiting factor, have a large potential to be reduced. There are also additional promotion mechanisms that have not been studied here, such as tax credits for up to 70% of the investment in equipment, established by the law No. 7823, which can certainly improve cash flows and therefore the investment figures.

Acknowledgments

The study was mainly conducted as part of the project “Regional Energy Planning with Renewable Energy Sources: Data, methodologies, models and participation processes in the Argentinian and German cases” (REP-ArGe), grant numbers 01DN14008 (Germany) and AL/13/07 (Argentina), financed by the German federal ministry of education and research (BMBF) and the Argentinian ministry of science, technology and productive innovation (MinCyt). The technical PV potential calculation was conducted in the project “Spatial Energy Manager” funded by the program “IngenieurNachwuchs” of the German federal ministry of education and research (BMBF), Germany (Grant number 03FH00712). The authors would like to thank the institutions and natural persons that participated in the survey and the workshops. Special thanks to the colleagues of the Secretaría de Energía de la Provincia de Salta and Anna Marquardt for support and valuable comments.

Author Contributions

All authors designed the research; Judith Franco, Silvina Belmonte, Karina Escalante and Nilsa Sarmiento prepared and run the survey and workshop; Luis Ramirez Camargo calculated the technical PV potential; Luis Ramirez Camargo, Judith Franco and Nilsa Sarmiento analyzed the data; Luis Ramirez Camargo, Karina Escalante, Nilsa Sarmiento and Judith Franco acquired the data for the economic assessment; Luis Ramirez Camargo and Judith Franco did the economic assessment; and Luis Ramirez Camargo, Judith Franco, Nilsa Sarmiento, Silvina Belmonte, Raphaela Pagany, and Wolfgang Dorner wrote the paper.

Conflicts of Interest

The authors declare no conflict of interest. The funding sponsors had no role in the design of the study; in the collection, analyses, or interpretation of data; in the writing of the manuscript, and in the decision to publish the results.

Abbreviations

The following abbreviations are used in this manuscript:
ARSArgentinian pesos
RERenewable Energy
PVPhotovoltaic
LSA-SAFLand Surface Analysis Satellite Application Facility
LCOELevelized Cost of Electricity
ECMWFEuropean Centre for Medium-Range Weather Forecasts
NPVNet Present Value
IRRInternal Return Rate
SSRDSurface Solar Radiation Downwards
KKelvin
J·m−2Joule per square meter
WWatt
kWhKilowatt Hour
kWpKilowatt peak
aYear
USDDollars of the United States

Appendix A

Table A1. Summary of the case studies.
Case StudyLocation (see Figure 2)DescriptionDemand (kWh·per·month)
Residential a1 La Almudena NeighborhoodSingle Family House0 ≤ 192
Residential b2 Huayco NeighborhoodSingle Family House>192 and ≤500
Residential c1 La Almudena NeighborhoodSingle Family House>500 and ≤700
Residential d1 La Almudena NeighborhoodSingle Family House>700 and ≤1400
Residential e1 La Almudena NeighborhoodSingle Family House>1400
Building a average3 Monoblock SaltaApartment>192 and ≤500
Building a total3 Monoblock SaltaApartments Building13,000 to 19,000
Building b average4 Downtown BuildingApartment>500 and ≤700
Building b total4 Downtown BuildingApartments Building8000 to 13,000
Commercial and Industry a5 Industry ParkCommercial Businesses2000 to 18,000
Commercial and Industry b5 Industry ParkProductive Industry28,000 to 59,000
Commercial and Industry c5 Industry ParkShopping Center10,500 to 198,000
University6 National University of SaltaUniversity with 6 faculties and 20,000 students103,000 to 244,000
Justice Building7 Justice BuildingBuilding that concentrates all judicial activity of the Province Salta200,000 to 380,000
Table A2. Technical parameters of the photovoltaic plants.
ParameterValueUnits
Panel efficiency15%
Temperature correction factor−0.45%/K
Reduction factor due to installation type (for roof-top PV)0.035K/(W/m2)
Inverter and cable losses14%
Table A3. Photovoltaic installation costs for a 5 kWp installation provided by three different Argentinian vendors (the prices are in USD).
ComponentPV1PV2PV3
Panels14,73717,62518,831
Inverter526384237124
Structure631642835086
Installation (labor)263130333104
Total28,94833,36434,146
Table A4. Electric energy tariffs and subsidies applied to every case study in USD. The values are taken from [63].
Case Study (Residential)Cost·per·kWhSubsidy per·kWhCase Study (non-Residential)Cost·per·kWhSubsidy per·kWh
Residential a0.07120.0299Building b total0.07240.0251
Residential b0.06570.0299Building a total0.07240.0251
Residential c0.06840.0262Commercial and Industrial a0.06490.0339
Residential d0.06730.0227Commercial and Industrial b0.05630.0252
Residential e0.07160.0153Commercial and Industrial c0.08330.0252
Building a average0.06570.0299University0.07790.0252
Building b average0.06840.0262Justice Building0.07790.0252

References

  1. Ramachandra, T.V. RIEP: Regional integrated energy plan. Renew. Sustain. Energy Rev. 2009, 13, 285–317. [Google Scholar] [CrossRef]
  2. Wang, X.; Feng, Z. Sustainable development of rural energy and its appraising system in China. Renew. Sustain. Energy Rev. 2002, 6, 395–404. [Google Scholar] [CrossRef]
  3. Hauber, J.; Ruppert-Winkel, C. Moving towards Energy Self-Sufficiency Based on Renewables: Comparative Case Studies on the Emergence of Regional Processes of Socio-Technical Change in Germany. Sustainability 2012, 4, 491–530. [Google Scholar] [CrossRef]
  4. Senado y Cámara de Diputados la Nación Argentina Ley 26190 de Diciembre 6 de 2006: Regimen de Fomento Nacional Para el uso de Fuentes Renovables de Energia Destinada a la Produccion de Energia Electrica; Boletín Oficial de la República Argentina: Buenos Aires, Argentina, 2006. (In Spanish)
  5. Secretaría de Energía—República Argentina Balance Energéticos Nacional (BEN). Available online: http://www.energia.gov.ar/contenidos/verpagina.php?idpagina=3366 (accessed on 15 December 2015).
  6. Senado y Cámara de Diputados la Nación Argentina Ley 27191 de Septiembre de 2015: Régimen de Fomento Nacional para el uso de Fuentes Renovables de Energía Destinada a la Producción de Energía Eléctrica; Modificación; Boletín Oficial de la República Argentina: Buenos Aires, Argentina, 2015. (In Spanish)
  7. Secretaría de Energía de la Provincia de Salta. Cartilla Plan Energias Renovables Salta; Gobierno de la Provincia de Salta: Salta, Argentina, 2014. (In Spanish)
  8. Binda Galindez, C.; Javi, V. Leyes No 7823 y No 7824 de promoción de las energías renovables en salta: Procesos de redacción y elaboración desde el enfoque de la comunicación intercultural. In Acta de la XXXVIII Reunión de Trabajo de la Asociación Argentina de Energías Renovables y Medio Ambiente; INENCO: Salta, Argentina, 2015; Volume 3, pp. 12.51–12.60. ISBN 978-987-29873-0-5. (In Spanish) [Google Scholar]
  9. Angelis-Dimakis, A.; Biberacher, M.; Dominguez, J.; Fiorese, G.; Gadocha, S.; Gnansounou, E.; Guariso, G.; Kartalidis, A.; Panichelli, L.; Pinedo, I.; et al. Methods and tools to evaluate the availability of renewable energy sources. Renew. Sustain. Energy Rev. 2011, 15, 1182–1200. [Google Scholar] [CrossRef]
  10. Biberacher, M. GIS-based modeling approach for energy systems. Int. J. Energy Sect. Manag. 2008, 2, 368–384. [Google Scholar] [CrossRef]
  11. Calvert, K.; Pearce, J.M.; Mabee, W.E. Toward renewable energy geo-information infrastructures: Applications of GIScience and remote sensing that build institutional capacity. Renew. Sustain. Energy Rev. 2013, 18, 416–429. [Google Scholar] [CrossRef]
  12. Moreno, A.; Gilabert, M.A.; Camacho, F.; Martínez, B. Validation of daily global solar irradiation images from MSG over Spain. Renew. Energy 2013, 60, 332–342. [Google Scholar] [CrossRef]
  13. Roerink, G.J.; Bojanowski, J.S.; de Wit, A.J.W.; Eerens, H.; Supit, I.; Leo, O.; Boogaard, H.L. Evaluation of MSG-derived global radiation estimates for application in a regional crop model. Agric. For. Meteorol. 2012, 160, 36–47. [Google Scholar] [CrossRef]
  14. Rigollier, C.; Lefèvre, M.; Wald, L. The method Heliosat-2 for deriving shortwave solar radiation from satellite images. Sol. Energy 2004, 77, 159–169. [Google Scholar] [CrossRef]
  15. Eissa, Y.; Chiesa, M.; Ghedira, H. Assessment and recalibration of the Heliosat-2 method in global horizontal irradiance modeling over the desert environment of the UAE. Sol. Energy 2012, 86, 1816–1825. [Google Scholar] [CrossRef]
  16. Espinar, B.; Ramírez, L.; Polo, J.; Zarzalejo, L.F.; Wald, L. Analysis of the influences of uncertainties in input variables on the outcomes of the Heliosat-2 method. Sol. Energy 2009, 83, 1731–1741. [Google Scholar] [CrossRef] [Green Version]
  17. Geiger, B.; Meurey, C.; Lajas, D.; Franchistéguy, L.; Carrer, D.; Roujean, J.-L. Near real-time provision of downwelling shortwave radiation estimates derived from satellite observations. Meteorol. Appl. 2008, 15, 411–420. [Google Scholar] [CrossRef]
  18. Ineichen, P.; Barroso, C.S.; Geiger, B.; Hollmann, R.; Marsouin, A.; Mueller, R. Satellite Application Facilities irradiance products: Hourly time step comparison and validation over Europe. Int. J. Remote Sens. 2009, 30, 5549–5571. [Google Scholar] [CrossRef]
  19. Moradi, I.; Mueller, R.; Alijani, B.; Kamali, G.A. Evaluation of the Heliosat-II method using daily irradiation data for four stations in Iran. Sol. Energy 2009, 83, 150–156. [Google Scholar] [CrossRef]
  20. Bosch, J.L.; Batlles, F.J.; Zarzalejo, L.F.; López, G. Solar resources estimation combining digital terrain models and satellite images techniques. Renew. Energy 2010, 35, 2853–2861. [Google Scholar] [CrossRef]
  21. Martínez-Durbán, M.; Zarzalejo, L.F.; Bosch, J.L.; Rosiek, S.; Polo, J.; Batlles, F.J. Estimation of global daily irradiation in complex topography zones using digital elevation models and meteosat images: Comparison of the results. Energy Convers. Manag. 2009, 50, 2233–2238. [Google Scholar] [CrossRef]
  22. Dee, D.P.; Uppala, S.M.; Simmons, A.J.; Berrisford, P.; Poli, P.; Kobayashi, S.; Andrae, U.; Balmaseda, M.A.; Balsamo, G.; Bauer, P.; et al. The ERA-Interim reanalysis: Configuration and performance of the data assimilation system. Q. J. R. Meteorol. Soc. 2011, 137, 553–597. [Google Scholar] [CrossRef]
  23. Hofierka, J.; Kaňuk, J. Assessment of photovoltaic potential in urban areas using open-source solar radiation tools. Renew. Energy 2009, 34, 2206–2214. [Google Scholar] [CrossRef]
  24. Ramirez Camargo, L.; Pagany, R.; Marquardt, A. Zeitlich und räumlich hochaufgelöste Modellierung der potentiellen solaren Einstrahlung—ein Methodenvergleich. In Angewandte Geoinformatik 2014, Beiträge zum 26. AGIT-Symposium Salzburg; Strobl, J., Blaschke, T., Griesebner, G., Zagel, B., Eds.; Wichmann: Berlin, Germany, 2014; pp. 143–152. [Google Scholar]
  25. Ruiz-Arias, J.A.; Tovar-Pescador, J.; Pozo-Vázquez, D.; Alsamamra, H. A comparative analysis of DEM-based models to estimate the solar radiation in mountainous terrain. Int. J. Geogr. Inf. Sci. 2009, 23, 1049–1076. [Google Scholar] [CrossRef]
  26. Šúri, M.; Hofierka, J. A New GIS-based Solar Radiation Model and Its Application to Photovoltaic Assessments. Trans. GIS 2004, 8, 175–190. [Google Scholar] [CrossRef]
  27. Meteonorm Global Metereological Database, Version 7, Software and Data for Engineers, Planners and Education-Handbook Part II: Theory; Meteonorm: Bern, Switzerland, 2015.
  28. Šúri, M.; Huld, T.A.; Dunlop, E.D. PV-GIS: A web-based solar radiation database for the calculation of PV potential in Europe. Int. J. Sustain. Energy 2005, 24, 55–67. [Google Scholar] [CrossRef]
  29. Bergamasco, L.; Asinari, P. Scalable methodology for the photovoltaic solar energy potential assessment based on available roof surface area: Application to Piedmont Region (Italy). Sol. Energy 2011, 85, 1041–1055. [Google Scholar] [CrossRef]
  30. Kanters, J.; Wall, M.; Kjellsson, E. The Solar Map as a Knowledge Base for Solar Energy Use. Energy Procedia 2014, 48, 1597–1606. [Google Scholar] [CrossRef]
  31. Sun, Y.; Hof, A.; Wang, R.; Liu, J.; Lin, Y.; Yang, D. GIS-based approach for potential analysis of solar PV generation at the regional scale: A case study of Fujian Province. Energy Policy 2013, 58, 248–259. [Google Scholar] [CrossRef]
  32. Ghosh, S.; Nair, A.; Krishnan, S.S. Techno-economic review of rooftop photovoltaic systems: Case studies of industrial, residential and off-grid rooftops in Bangalore, Karnataka. Renew. Sustain. Energy Rev. 2015, 42, 1132–1142. [Google Scholar] [CrossRef]
  33. Huld, T.; Amillo, A. Estimating PV Module Performance over Large Geographical Regions: The Role of Irradiance, Air Temperature, Wind Speed and Solar Spectrum. Energies 2015, 8, 5159–5181. [Google Scholar] [CrossRef] [Green Version]
  34. Mayr, D.; Schmidt, J.; Schmid, E. The potentials of a reverse auction in allocating subsidies for cost-effective roof-top photovoltaic system deployment. Energy Policy 2014, 69, 555–565. [Google Scholar] [CrossRef]
  35. Bayerisches Staatsministerium für Umwelt und Gesundheit; Bayerisches Staatsministerium für Wirtschaft, Infrastruktur, Verkehr und Technologie; Oberste Baubehörde im Bayerischen Staatsministerium des Innern Leitfaden Energienutzungsplan. Available online: http://www.stmi.bayern.de/imperia/md/content/stmi/bauen/rechtundtechnikundbauplanung/_staedtebau/veroeffentlichungen/oeko/leitfaden_enp.pdf (accessed on 18 April 2012).
  36. Jakubiec, J.A.; Reinhart, C.F. A method for predicting city-wide electricity gains from photovoltaic panels based on LiDAR and GIS data combined with hourly Daysim simulations. Sol. Energy 2013, 93, 127–143. [Google Scholar] [CrossRef]
  37. Lukač, N.; Seme, S.; Žlaus, D.; Štumberger, G.; Žalik, B. Buildings roofs photovoltaic potential assessment based on LiDAR (Light Detection And Ranging) data. Energy 2014, 66, 598–609. [Google Scholar] [CrossRef]
  38. Ramirez Camargo, L.; Zink, R.; Dorner, W.; Stoeglehner, G. Spatio-temporal modeling of roof-top photovoltaic panels for improved technical potential assessment and electricity peak load offsetting at the municipal scale. Comput. Environ. Urban Syst. 2015, 52, 58–69. [Google Scholar] [CrossRef]
  39. Lang, T.; Ammann, D.; Girod, B. Profitability in absence of subsidies: A techno-economic analysis of rooftop photovoltaic self-consumption in residential and commercial buildings. Renew. Energy 2016, 87, 77–87. [Google Scholar] [CrossRef]
  40. Girod, B.; Lang, T.; Nägele, F. Energieeffizienz in Gebäuden: Herausforderungen und Chancen für Energieversorger und Technologiehersteller—Abschlussbericht; ETH: Zürich, Switzerland, 2014. (In German) [Google Scholar]
  41. Belmonte, S.; Escalante, K.N.; Franco, J. Shaping changes through participatory processes: Local development and renewable energy in rural habitats. Renew. Sustain. Energy Rev. 2015, 45, 278–289. [Google Scholar] [CrossRef]
  42. Haralambopoulos, D.A.; Polatidis, H. Renewable energy projects: Structuring a multi-criteria group decision-making framework. Renew. Energy 2003, 28, 961–973. [Google Scholar] [CrossRef]
  43. Reddy, S.; Painuly, J.P. Diffusion of renewable energy technologies—barriers and stakeholders’ perspectives. Renew. Energy 2004, 29, 1431–1447. [Google Scholar] [CrossRef]
  44. Zhu, B.; Zhang, W.; Du, J.; Zhou, W.; Qiu, T.; Li, Q. Adoption of renewable energy technologies (RETs): A survey on rural construction in China. Technol. Soc. 2011, 33, 223–230. [Google Scholar] [CrossRef]
  45. Lang, T.; Gloerfeld, E.; Girod, B. Don’t just follow the sun—A global assessment of economic performance for residential building photovoltaics. Renew. Sustain. Energy Rev. 2015, 42, 932–951. [Google Scholar] [CrossRef]
  46. Bazilian, M.; Onyeji, I.; Liebreich, M.; MacGill, I.; Chase, J.; Shah, J.; Gielen, D.; Arent, D.; Landfear, D.; Zhengrong, S. Re-considering the economics of photovoltaic power. Renew. Energy 2013, 53, 329–338. [Google Scholar] [CrossRef]
  47. Branker, K.; Pathak, M.J.M.; Pearce, J.M. A review of solar photovoltaic levelized cost of electricity. Renew. Sustain. Energy Rev. 2011, 15, 4470–4482. [Google Scholar] [CrossRef]
  48. Belmonte, S.; Sarmiento, N.; Escalante, K.; Franco, J.; Ramirez Camargo, L.; Dorner, W. Aportes a la planificación energética en salta. información de base, marco legal y desafíos al corto plazo. In Acta de la XXXVIII Reunión de Trabajo de la Asociación Argentina de Energías Renovables y Medio Ambiente; INENCO: Salta, Argentina, 2015; Volume 3, pp. 12.61–12.72. ISBN 978-987-29873-0-5. (In Spanish) [Google Scholar]
  49. Encuesta Fácil. EncuestaFacil.com, Online Survey Website; Encuesta Fácil S.L.: Madrid, Spain, 2015. [Google Scholar]
  50. IRENA. Renewable Energy Prospects: Germany; Remap 2030 Analysis; International Renewable Energy Agency: Abu Dhabi, The United Arab Emirates, 2015. [Google Scholar]
  51. Righini, R.; Grossi Gallegos, H.; Raichijk, C. Approach to drawing new global solar irradiation contour maps for Argentina. Renew. Energy 2005, 30, 1241–1255. [Google Scholar] [CrossRef]
  52. Salazar, G.A.; Hernandez, A.L.; Echazú, R.; Saravia, L.R.; Romero, G.G. Comparison Between Measured Mean Monthly Solar Insolation Data and Estimates from Swera Database for Salta City (Northwestern Argentina). Electron. J. Energy Environ. 2013, 1, 9–20. [Google Scholar] [CrossRef]
  53. Aristegui, R.; Righini, R. Discusión sobre el proceso de selección de sitios apropiados para la ubicación de estaciones de una futura red solarimétrica nacional. Av. En Energ. Renov. Medio Ambiente 2012, 16, 39–46. [Google Scholar]
  54. Instituto Nacional de Tecnología Agropecuaria (INTA). La Argentina Medirá la Radiación Solar en Tiempo Real. INTA Informa. 2015. Available online: http://intainforma.inta.gov.ar/?p=28333 (accessed on 15 December 2015). (In Spanish) [Google Scholar]
  55. Ramirez Camargo, L.; Altamirano, M.; Belmonte, S.; Dorner, W. Comparación de fuentes satelitales, de re-análisis y métodos estadísticos para el mapeo de la radiación solar en el valle de Lerma (Salta-Argentina). In Acta de la XXXVIII Reunión de Trabajo de la Asociación Argentina de Energías Renovables y Medio Ambiente; INENCO: Salta, Argentina, 2015; Volume 3, pp. 11.31–11.42. ISBN 978-987-29873-0-5. (In Spanish) [Google Scholar]
  56. European Centre for Medium-Range Weather Forecasts (ECMWF). ERA-Interim Dataset (January 1979 to Present). 2015. Available online: http://www.ecmwf.int/en/research/climate-reanalysis/era-interim (accessed on 16 June 2015).
  57. Righini, R.; Aristegui, R.; Roldán, A. Determinación de la cantidad de años de medición necesarios para la evaluación de la radiación solar global a nivel de superficie en Argentina. Acta XXXVII Reunión Trab. Asoc. Argent. Energ. Renov. Medio Ambient. 2014, 17–25. (In Spanish) [Google Scholar]
  58. Ramirez Camargo, L.; Zink, R.; Dorner, W. Spatiotemporal modeling for assessing complementarity of renewable energy sources in distributed energy systems. ISPRS Ann. Photogramm. Remote Sens. Spat. Inf. Sci. 2015, II-4/W2, 147–154. [Google Scholar] [CrossRef]
  59. Schmidt, T.S.; Born, R.; Schneider, M. Assessing the costs of photovoltaic and wind power in six developing countries. Nat. Clim. Chang. 2012, 2, 548–553. [Google Scholar] [CrossRef]
  60. Gass, V.; Strauss, F.; Schmidt, J.; Schmid, E. Assessing the effect of wind power uncertainty on profitability. Renew. Sustain. Energy Rev. 2011, 15, 2677–2683. [Google Scholar] [CrossRef]
  61. IEA. Technology Roadmap—Solar Photovoltaic Energy; International Energy Agency: Paris, France, 2014. [Google Scholar]
  62. Wirth, H. Aktuelle Fakten zur Photovoltaik in Deutschland; Fraunhofer ISE: Freiburg, Germany, 2015. [Google Scholar]
  63. Empresa Distribuidora de Electricidad de Salta Cuadro tarifario edesa Agosto-Octubre 2015. Available online: https://www.edesa.com.ar/pdf/cuadrotarifario.pdf (accessed on 10 December 2015).
  64. International Renewable Energy Agency (IRENA). Renewable Power Generation Costs in 2014; IRENA: Bonn, Germany, 2015. [Google Scholar]
  65. Katz, C. What is neo-developmentism? A critical view. Argentina and Brazil. Serviço Soc. Soc. 2015, 224–249. [Google Scholar] [CrossRef]
  66. Diario el Clarín Suben las Tarifas de luz y Gas Desde Enero. Available online: http://www.ieco.clarin.com/economia/Suben-tarifas-luz-gas-enero_0_1485451723.html (accessed on 15 December 2015).
Figure 1. Overall workflow of the proposed Methodology.
Energies 09 00133 g001
Figure 2. Map of the location of the case studies, Salta City.
Energies 09 00133 g002
Figure 3. General knowledge of the population about the renewable energies (RE) plan and new laws for promoting RE in the Province of Salta.
Energies 09 00133 g003
Figure 4. Interest in installing a photovoltaic system at home.
Energies 09 00133 g004
Figure 5. Monthly isolation per square meter and energy yield per kWp photovoltaics for the location of one of the case studies.
Energies 09 00133 g005
Figure 6. Levelized cost of electricity (LCOE) based on the total installation costs provided by local vendors and the international average costs for discount rates between 0% and 20%.
Energies 09 00133 g006
Figure 7. Calculated income and savings for residential case studies for PV system sizes accepted in the net-metering law.
Energies 09 00133 g007
Figure 8. Calculated income and savings for non-residential case studies for PV system sizes accepted in the net-metering law.
Energies 09 00133 g008
Figure 9. Net present value (NPV) for residential users for all provided total costs, system sizes and discount rates.
Energies 09 00133 g009
Figure 10. Internal rate of return (IRR) for residential case studies with the lowest (Residential a) and highest (Residential e) energy demand and four total installation costs.
Energies 09 00133 g010
Table 1. Actions proposed in collaborative work.
General StrategyProposed Actions
Coordinated Inter-Institutional work- Establish a mechanism agreed by involved institutions to define stages of support.
- Promote the regulation and control by professional organizations.
- Use energy saving education at all levels, from individual household to institutional levels.
RE promotion (regulation and new technologies)- Advertise the laws and technologies massively (environmental awareness).
- Show people how to handle RE technologies.
- Promote solar thermal and PV energy.
- Promote other renewable sources and their combination (biomass, small hydro, etc.).
Specific economical guidelines- Specially designed to create economic incentives to encourage households (link to regulation improvements).
- Promote subsidies for private households as well as small municipalities.
- Facilitate the importation of RE installation materials and supplies.

