Article

Influence of Fine Metal Particles on Surface Discharge Characteristics of Outdoor Insulators

1
Key Laboratory of Smart Grid of Ministry of Education (Tianjin University), School of Electrical Engineering and Automation, Tianjin University, Tianjin 300072, China
2
Canada Research Chair on Engineering of Power Network Atmospheric Icing (INGIVRE), Université du Québec à Chicoutimi, 555, Boulevard de l'Université, Chicoutimi, QC G7H 2B1, Canada
*
Author to whom correspondence should be addressed.
Energies 2016, 9(2), 87; https://doi.org/10.3390/en9020087
Submission received: 12 December 2015 / Revised: 18 January 2016 / Accepted: 22 January 2016 / Published: 29 January 2016

Abstract

:
Focusing on the influence of fine metal particles on the insulation characteristics of outdoor insulators, spherical micrometer-level iron powders were used to represent fine metal particles of different parameters on a polymer insulator specimen surface. Dynamic movement and lift-off behavior of fine particles, as well as the triggered surface discharges under AC voltage were investigated in a uniform electric field under different experimental conditions. The results reveal that the inception, propagation and intensity of surface discharges are significantly affected by the particle parameters, including particle size, amount and distributing characteristic. Based on the measurement of light emission during the flashover process using a high-speed camera, the process of surface discharge to flashover triggered by the fine metal particles were investigated to obtain a relationship between flashover voltage, discharge light intensity and particle parameters. It is suggested that particle size smaller than 28 µm and particle amount more than 40 mg in contact with the non-uniform distribution can cause a significant distortion and intensification of the electric field resulting in a higher risk of surface discharges leading to flashover. Such investigations can enhance the operating reliability of outdoor insulators subjected to these conditions.

1. Introduction

Outdoor insulators are essential components in the structure and operation of transmission and distribution lines and substations, providing both mechanical connection and electrical insulation for conductors at different voltage levels or for conductors to the ground [1,2,3,4]. From the viewpoint of actual operations, due to direct exposure to atmospheric environments, the variation of aerial components, including both gaseous and solid pollutants, inevitably influences insulator performance. Except for the mechanical properties, the decrease, even failure, of electrical insulation of outdoor insulators is still one of serious factors bound to affect the stability and reliability of power systems, especially if associated with the increasingly aggravated atmospheric conditions [5,6,7,8,9,10].
When outdoor insulators are operating in polluted environments, especially in heavy industrial areas, due to electric fields induced by operating voltage, especially at the UHV and EHV levels, the surrounding floating fine dust particles could be adsorbed onto the insulator surface by the high electrostatic forces associated with particle gravity [11,12]. The movement of dust particles around the insulator is the combined action of three acting forces, including electrical field force, fluid drag force and gravity, which play an important role in the insulator pollution characteristics [13]. When dust particles move to the insulator surface, they will suffer from the surface adhesive force and deposit on the surface. Generally, the surface contamination of outdoor insulators is non-uniform, and the contamination near high-voltage terminals is much more serious [14,15,16]. The adhesion of fine particles is a complicated process, relating to the surface roughness, hardness and wetting properties of the insulator as well as the size, shape and hardness of the fine particles [17]. Compared with porcelain and glass, silicone rubber can more easily absorb atmospheric contamination, due to its lower surface finish and self-cleaning performance, and the adhesive force suffered by conductive particles is greater than that for non-conductive particles [18,19,20]. However, few researchers have focused on the influence of fine metal particles on composite insulators. Therefore, the connection between fine metal particles and outdoor insulator still needs to be discussed.
After a series of collisions, diffusion and deposition, the fine particles will continuously accumulate to develop a dust layer. Due to these conductive particles, the electric field distribution will be distorted, enhancing the probability that the electric field strength will be higher than the threshold value of air breakdown, which means a high probability of partial discharge occurrence. Due to the effects of electrostatic forces and surface discharges, the conductive particles can get charged and propagate along the insulator surface to induce further development of surface discharges [21,22,23,24]. Therefore, fine metal particles are one of most serious pollution threats that can potentially influence the safe operation of power systems, and they should be investigated from both the theoretical and engineering viewpoints.
In this paper, by considering the conductive properties of fine metal particles on the insulator surface, these particles were experimentally simulated by using a powder of micrometer-size iron spheres distributed on the insulator surface. Surface discharge experiments were further carried out by using an AC power source to investigate the effects of fine-particle parameters, including particle size, amount and distribution, on the discharge characteristics recorded by a high-speed camera. A relationship between the flashover voltage, the luminous characteristic of surface discharges and the fine-particle parameters was obtained, revealing the underlying mechanism of surface discharges triggered by the fine particles.

2. Experimental Setup

Figure 1 shows a schematic diagram of the experimental setup. For the purpose of eliminating any influence of the surrounding light on the luminous measurement of surface discharges, all the discharge experiments were carried out in a dark chamber. A high-speed camera was vertically fixed above the specimen surface to record the whole process of surface discharges throughout the flashover process. The specimen system consisted of two main parts: one was silicone rubber insulator slices in oblong shape of dimensions of 50 × 30 × 5 mm, mechanically impressed by stainless electrodes in a “plate-to-plate” pattern, as shown in Figure 2; the other was the insulation support for fixing the specimen and the electrodes. The left electrode was connected to a HVAC power source with a rated AC voltage of 50 kV at 50 Hz and rated power of 70 kV·A, while the other electrode was grounded.
All the specimen surfaces were wiped using ethyl alcohol and then dried in a desiccator at room temperature for more than 24 hours before they were impressed between the electrodes. The electrode interval along the specimen surface was adjusted at a parallel distance of 30 mm before conducting the experiments. For the purpose of investigating the effects of electrostatic-adhesive fine metal particles on surface discharges, powders made of micrometer-size iron spheres were selected to simulate the fine metal particles, with particles varying in size, amount and distribution characteristics. The particle sizes were 38, 32, 28 and 24 μm. The particle amounts were 0, 10, 20, 30, 40 and 50 mg. The particle distribution on the specimen surface was divided into uniform and non-uniform, as shown in Figure 2. The former means that the conductive particles are evenly scattered on the specimen surface between the electrodes; the latter means that a rectangular area of iron powder close to the HV electrode are formed, with a width of 2.5 mm and a height of 20 mm. That is to say, the particle density in Figure 2a is 0.2, 0.4, 0.6, 0.8 and 1.0 g/mm2, and in Figure 2b it is 0.017, 0.033, 0.05, 0.067 and 0.083 g/mm2.
Figure 1. Experimental setup schematics.
Energies 09 00087 g001
Figure 2. Schematics of particle distribution characteristics on the specimen surface. L: HV electrode; R: Grounded electrode: (a) Uniform distribution; (b) Non-uniform distribution
Energies 09 00087 g002
Once the specimen and the conductive particles of a certain parameter value were prepared in the chamber, a stepless speed boost method was used to raise the test voltage at a rate of 1.0 kV/s till the surface flashover occurred. The voltage at this moment was recorded as the flashover voltage, which is determined as the average of the values obtained after this test is repeated 10 times under fixed experimental conditions. During the discharge experiments, the phenomena and process of surface discharges were simultaneously measured by a high-speed camera at a recording speed of 5000 frames per second, which is enough for further characteristic identification of discharge images to analyze the relationship between the surface discharge characteristic and the fine-particle parameters.

3. Data Processing Method

The recorded flashover process can be separated into 5000 frames of continuous discharge images per second at a time interval of 0.2 ms. By using the image processing method described in our published paper [25,26], each image can be represented by a digital matrix of dimensions m × n × 1, in which the pixel value from 0 to 255 is related to the luminous intensity of surface discharge at a certain location point of the specimen surface. Then, the summation of the pixel values in the matrix can be obtained through Equation (1), which indicates the discharge intensity of the obtained discharge image. A bigger value of S means more intensive discharges on the specimen surface. Therefore, the discharge intensity at different time during the flashover process can be quantitatively obtained as:
S = i = 1 m j 1 n I ( i , j )
where, S is the summation of pixel value; and I(i, j) is the pixel value at i × j point of the matrix.
Together with the total reflection of discharge images associated with the S value, the detailed distribution characteristics of the surface discharges inside the image also need to be identified, so the principal component analysis (PCA) method, widely used to detail image information [27], was introduced to analyze the discharge characteristics and classify the surface discharge images in relationship with the fine-particle parameters during the flashover process. The calculation flowchart of PCA analysis is shown in Figure 3. Then, the PCA characteristic value can be obtained in relation with the variation of discharge characteristics, further providing classification of different discharges.
Figure 3. Flowchart of discharge characteristic analysis based on the principal component analysis method.
Energies 09 00087 g003

4. Results and Discussion

4.1. Process of Surface Flashover on a Polymer Insulator in the Presence of Fine Metal Particles

Once the fine metal particles are electrostatically adhered on the insulator surface, they will be dynamically affected by the electric field to induce surface discharges and their development into a flashover arc. The flashover process and related quantification of discharge characteristics are shown in Figure 4, with the particle parameters of uniform distribution, size of 24 μm and amount of 30 mg. It was found that due to the alternating properties of the applied voltage, the fine metal particles were attracted along the direction of the electric field, capturing the charges emitted from the electrodes and air ionization. The erratic horizontal motion as well as the oscillating vertical motion occurred simultaneously. A high electric field distortion was generated on the specimen surface, which induced the occurrence of corona discharges in regions of high enough electric field stress. Meanwhile, associated with the cases of charge neutralization, faint discharges can also be observed as a narrow luminous channel on the specimen surface, as shown in Figure 4a1. Once the onset discharge occurred between the particles, there were still electric field and charges sustained by the applied voltage, which stabilizes multiple discharges.
Figure 4. Process and luminous intensity of surface flashover in presence of fine particles (uniform distribution, particle size and amount of 24 μm and 30 mg). (a) Process of surface flashover (L-HV electrode, R-grounded electrode); (b) Luminous intensity of surface discharges during the flashover.
Energies 09 00087 g004
With raising voltage, the moving velocity along the horizontal direction and the ejection amplitude of particles were enhanced. A large number of charged particles were formed to cause increasingly local intensification of the electric field on the specimen surface, which induces small amounts of visible bright discharges, as shown in Figure 4a2. From Figure 4a3 to Figure 4a6, the local arcing discharges become more and brighter as the applied voltage is enhanced, resulting from two typical phenomena: one is due to the enhancement of the horizontal electrical field strength, so that the local arcs are sustained and connect together to form longer discharge arcs; the other phenomenon is affected by the increase in the lifting electric field [28], where some charged particles are ejected out of the air gap between the electrodes to form lift-off particles in the air, which generate floating discharge points above the discharge channel on the specimen surface. Once the local arcs propagate across the whole gap to connect the electrodes, flashover occurrence can be observed, as shown in Figure 4a7. After the flashover, due to the heat energy produced by surface discharges, the particles are agglomerated to form tracks on the specimen surface, as shown in Figure 4a8. Therefore, due to the processes and phenomena occurring during the flashover, the luminous intensity of surface discharges is linked to the discharge strength, which can be used as an indicator for quantitative analysis of surface discharges. As shown in Figure 4b, the luminous intensity of surface discharges during flashover was obtained to reveal that the increasing tendency in discharge luminance is continuously enhanced with the development of different discharge stages, especially significant enhancement at stages of prior to flashover. At the beginning, the coexistence of corona and streamer discharges dominates the specimen surface. At this stage, however, it is relatively faint and only emits weak luminesce. Once the arcing discharges appear, the surface discharges become stronger showing more discharge light brightness, which is related to a higher probability of surface flashover occurrence.
Figure 5 presents the PCA analysis of surface discharges at different stages of the flashover process in the presence of fine particles. The variation of PCA characteristic values can reflect the distribution characteristics of discharge light intensity related to discharge strength. It was found that with the surface discharges developing from Stage a1 to Stage a7, the PCA value becomes much higher and shows a larger variation scatter. Further classification of different stages based on the PCA characteristic value can be obtained, as shown in Figure 5b. The PCA index tends to increase with the development of surface discharges, and presents a relatively stable variation from stages a3 to a6, which reveals that the discharges on the specimen surface are mainly dominated by local arcing discharges.

4.2. Effects of Fine-Particle Size on Surface Discharge

The relationship between the flashover voltage and the fine-particle size is shown in Figure 6, which reveals that the flashover voltage shows a tendency to decrease with particle size, especially so for a significant drop at the size of 24 µm. The main effect of the decrease in particle size is to enhance the electric field around the conductive particles from a microcosmic view and to increase the conductivity of iron particles in a macroscopic view. Both are responsible for the air breakdown at the lower voltage. It is possible that the complete streamer propagates from these particles to form arcing discharges, and even the flashover at lower voltage levels. Meanwhile, the particles with smaller size can have higher specific surface energy, and thus can form more charged particles, so the movement and ejection behaviors of these particles are more active under the periodic variations of applied voltage.
From Figure 6, it can also be found that the flashover voltage under uniform fine particle distribution conditions is lower than under non-uniform distribution conditions. Due to the conductive properties of iron powder, the total air gap is less than the distance between the electrodes, so the effect of particle deposits may be considered as equivalent of an extension of the electrodes. When the fine particles are uniformly adhered on the specimen surface, the air gap between the electrodes can be separated into many small air gaps between the particles.
Figure 5. PCA analysis of surface flashover process at different stages in the presence of fine particles. (a) PCA characteristic value of surface discharge at different stages; (b) PCA classification of discharge characteristics during the propagation of surface discharges to flashover with PCA characteristic value above 6.
Energies 09 00087 g005
The total air gap between the electrodes is less than that of non-uniform distribution, and the extendible extent of uniform distribution is bigger than that of non-uniform distribution, so the electric field strength can be significantly enhanced to the threshold value of air breakdown at a lower applied voltage. The electrons from air ionization and field emission lead to more charges being absorbed by the particles, thus accelerating the formation and propagation of small discharge arcs which will become larger, till flashover.
Figure 6. Relationship between flashover voltage and fine-particle size with particle amount of 10 mg under different distribution conditions.
Energies 09 00087 g006
The effect of fine-particle size on luminous characteristic of surface discharge is shown in Figure 7. Although the particles are distributed in different ways, the luminous intensity emitted by surface discharges shows a significant decreasing tendency with the particle size increasing from 24 to 28 µm. When the particle size is bigger than 28 µm, its increase has little influence on the discharge luminesce, which shows a relatively smooth variation. The classification of surface discharges in Figure 7b shows a consistent variation tendency, which can be used to identify the discharge strength induced by particles of different sizes.
Figure 7. Discharge characteristic analysis in relation with fine-particle size with a particle amount of 30 mg. (a) Luminous intensity of surface flashover; (b) PCA classification.
Energies 09 00087 g007aEnergies 09 00087 g007b

4.3. Effects of Fine-Particle Amounts on Surface Discharge

Figure 8 displays the relationship between flashover voltage and fine-particle amount in the case of 24 μm particle size. Flashover voltage shows a tendency to decrease as the amount of fine particles increases. It is obvious that more particles on the specimen surface can effectively reduce the air gaps between the electrodes. The greatest degree of distortion in the electric field can be caused by increasing the amount of particles, which leads to an easier occurrence of surface discharges and a significant decrease in flashover voltage. The luminous intensity and PCA index of surface discharges show a tendency to increase with an increase in the amount of particles, as shown in Figure 9. This figure represents the variation of discharge characteristics in relation with the amount of particles.
Figure 8. Relationship between the flashover voltage and the fine-particle amount with a particle size of 24 µm.
Energies 09 00087 g008
Figure 9. Discharge characteristic analysis in relation with fine-particle amount with a particle size of 38 µm. (a) Luminous intensity of surface flashover; (b) PCA classification.
Energies 09 00087 g009

4.4. Electric Field Analysis of Insulator Surface Affected by Fine Metal Particles

From the viewpoint of electric field distortion affected by fine particles on an insulator surface and its potential to cause surface discharges, electric field analysis was carried out by using the An soft Simulation Software to reveal the effects of the fine-particle parameter on the intensification of electric field strength, as shown in Figure 10. All the simulation parameters are based on the experimental particle characteristics described in Section 2. For the purpose of general comparison, the relative value of the maximum electric field strength (ΔE) was obtained, for which the experimental condition having the minimum value was selected as reference. It is found in Figure 10a that the maximum electric field strength has the lowest value for the 38 μm particle size. As the particle size decreases, the electric field is enhanced and the maximum electric field value shows an increasing tendency. A significant increase in the electric field occurs for a particle size of 24 μm. Such a variation means that the small size of fine metal particles can significantly enhance the electric field to a higher value, which is in relation with the easier initiation of surface discharge and lower value of flashover voltage, as shown in Figure 6.
From Figure 10b, it can be observed that a small amount of fine particles shows little influence on the electric field, while an amount higher than 40 mg produces a greater distortion of the electric field, which is also in accordance with the variation of flashover voltage shown in Figure 8. Therefore, the initiation of an electric field for surface discharges between the particles and the electrode mainly depends on the particle size and particle amount, which shows an increasing tendency as the particle size is decreased and as the particle amount is increased.
Figure 10. Maximum electric-field strength on polymer insulator specimen surface in relation with variation of fine-particle parameters. (a) Effects of fine-particle size with a particle amount of 10 mg; (b) Effects of fine-particle amounts with a particle size of 24 µm.
Energies 09 00087 g010

5. Conclusions

The characteristics of surface discharges triggered by micrometer-level conductive particles were experimentally investigated to reflect the influence of electrostatic-adhesive fine metal particles on the insulating properties of outdoor insulators. As concerns the particle parameters of size, amount and distribution, the major results can be summarized as follows:
(1)
Fine metal particles on the insulator surface under AC voltage conditions show simultaneous behaviors of erratic horizontal movement and vertical lift-off, which cause distortion and intensification of electric stresses inducing surface discharges under a rather low voltage.
(2)
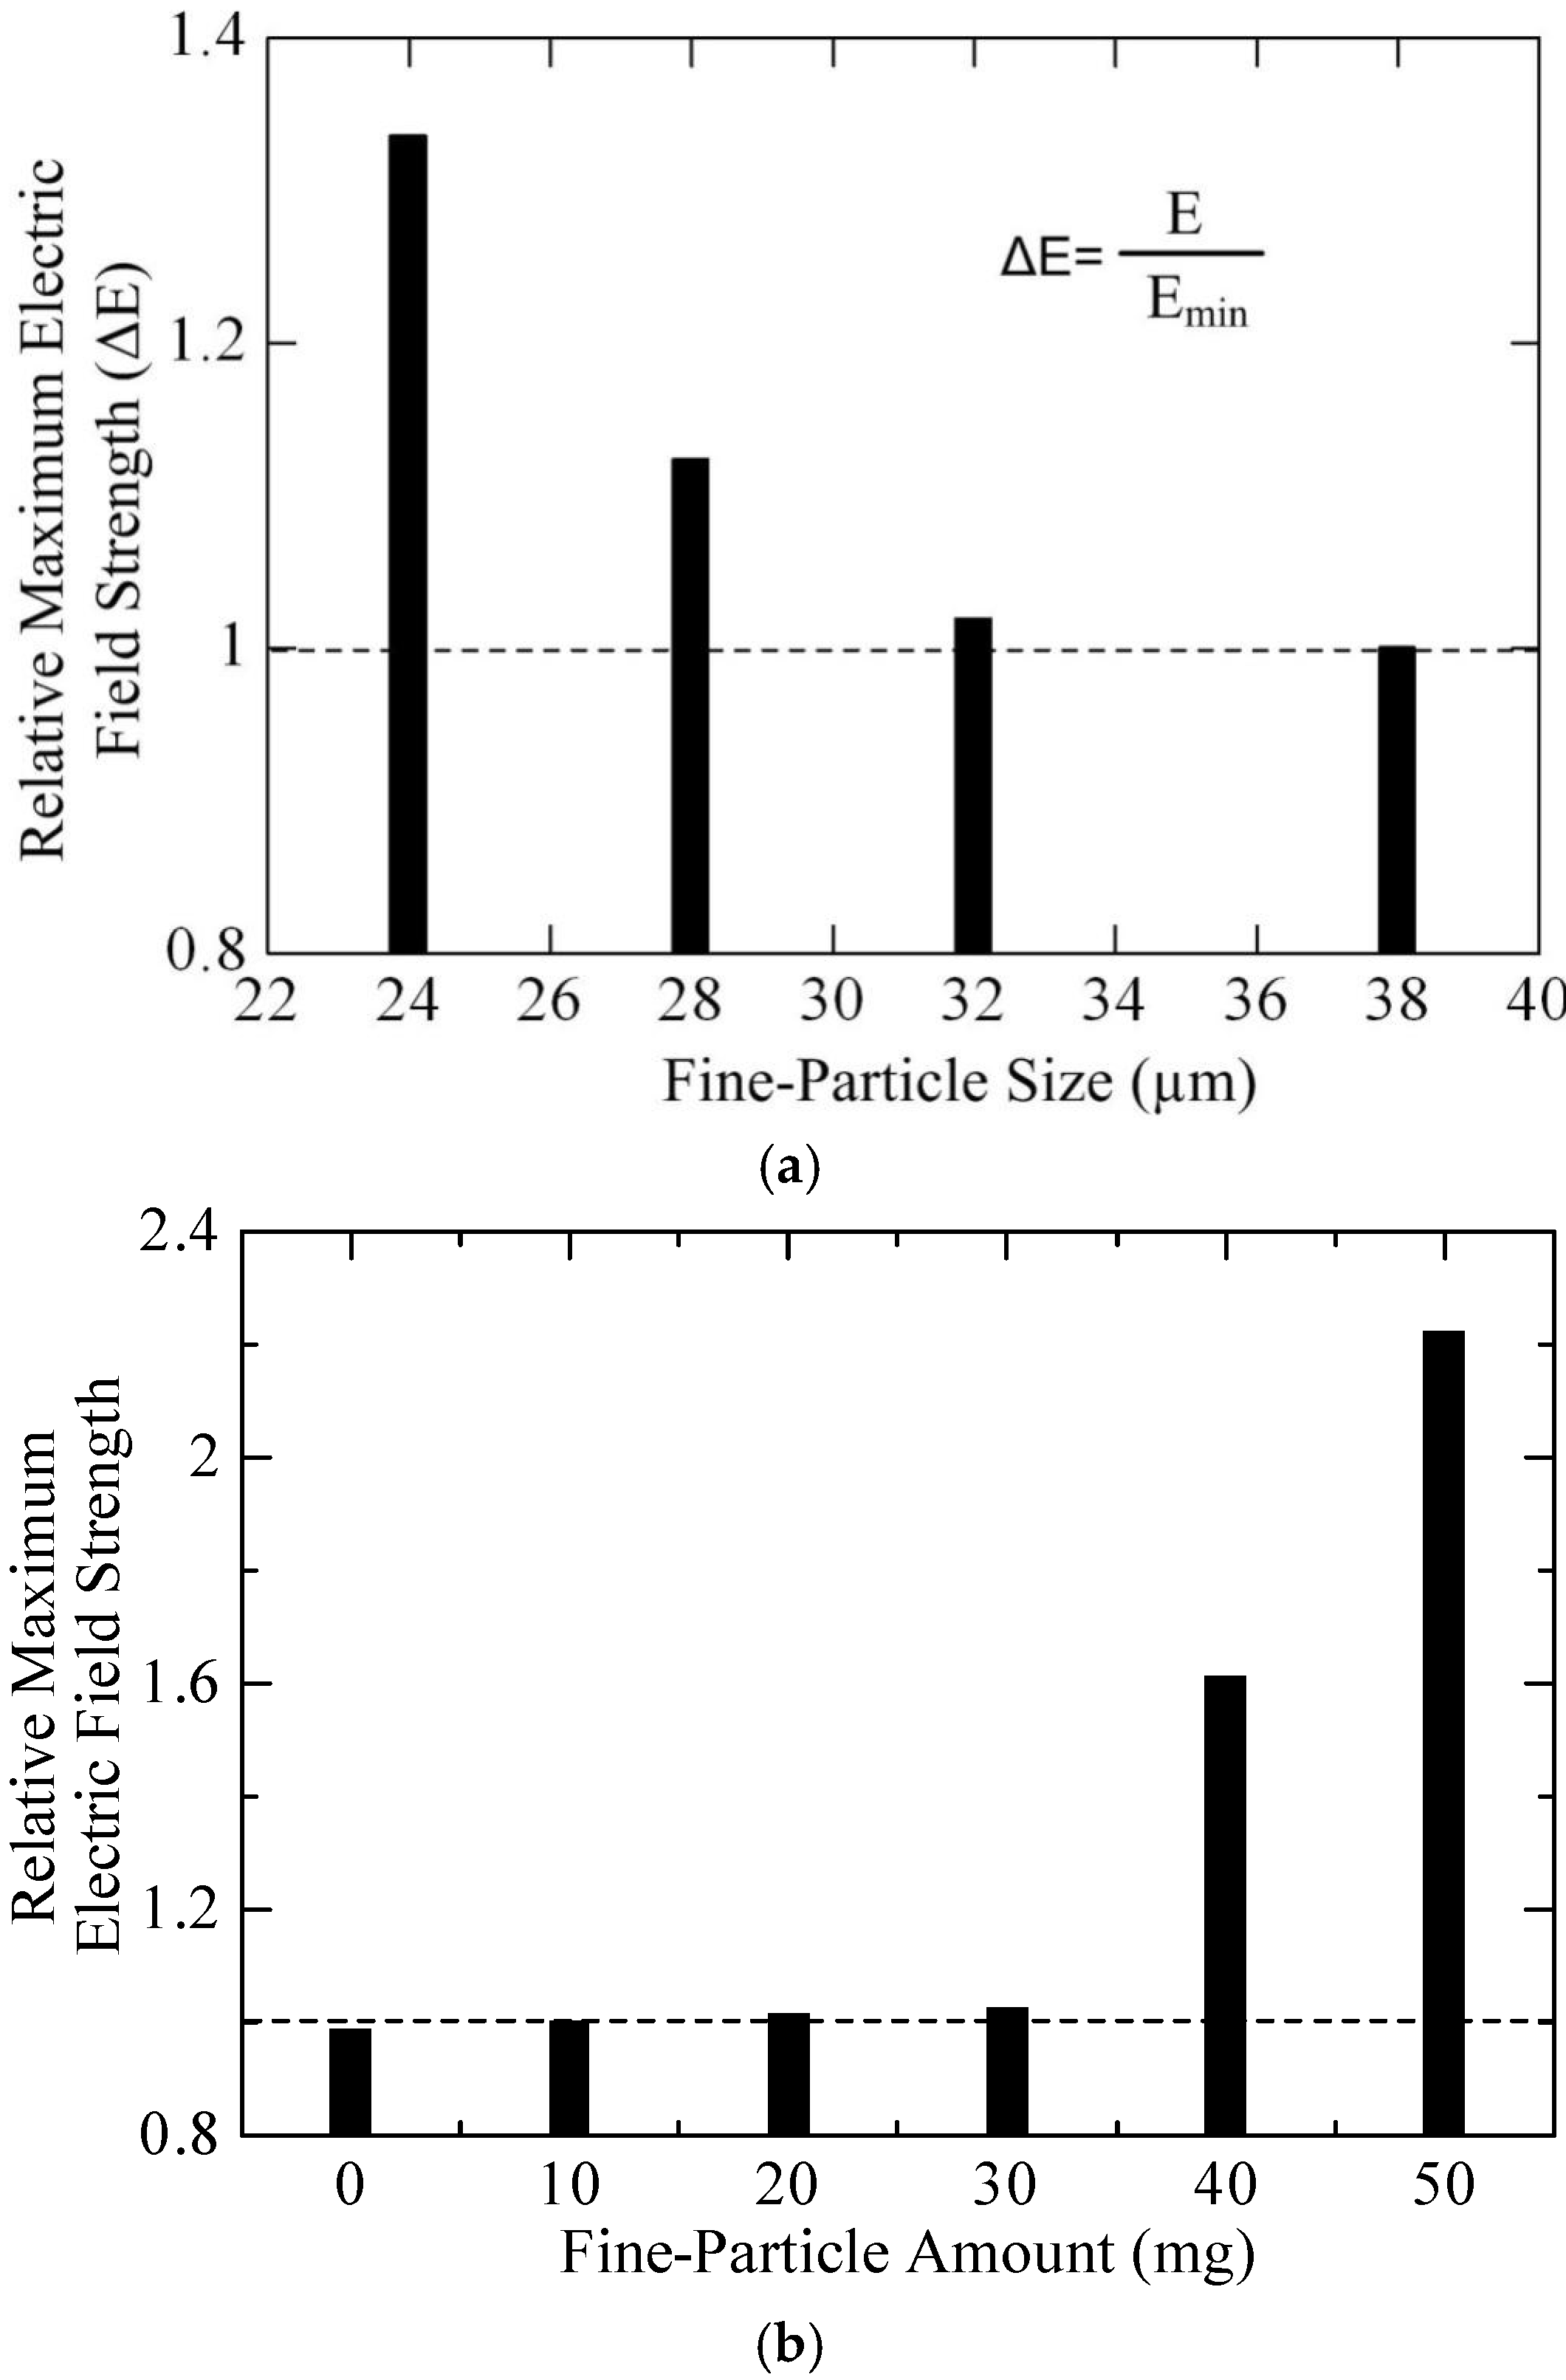
Flashover voltage shows a decreasing tendency as particle size is reduced and particle amount is increased. An especially significant change occurs when the particle size is smaller than 28 µm, associated with a uniform distribution.
(3)
The fine-particle of size below 28 µm and of particle amount over 40 mg can cause the significant distortion and intensification of the electric field on the specimen surface, which is related to an easier ignition and propagation of surface discharges to flashover.
(4)
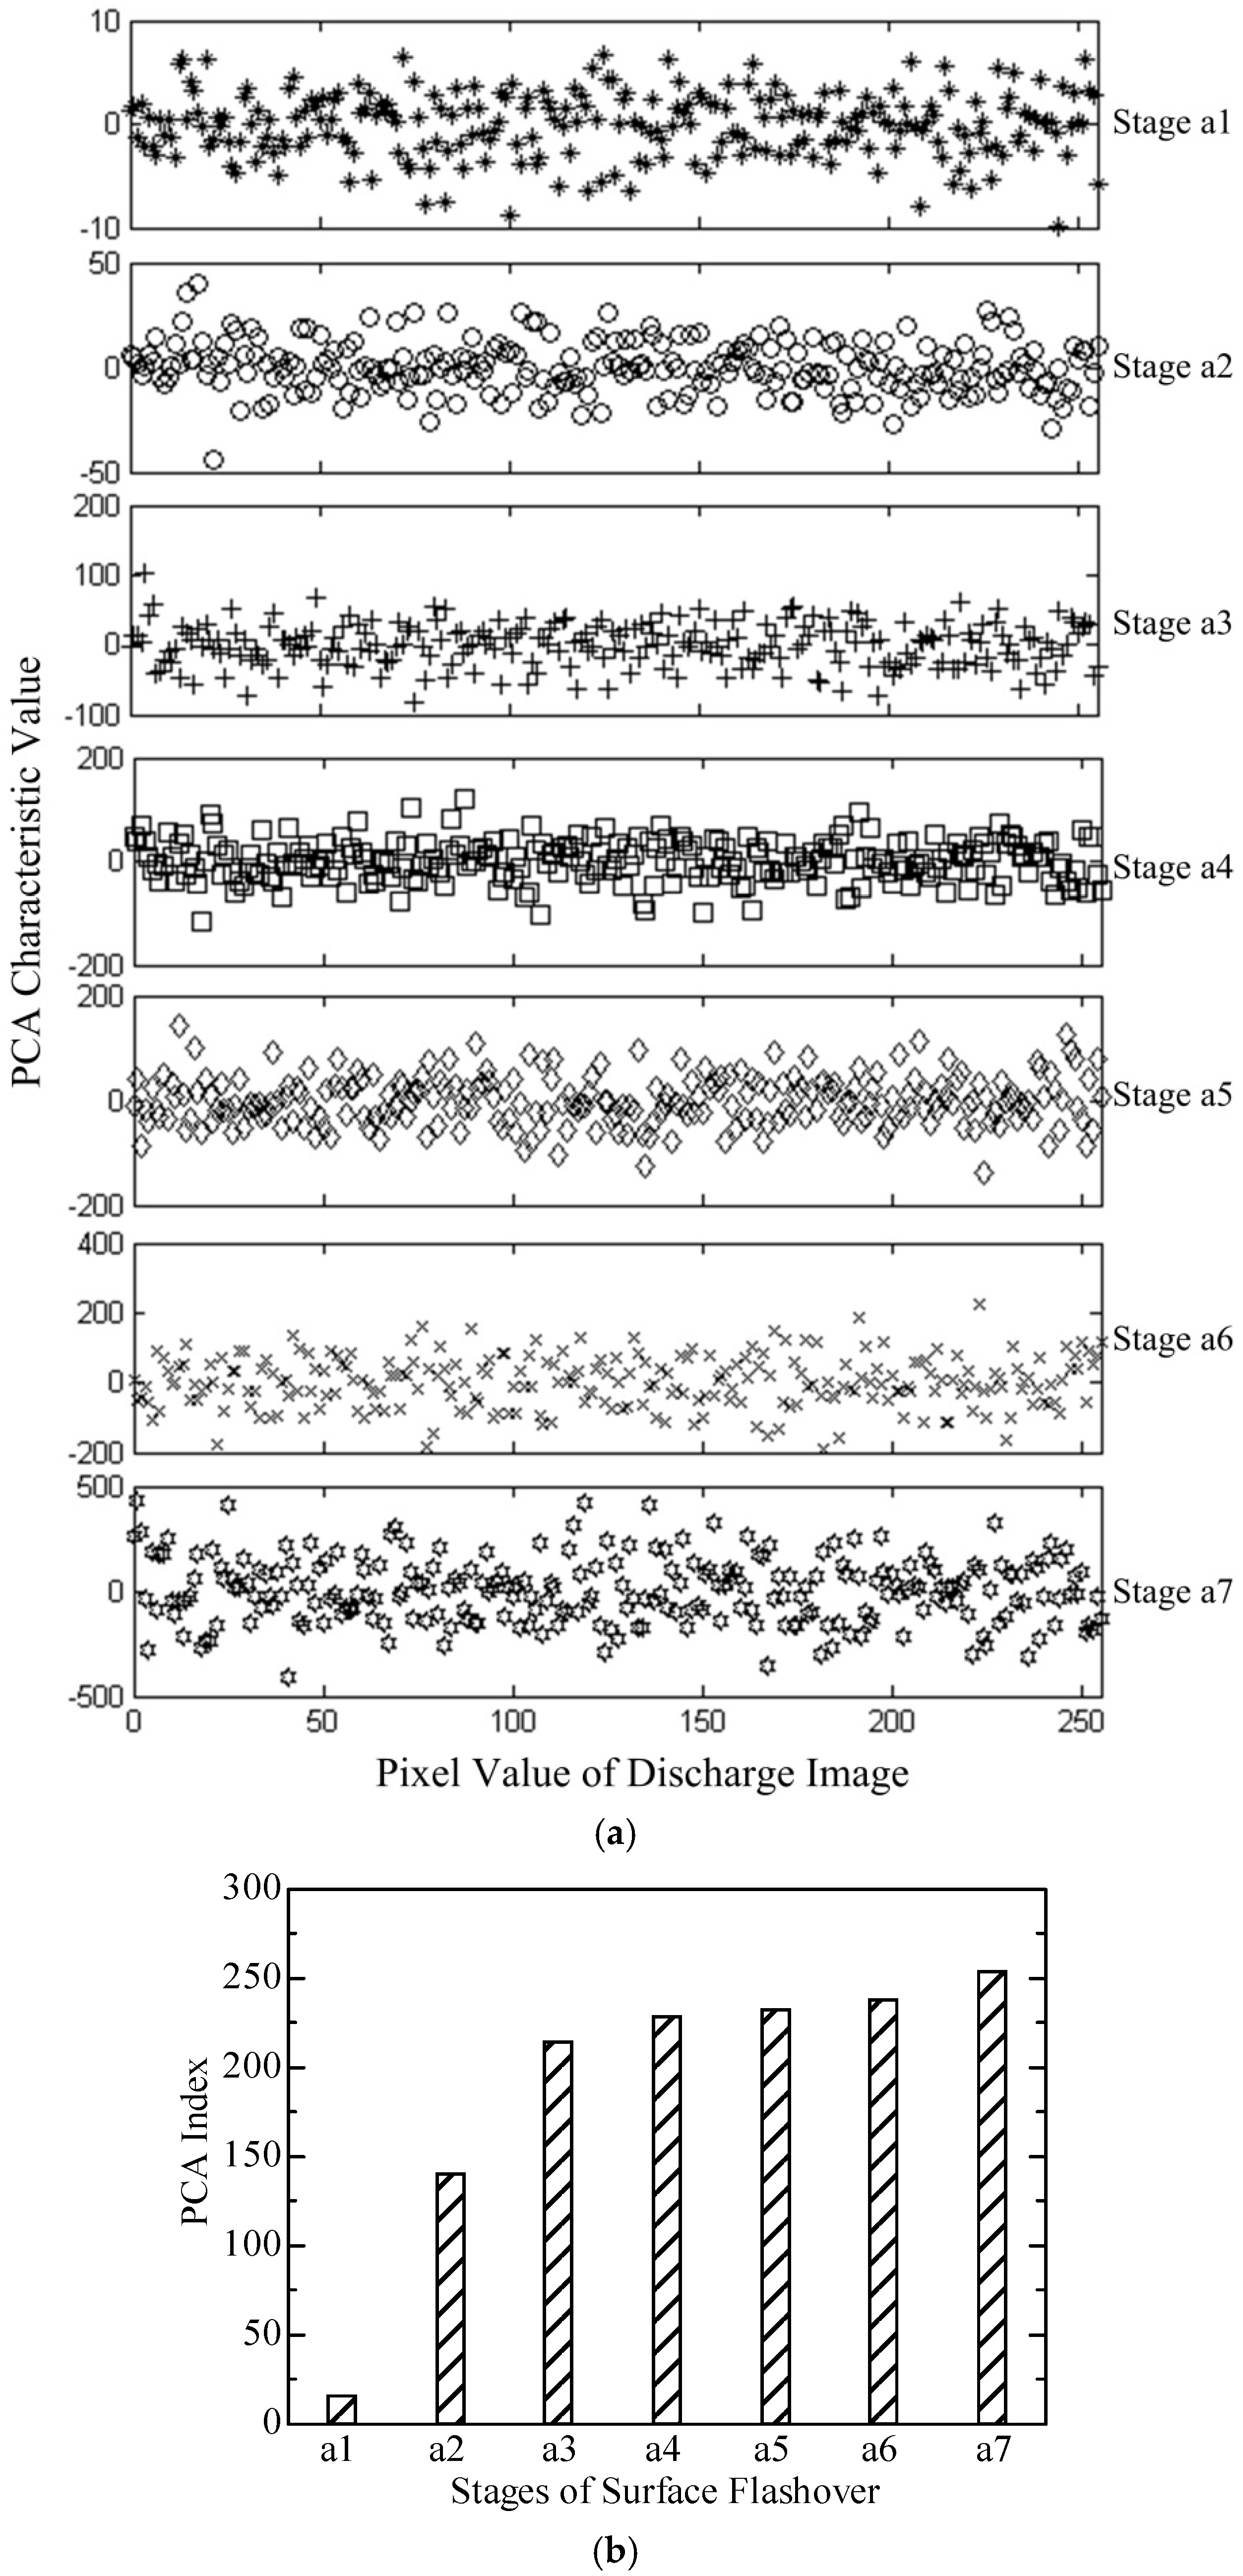
Light emission from surface discharges can be quantitatively analyzed as the indicator and classification index of propagation and strength of surface discharges. It shows a decreasing tendency in the discharge luminous intensity as particle size is increased and particle amount is decreased.
Overall, the obtained results and investigation on the influence mechanism of fine conductive particle characteristics (particle size, amount and distribution) on surface discharge of outdoor insulators will be helpful to enhance the operating reliability of outdoor insulators in such contaminated environments, and also to the further research on the influence of contaminated particles on the insulating properties of outdoor insulators.

Acknowledgments

This research work is supported by Chinese National Natural Science Foundation (Grant 51277131), National Basic Research Program of China (Program 973, Grant 2014CB239501 and 2014CB239506), in collaboration with the research chairs Industrial Chair on Atmospheric Icing of Power Network Equipment (CIGELE) and Canada Research Chair on Engineering of Power Network Atmospheric Icing (INGIVRE) at University of Quebec in Chicoutimi (UQAC).

Author Contributions

Yong Liu organized the experiments, analyzed the test results, and wrote this paper. Bowen Xia carried out the experiments. Boxue Du gave input to the data analysis method and result discussion. Masoud Farzaneh checked the language and revised the contents.

Conflicts of Interest

The authors declare no conflict of interest.

References

  1. Douar, M.A.; Beroual, A.; Souche, X. Degradation of various polymeric materials in clean and salt fog conditions: Measurements of AC flashover voltage and assessment of surface damages. IEEE Trans. Dielectr. Electrl. Insul. 2015, 22, 391–399. [Google Scholar] [CrossRef]
  2. Farzaneh, M. Insulator flashover under icing conditions. IEEE Trans. Dielectr. Electrl. Insul. 2014, 21, 1997–2011. [Google Scholar] [CrossRef]
  3. Liu, Y.; Du, B.X. Energy eigenvector analysis of surface discharges for evaluating the performance of polymer insulator in presence of water droplets. IEEE Trans. Dielectr. Electrl. Insul. 2014, 21, 2438–2447. [Google Scholar] [CrossRef]
  4. Abbasi, A.; Shayegani, A.; Niayesh, K. Contribution of design parameters of SiR insulators to their DC pollution flashover performance. IEEE Trans. Power Del. 2014, 29, 1814–1821. [Google Scholar] [CrossRef]
  5. Yin, F.; Farzaneh, M.; Jiang, X.L. Electrical performance of composite insulators under icing conditions. IEEE Trans. Dielectr. Electrl. Insul. 2014, 21, 2584–2593. [Google Scholar] [CrossRef]
  6. Zhang, C.Y.; Wang, L.M.; Guan, Z.C.; Zhang, F.Z. Pollution flashover performance of full-scale ±800 kV converter station post insulators at high altitude area. IEEE Trans. Dielectr. Electrl. Insul. 2013, 20, 717–726. [Google Scholar] [CrossRef]
  7. Liu, Y.; Du, B.X. Pattern identification of surface flashover induced by discrete water droplets on polymer insulator. IEEE Trans. Dielectr. Electrl. Insul. 2014, 21, 1972–1981. [Google Scholar] [CrossRef]
  8. Liu, Y.; Du, B.X. Recurrent plot analysis of leakage current in dynamic drop test for hydrophobicity evaluation of silicone rubber insulator. IEEE Trans. Power Del. 2013, 28, 1996–2003. [Google Scholar] [CrossRef]
  9. Wardman, J.; Wilson, T.; Hardie, S.; Bodger, P. Influence of volcanic ash contamination on the flashover voltage of HVAC outdoor suspension insulators. IEEE Trans. Dielectr. Electrl. Insul. 2014, 21, 1189–1197. [Google Scholar] [CrossRef]
  10. Gouda, O.E.; El Dein, A.Z. Experimental techniques to simulate naturally polluted high voltage transmission line insulators. IEEE Trans. Dielectr. Electrl. Insul. 2014, 21, 2199–2205. [Google Scholar] [CrossRef]
  11. Qi, B.; Li, C.R.; Hao, Z.; Geng, B.B.; Xu, D.G.; Liu, S.Y.; Deng, C. Surface discharge initiated by immobilized metallic particles attached to gas insulated substation insulators: process and features. IEEE Trans. Dielectr. Electr. Insul. 2011, 18, 792–800. [Google Scholar] [CrossRef]
  12. Jiang, X.L.; Liu, Y.; Meng, Z.G.; Long, C.H.; Jin, X.; Zhang, Z.J. Effect of fog-haze on AC flashover performance of insulator. High Volt. Eng. 2014, 40, 3311–3317. [Google Scholar]
  13. Wang, J.; Chen, L.H.; Liu, Y.; Liang, X.D. Effect of the electric field on the contamination accumulation characteristic of the insulators. High Volt. Eng. 2011, 37, 585–593. [Google Scholar]
  14. Guan, Z.C.; Wang, L.M.; Yang, B.; Lai, Q.; Ding, N.; Wang, H.; Liu, W. Study on the polluted regularity of insulators quantitatively described by partial surface conductivity. In Proceedings of 2001 International Symposium on Electrical Insulating Materials (ISEIM 2001), Himeji, Japan, 19–22 November 2001; pp. 293–296.
  15. Casale, E.P.; Que, W.G.; Sebo, S.A. Distribution of salt contamination in the course of fog chamber tests of polymer insulators. In Proceedings of 2002 Annual Report Conference on Electrical Insulation and Dielectric Phenomena, Cancun, Quintana Roo, Mexico, 20–24 October 2002; pp. 359–362.
  16. Li, Y.; Wang, J.; Liang, X.D.; Liu, Y.Y. Adhesion force measurement of electrical insulating materials by atomic force microscopy. In Proceedings of Power Engineering and Automation Conference (PEAM), Wuhan, China, 18–20 September 2012; pp. 1–5.
  17. Zhong, Y.; Peng, Z.R.; Liu, P.; Wu, X.Q. The influence of charged sand particles on the external insulation performance of composite insulators in sandstorm condition. In Proceedings of 8th International Conference on Properties and Applications of Dielectric Materials, Bali, Indonesia, June 2006; pp. 542–545.
  18. Wang, B.; Liang, X.D.; Zhang, Y.B.; Luo, B.; Li, Z.Y.; Zhou, Y.X. Natural pollution test of composite and porcelain insulators under AC and DC stress. High Volt. Eng. 2009, 35, 2322–2328. [Google Scholar]
  19. Wang, B.; Chen, H.J.; Chen, W. A preliminary discussion on accumulated contamination regular pattern on composite insulators. Hebei Electric Power. 2003, 22, 30–32. [Google Scholar]
  20. Tang, C.Y.; Liang, X.D. A brief introduction to service performance and natural contamination test on abroad DC polymeric insulators. Power System Technology. 1999, 23, 50–53. [Google Scholar]
  21. Deng, H.M.; He, Z.H.; Xu, Y.H.; Ma, J.; Li, J. Effects of haze environment on discharge path under lightning impulses. High Volt. Eng. 2009, 35, 2669–2673. [Google Scholar]
  22. Wang, L.M.; Liu, D.; Chen, F.L.; Mei, H.W.; Lu, M. Simulation method and testing apparatus of fog-haze. High Volt. Eng. 2014, 40, 3297–3304. [Google Scholar]
  23. Liu, Y.Y.; Li, Y.; Wang, J.; Liang, X.D. Adhesion force and long-range attractive force between contamination particles and insulator surface. High Volt. Eng. 2014, 40, 1010–1016. [Google Scholar]
  24. El-Zohri, E.H.; Abdel-Salam, M.; Shafey, H.M. Mathematical modeling of flashover mechanism due to deposition of fire-produced soot particles on suspension insulators of a HVTL. Electric Power Syst. Res. 2013, 95, 232–246. [Google Scholar] [CrossRef]
  25. Liu, Y.; Du, B.X.; Du, D.M. Pattern analysis on dielectric breakdown characteristics of biodegradable polyethylene film under nonuniform electric field. Int. Trans. Electr. Energy Syst. 2013, 23, 72–82. [Google Scholar] [CrossRef]
  26. Du, B.X.; Liu, Y. Pattern analysis of discharge characteristics for hydrophobicity evaluation of polymer insulator. IEEE Trans. Dielectr. Electrl. Insul. 2011, 18, 114–121. [Google Scholar] [CrossRef]
  27. Hao, L.; Lewin, P.L.; Hunter, J.A.; Swaffield, D.J.; Contin, A.; Walton, C.; Michel, M. Discrimination of multiple PD sources using wavelet decomposition and principal component analysis. IEEE Trans. Dielectr. Electrl. Insul. 2011, 18, 1702–1711. [Google Scholar] [CrossRef]
  28. Carraz, F.; Rain, P.; Tobazéon, R. Particle-initiated breakdown in a quasi-uniform field in transformer oil. IEEE Trans. Dielectr. Electrl. Insul. 1995, 2, 1052–1063. [Google Scholar] [CrossRef]

