Article

Integrated SNG Production in a Typical Nordic Sawmill

1
Energy Engineering, Luleå University of Technology, SE-97187 Luleå, Sweden
2
Process Energy Engineering, Solvina, SE-42130 Västra Frölunda, Sweden
*
Author to whom correspondence should be addressed.
Energies 2016, 9(5), 333; https://doi.org/10.3390/en9050333
Submission received: 4 February 2016 / Revised: 12 April 2016 / Accepted: 25 April 2016 / Published: 30 April 2016

Abstract

:
Advanced biomass-based motor fuels and chemicals are becoming increasingly important to replace fossil energy sources within the coming decades. It is likely that the new biorefineries will evolve mainly from existing forest industry sites, as they already have the required biomass handling infrastructure in place. The main objective of this work is to assess the potential for increasing the profit margin from sawmill byproducts by integrating innovative downstream processes. The focus is on the techno-economic evaluation of an integrated site for biomass-based synthetic natural gas (bio-SNG) production. The option of using the syngas in a biomass-integrated gasification combined cycle (b-IGCC) for the production of electricity (instead of SNG) is also considered for comparison. The process flowsheets that are used to analyze the energy and material balances are modelled in MATLAB and Simulink. A mathematical process integration model of a typical Nordic sawmill is used to analyze the effects on the energy flows in the overall site, as well as to evaluate the site economics. Different plant sizes have been considered in order to assess the economy-of-scale effect. The technical data required as input are collected from the literature and, in some cases, from experiments. The investment cost is evaluated on the basis of conducted studies, third party supplier budget quotations and in-house database information. This paper presents complete material and energy balances of the considered processes and the resulting process economics. Results show that in order for the integrated SNG production to be favored, depending on the sawmill size, a biofuel subsidy in the order of 28–52 €/MWh SNG is required.

Graphical Abstract

1. Introduction

Sweden has a large sawmill industry with an annual production capacity of about 16.1 million cubic meters of sawn wood in 2013 [1]. The corresponding amount of biomass by-products, in the form of woodchips, bark and sawdust, is about the same in terms of dry mass [2]. Biomass utilization has been gaining interest as a means to achieve the targets related to the reduction of greenhouse gas emissions and to the increase of the share of renewables in the energy mix. Woody-biomass is one of the important renewable energy sources (RES) that are globally expected to play a major role in mitigating the dependence of modern society on fossil-based resources for household, industry and transportation energy use. There are, however, several problems associated with the different forms of RES, such as the uneven distribution of the resources around the globe, the insufficient availability of the resources (as long as the objective is to fulfill a significant share of the global primary energy demand according to the best conversion technology known today) and the difficulties with storing them (in the case of intermittent resources, such as solar and wind) [3].
It is essential that biomass can be converted to energy products that correspond to the standards of existing fossil-based energy carriers, such as electricity, chemicals, gas and transportation fuels. The merits in doing so include the alleviation of the burden on the environment from greenhouse gas emissions (bioenergy is considered as CO2 neutral) and utilization of the existing infrastructure (trade and supply network of the long-established products) and applications [3,4,5,6,7,8].
A typical case is the production of biomass-based substitute/synthetic natural gas (bio-SNG) from lignocellulosic biomass. The bio-SNG process has been gaining interest as a promising downstream technology via thermal gasification of biomass. Several plausible alternative processes are reported in the literature; see, e.g., [3,6,9,10,11,12,13]. The production of SNG from biomass is generally considered to be made of three main process stages: gasification of the lignocellulosic biomass into raw syngas (mainly composed of H2, CO, CO2 and CH4 on a dry basis), methanation (catalytic conversion of the syngas into crude SNG) and upgrading of the crude SNG to the gas pipeline specifications (which implies CO2 and H2O removal). Others studies (see, e.g., [14,15,16,17]) also focus on the production of SNG from various renewable energy resources, such as wind and solar via electrolysis of water to produce hydrogen, which afterwards is used in hydrogenation of CO2 to produce SNG.
In this work, the potential for upgrading the by-products of a typical Nordic sawmill into bio-SNG is investigated from a techno-economic point of view. The main technologies considered for the bio-SNG production are a pressurized bubbling fluidized bed reactor (see, e.g., [18]) for the thermal gasification of biomass, the Imperial Chemical Industry (ICI) process [6] for methanation and amine-based CO2 separation (see, e.g., [19]) for bio-SNG upgrade. In addition, the investigation includes the option of utilizing the product gas in a biomass-integrated gasification combined cycle (b-IGCC) in order to produce heat and electricity. In turn, the b-IGCC configuration has two alternative options: supplying low temperature thermal energy to a district heat (DH) system or condensing the steam below atmospheric pressure in order to maximize the electrical output.
The paper is organized as follows. Section 2 presents a description of the considered processes. The methodologies used for process integration, as well as for energetic and economic evaluations are presented in Section 3. Section 4 summarizes the results and includes a discussion about the most significant findings.

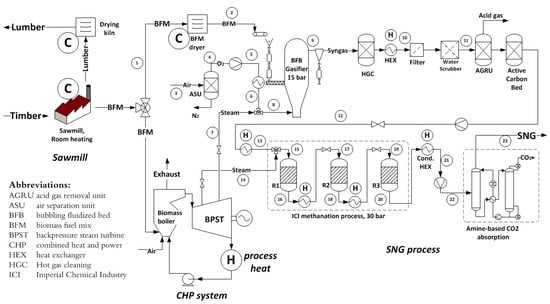
2. Process Description

2.1. Sawmill

The sawmill is a process industry that converts timber (the round beam section of a tree, without branches and tops) into lumber (wooden board used in wood industries and construction). In so doing, sawmills produce a large quantity of by-products (in the form of woodchips, sawdust and bark) that can be utilized by innovative bioenergy technologies.
The model of a typical Nordic sawmill is taken from [2]. Accordingly, about 47% of the timber input is converted into lumber (the main product) on a dry mass basis. The remaining 53% is a by-product with respect to the sawmill process. This by-product, the biomass fuel mix (BFM), is composed of woodchips (about 26% of the timber input on a dry mass basis), bark (19%) and sawdust (8%). If the sawmill is not integrated with other processes/plants that can supply heat, an amount of BFM corresponding to 10.3% of the timber input on a dry mass basis has to be consumed internally in a dedicated furnace mainly to satisfy the lumber drying process [2]. In fact, timber is initially supplied at 55%–60% moisture content, while lumber has a final moisture content of 18%. Therefore, the lumber drying process is quite energy intensive and is carried out by circulating heated outdoor air through packages of lumber that are placed in dedicated rooms called drying kilns. The outdoor air, initially at 2 °C, is heated to about 75 °C and is continuously supplied to the drying kilns to replace the humidified air inside the kilns.

2.2. SNG Process

The SNG process consists of a biomass dryer, an air separation unit (ASU), a bubbling fluidized bed gasifier, gas cleaning units, SNG synthesis units and a CO2 separation unit; see Figure 1. Oxygen and steam gasification is chosen because it already produces a small amount of methane, and a detailed description of the process model is reported in [20]. The biomass fuel, initially at 55%–60% moisture content, is dried to a final moisture content of about 10% using hot air as the drying medium in a belt conveyor dryer. The drying air and the dried biomass exit the dryer at the same final temperature of about 110 °C. In the gasifier, a mixture of steam and O2 is used as a gasifying agent. The flow rate of steam is kept constant at the steam to biomass ratio of 0.5 kg/kg-biomass, while the flow rate of O2 is adjusted to keep the gasification temperature at 850 °C. The ICI process [6] is chosen for the SNG synthesis units to achieve a high conversion to methane. The ICI process consists of three fixed bed catalytic exothermic reactors in series (adiabatic equilibrium reactors), and methanation is assumed to proceed according to reactions R1 and R2.
CO 2   + 4 H 2 CH 4 + 2 H 2 O     Δ H 298 K O = 165  kJ / mol
CO + 3 H 2 CH 4 + H 2 O      Δ H 298 K O = 206  kJ / mol
The reactors are fitted with intercooling heat exchangers in between in order to compensate the heat from exothermic reactions. In this work, amine-based CO2 separation is assumed for gas upgrading, as it is a proven technology that is commercially available and used in many industries. The overall SNG process includes also a boiler in which part of the biomass is burnt in order to supply the heat demand of the SNG process, as well as of the sawmill.

2.3. b-IGCC Process

The considered b-IGCC process assumes similar pretreatment, gasification and gas cleaning technologies as in the SNG process except that air is used as a gasifying medium instead of a mixture of oxygen and steam. In this case, the cleaned product gas is first utilized in a stationary gas turbine engine to generate electricity, then the exhaust gas from the gas turbine is sent to an heat recovery steam generator (HRSG) to generate high pressure steam that is expanded in a steam turbine (backpressure or condensing, depending on the bottom cycle configuration of the b-IGCC) to produce additional electricity. In the alternative with DH, a backpressure steam turbine is used that expands the steam down to 1.9 bar (a pressure level that is suitable to satisfy the sawmill heat demand). The heat derived from steam condensation is first used to satisfy the sawmill thermal deficit, and then, the rest is supplied to the DH system. In the alternative without DH, the steam that is not used to satisfy the thermal demand of the sawmill is expanded down to 0.05 bar in a condensing turbine to generate additional power instead of supplying heat to a DH system.

3. Methodology

Process integration techniques are used to evaluate the profitability of integrating a typical Nordic sawmill with the production of biomass gasification-based bio-SNG and/or power under different process configurations and sawmill sizes. The mass and energy balances of the processes are obtained from plant models developed in MATLAB and Simulink. In all of the cases, the amount of available BFM is limited to the amount of by-products from the considered sawmill size. The mass and energy balances of each process configuration are further constrained by the fulfillment of the heat demand of the sawmill.
Under these conditions, the following three process configurations have been considered:
  • Integration of the bio-SNG production process described in Section 2;
  • Integration of a b-IGCC system that produces electricity and heat for a DH system;
  • Integration of a b-IGCC system with the sole purpose of producing electricity.

3.1. Process Integration

The processes considered in this work involve hot thermal streams at different temperature levels. This surplus of thermal energy can be used to supply the heat demand of the sawmill, the heat and steam demand of the bio-SNG process and, potentially, to cogenerate electricity in a steam Rankine cycle. Accordingly, the HEATSEP method [21] is applied to the flowsheets of the processes (including the sawmill and the steam Rankine cycle) in order to assess the synergy among them. The HEATSEP method allows one to focus on the basic process units of a system configuration by replacing the potential heat transfer devices with the so-called “thermal cuts”. The thermal streams (hot and cold) across the cuts are then grouped into a “black box” where heat exchange interactions are assumed to take place without predefined stream matches. The temperatures at the boundaries of the thermal cuts and the mass flow rates of the streams are included among the decision variables during the search for the optimal configuration and design parameters of the different processes (see, e.g., [22], in which the objective function is to maximize the net power output of a steam Rankine cycle that is shared among different processes in a pulp and paper mill). The feasibility of the heat transfer inside the “black box” is a constraint of the optimization problem and is verified according to the problem table algorithm [23].
In this work, the temperatures (and several of the mass flow rates) across the thermal cuts in the bio-SNG process, in the b-IGCC process and in the sawmill are fixed, so they are not considered among the decision variables of the optimization problem. The fixed values for these quantities are subject to change according to the capacity of the sawmill, mainly because the efficiencies of the components improve when the size is increased. As a result, the corresponding hot and cold thermal loads are not exactly proportional to the capacity of the sawmill, although the configurations of the system remain the same as the sizes are varied. The design parameters of the steam Rankine cycle are therefore those that have to be optimally tuned in order to generate the maximum power from the exploitation of the heat pockets of the grand composite curve of the other processes in the integrated industrial site. These optimal parameters will then depend on the system configuration and on the size of the sawmill.
The bio-SNG process requires steam at 15 and 30 bars during the gasification and methanation steps, respectively. In the process configuration with SNG production only, the surplus heat from the high temperature streams of the bio-SNG process is not enough to generate the amount of steam required, so a boiler that burns a fraction of the available BFM is included in the flowsheet in order to satisfy the deficit. This imposes an additional constraint on the amount of BFM retained for bio-SNG production. The steam cycle is designed to generate steam at pressures that are high enough to meet the bio-SNG process steam demand while cogenerating electricity in a steam turbine. The heat demand of the sawmill is also satisfied using condensing steam at 1.9 bar. It should also be noted that an amount of feed water equal to the amount of steam consumed by the gasification and methanation processes must be continuously supplied to the steam Rankine cycle. As a result, the decision variables are the maximum cycle pressure and temperature of the steam Rankine cycle, the mass flow rate of steam that remains in the steam cycle and the split fraction of the BFM that goes to the boiler (this last one, however, is heavily affected by constraints on the grand composite curve in the middle and high temperature ranges).
On the contrary, the b-IGCC process configurations involve high temperature hot streams resulting in a surplus heat that is larger than the demands of the b-IGCC process and of the sawmill. In this case, the steam Rankine cycle is mainly designed to exploit the excess heat for cogenerating electricity and to add flexibility for the heat transfer interactions among the different processes. In fact, the design of the steam Rankine cycle helps with minimizing the exergy destruction that would have occurred if the high temperature hot streams were used to supply directly low temperature heat demands, such as that of the sawmill. The decision variables in both of the alternative b-IGCC process configurations are the maximum cycle pressure and temperature of the steam Rankine cycle and the mass flow rate of the water/steam that remains in the combined heat and power (CHP) system. The only difference in the settings of the optimization problem between the two process configurations is that an additional constraint is introduced in the alternative without the DH system, so that the amount of steam condensed at 1.9 bar is exactly the one required to satisfy the sawmill heat demand.

3.2. Thermodynamic Indicators

The energy indicators of the SNG and b-IGCC process configurations are evaluated according to Equations (1)–(4). The system boundaries and energy flows used to define the indicators are illustrated in Figure 1. The indicator in Equation (1) compares the energy associated with the BFM input to the gasifier to the chemical energy of the final bio-SNG output, and it is often referred to as the cold gas efficiency. It is worth noting that the denominator of this indicator accounts only for the biomass by-products entering the gasifier. Equation (2) represents the overall energy efficiency of the bio-SNG process by accounting for all of the major flows crossing system boundaries; see Figure 2. Equations (3) and (4) measure the overall energy efficiency of the b-IGCC process with and without the DH option, respectively.
η cg = m ˙ SNG LHV SNG m ˙ BFM to  gasifier LHV BFM
η en , SNG = m ˙ SNG LHV SNG + Q ˙ th , sawmill + W ˙ el , net m ˙ BMF LHV BMF
η en​ , b-IGCC​ + DH = W ˙ el , net + Q ˙ th , sawmill + Q ˙ DH m ˙ BMF LHV BMF
η en​ , b-IGCC = W ˙ el , net + Q ˙ th , sawmill m ˙ BMF LHV BMF
The three process configurations are also evaluated according to their overall exergy efficiencies, using Equations (5)–(7). In the b-IGCC process alternative with the DH system, it is assumed that the thermal energy supplied to the DH system could be converted into electricity with a thermal efficiency equal to 10%.
η ex , SNG = m ˙ SNG e SNG + W ˙ el , net m ˙ BMF e BMF
η ex , b-IGCC + DH = W ˙ el , net + η ex , DH el Q ˙ DH m ˙ BMF e BMF
η ex , b-IGCC = W ˙ el , net m ˙ BMF e BMF

3.3. Economic Indicators

The economic evaluation is performed by taking into account the operating costs and the investment costs for the equipment that is involved in the flowsheet of the processes. The capital investment is estimated by evaluating the cost of each component in the major process equipment from literature data according to its size. All cost values are updated to the Euro value of 2013. Commodity prices are those of the last quarter of 2013, and exchange rates used for currency conversions (i.e., 8.86 SEK/€ and 6.43 SEK/$) are those of the same period. Two approaches have been adopted for estimating the total capital investment.
The cost associated with the process units that have been designed in detail in this study (such as the heat exchanger network (HEN), turbomachinery, steam cycle components and methanation reactors) is estimated according to [24]. The installed cost ( C in ) of process equipment can be correlated to the bare module cost by Equation (8):
C in , i = ( 1 + f 1 ) C BM , i + f 2 C BM , i 0
where C BM , i and C BM , i 0 represent the bare module cost of equipment i evaluated in the actual process operating conditions and in the base case conditions (i.e., ambient pressure and carbon steel construction), respectively. Coefficient f 1 accounts for contingency and fee costs depending on the reliability of cost data and completeness of the process flowsheet. A value of 18% is used (15% and 3% of the bare module cost in the actual operating conditions for contingency and fee costs, respectively [24]). Coefficient f 2 accounts for the costs related to site development, auxiliary building and utilities. A value of 50% of the bare module cost in the base case conditions is assumed [24]. Further information on the relationships between the equipment bare module cost and purchase cost can be found in Appendix A.
The capital cost of the HEN is estimated from the mass flow rates and the temperatures of the thermal streams in the black box of the HEATSEP method, as they result from the optimization of the process configurations. The loads of the heat exchangers are determined by matching the streams according to the hot and cold composite curves. The area of heat exchangers and then the cost are determined by applying appropriate heat transfer coefficients (depending on the nature of the streams) and minimum temperature differences ( Δ T min ) that would result in a reasonable heat transfer area for any match among the streams.
The cost associated with the remaining major process units (such as biomass pretreatment, gasification, gas cleaning and bio-SNG upgrading) are estimated by scaling published data using the power law of capacity. The reference costs and sizes used for estimating the purchase cost of these process units are documented in Appendix A, Table A1. The actual equipment purchase cost of a single component is first estimated using the power law of capacity by scaling it from a similar component with known cost and size according to a scaling exponent. The equipment purchase cost is then multiplied by an overall installation factor (also presented in Table A1) to obtain the installed cost of the process unit. In this case, the installed equipment cost is related to the purchase cost according to Equation (9):
C in , j = f j C E , j
where f j and C E , j represent the overall installation factor and equipment purchase cost, respectively. The capital investment (CI) is then calculated using Equation (10) as the sum of Equations (8) and (9). The bare module equipment costs are estimated based on sizing parameters and cost factors reported in Appendix A, Table A2.
CI = [ 1.18 i = 1 n C BM , i + 0.5 i = 1 n C BM , i 0 ] + j = 1 m f j C E , j
The internal rate of return (IRR) on the investment is evaluated as the economic indicator for the considered cases. Table 1 presents a list of the market prices and the other economic parameters that have been assumed.

4. Results and Discussion

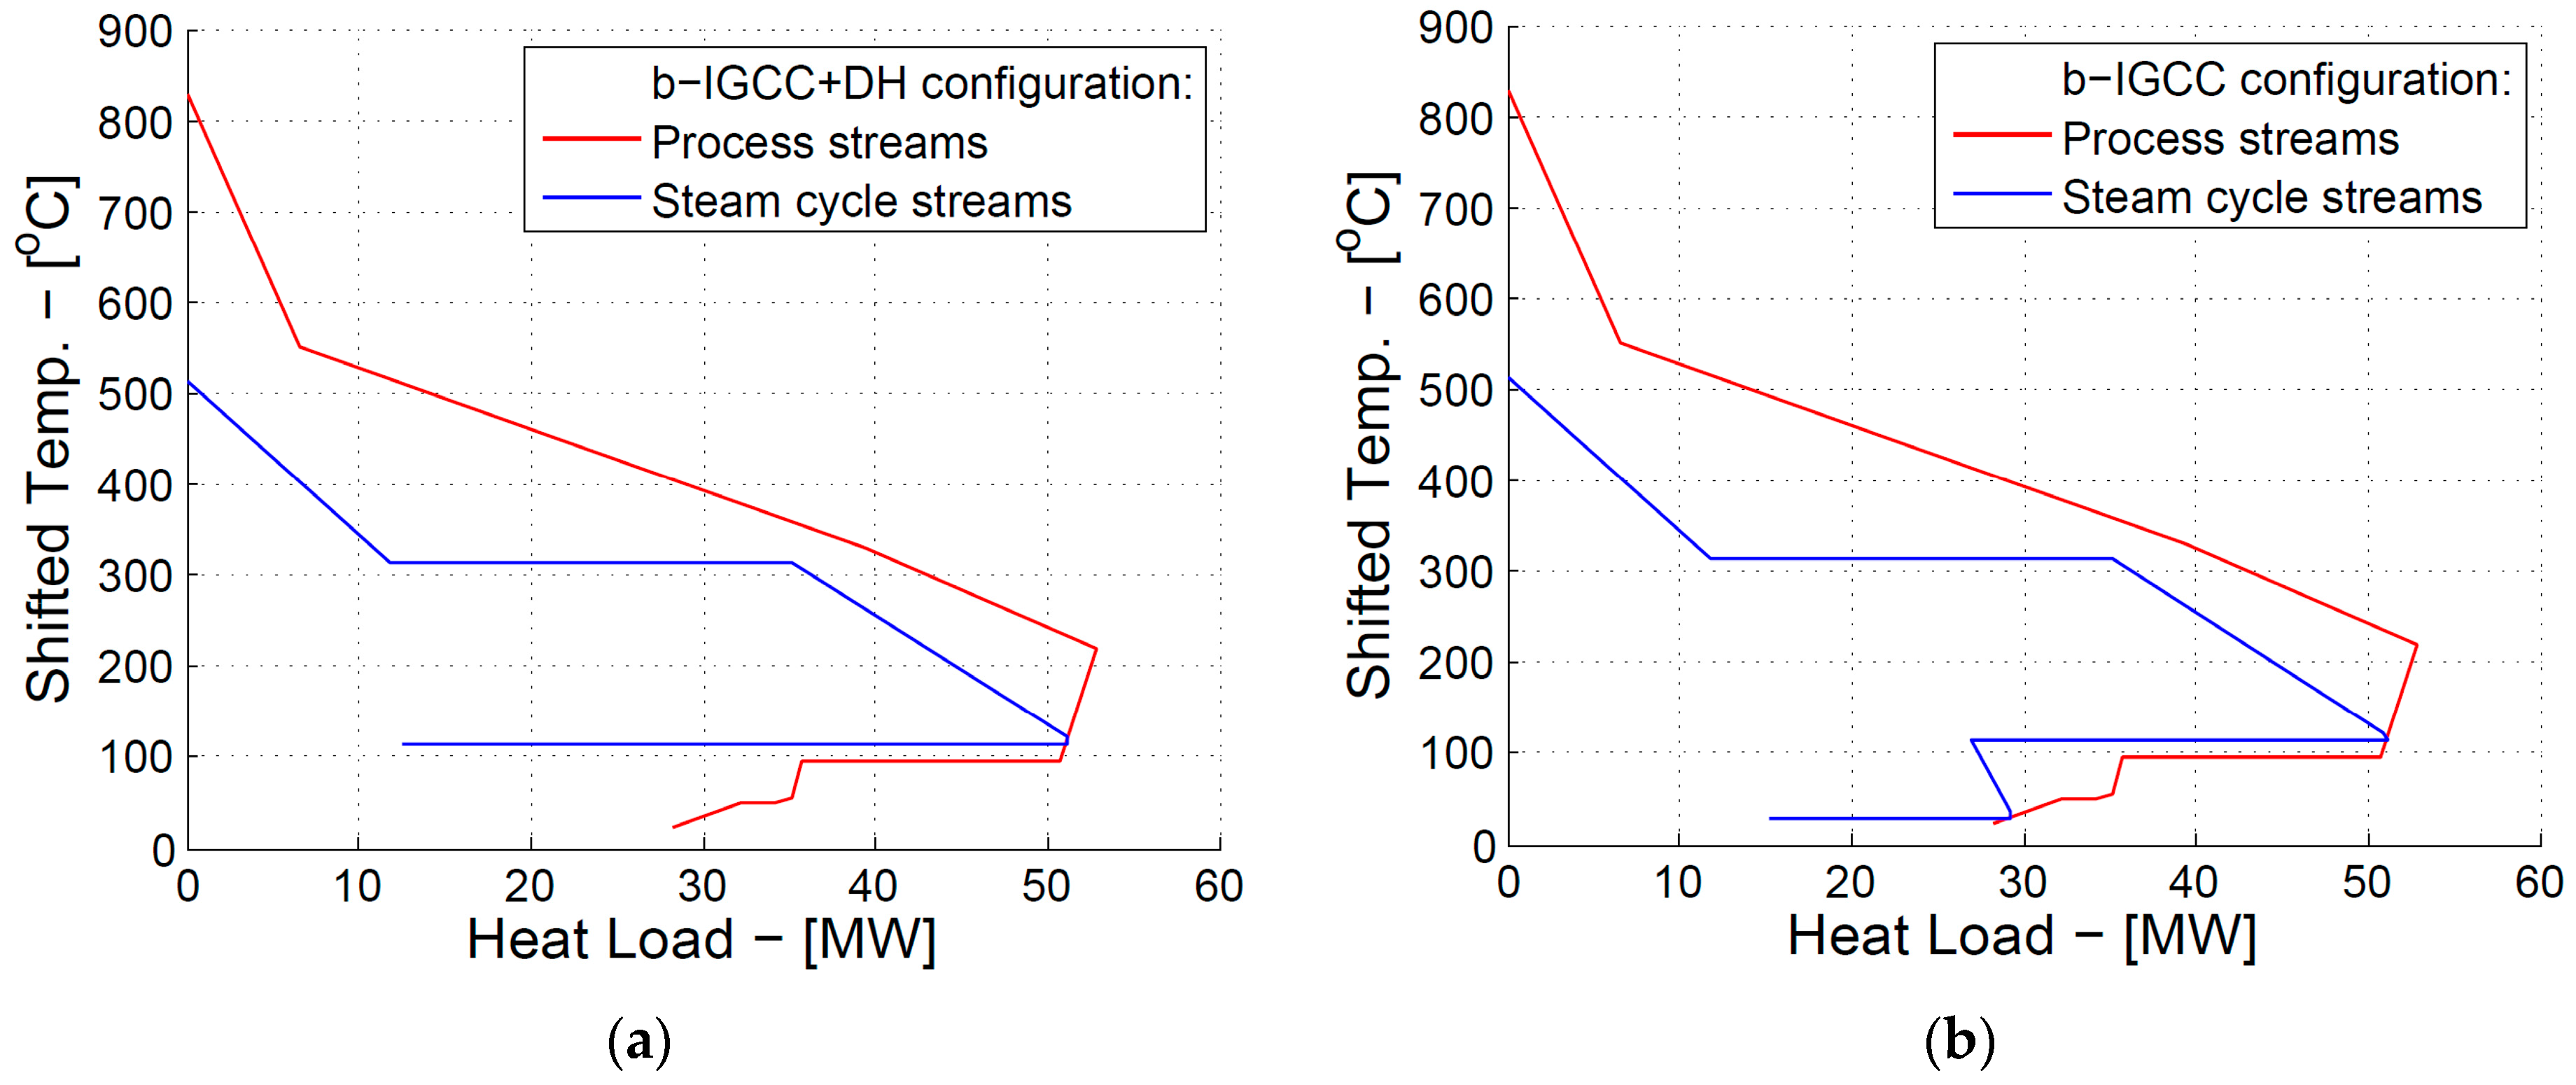
4.1. Integrated Grand Composite Curves of the Three Configurations

Figure 3 and Figure 4 present the integrated grand composite curves of the three process configurations for the largest sawmill size. The distinctive features of the bio-SNG configuration (Figure 3, red curve) are the radiative heat from the biomass boiler (the horizontal segment at 850 °C) and the demand for process steam generation at about 310 °C (which is the same as the temperature level of the upper horizontal segment of the blue curve). In order to maximize the BFM input to the bio-SNG process, the amount of steam generated in the steam cycle is just enough to satisfy the heat deficit and steam demand of the integrated industrial site (sawmill plus bio-SNG process); see Section 3.1 for further details.
The heat pockets in the red curves of the b-IGCC configuration (Figure 4) are mainly a result of product gas cooling (from 850 °C), the recovery of heat from the exhaust gases of the gas turbine (from 550 °C) and the thermal demand of the sawmill (at 75 °C). In both cases, the steam Rankine cycle exploits these pockets for generating steam (the three upper segments of the blue curves) and satisfies the heat demands of the sawmill (and that of the DH system in Figure 4a) in the lower temperature range using condensing steam (the lower horizontal segment of the blue curves). The blue curve in Figure 4b also shows a further steam condensation level that follows the additional expansion in the condensing turbine. A detailed discussion regarding b-IGCC in the context of integrated forest industries can be found in [26].

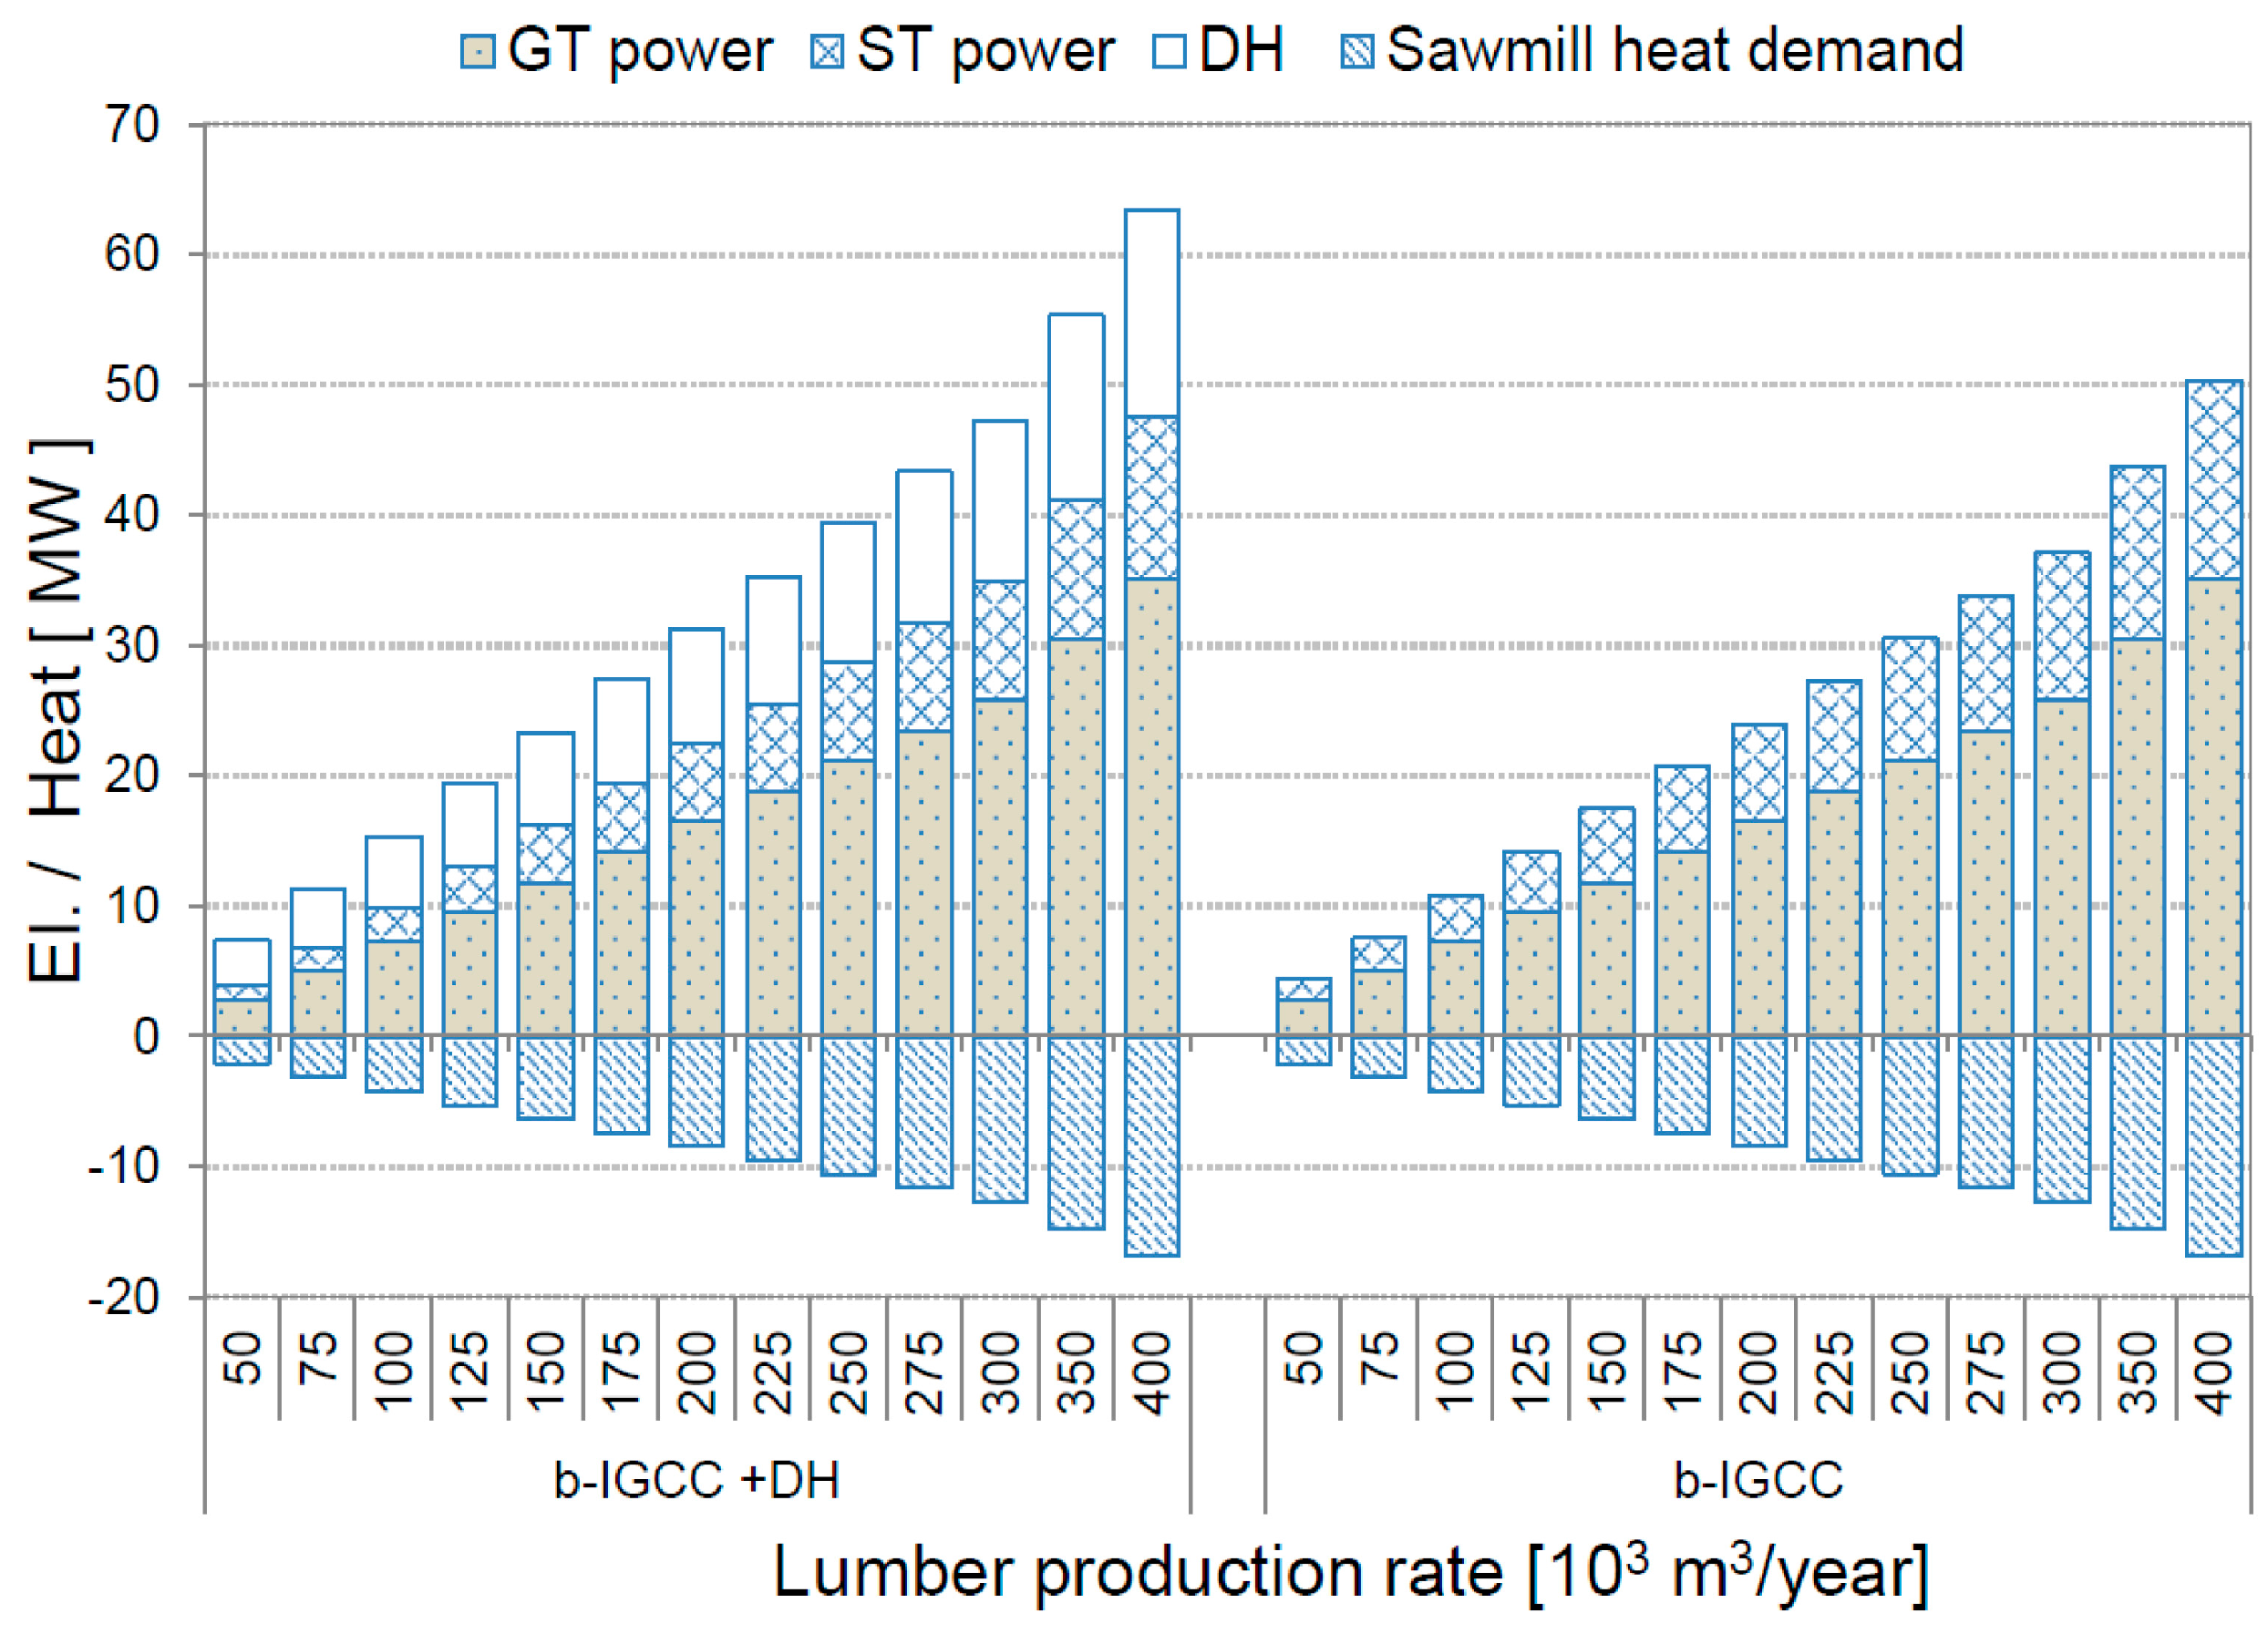
4.2. Energetic Perspective

The magnitudes of the energy streams of the bio-SNG process configuration, defined according to the system boundaries shown in Figure 2, are summarized in Table 2 for all of the considered sawmill sizes. In order to reflect on the thermodynamic performance of the bio-SNG process, a generic evaluation of the process flowsheet is presented in Appendix B, Table B1 (description of streams) and Table B2 (thermodynamic state and compositions of streams).
The magnitude of the energy output streams of the b-IGCC process configurations are presented in Figure 5 for all of the considered sawmill sizes and for both configuration alternatives (with and without DH systems). It appears that the power production in the b-IGCC configuration without DH is higher than that in the other configuration. This is expected since the steam that is condensed to supply heat to the DH in one alternative is expanded in a condensing steam turbine to generate additional power in the other. In both b-IGCC configuration alternatives, the heat provided to satisfy the sawmill demand is represented as a negative contribution to indicate that it is a constraint that must be satisfied.
The overall energy efficiencies of the considered process configurations (defined by Equations (2)–(4)) are compared in Figure 6a as a function of sawmill size. It appears that the b-IGCC configuration with the DH system results in the highest overall energy efficiency (62%–66%, increasing with sawmill size), followed by the bio-SNG process configuration (about 55%–56% for all of the sawmill sizes considered). The b-IGCC configuration without the DH system has always the lowest overall efficiency (from 43%–55%, increasing with sawmill size).
Figure 6b compares the exergy efficiencies of the considered process configurations, as defined by Equations (5)–(7). It appears that the ranking of the three process configurations is completely changed: the highest exergy efficiency is that of the bio-SNG configuration (41%–42%, with increasing efficiency as the sawmill size increases), then the b-IGCC configuration without the DH system (30%–41%, increasing with sawmill size) and, finally, the b-IGCC configuration with the DH system (29%–40%, increasing with sawmill size).
It is worth noting that the b-IGCC configuration with the DH system has the highest energy efficiency and the lowest exergy efficiency because of the low temperature heat output, which is a big amount in terms of energy, but not significant in terms of exergy (the exergy of the electric output from the condensing turbine is higher).

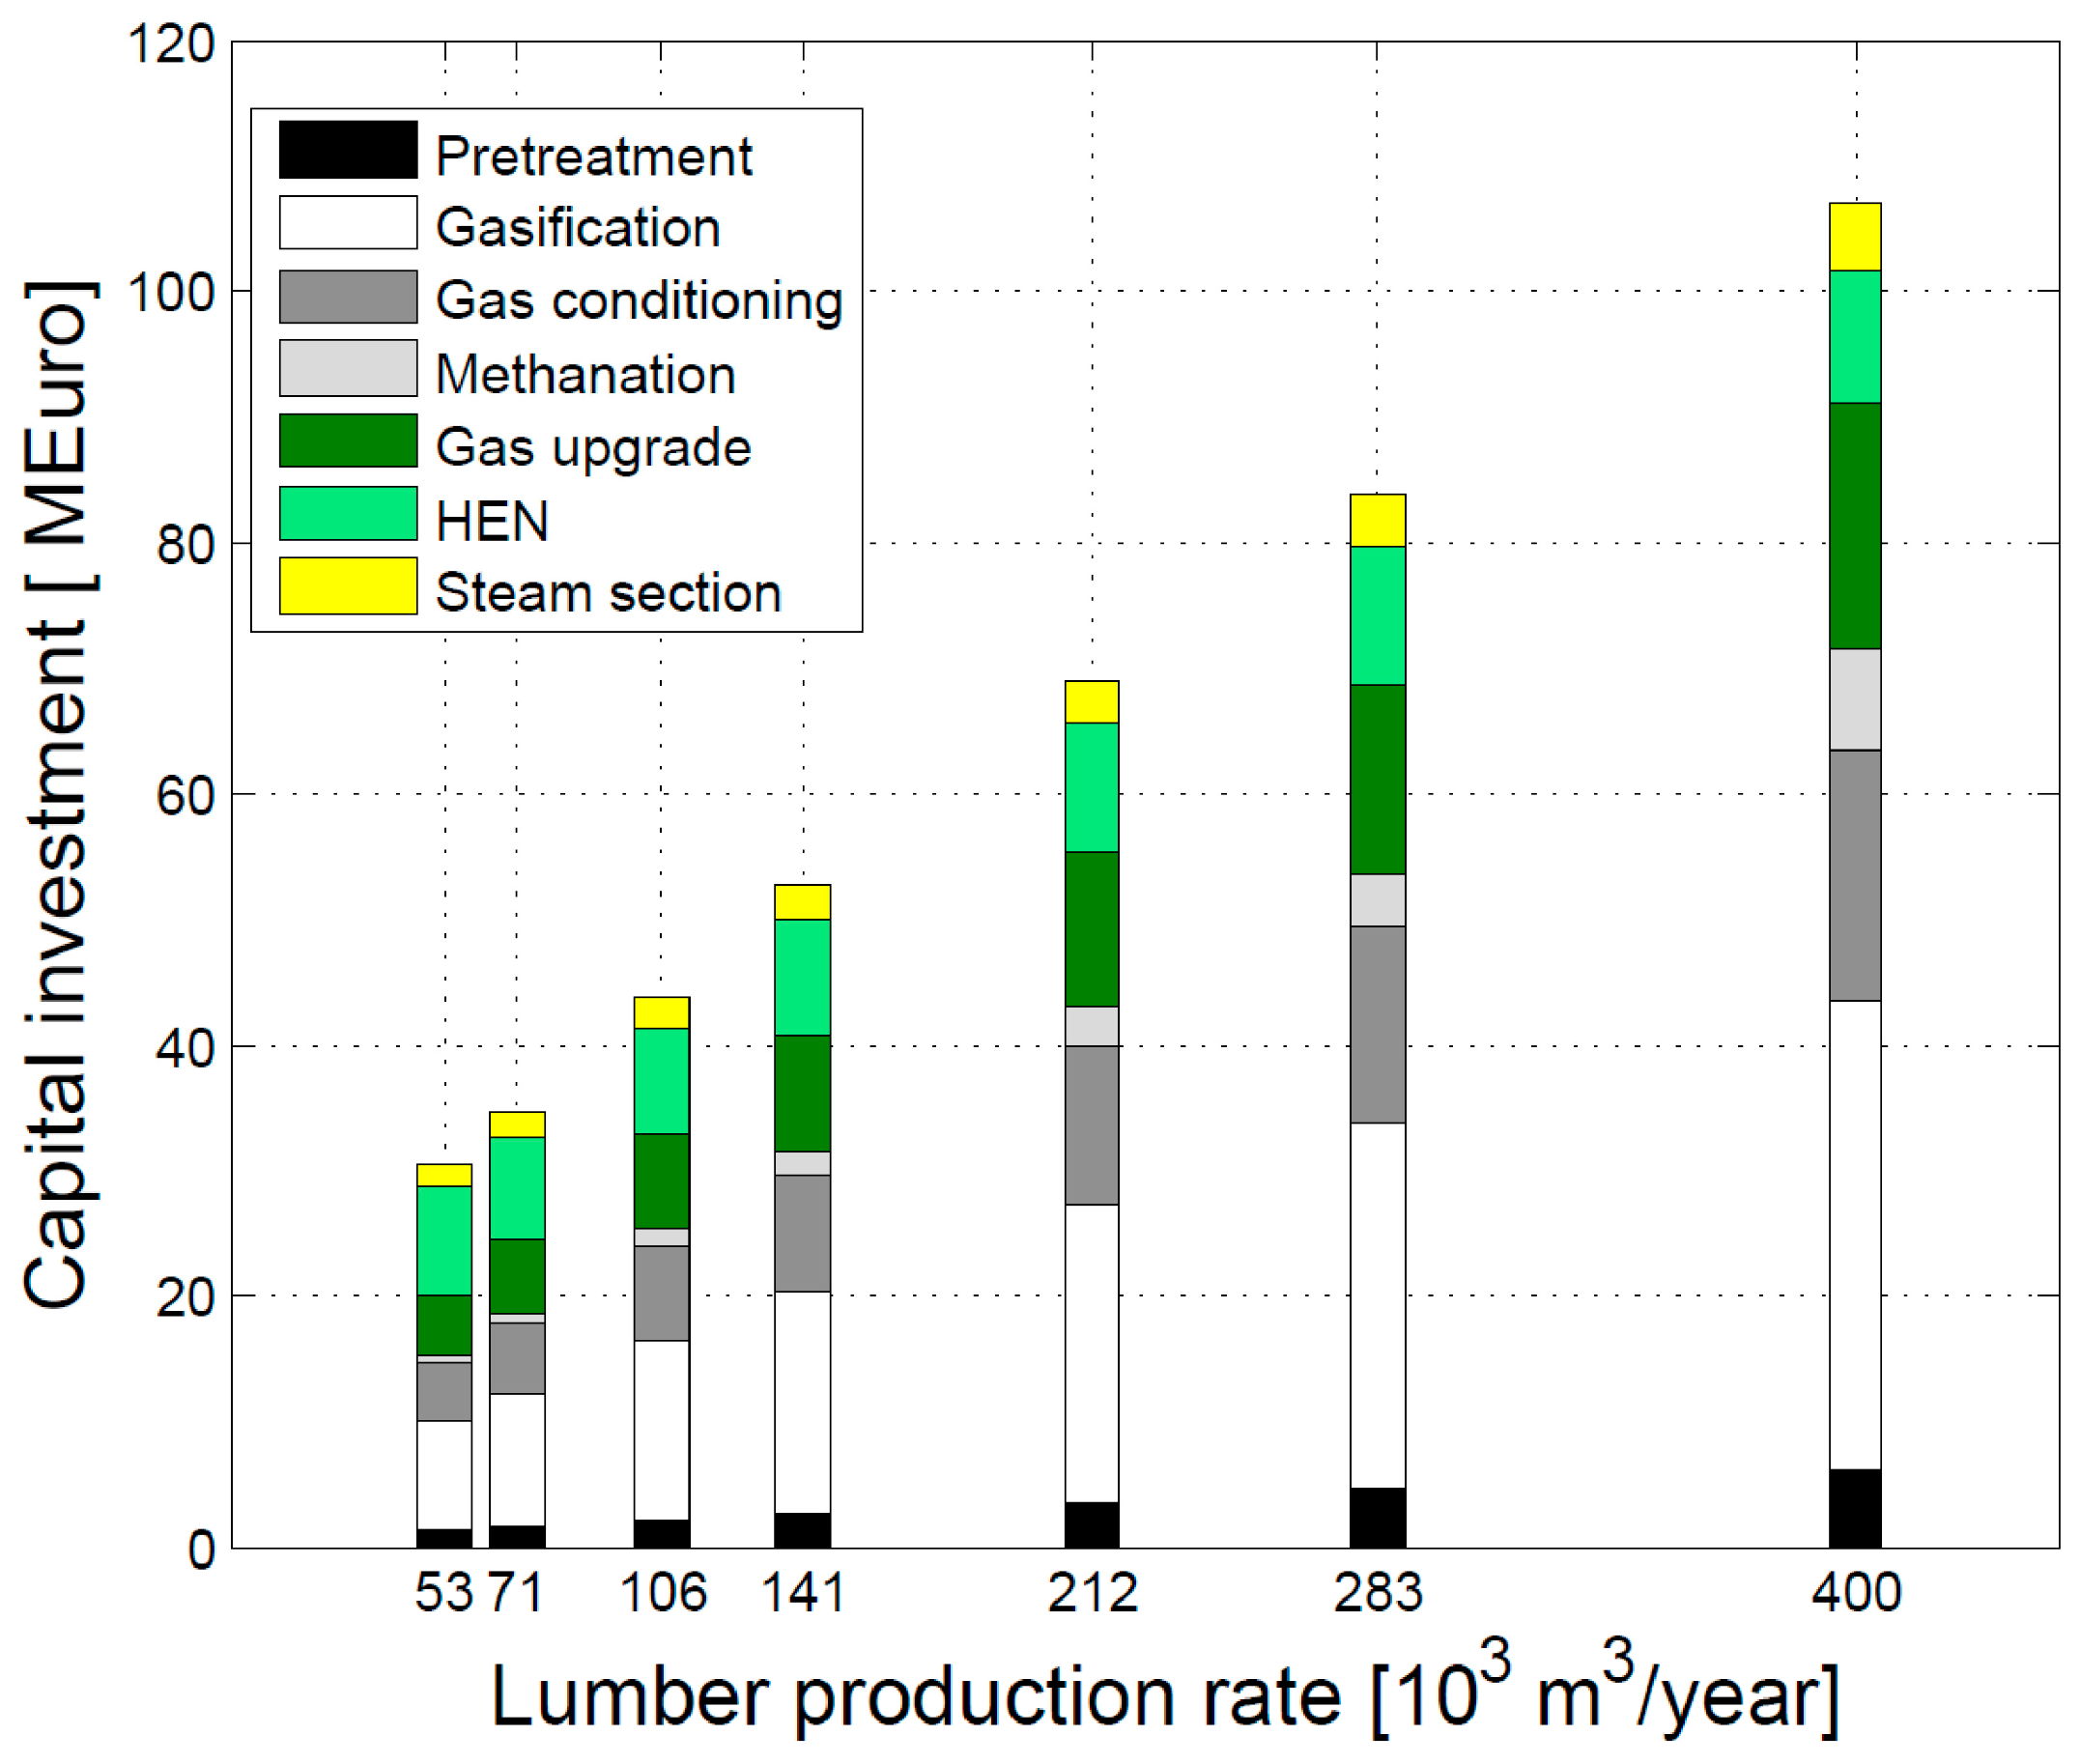
4.3. Economic Perspective

Figure 7 shows how the capital cost shares of the different sections in the bio-SNG process configuration change as the size of the sawmill is varied. For a sawmill annual lumber production greater than 71,000 m3, the investment is largely dominated by the cost of the gasification process (23%–35%, with an increasing share as the sawmill size increases). For sawmill annual lumber production capacities lower than 71,000 m3, the share associated with the HEN dominates the capital cost (10%–30%, with an increasing share as the sawmill size decreases). The shares of the other sections are generally lower: gas conditioning and upgrade 13%–18% each, with an increasing share as sawmill size increases; methanation 3%–9%, with an increasing share as sawmill size increases; steam section and pretreatment, about 5% each.
Bio-SNG and electricity selling prices that would allow one to obtain the imposed IRR values of 4%, 8% and 12% are calculated backwards. Thermal energy for district heating in the b-IGCC + DH case and electricity in the bio-SNG case are considered as by-products and sold at the current market price. The results are presented in Figure 8. The ranges for the market price of natural gas required to meet the imposed IRR values are 77–123 €/MWh (4%), 87–146 €/MWh (8%) and 99–171 €/MWh (12%), the lower values being of course obtained with the larger sawmills. A policy supporting biofuels is therefore required to make the bio-SNG process configuration profitable, but it also appears that in any case, a subsidy would not be reasonable for the sawmill sizes below 106,000 m3 of lumber per year due to the economy-of-scale effects. For example, biofuel subsidy certificates in the range of 28–52 €/MWh (decreasing as sawmill size increases) are required in order to break-even (4% IRR) for the bio-SNG processes integrated with a sawmill having an annual lumber production greater than 106,000 m3. The subsidy levels estimated here are generally higher compared to previous studies. In [27,28], 24–42 €/MWh was reported for similar processes, but with considerably larger biomass input (150–400 MW compared to 20–125 MW in this work). Of course, this difference can be explained by the different economy-of-scale, which plays a role in reducing the levels of required subsidy.
Should future policy measures allow the biogenic CO2 separated during gas upgrading to be included in the emission trading system, additional income can be obtained in the form of emission certificates. For example, additional income in the range of 4–6 €/MWh of bio-SNG produced (increasing with sawmill size) can be achieved by assuming that the benefit from the biogenic CO2 sequestration certificates is equal to the penalty for fossil CO2 emission charges and by deducting the CO2 transportation (13 €/tCO2 [29]) and storage (9 €/tCO2 [29]) expenses.
In the b-IGCC configuration alternative with DH, the ranges for the electricity market price required to meet the imposed IRR values are 74–191 €/MWh (4%), 85–234 €/MWh (8%) and 98–282 €/MWh (12%). In the alternative without DH, they become 82–197 €/MWh (4%), 92–235 €/MWh (8%) and 104–278 €/MWh (12%). Apparently, the b-IGCC alternative with DH results in lower values of market prices for electricity compared to the alternative without DH. This is because the amount of heat provided to the DH system is relatively large compared to the size of the sawmill. For example, about 0.13 TWh would be provided annually to a DH system with the largest sawmill size. However, it could be a problem, if not impossible, to find a market for this waste heat if the location of sawmills were inconvenient for DH consumers and in the case of large seasonal fluctuations of the DH demand.

5. Conclusions

The energetic and economic perspectives were investigated regarding the integration of different biomass gasification-based technologies for upgrading sawmill by-products on-site. The main focus was on whether, or under what conditions, the investment in a plant producing bio-SNG from sawmill by-products is economically viable. The option of utilizing sawmill by-products in a b-IGCC configuration to produce electricity (and heat for a DH system in one alternative) was also explored for comparison.
With a limited availability of relatively low cost BFM, it is essential to choose between the production of bio-SNG and that of electricity/heat. If the production of bio-SNG is prioritized, perhaps in order to support the utilization of biofuels in the transport sector, large-scale plants (i.e., sawmills having an annual lumber production greater than 106,000 m3) with ambitious biofuel subsidy requirements (28–52 €/MWh) are to be favored. In a less ambitious biofuel subsidy scenario, the b-IGCC configuration with the DH system is more attractive compared to the alternative without the DH system, although both cases resulted in a cost for electricity production that is higher than its market value.

Acknowledgments

The authors would like to thank Bio4Energy, a strategic research environment appointed by the Swedish government, for supporting this work.

Author Contributions

Mesfun and Umeki designed the process configurations and developed the mathematical models with data input from Anderson regarding Nordic sawmills. Mesfun and Toffolo performed the process integration and optimization analyses. All authors contributed to the preparation of the manuscript.

Conflicts of Interest

The authors declare no conflict of interest.

Abbreviations

AEquipment sizing parameter
BFMBiomass fuel mix
b-IGCCBiomass integrated gasification combined cycle
bio-SNGBiomass-based synthetic natural gas
CEPCIChemical engineering plant cost index
CICapital investment
DReactor vessel diameter
DHDistrict heat
HENHeat exchanger network
IRRInternal rate of return
LHVLower heating value
POperating pressure (bar)
RESRenewable energy sources
SNGSynthetic/substitute natural gas
Sets
iSet of equipment for which cost estimates are made based on the module costing method.
jSet of equipment for which cost estimates are recalculated based on the published cost data or in-house database.
Parameters
CBM,iBare module cost of equipment i calculated at the actual process conditions
C BM , i 0 Bare module cost of equipment i calculated at the base rating
CE,jCost of equipment j recalculated from the data in Table A1
C p , i o Purchase cost of equipment i calculated according to the module costing method at the base rating
fBMBare module factor
fjOverall installation factor of equipment j
fmEquipment construction material factor
fpPressure factor
ΔTminMinimum temperature difference
Coefficients
BCoefficients for evaluating the bare module factor
CCoefficients for evaluating the pressure factor
KCoefficients for estimating the equipment cost at the base rating

Appendix A

Equipment Purchase Cost Data

Table A1. Reference size parameter used for estimating purchased equipment cost.
UnitOriginal Unit Cost a (M€2013)Reference Size ParameterInstallation Factor b fjScaling Exponent cReference
Biomass Handling
Conveyor0.3633.5 ton/h20.8[5,30]
Belt conveyor dryer d2.20959,000 m3/h (air)20.8[31]
Grinding0.3533.5 ton/h20.6[5,30]
Feeding system0.4333.5 ton/h21.0[5,30]
Gasification
Direct gasifier (BFB) e40.8358 MWth (LHV)20.72[30]
ASU25.7576 ton O2/day1.50.75[30]
Gas Cleaning
Hot gas cleaning31.374.1 m3/s gas flow1.861.0[5,30]
Fabric filter0.7215.6 m3/s gas flow1.860.7[5,30]
Water scrubber2.7612.1 m3/s gas flow1.860.7[5,30]
Acid gas removal unit6.921.31 m3/s gas flow1.860.7[5,30]
Guard Bed
Activated carbon bed0.0258 Nm3/s gas flow31.0[30]
Methanation (ICI)
Reactor 1 fCost of reactor vessels, excluding heat exchangers and catalyst material. Prices are estimated according to the module costing method.[24]
Reactor 2 f
Reactor 3 f
Catalyst material g0.121 ton [32]
SNG Upgrade
CO2 removal h5.553.9 Nm3/s gas flow, 46.7 vol % CO23.80.7[29]
Miscellaneous
CompressorsCost of turbomachinery (centrifugal units) and HEXs (fixed tube). Prices are estimated according to the module costing method.[24]
Steam turbine
Gas turbine
Fan/blower
Heat exchangers
Pump
Electric generator1.4511.8 MWel1.50.94[33]
a Cost data have been updated to €2013 using the composite Chemical Engineering Plant Cost Index (CEPCI). In case the original unit cost has not been given in €, the currency is first converted to € by using the exchange rate of the year in which the money value is reported and then adjusted to the value of €2013 by applying the CEPCI. b Overall installation factor for equipment j. It includes auxiliary equipment and installation labor, engineering and contingencies. Unless values are given by the literature, the overall installation factor is set to 2 for a 70 MWth scale [5]. c Cost scaling is performed using the power law of capacity. d Original equipment cost is estimated using a wet biomass loading of 30 kg/m2 of belt area at a loading rate of 10 kg/s and a drying time (τ) of 2500 s, according to the correlations reported in [31]. It is further assumed that the dryer belt is 10 m wide and that the cover is 6 m high. The scaling exponent is adopted from [30]. e Estimated cost of complete gasifier installation according to the National Renewable Energy Laboratory (NREL) report [34]. The scaling exponent is adopted from [30]. f Original cost calculated from module costing in $2001 [24]. Methanation reactors are considered vertical vessels, the diameter being calculated using a mean superficial gas velocity of 0.14 m/s, with maximum vessel diameter not to exceed 4 m. Vessel height is calculated from a regression of the correlation in [12] for fluidized bed methanation reactors. g Catalyst material cost is calculated according to the correlated data in [32], assuming a space velocity of 4.5 Nm3/(kg-catalyst·h) and using an updated specific catalyst cost of 107 €2013/kg. h The original equipment cost of monoethanolamine (MEA) is estimated based on the €2010 cost estimate of the amine-absorption unit that includes the absorber, stripper, condenser, reboiler, HEXs and pumps. Heyne [29] has studied three different CO2 separation technologies, and amine-absorption is reported to be the best for the overall bio-SNG process economy. A scaling exponent of 0.7 is used [30].
Table A2. Factors used for module costing [24].
Process UnitsSizing parameter Module Cost FactorsEquipment Cost FactorsPressure Factorsfmfp
AB1B2K1K2K3C1C2C3
Methanation Reactors 1–3Gas flow2.251.823.49740.44850.1074---3.5Equation (A6)
CompressorsShaft power-12.28971.3604−0.1027---2.81
Steam turbineShaft power-12.62591.4398−0.1776---3.61
HENArea1.631.664.3247−0.30300.16340.03881−0.112720.081831Equation (A5)
Steam boilerThermal load-16.9617-1.480.31612.594072−4.234761.7224041Equation (A5)
The capital investment is calculated according to Equations (A1)–(A6):
CI = [ 1.18 i = 1 n C BM , i + 0.5 i = 1 n C BM , i 0 ] + j = 1 m f j C E , j
C BM , i = f BM , i C p , i o = C p , i o ( B 1 , i + B 2 , i f m , i f p , i )
C BM , i 0 = C p , i o ( B 1 , i + B 2 , i )
log 10 C p , i o = K 1 , i + K 2 , i log 10 ( A ) + K 3 , i [ log 10 ( A ) ] 2
log 10 f p , i = C 1 , i + C 2 , i log 10 ( P ) + C 3 , i [ log 10 ( P ) ] 2
f p , i = ( P + 1 ) D 2 [ 850 0.6 ( P + 1 ) ] + 0.00315 0.0063

Appendix B

Description of the Streams in the Process Flow Diagram

Table B1. Stream numbers (as depicted in Figure 1) and description.
Stream NumberDescription
1BFM composition as received, i.e., 55% moisture content
2BFM composition prior to gasification, i.e., dried to 10% moisture content
3Air
4Air was converted to oxygen based on the mass balance of oxygen. Compression and actual separation units were omitted, and only the power consumption and “pass rate” was defined; 233 g-O2/kg-air (100% O2); 353 kJ-el/kg-air
5Compressed to 15 bar at an isentropic efficiency of 74%
6Preheated to saturated temperature of steam at 15 bar if the gas temperature is lower than that.
7Saturated steam at 15 bar
8Adiabatic mixing of O2 and steam. The pressure was adjusted to the lower side if there were any pressure difference.
9BFM gasification using O2 steam as the oxidizing agent. The detailed calculation method is stated in our previous publication [20].
10Cooled down to 350 °C to recover heat (it is 350 °C in order to avoid tar condensation).
11Cooled down to room temperature, hence the water was condensed. We assumed that there was a gas cleaning step here, as well.
12Compressed to 30 bar at an isentropic efficiency of 74%
13Heated to 398 °C (according to the data from the ICI process)
14Saturated steam at 30 bar
15Adiabatic mixing of syngas with steam. The pressure was adjusted to the lower side if there were any pressure difference.
16Methanation Reactor 1; 10% of pressure loss and 5% of heat loss (adiabatic equilibrium reactor)
17Heat exchanger (inter-cooling)
18Methanation Reactor 2; 10% of pressure loss and 5% of heat loss (adiabatic equilibrium reactor)
19Heat exchanger (inter-cooling)
20Methanation Reactor 3; 10% of pressure loss and 5% of heat loss (adiabatic equilibrium reactor)
21Condensing heat exchanger (the vapor pressure of the steam remained as saturated pressure after a certain temperature)
22Compressed to 30 bar at an isentropic efficiency of 74%
23Separation of CO2 (98% of CO2 and 1% of CH4 removed); electricity consumption of 0.576 MJ/Nm3 of CO2
Table B2. Streams mass flow rates, thermodynamic state and composition.
Stream NumberMass Flow Rate, Thermodynamic State and Energy ContentSolid Biomass Composition wt %Gas Composition vol %
m (kg/s)P (bar)T (K)h (MJ/kg)LHV (MJ/kg)Q (MW)MoistureCHONAshO2N2H2COCO2H2OCH4
114.091.01275.150.007.44104.8155.0022.992.7518.590.080.59-------
27.041.01348.150.5717.32126.0010.0045.985.5037.180.161.18-------
39.941.01288.150.000.000.00------21.0079.000.000.000.000.000.00
42.421.01288.150.000.000.00------100.000.000.000.000.000.000.00
52.4215.00658.700.360.000.87------100.000.000.000.000.000.000.00
62.4215.00658.700.360.000.87------100.000.000.000.000.000.000.00
73.5215.00491.450.390.001.37------0.000.000.000.000.00100.000.00
85.9515.00535.000.380.002.24------27.930.000.000.000.0072.070.00
912.9115.00993.001.237.64114.47------0.000.0614.9229.167.7943.344.73
1012.9115.00623.000.557.64105.72------0.000.0614.9229.167.7943.344.73
118.0115.00303.150.0212.3298.83------0.000.1126.2651.3213.710.288.32
128.0130.00380.030.1312.3299.69------0.000.1126.2651.3213.710.288.32
138.0130.00671.150.5612.32103.18------0.000.1126.2651.3213.710.288.32
142.8030.00671.150.750.002.10------0.000.000.000.000.00100.000.00
1510.8130.00671.150.619.13105.29------0.000.0818.3035.789.5530.495.80
1610.8127.00998.151.188.07100.02------0.000.0915.2213.6830.8424.7415.43
1710.8127.00598.150.468.0792.32------0.000.0915.2213.6830.8424.7415.43
1810.8124.30748.050.697.4287.70------0.000.112.830.6943.0228.2225.14
1910.8124.30573.150.407.4284.60------0.000.112.830.6943.0228.2225.14
2010.8121.87671.150.557.3985.86------0.000.111.260.1543.5029.0525.94
218.8521.87313.150.039.0280.13------0.000.151.780.2161.090.3436.44
228.8530.00347.670.079.0280.48------0.000.151.780.2161.090.3436.44
231.7530.00347.670.1345.1179.33------0.000.384.470.523.070.8590.71

References

  1. Swedish Statistical Yearbook of Forestry; Christiansen, L. (Ed.) Swedish Forest Agency: Jönköping, Sweden, 2014.
  2. Anderson, J.-O.; Toffolo, A. Improving energy efficiency of sawmill industrial sites by integration with pellet and CHP plants. Appl. Energy 2013, 111, 791–800. [Google Scholar] [CrossRef]
  3. Duret, A.; Friedli, C.; Maréchal, F. Process design of synthetic natural gas (SNG) production using wood gasification. J. Clean Prod. 2005, 13, 1434–1446. [Google Scholar] [CrossRef]
  4. Arvidsson, M.; Morandin, M.; Harvey, S. Biomass gasification-based syngas production for a conventional oxo synthesis plant—Process modeling, integration opportunities, and thermodynamic performance. Energy Fuels 2014, 28, 4075–4087. [Google Scholar] [CrossRef]
  5. Hamelinck, C.N.; Faaij, A.P. Future prospects for production of methanol and hydrogen from biomass. J. Power Sources 2002, 111, 1–22. [Google Scholar] [CrossRef]
  6. Kopyscinski, J.; Schildhauer, T.J.; Biollaz, S.M.A. Production of synthetic natural gas (SNG) from coal and dry biomass—A technology review from 1950 to 2009. Fuel 2010, 89, 1763–1783. [Google Scholar] [CrossRef]
  7. Pihl, E.; Heyne, S.; Thunman, H.; Johnsson, F. Highly efficient electricity generation from biomass by integration and hybridization with combined cycle gas turbine (CCGT) plants for natural gas. Energy 2010, 35, 4042–4052. [Google Scholar] [CrossRef]
  8. Zwart, R.W.R.; Boerrigter, H.; Deurwaarder, E.P.; van der Meijden, C.M.; van Paasen, S.V.B. Production of Synthetic Natural Gas (SNG) from Biomass: Development and Operation of an Integrated Bio-SNG System; ECN-E—06-018; Energy research center of the Netherlands (ECN): Petten, The Netherlands, 2006; p. 62. [Google Scholar]
  9. Gassner, M.; Baciocchi, R.; Maréchal, F.; Mazzotti, M. Integrated design of a gas separation system for the upgrade of crude SNG with membranes. Chem. Eng. Process. Process. Intensif. 2009, 48, 1391–1404. [Google Scholar] [CrossRef]
  10. Van der Meijden, C.M.; Veringa, H.J.; Rabou, L.P.L.M. The production of synthetic natural gas (SNG): A comparison of three wood gasification systems for energy balance and overall efficiency. Biomass Bioenergy 2010, 34, 302–311. [Google Scholar] [CrossRef]
  11. Juraščík, M.; Sues, A.; Ptasinski, K.J. Exergy analysis of synthetic natural gas production method from biomass. Energy 2010, 35, 880–888. [Google Scholar] [CrossRef]
  12. Gassner, M.; Maréchal, F. Thermo-economic process model for thermochemical production of synthetic natural gas (SNG) from lignocellulosic biomass. Biomass Bioenergy 2009, 33, 1587–1604. [Google Scholar] [CrossRef]
  13. Zhang, W.; He, J.; Engstrand, P.; Björkqvist, O. Economic evaluation on bio-synthetic natural gas production integrated in a thermomechanical pulp mill. Energies 2015, 8, 12795–12809. [Google Scholar] [CrossRef]
  14. Davis, W.; Martin, M. Optimal year-round operation for methane production from CO2 and water using wind and/or solar energy. J. Clean Prod. 2014, 80, 252–261. [Google Scholar] [CrossRef]
  15. Davis, W.; Martin, M. Optimal year-round operation for methane production from CO2 and water using wind energy. Energy 2014, 69, 497–505. [Google Scholar] [CrossRef]
  16. Giglio, E.; Lanzini, A.; Santarelli, M.; Leone, P. Synthetic natural gas via integrated high-temperature electrolysis and methanation: Part II—Economic analysis. J. Energy Storage 2015, 2, 64–79. [Google Scholar] [CrossRef]
  17. Giglio, E.; Lanzini, A.; Santarelli, M.; Leone, P. Synthetic natural gas via integrated high-temperature electrolysis and methanation: Part I—energy performance. J. Energy Storage 2015, 1, 22–37. [Google Scholar] [CrossRef]
  18. Gómez-Barea, A.; Leckner, B. Modeling of biomass gasification in fluidized bed. Prog. Energy Combust. Sci. 2010, 36, 444–509. [Google Scholar] [CrossRef]
  19. Shiflett, M.B.; Drew, D.W.; Cantini, R.A.; Yokozeki, A. Carbon dioxide capture using ionic liquid 1-butyl-3-methylimidazolium acetate. Energy Fuels 2010, 24, 5781–5789. [Google Scholar] [CrossRef]
  20. Tanaka, Y.; Mesfun, S.; Umeki, K.; Toffolo, A.; Tamaura, Y.; Yoshikawa, K. Thermodynamic performance of a hybrid power generation system using biomass gasification and concentrated solar thermal processes. Appl. Energy 2014, 160, 664–672. [Google Scholar] [CrossRef]
  21. Lazzaretto, A.; Toffolo, A. A method to separate the problem of heat transfer interactions in the synthesis of thermal systems. Energy 2008, 33, 163–170. [Google Scholar] [CrossRef]
  22. Mesfun, S.; Toffolo, A. Optimization of process integration in a Kraft pulp and paper mill—Evaporation train and CHP system. Appl. Energy 2013, 107, 98–110. [Google Scholar] [CrossRef]
  23. Kemp, C.-I. Pinch Analysis and Process Integration: A User Guide on Process Integration for the Efficient Use of Energy, 2nd ed.; Butterworth-Heinemann Ltd.: Oxford, UK, 2007. [Google Scholar]
  24. Turton, R.; Bailie, R.C.; Whiting, W.B.; Shaeiwitz, J.A. Analysis, Synthesis, and Design of Chemical Processes, 2nd ed.; Printice Hall PTR: Upper Saddle River, NJ, USA, 2003. [Google Scholar]
  25. Heyne, S.; Harvey, S. Assessment of the energy and economic performance of second generation biofuel production processes using energy market scenarios. Appl. Energy 2013, 101, 203–212. [Google Scholar] [CrossRef]
  26. Mesfun, S.; Toffolo, A. Integrating the processes of a Kraft pulp and paper mill and its supply chain. Energy Convers. Manag. 2015, 103, 300–310. [Google Scholar] [CrossRef]
  27. Wetterlund, E.; Söderström, M. Biomass gasification in district heating systems—The effect of economic energy policies. Appl. Energy 2010, 87, 2914–2922. [Google Scholar] [CrossRef]
  28. Börjesson, M.; Ahlgren, E.O. Biomass gasification in cost-optimized district heating systems—A regional modelling analysis. Energy Policy 2010, 38, 168–180. [Google Scholar] [CrossRef]
  29. Heyne, S.; Harvey, S. Impact of choice of CO2 separation technology on thermo-economic performance of bio-SNG production processes. Int. J. Energy Res. 2014, 38, 299–318. [Google Scholar] [CrossRef]
  30. Hamelinck, C.; Faaij, A.; Denuil, H.; Boerrigter, H. Production of FT transportation fuels from biomass; technical options, process analysis and optimisation, and development potential. Energy 2004, 29, 1743–1771. [Google Scholar] [CrossRef]
  31. Li, H.; Chen, Q.; Zhang, X.; Finney, K.N.; Sharifi, V.N.; Swithenbank, J. Evaluation of a biomass drying process using waste heat from process industries: A case study. Appl. Therm. Eng. 2012, 35, 71–80. [Google Scholar] [CrossRef]
  32. Seemann, M.C.; Schildhauer, T.J.; Biollaz, S.M.A. Fluidized bed methanation of wood-derived producer gas for the production of synthetic natural gas. Ind. Eng. Chem. Res. 2010, 49, 7034–7038. [Google Scholar] [CrossRef]
  33. Lazzaretto, A.; Macor, A. Direct calculation of average and marginal costs from the productive structure of an energy system. J. Energy Resour. Technol. 1995, 117, 171. [Google Scholar] [CrossRef]
  34. Worley, M.; Yale, J. Biomass Gasification Technology Assessment Consolidated Report; Contract No. DE-AC36-08GO28308; NREL: Golden, CO, USA, 2012. [Google Scholar]
Figure 1. Bio-SNG production process flowsheet (circles with H and C represent hot and cold thermal streams, respectively).
Energies 09 00333 g001
Figure 2. System boundaries used for evaluating the thermodynamic and economic indicators: bio-SNG process (a) and b-IGCC process (b).
Energies 09 00333 g002
Figure 3. Integrated grand composite curves of the bio-SNG configuration for the largest sawmill size.
Energies 09 00333 g003
Figure 4. Integrated grand composite curves of the b-IGCC configuration with DH (a) and without DH (b) for the largest sawmill size.
Energies 09 00333 g004
Figure 5. Energy streams (electricity (El.) from gas turbine (GT) and steam turbine (ST), heat to the DH system, heat to the sawmill) of the b-IGCC process configurations as a function of sawmill size.
Energies 09 00333 g005
Figure 6. Overall energy (a) and exergy (b) efficiencies of the different process configurations.
Energies 09 00333 g006
Figure 7. Capital cost share of the different sections of the bio-SNG process configuration.
Energies 09 00333 g007
Figure 8. Market price of NG/electricity in order to meet the imposed IRR values.
Energies 09 00333 g008
Table 1. Market price and other economic parameters used in the evaluation of the IRR.
ParameterUnitValue
Investment interest rate%4
Economic life timeYear20
Annual operational time (top)Hour8000
Operators ap. b/shift6
Operator salary €/(p.·year)55,000
Maintenance cost (Com)% of CI5
BFM price (CBFM) c€/MWhLHV22
Electricity (Cel) (including CO2 charge) c€/MWhel68
Natural gas (including CO2 charge) c€/MWhLHV48
District heating thermal energy c€/MWhth35
CO2 charge (input) c€/tCO236
Renewable electricity policy support c€/MWhel7
Tax on profit%22
a Full time operation requires 4 shifts per day; b personnel (p.) for the largest sawmill size; for the other sizes, an exponent equal to 0.7 is used to scale down operator salary costs; c price levels represent the Swedish market in 2013 [25].
Table 2. Energy streams and indicators of the bio-SNG process configuration for the different sawmill sizes.
ParameterUnitSawmill Sizes
Annual lumber production103 m34002832121411067153
BFM availableMWLHV122.986.8565.1343.4232.5721.7116.28
BFM to biomass boiler%42.9942.9342.9943.1943.2742.8842.23
SNG productionMWLHV45.2331.9923.9815.9411.958.056.13
Sawmill thermal loadMWth16.9111.958.965.984.482.992.24
Cold gas efficiency (Equation (1))%64.5564.5464.5664.6164.6664.9565.12
Wobbe indexMJ/Nm344.9644.8744.7444.4844.1842.3641.49
Power generationMWel11.347.545.573.662.711.671.14
Power consumptionMWel4.463.152.361.571.170.780.59
Net power exportMWel6.884.393.212.101.540.890.55
Energy efficiency (Equation (2))%56.1755.6555.5055.3055.1754.9854.77
Exergy efficiency (Equation (5))%42.4041.8841.7441.5441.4141.2241.01

