
Assessment of Air-Pollution Control Policy’s Impact on China’s PV Power: A System Dynamics Analysis

Abstract
:1. Introduction
2. Air-Pollution Control Policy
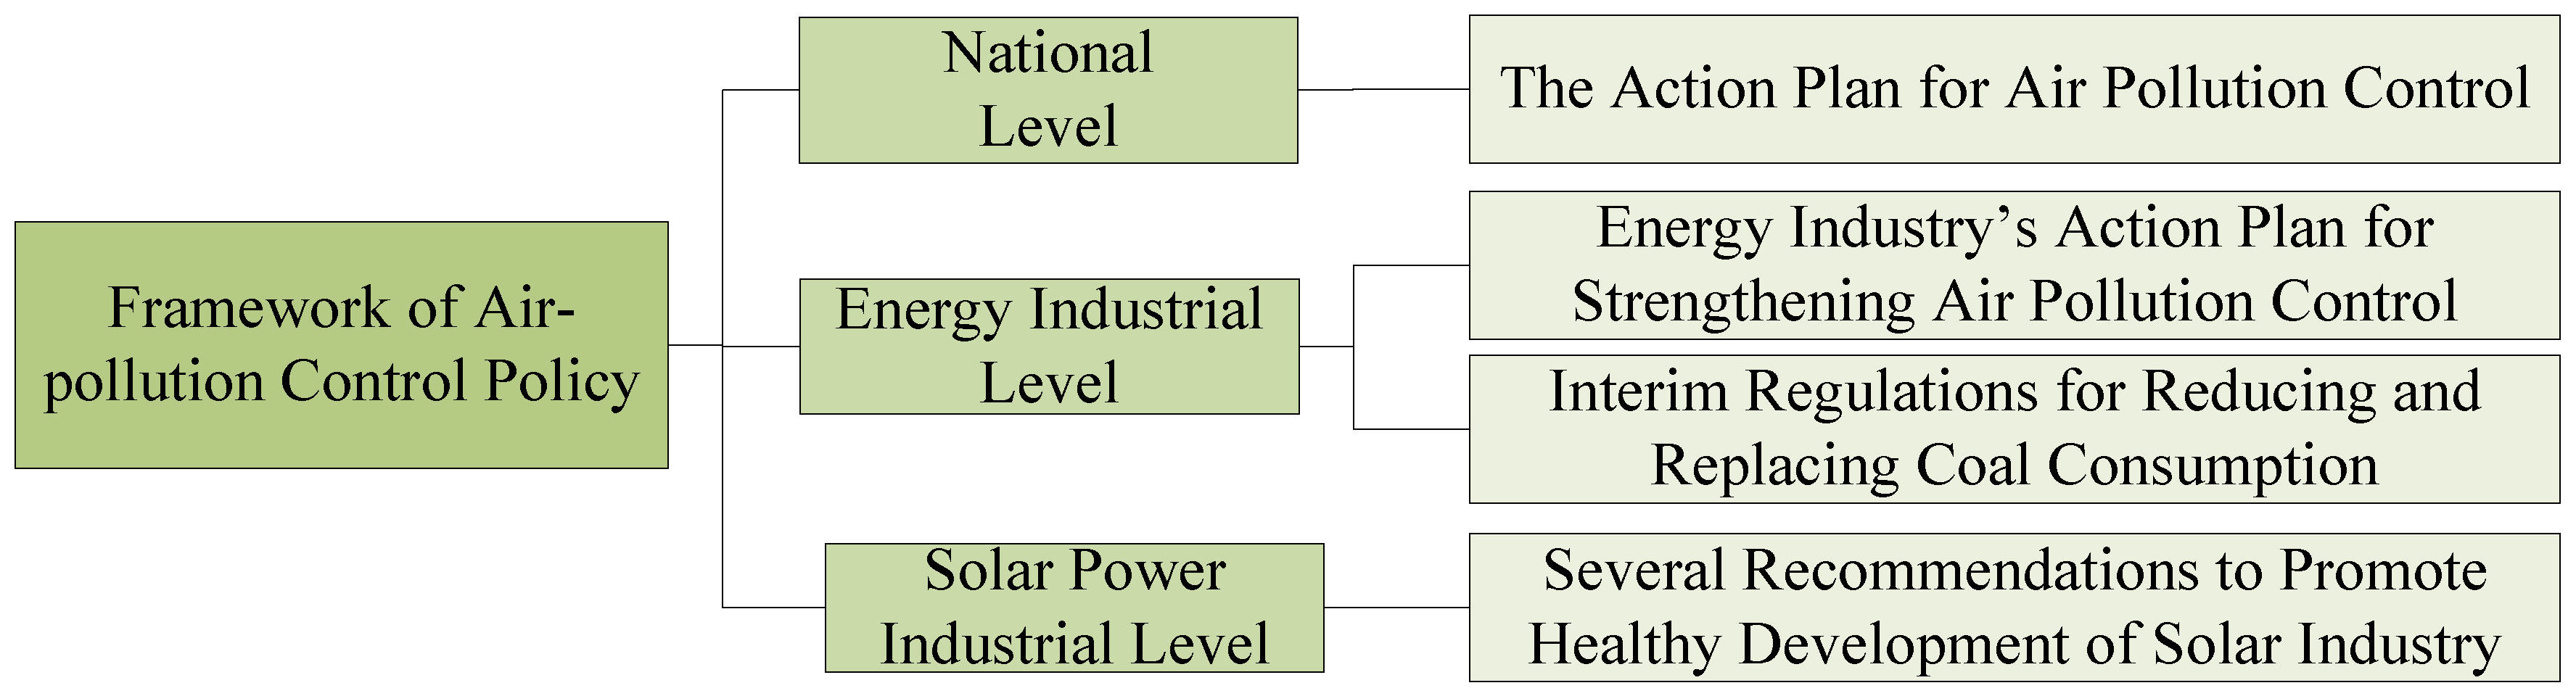
2.1. Framework of Air-Pollution Control Policy
2.2. Analysis of Air-Pollution Policy Contents
3. Methodology
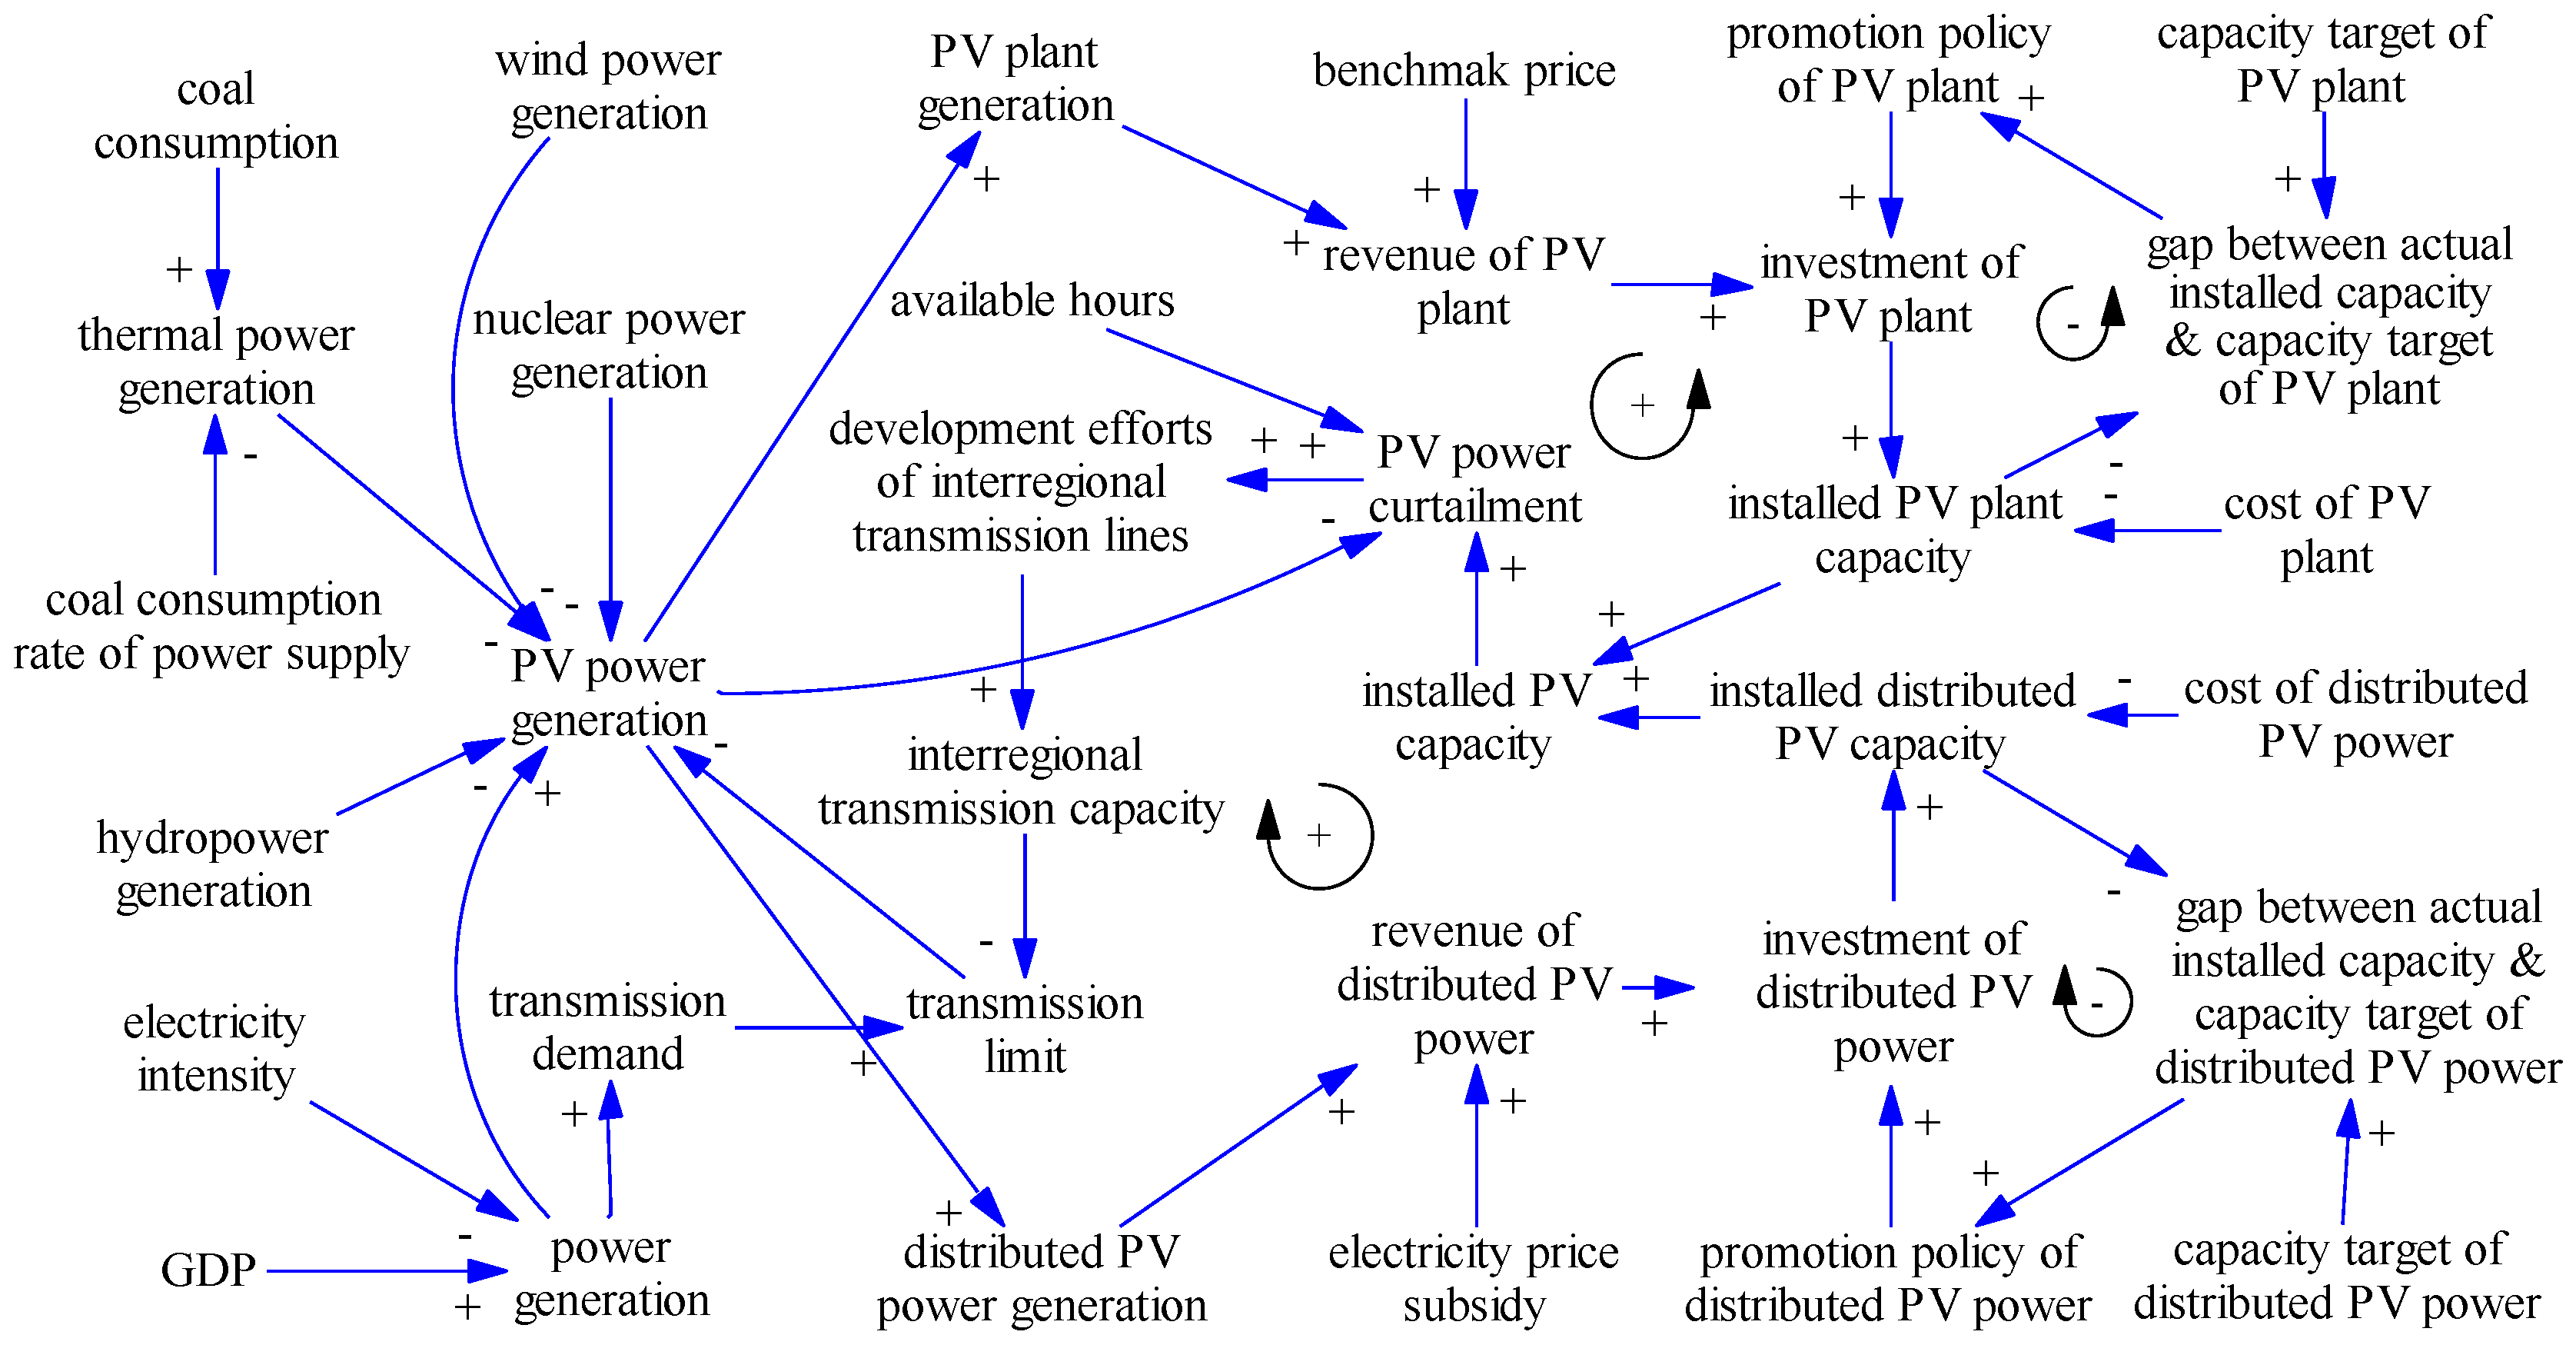
3.1. Causal Loop Diagram
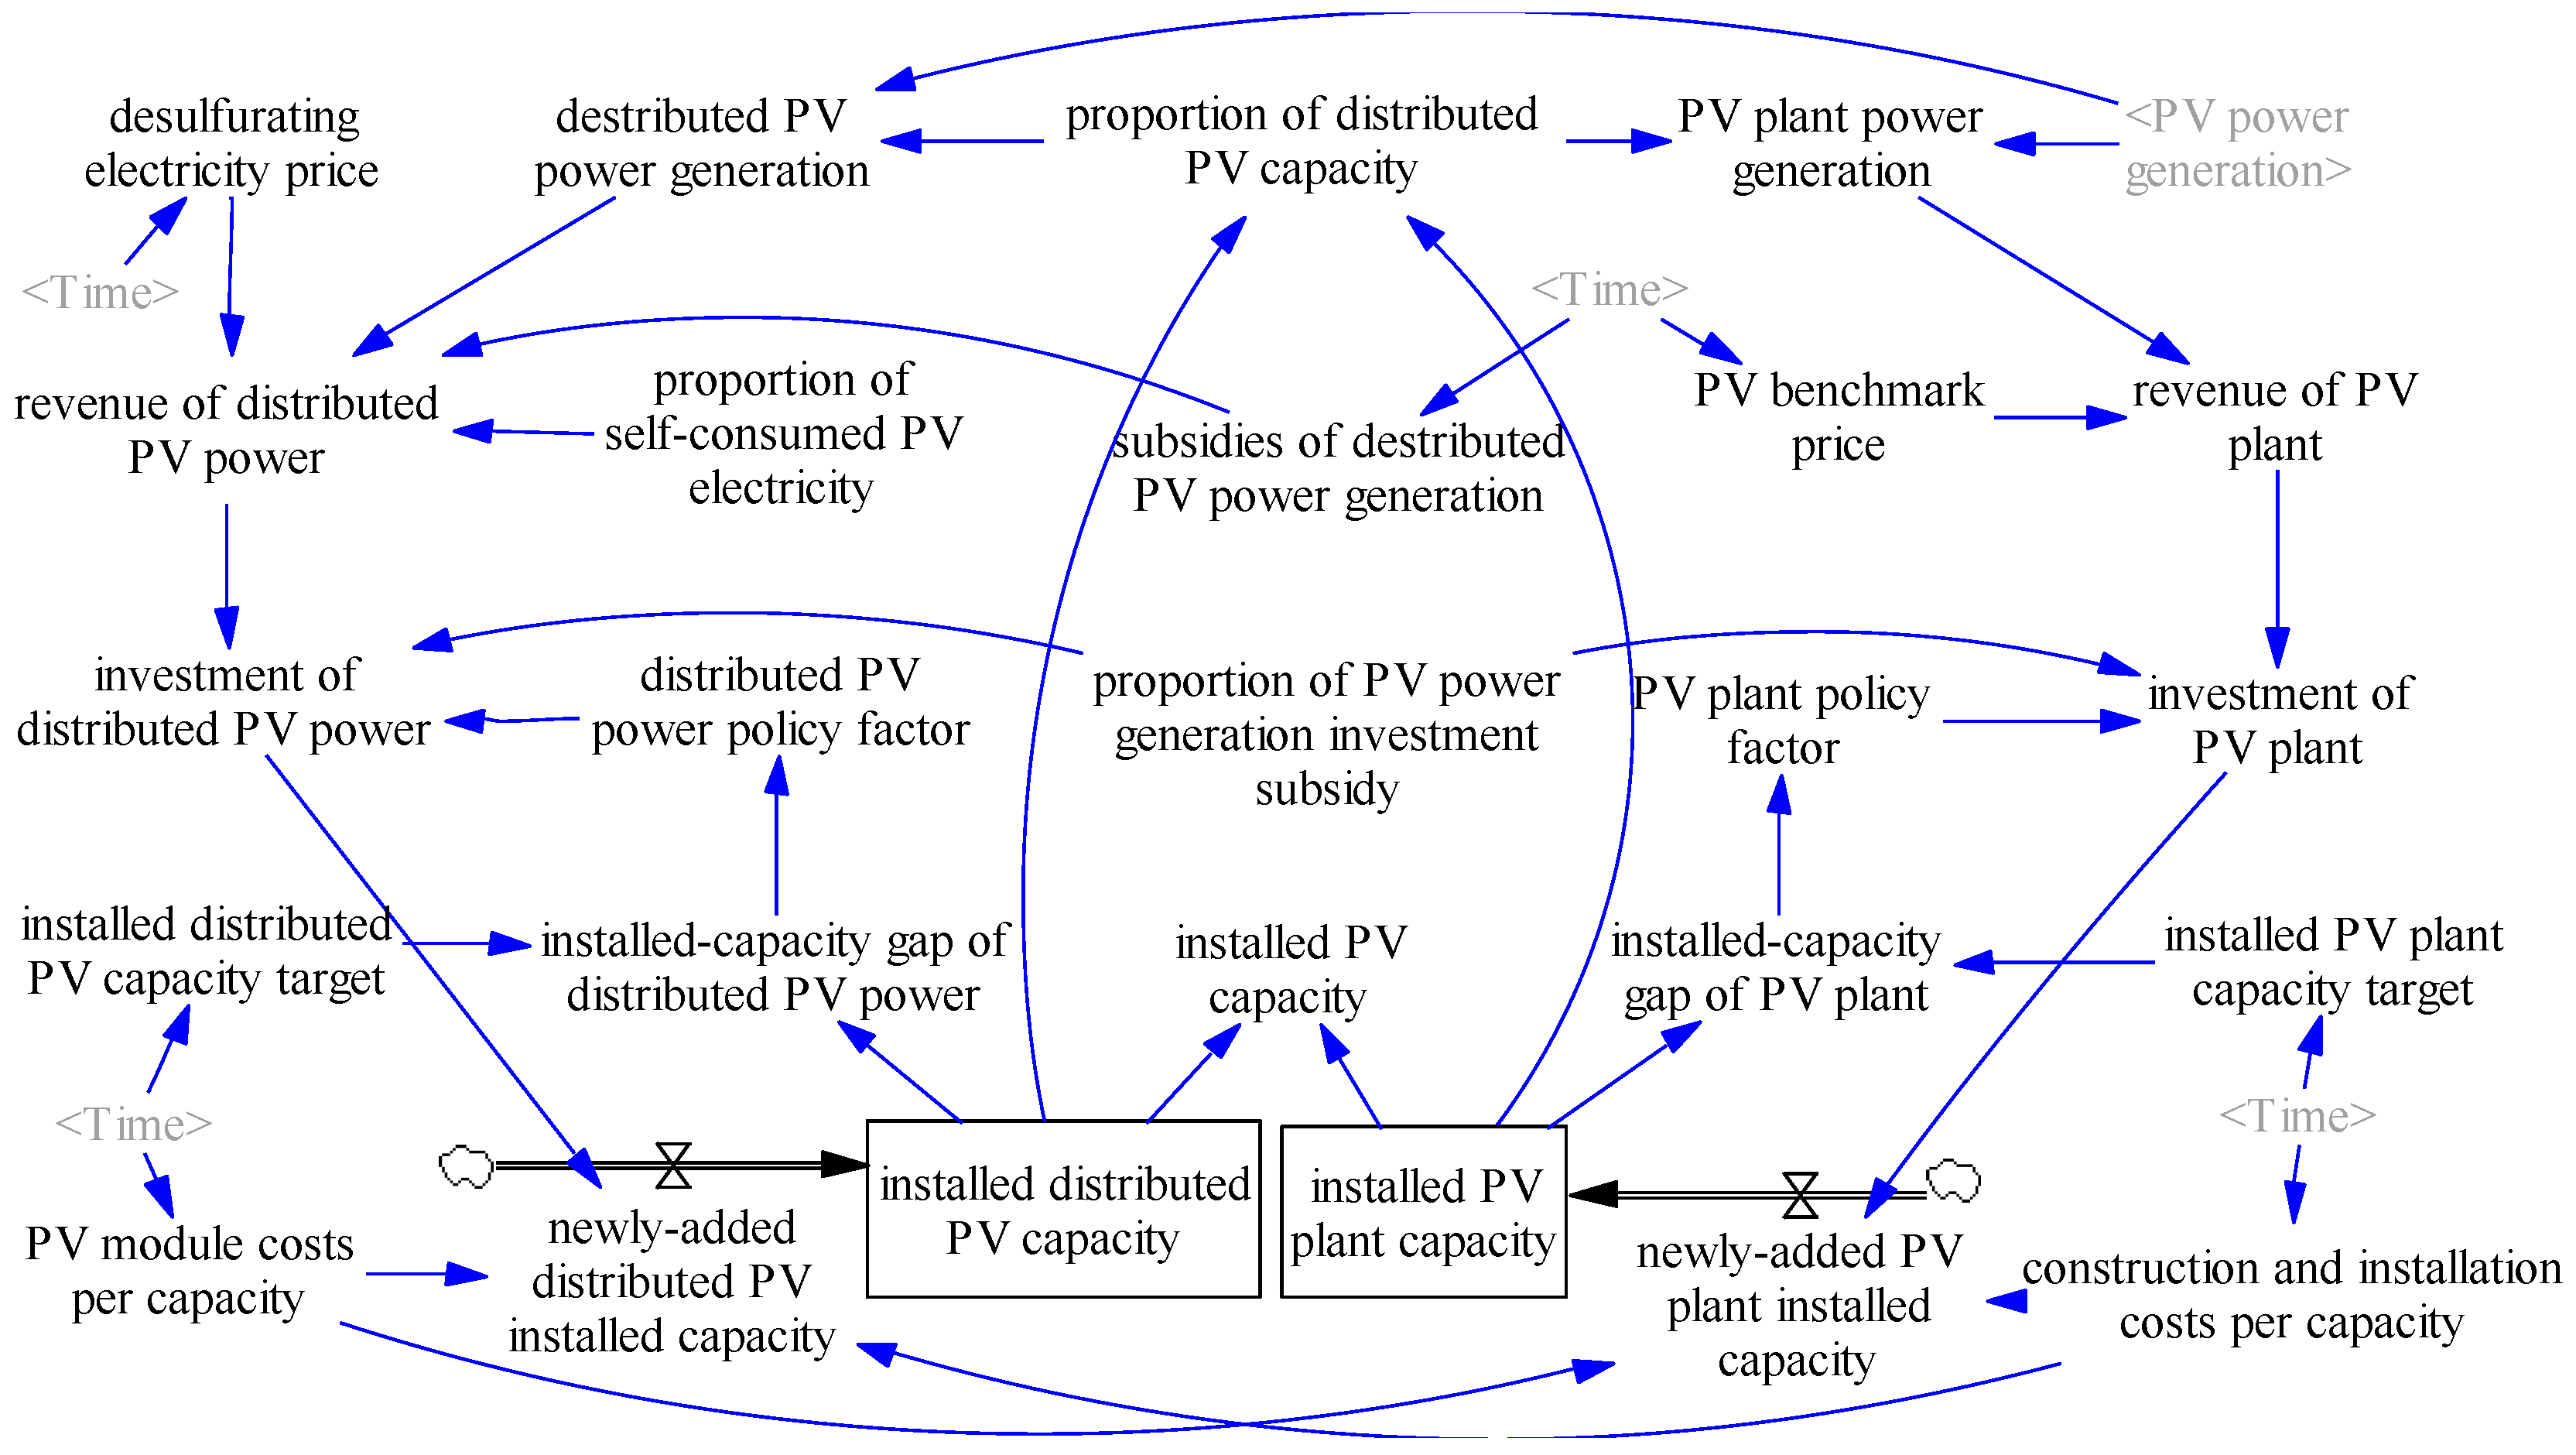
3.2. Flow Diagram
3.2.1. Power Generation and Consumption Subsystem
3.2.2. Power Transmit Subsystem
3.2.3. Installed PV Capacity Subsystem
3.3. Model Validation
3.4. Policy Scenarios
4. Simulation Results and Analysis
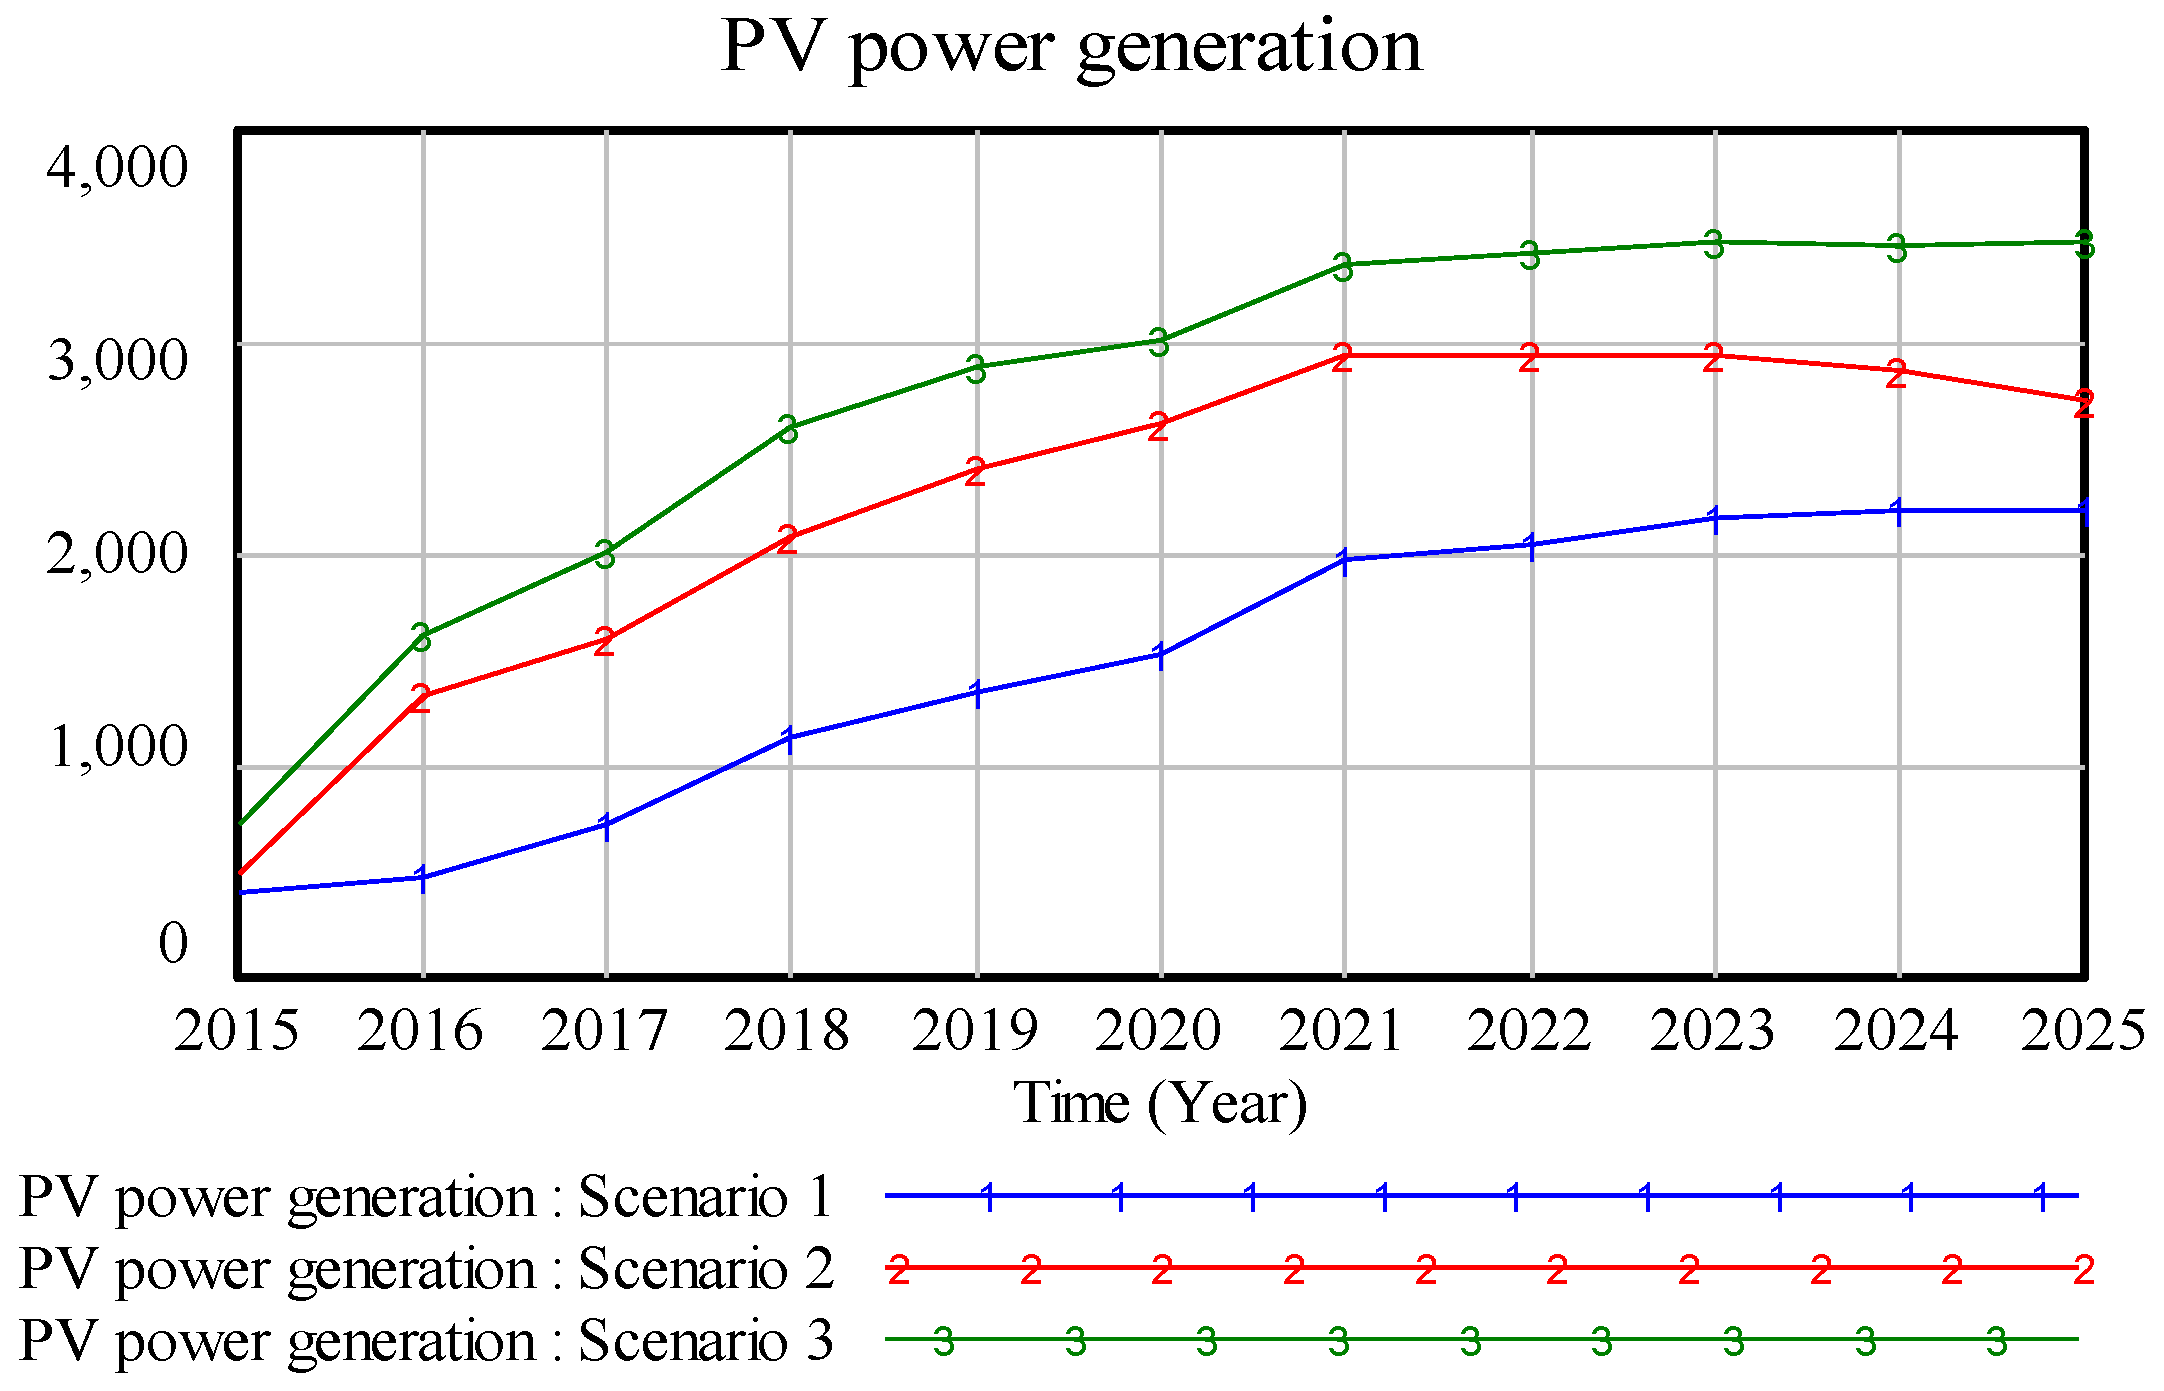
4.1. Simulation Results in Different Policy Scenarios
4.1.1. Scenario 1: With no Policy Influence
4.1.2. Scenario 2: With Influence of Fundamental Policy
4.1.3. Scenario 3: With Influence of Fundamental and Supporting Policies
4.2. Analysis of Policy Effect
5. Conclusions
Acknowledgments
Author Contributions
Conflicts of Interest
Appendix

| Variable | Unit | Initial Value | Data Source |
|---|---|---|---|
| GDP | 108 CNY | 519,470 | China Statistical Yearbook (2012) |
| proportion of coal consumption in total energy consumption | - | 0.676 | China Statistical Yearbook (2012) |
| energy consumption | 104 tce | 361,732 | China Statistical Yearbook (2012) |
| coal consumption rate of power generation | g/kWh | 321 | China Statistical Yearbook (2012) |
| coal consumption proportion of power industry | - | 0.49 | China Statistical Yearbook (2012) |
| wind power generation | 108 kWh | 1164 | survey data of Electricity Council |
| nuclear power generation | 108 kWh | 1055 | survey data of Electricity Council |
| hydropower generation | 108 kWh | 8641 | survey data of Electricity Council |
| interregional transmission capacity | 108 kWh | 7796 | survey data of Electricity Council |
| proportion of primary industry output | - | 0.05 | China Statistical Yearbook (2012) |
| primary industrial electricity consumption intensity | kWh/CNY | 0.02 | China Statistical Yearbook (2012) |
| proportion of second industry output | - | 0.50 | China Statistical Yearbook (2012) |
| second industrial electricity consumption intensity | kWh/CNY | 0.15 | China Statistical Yearbook (2012) |
| proportion of third industry output | - | 0.45 | China Statistical Yearbook (2012) |
| third industrial electricity consumption intensity | kWh/CNY | 0.02 | China Statistical Yearbook (2012) |
| population increasing rate | - | 0.005 | China Statistical Yearbook (2012) |
| population | 108 people | 13.5 | China Statistical Yearbook (2012) |
| per capita residential electricity consumption | kWh/person | 443.83 | survey data of Electricity Council |
| PV module costs per capacity | CNY/W | 7.74 | survey data of Electricity Council |
| construction and installation costs per capacity | CNY/W | 2.12 | survey data of Electricity Council |
| average benchmark price of PV power plant | CNY/kWh | 1.05 | survey data of Electricity Council |
| proportion of self-consumed PV electricity | - | 0.80 | survey data of Electricity Council |
| desulfurating electricity price | CNY/kWh | 0.40 | survey data of Electricity Council |
| target of distributed PV installed capacity | MW | 1950 | survey data of NEA |
| target of PV plant installed capacity | MW | 4850 | survey data of NEA |
| subsidies of distributed PV power generation | CNY/kWh | 0.35 | survey data of Electricity Council |
| proportion of self consumption | - | 0.80 | survey data of Electricity Council |
| Year | GDP (108 Yuan) | Population (108) | ||||
| True Value | Simulation | Error | True Value | Simulation | Error | |
| (%) | (%) | |||||
| 2012 | 519,470 | 533,484 | 2.70% | 13.5 | 13.5404 | 0.30% |
| 2013 | 568,845 | 585,834 | 2.99% | 13.5675 | 13.6072 | 0.29% |
| 2014 | 636,463 | 638,184 | 0.27% | 13.6353 | 13.5678 | −0.49% |
| Year | Total Electricity Generation (108 KWh) | Interregional Transmission Capacity (108 KWh) | ||||
| True Value | Simulation | Error | True Value | Simulation | Error | |
| (%) | (%) | |||||
| 2012 | 49,865 | 49,497.3 | −0.74% | 6000 | 6055 | 0.92% |
| 2013 | 53,720 | 53,294.7 | −0.79% | 6200 | 6381.97 | 2.94% |
| 2014 | 54,638 | 56,947.2 | 4.23% | 6400 | 6898.91 | 7.80% |
| Year | PV Power Generation (108 KWh) | Installed PV Capacity (MWe) | ||||
| True Value | Simulation | Error | True Value | Simulation | Error | |
| (%) | (%) | |||||
| 2012 | 38.2 | 40.2176 | 5.28% | 6800 | 6800 | 0.00% |
| 2013 | 87 | 90.3832 | 3.89% | 19,420 | 19,788 | 1.89% |
| 2014 | 250 | 251.04 | 0.42% | 28,050 | 26,721.4 | −4.74% |
| Year | Distributed PV Installed Capacity (MWe) | PV Plant Installed Capacity (MWe) | ||||
| True Value | Simulation | Error | True Value | Simulation | Error | |
| (%) | (%) | |||||
| 2012 | 1950 | 1950 | 0.00% | 4850 | 4850 | 0.00% |
| 2013 | 3100 | 3026 | −2.39% | 16,320 | 16,762 | 2.71% |
| 2014 | 4670 | 4469 | −4.30% | 23,380 | 22,252.4 | −4.82% |
| Parameter | PV Power Generation | |||||
| 10% | 5% | 3% | −3% | −5% | −10% | |
| proportion of coal consumption in total energy consumption | −56.5070% | −31.5665% | −16.9525% | 16.9516% | 19.9899% | 31.9621% |
| proportion of third industrial output value | −3.9165% | −5.4323% | −6.7665% | 1.0978% | 10.5632% | 5.4613% |
| average utilization hours | 2.4975% | 4.2976% | 2.4204% | 0.1556% | −1.3657% | −4.0428% |
| increasing rate of interregional transmission capacity | 23.4556% | 20.1111% | 12.3479% | −8.5482% | −7.6413% | −12.5345% |
| interregional power transmit proportion | −15.6783% | −5.3212% | −4.7694% | 1.6759% | 7.1943% | 10.2224% |
| average benchmark price of PV power plant | 0.6320% | 0.3752% | 3.5119% | −0.7400% | −2.3142% | −1.3181% |
| electricity price subsidy of distributed PV power | 0.3146% | 0.8239% | 3.3545% | −1.8965% | −0.4369% | −0.4473% |
| target of distributed PV installed capacity | 1.0723% | 1.2645% | 0.3403% | −0.7965% | −0.8542% | −0.9452% |
| target of PV plant installed capacity | 0.4924% | 1.0748% | 2.6349% | 0.9027% | −1.7131% | −2.0572% |
| PV module costs per capacity | −0.0789% | −0.5059% | −0.8924% | 0.2377% | 1.3953% | 0.5583% |
| Parameter | Installed PV Capacity | |||||
| 10% | 5% | 3% | −3% | −5% | −10% | |
| proportion of coal consumption in total energy consumption | −1.9429% | −2.6110% | −1.7509% | 0.7332% | 1.4256% | 1.1489% |
| proportion of third industrial output value | −0.2456% | −0.0562% | −0.1439% | 0.4321% | 0.8554% | 0.6894% |
| average utilization hours | 1.2415% | 1.8771% | 0.3822% | 0.3812% | −1.3812% | −1.2749% |
| increasing rate of interregional transmission capacity | 3.6561% | 3.2007% | 3.9120% | −0.9009% | −1.7032% | −0.6599% |
| interregional power transmit proportion | 1.9370% | −0.1919% | 0.0942% | 2.5612% | −1.5467% | 1.3276% |
| average benchmark price of PV power plant | 7.4613% | 4.6534% | 2.0081% | 1.2281% | −3.1400% | −2.0183% |
| electricity price subsidy of distributed PV power | 5.0719% | 3.7042% | 1.8215% | −1.2913% | −2.5717% | −2.2938% |
| target of distributed PV installed capacity | 8.3553% | 5.7996% | 0.3745% | −1.3208% | −3.1112% | −3.6953% |
| target of PV plant installed capacity | 5.7188% | 4.8869% | 2.9772% | −1.0331% | −5.2039% | −5.6862% |
| PV module costs per capacity | 8.2651% | 7.1461% | 5.7966% | 3.5674% | −0.8700% | −7.6631% |
| Parameter | PV Power Curtailment | |||||
| 10% | 5% | 3% | −3% | −5% | −10% | |
| proportion of coal consumption in total energy consumption | 22.5761% | 5.0570% | 13.7528% | −18.2839% | −12.4578% | −33.2535% |
| proportion of third industrial output value | 2.5761% | 5.0570% | 3.7528% | −4.2839% | −4.7823% | −3.2535% |
| average utilization hours | 40.2447% | 24.5764% | 17.9931% | −4.9890% | −11.3156% | −28.7008% |
| increasing rate of interregional transmission capacity | −10.4238% | −0.5929% | −11.1262% | 11.0953% | 2.0923% | 1.9621% |
| interregional power transmit proportion | 5.6155% | 3.5680% | 1.6237% | 0.3803% | −5.1220% | −4.9480% |
| average benchmark price of PV power plant | 20.5192% | 4.8071% | 11.3880% | −3.6743% | −8.9963% | −11.4157% |
| electricity price subsidy of distributed PV power | 10.2132% | 10.5555% | 10.8774% | −9.4164% | −1.6983% | −3.8737% |
| target of distributed PV installed capacity | 34.8166% | 16.1998% | 1.1035% | −3.9547% | −3.3207% | −8.1859% |
| target of PV plant installed capacity | 15.9866% | 13.7694% | 8.5443% | −4.4823% | −6.6597% | −17.8167% |
| PV module costs per capacity | −2.5605% | −6.4809% | 2.8937% | 1.1801% | 5.4245% | 4.8348% |
| Parameter | Proportion of Distributed PV Installed Capacity | |||||
| 10% | 5% | 3% | −3% | −5% | −10% | |
| proportion of coal consumption in total energy consumption | −2.8318% | −1.2204% | −0.2072% | −0.8877% | 1.0179% | 1.4538% |
| proportion of third industrial output value | −0.8297% | −1.2204% | −1.2072% | −0.8877% | 1.5485% | 1.4538% |
| average utilization hours | 0.8431% | 0.9931% | 0.2594% | −0.5673% | −0.1673% | 1.0807% |
| increasing rate of interregional transmission capacity | 5.6123% | 4.2340% | 4.9233% | 3.7384% | 2.2144% | 2.0417% |
| interregional power transmit proportion | −0.4465% | −0.9039% | 0.6207% | 0.0038% | 0.7912% | 0.4301% |
| average benchmark price of PV power plant | −2.6509% | −1.7261% | 0.1748% | 1.8040% | 2.2761% | 3.8606% |
| electricity price subsidy of distributed PV power | 6.9170% | 4.6754% | 2.7330% | 0.2575% | −0.9905% | −2.1951% |
| target of distributed PV installed capacity | 11.7028% | 9.9917% | 3.3423% | −1.1340% | −6.0873% | −4.9864% |
| target of PV plant installed capacity | −6.6163% | −3.7157% | −4.2703% | 3.5942% | 5.7294% | 6.6591% |
| PV module costs per capacity | −2.3328% | −0.6270% | −0.1783% | 0.1187% | −0.8746% | 0.3348% |
| Parameter | Scenario 1 | Scenario 2 | Scenario 3 |
|---|---|---|---|
| Without Policy Influence | Only Fundamental Policy | Fundamental and Supporting Policies | |
| proportion of coal consumption in total energy consumption in 2017 | 0.6668 | 0.6500 | 0.6323 |
| energy consumption in 2017 (104 tce) | 450,280 | 425,707 | 418,697 |
| coal consumption rate of power generation in 2017 (g/kWh) | 306 | 301 | 300 |
| proportion of second industrial output value | 0.4248 | 0.4142 | 0.4142 |
| proportion of third industrial output value | 0.5252 | 0.5358 | 0.5358 |
| nuclear power generation in 2017 (108 kWh) | 1606.34 | 1750.53 | 2800.00 |
| wind power generation in 2017 (108 kWh) | 2440.33 | 2440.33 | 2614.97 |
| hydropower generation in 2017 (108 kWh) | 11,688.92 | 11,688.92 | 12,175.86 |
| average utilization hours in 2017 (h) | 1294 | 1294 | 1400 |
| increasing rate of interregional transmission capacity | 0.09 | 0.09 | 0.11 |
| interregional power transmit proportion | 0.14 | 0.15 | 0.15 |
| average benchmark price of PV power plant in 2017/2020 (CNY/kWh) | 0.81/0.70 | 0.81/0.70 | 0.85/0.65 |
| electricity price subsidy of distributed PV power before/after 2020 (CNY/kWh) | 0.35/0.00 | 0.35/0.00 | 0.42/0.00 |
| target of distributed PV installed capacity in 2017/2020 (MW) | 15,000/40,000 | 15,000/40,000 | 35,000/60,000 |
| target of PV plant installed capacity in 2017/2020 (MW) | 20,000/60,000 | 20,000/60,000 | 35,000/90,000 |
| PV module costs per capacity in 2017 (CNY/W) | 5 | 5 | 4.5 |
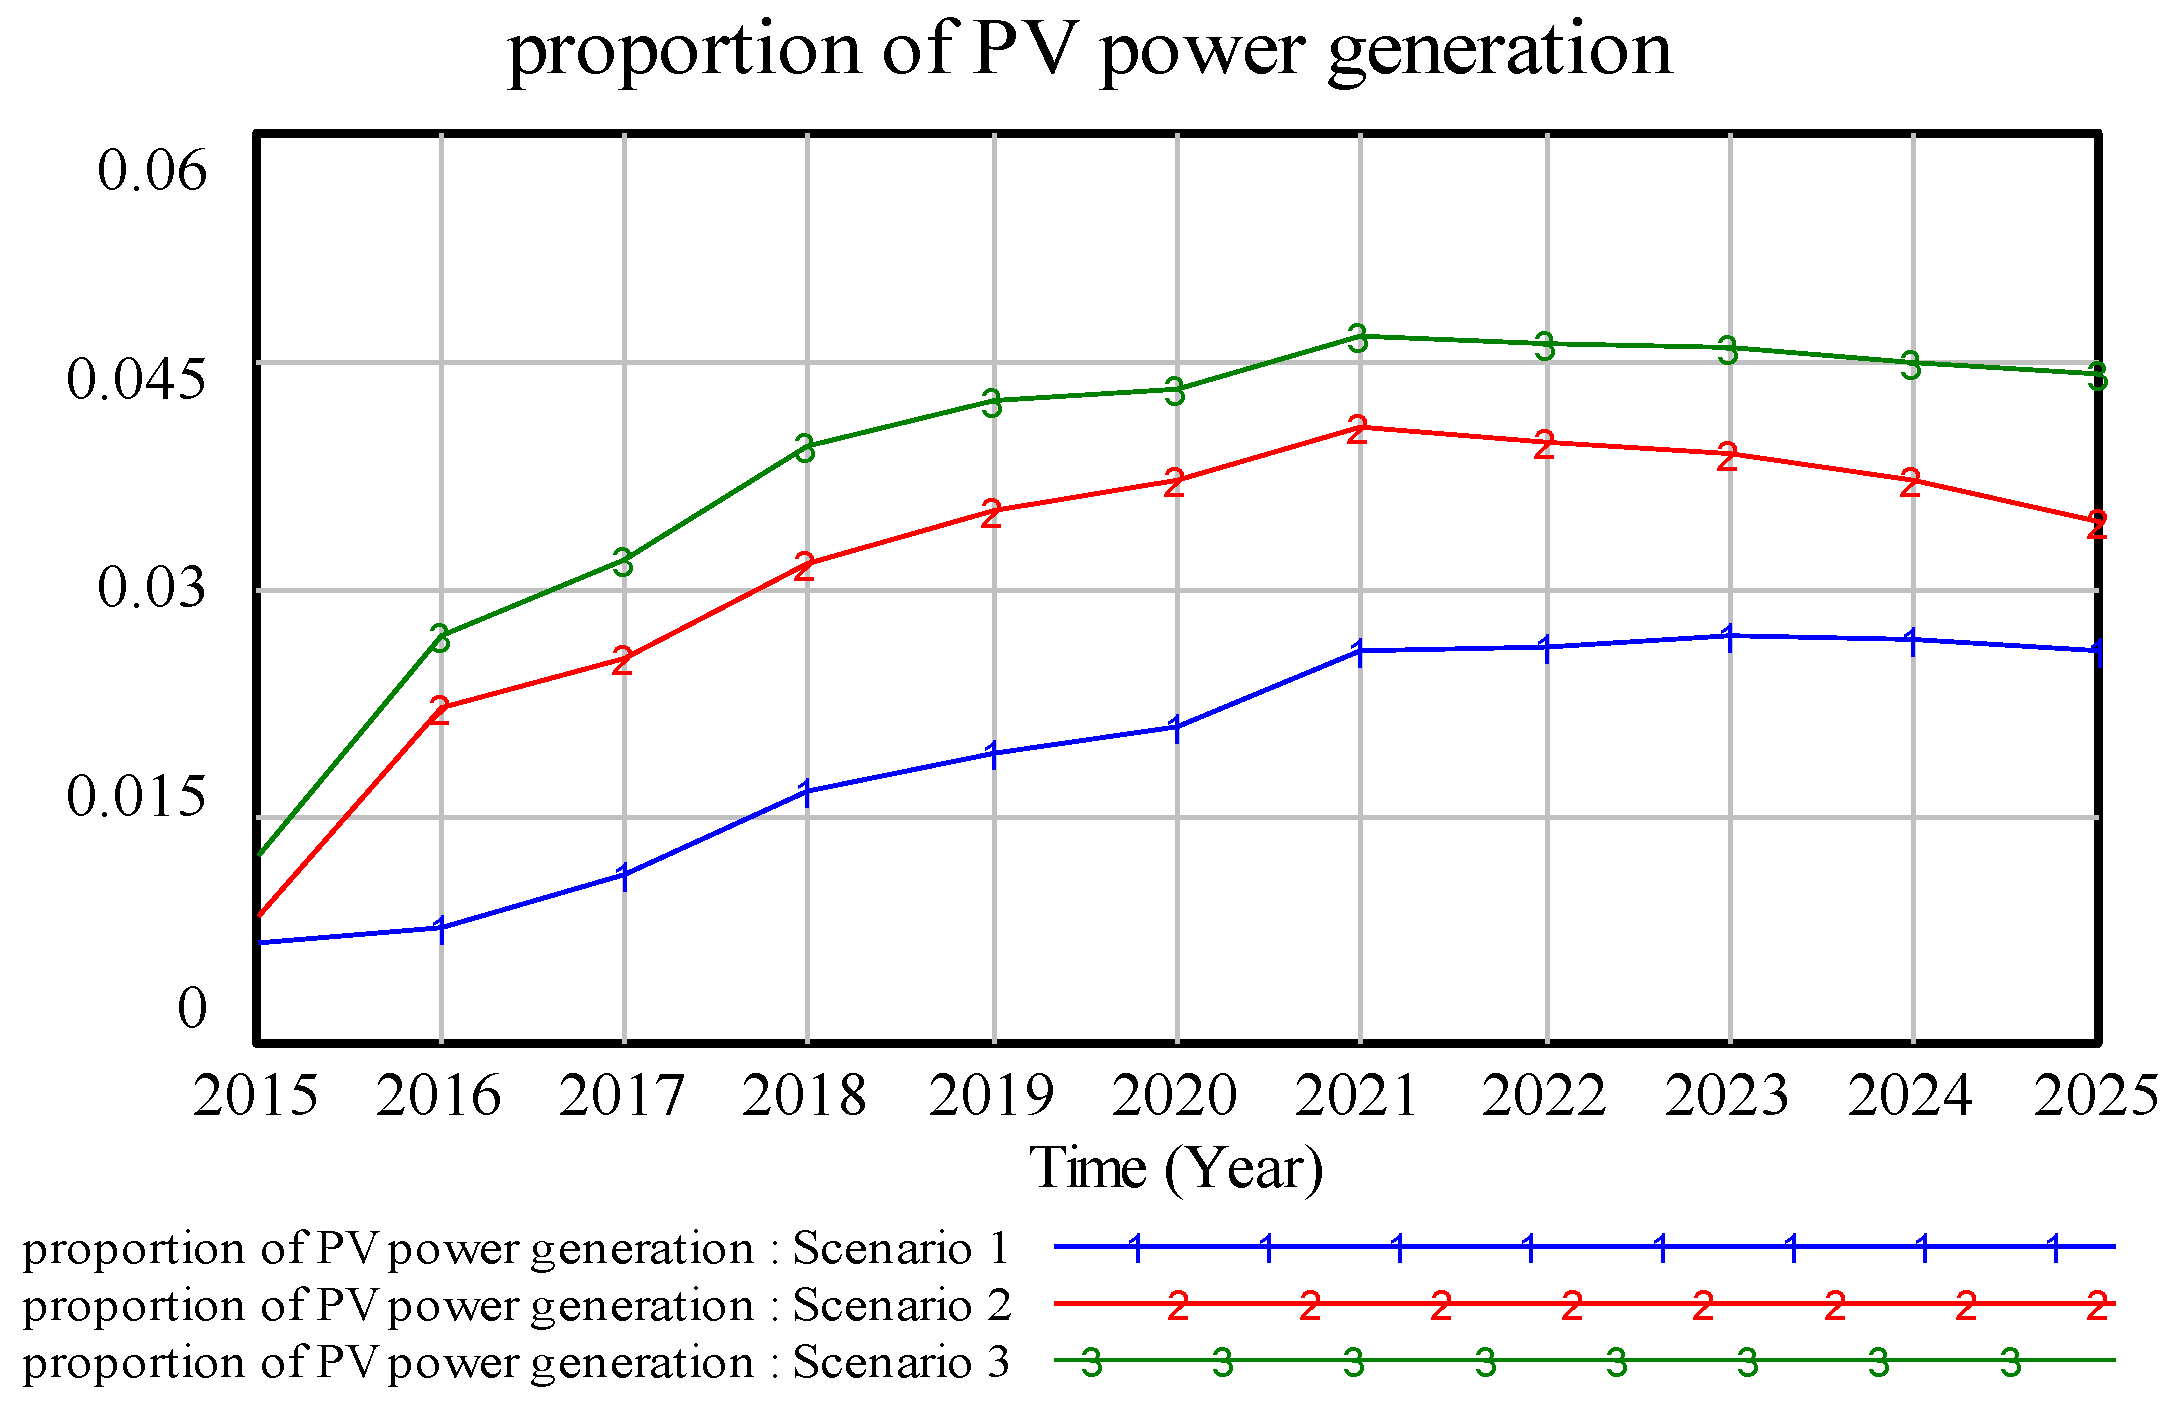
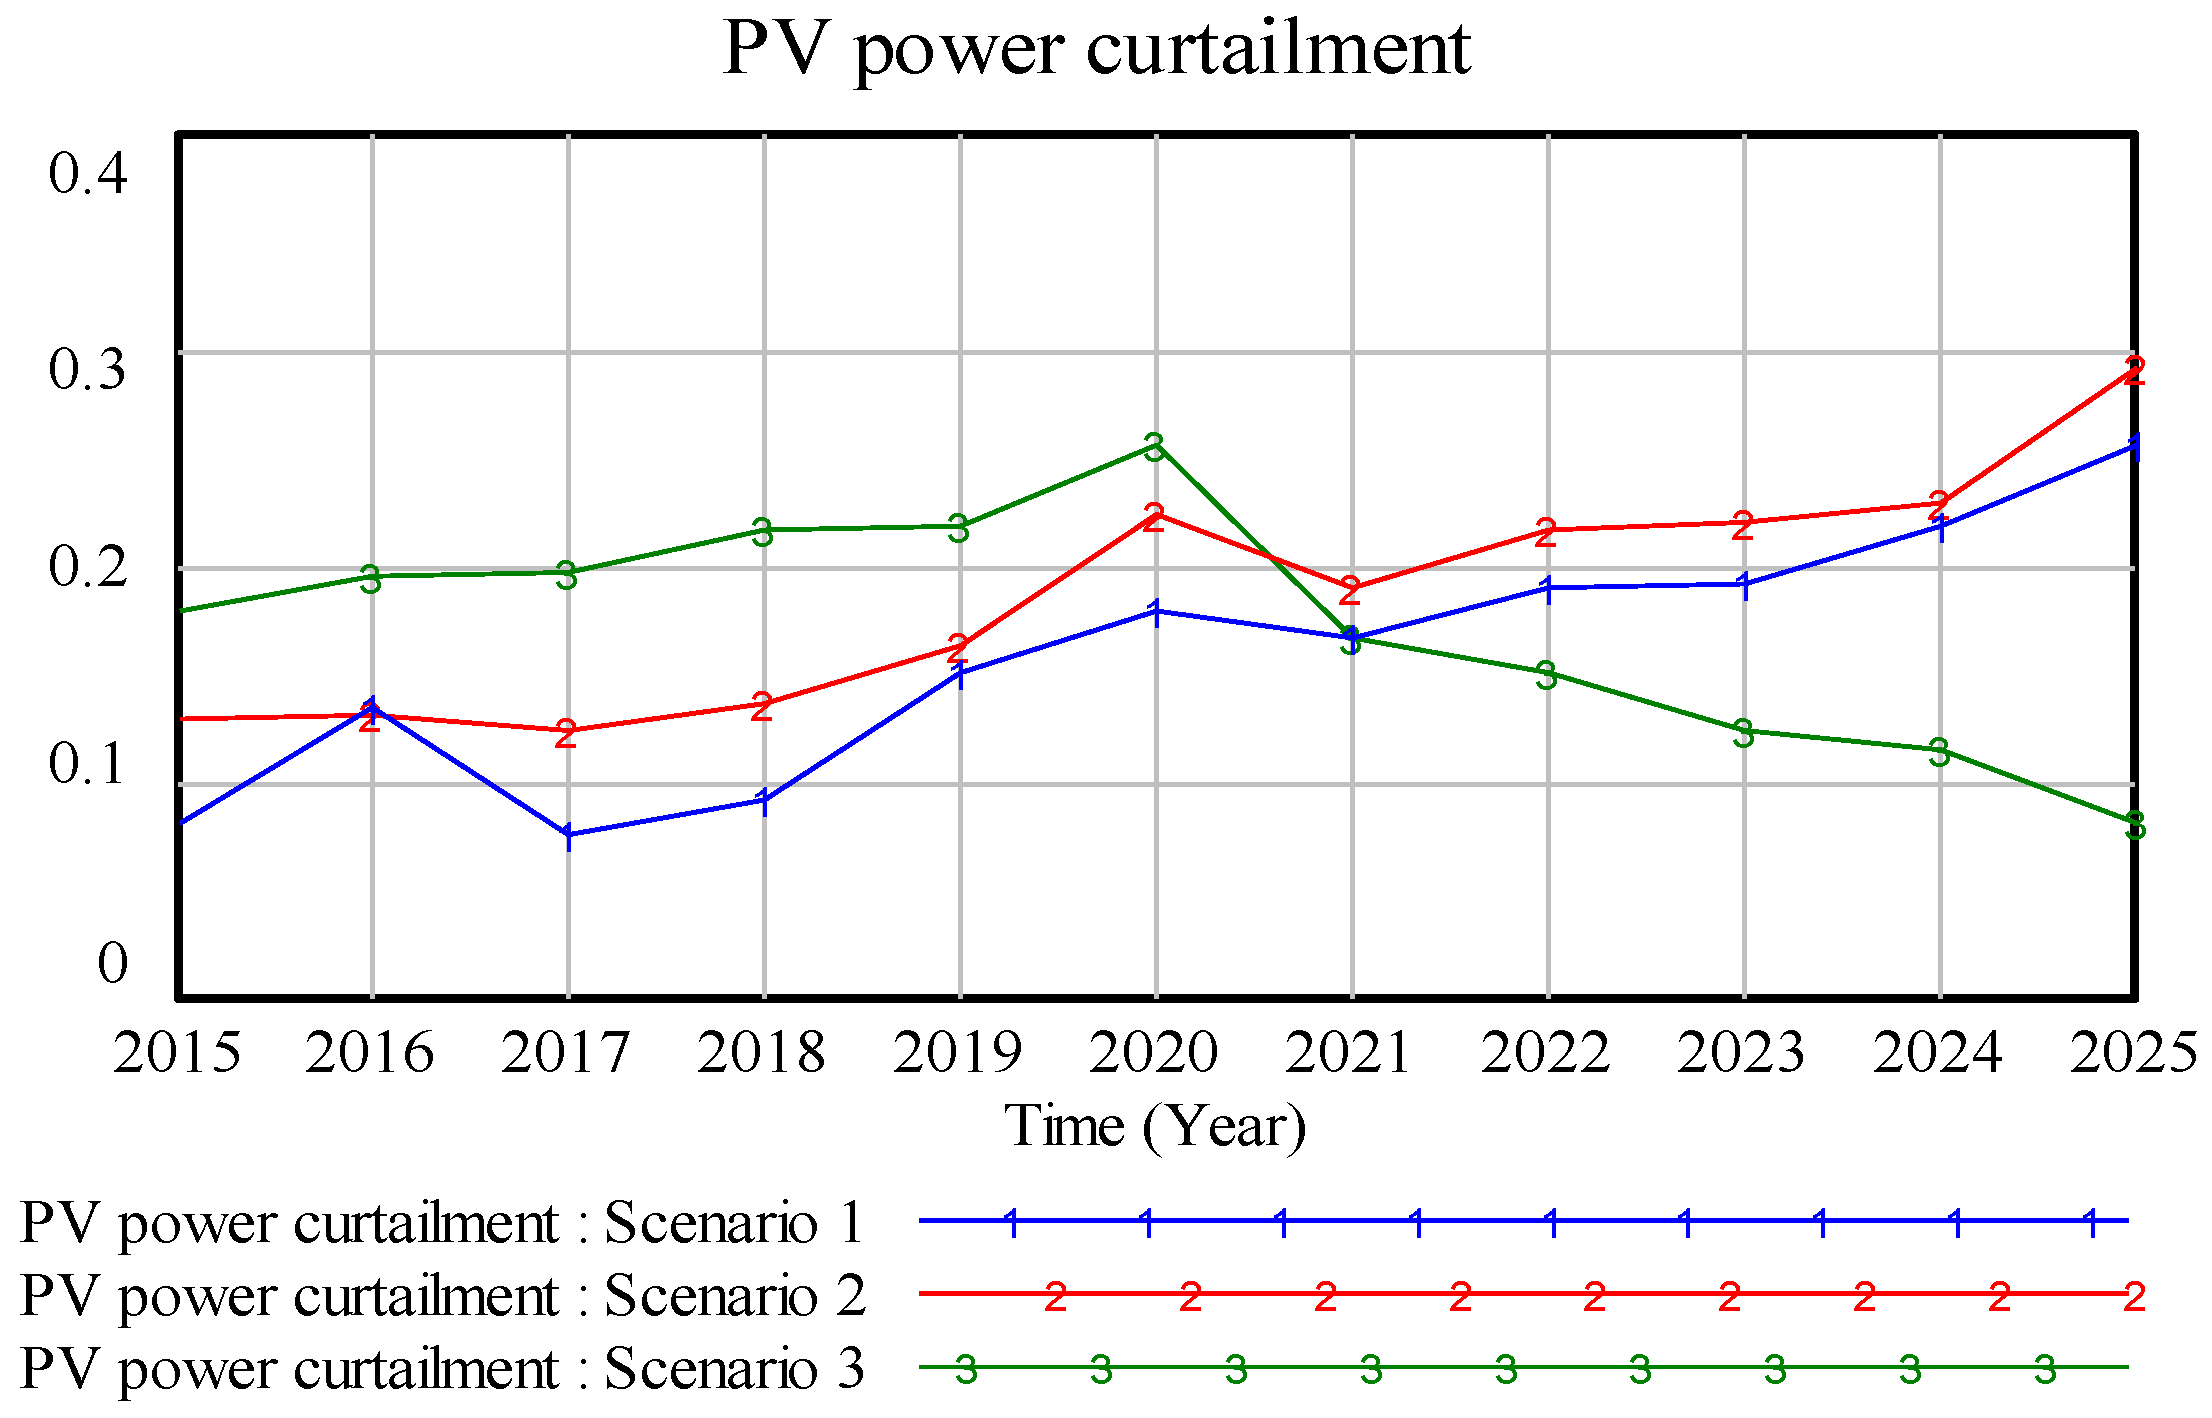
| Year | PV Power Generation (108 kWh) | Proportion of PV Power Generation | Distributed PV Power Generation (108 kWh) | PV Plant Power Generation (108 kWh) | Installed PV Capacity (MW) | Distributed PV Installed Capacity (MW) | PV Plant Installed Capacity (MW) | Proportion of Distributed PV Capacity | Investment of Distributed PV Power (108 CNY) | Investment of PV Plant (108 CNY) | PV Power Curtailment | Interregional Transmission Capacity (108 kWh) |
|---|---|---|---|---|---|---|---|---|---|---|---|---|
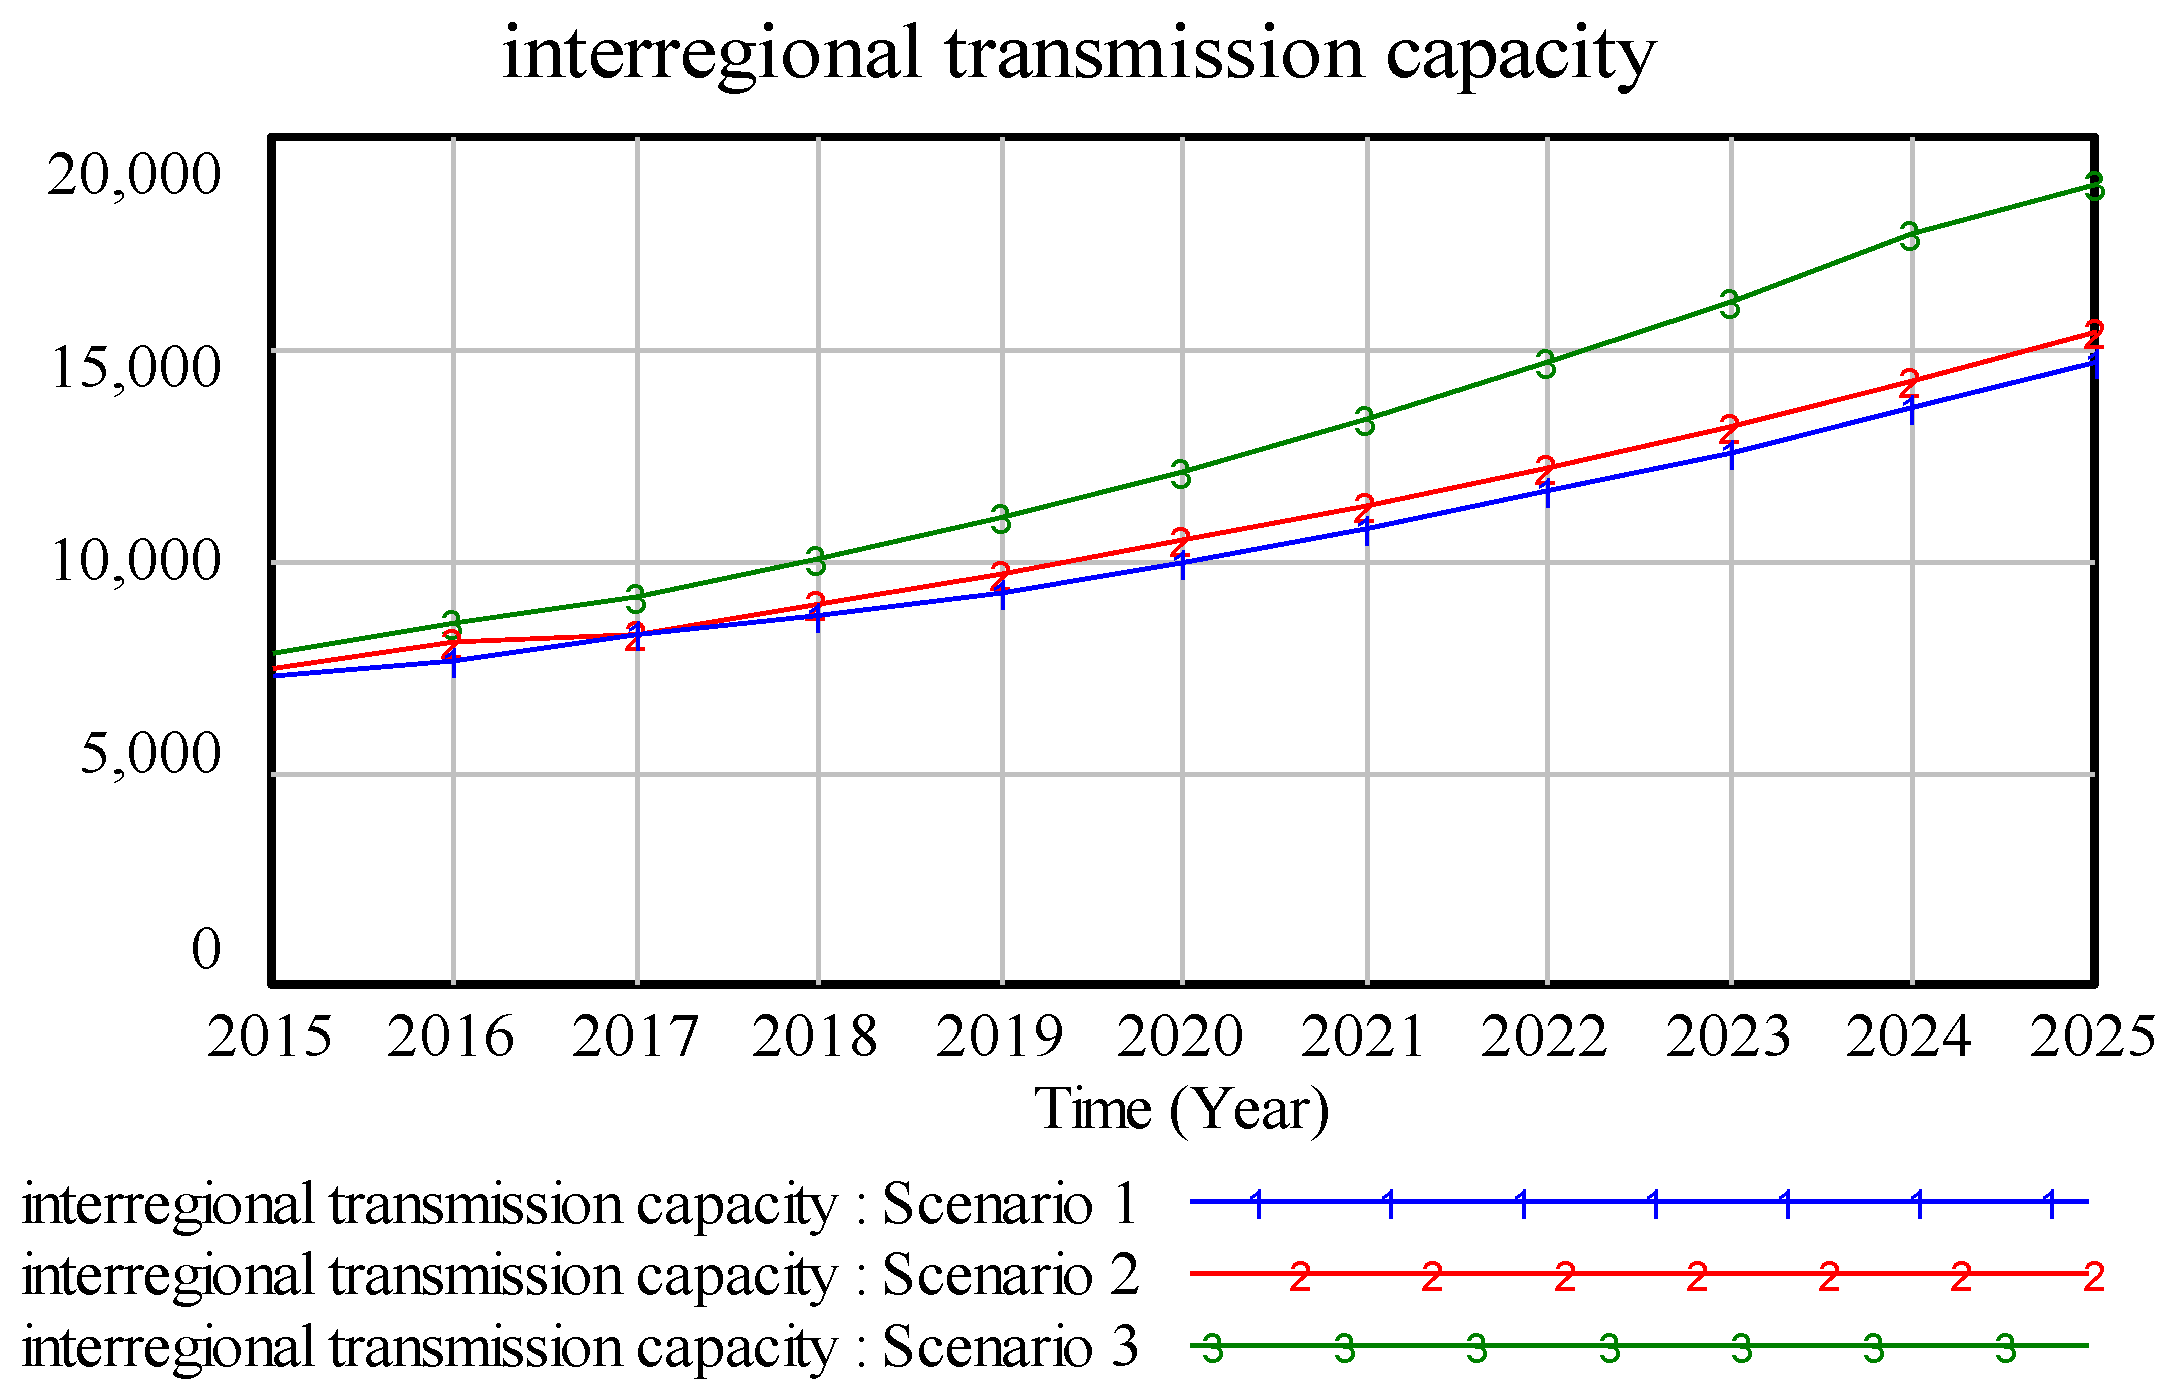
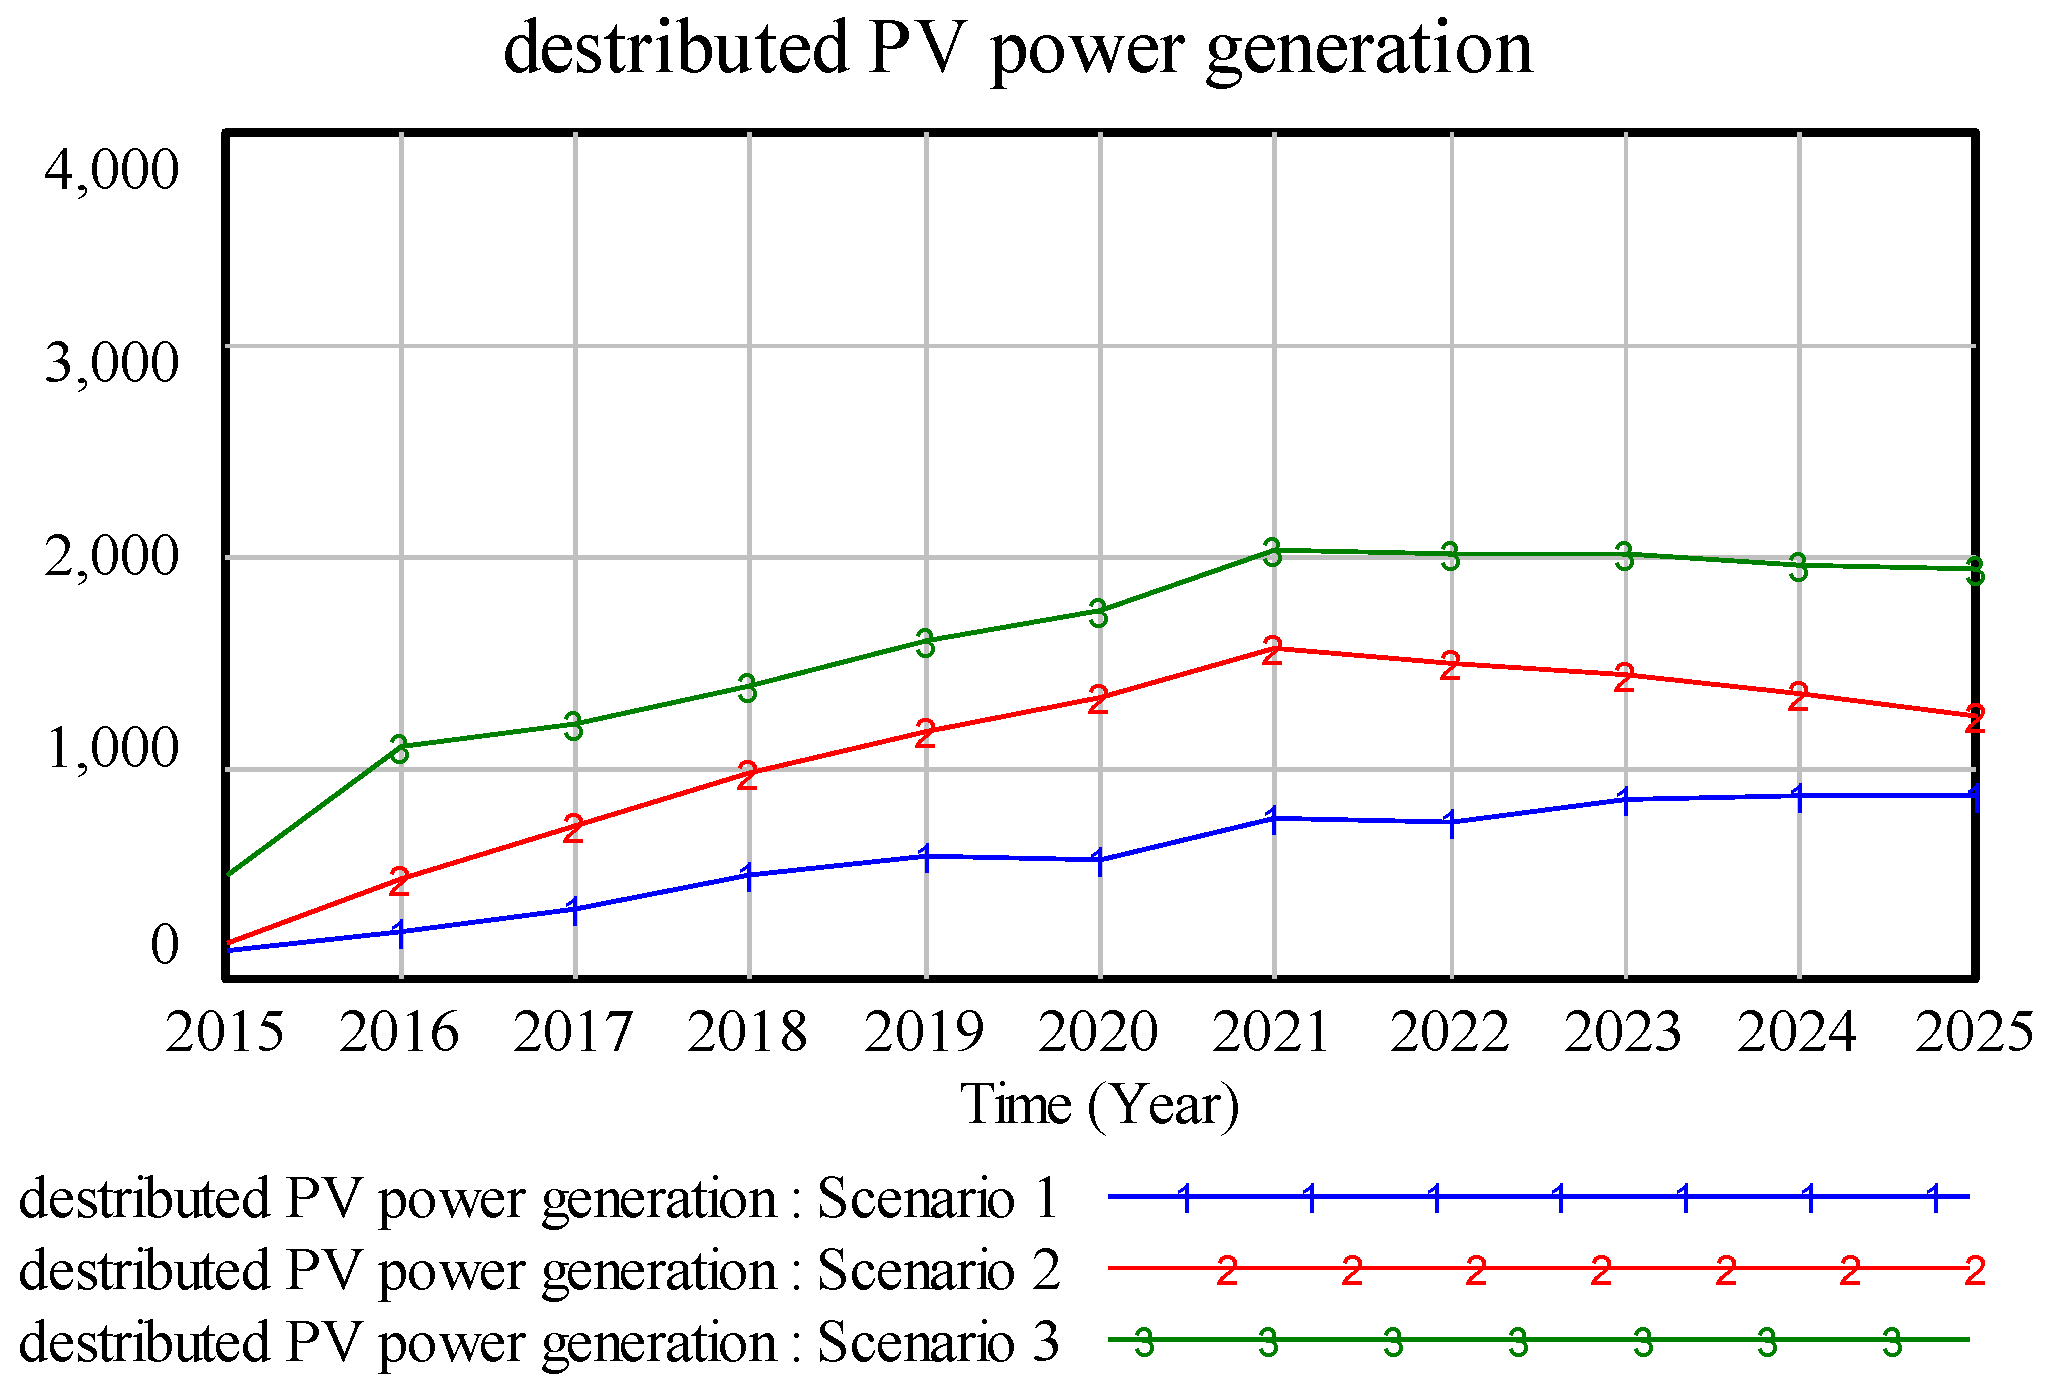
| 2015 | 395.12 | 0.0066 | 130.72 | 264.40 | 16,535 | 5471 | 11,065 | 0.3308 | 536.83 | 360.91 | 0.0809 | 7271 |
| 2016 | 480.63 | 0.0077 | 218.74 | 261.89 | 25,246 | 11,490 | 13,756 | 0.4551 | 226.61 | 394.14 | 0.1346 | 7664 |
| 2017 | 723.97 | 0.0111 | 330.69 | 393.28 | 31,311 | 14,302 | 17,009 | 0.4568 | 691.37 | 1486.58 | 0.0751 | 8285 |
| 2018 | 1128.90 | 0.0166 | 494.18 | 634.72 | 54,030 | 23,652 | 30,378 | 0.4378 | 521.20 | 1140.38 | 0.0916 | 8732 |
| 2019 | 1356.43 | 0.0191 | 583.20 | 773.23 | 72,659 | 31,240 | 41,419 | 0.4300 | 620.53 | 2670.21 | 0.1514 | 9204 |
| 2020 | 1532.18 | 0.0209 | 570.06 | 962.12 | 109,855 | 40,872 | 68,982 | 0.3721 | 611.86 | 1021.45 | 0.1796 | 9949 |
| 2021 | 1966.66 | 0.0259 | 764.11 | 1202.55 | 131,054 | 50,919 | 80,135 | 0.3885 | 203.25 | 1203.75 | 0.1663 | 10,755 |
| 2022 | 2041.56 | 0.0260 | 748.88 | 1292.68 | 148,372 | 54,425 | 93,946 | 0.3668 | 838.74 | 1235.16 | 0.1906 | 11,626 |
| 2023 | 2161.27 | 0.0268 | 843.01 | 1318.26 | 178,302 | 69,547 | 108,755 | 0.3901 | 487.82 | 1199.62 | 0.1919 | 12,568 |
| 2024 | 2213.42 | 0.0267 | 860.56 | 1352.87 | 202,408 | 78,694 | 123,714 | 0.3888 | 522.07 | 1169.55 | 0.2189 | 13,586 |
| 2025 | 2201.86 | 0.0259 | 859.20 | 1342.66 | 227,658 | 88,836 | 138,822 | 0.3902 | 537.29 | 1099.64 | 0.2560 | 14,687 |
| Year | PV Power Generation (108 kWh) | Proportion of PV Power Generation | Distributed PV Power Generation (108 kWh) | PV Plant Power Generation (108 kWh) | Installed PV Capacity (MW) | Distributed PV Installed Capacity (MW) | PV Plant Installed Capacity (MW) | Proportion of Distributed PV Capacity | Investment of Distributed PV Power (108 CNY) | Investment of PV Plant (108 CNY) | PV Power Curtailment | Interregional Transmission Capacity (108 kWh) |
|---|---|---|---|---|---|---|---|---|---|---|---|---|
| 2015 | 490.85 | 0.0083 | 173.97 | 316.88 | 23,466 | 8317 | 15,149 | 0.3544 | 178.61 | 432.54 | 0.1295 | 7458 |
| 2016 | 1333.36 | 0.0220 | 479.54 | 853.82 | 28,694 | 10,320 | 18,374 | 0.3596 | 993.61 | 1113.67 | 0.1307 | 8062 |
| 2017 | 1601.60 | 0.0253 | 722.43 | 879.17 | 50,217 | 22,651 | 27,565 | 0.4511 | 755.18 | 1080.06 | 0.1245 | 8280 |
| 2018 | 2082.06 | 0.0317 | 975.51 | 1106.55 | 70,143 | 32,864 | 37,279 | 0.4685 | 1028.84 | 1292.27 | 0.1361 | 8950 |
| 2019 | 2399.43 | 0.0352 | 1175.79 | 1223.64 | 97,633 | 47,843 | 49,790 | 0.4900 | 1251.04 | 1373.33 | 0.1628 | 9675 |
| 2020 | 2608.87 | 0.0372 | 1337.20 | 1271.67 | 131,229 | 67,262 | 63,966 | 0.5126 | 1435.26 | 1350.09 | 0.2241 | 10,459 |
| 2021 | 2929.57 | 0.0406 | 1569.50 | 1360.06 | 169,536 | 90,828 | 78,708 | 0.5357 | 417.49 | 1361.42 | 0.1910 | 11,306 |
| 2022 | 2928.89 | 0.0396 | 1492.64 | 1436.25 | 192,359 | 98,031 | 94,328 | 0.5096 | 417.94 | 1372.34 | 0.2167 | 12,222 |
| 2023 | 2941.05 | 0.0388 | 1435.08 | 1505.97 | 216,347 | 105,566 | 110,781 | 0.4879 | 415.22 | 1370.43 | 0.2214 | 13,212 |
| 2024 | 2867.98 | 0.0370 | 1347.69 | 1520.30 | 241,222 | 113,352 | 127,870 | 0.4699 | 408.80 | 1314.30 | 0.2301 | 14,282 |
| 2025 | 2716.62 | 0.0344 | 1238.09 | 1478.53 | 266,141 | 121,293 | 144,848 | 0.4557 | 387.11 | 1210.91 | 0.2928 | 15,439 |
| YEAR | PV Power Generation (108 kWh) | Proportion of PV Power Generation | Distributed PV Power Generation (108 kWh) | PV Plant Power Generation (108 kWh) | Installed PV Capacity (MW) | Distributed PV Installed Capacity (MW) | PV Plant Installed Capacity (MW) | Proportion of Distributed PV Capacity | Investment of Distributed PV Power (108 CNY) | Investment of PV Plant (108 CNY) | PV Power Curtailment | Interregional Transmission Capacity (108 kWh) |
|---|---|---|---|---|---|---|---|---|---|---|---|---|
| 2015 | 727.79 | 0.0123 | 489.24 | 238.55 | 54,383 | 36,558 | 17,825 | 0.6722 | 582.20 | 400.76 | 0.1799 | 7796 |
| 2016 | 1622.55 | 0.0268 | 1094.22 | 528.33 | 64,462 | 43,472 | 20,990 | 0.6744 | 1312.33 | 2243.64 | 0.1962 | 8568 |
| 2017 | 2012.89 | 0.0318 | 1204.85 | 808.05 | 101,884 | 60,984 | 40,900 | 0.5986 | 1456.26 | 3205.25 | 0.1966 | 9133 |
| 2018 | 2591.26 | 0.0394 | 1380.52 | 1210.74 | 154,734 | 82,436 | 72,298 | 0.5328 | 1681.47 | 1450.67 | 0.2165 | 10,037 |
| 2019 | 2882.78 | 0.0424 | 1599.55 | 1283.23 | 197,186 | 109,412 | 87,774 | 0.5549 | 1963.18 | 1401.28 | 0.2179 | 11,031 |
| 2020 | 3010.04 | 0.0430 | 1745.25 | 1264.78 | 247,223 | 143,343 | 103,880 | 0.5798 | 2158.30 | 1246.87 | 0.2567 | 12,123 |
| 2021 | 3357.20 | 0.0466 | 2033.86 | 1323.34 | 302,356 | 183,174 | 119,182 | 0.6058 | 541.01 | 1184.17 | 0.1664 | 13,323 |
| 2022 | 3413.12 | 0.0462 | 2014.10 | 1399.02 | 328,340 | 193,755 | 134,585 | 0.5901 | 563.95 | 1145.80 | 0.1504 | 14,642 |
| 2023 | 3478.60 | 0.0460 | 2008.73 | 1469.88 | 355,652 | 205,372 | 150,280 | 0.5775 | 581.19 | 1136.95 | 0.1244 | 16,092 |
| 2024 | 3462.39 | 0.0448 | 1962.25 | 1500.14 | 384,508 | 217,913 | 166,595 | 0.5667 | 595.21 | 1137.61 | 0.1154 | 17,685 |
| 2025 | 3479.05 | 0.0441 | 1939.46 | 1539.60 | 414,925 | 231,307 | 183,618 | 0.5575 | 606.40 | 1167.53 | 0.0821 | 18,852 |
References
- Zhang, Y.; Song, J.; Hamori, S. Impact of subsidy policies on diffusion of photovoltaic power generation. Energy Policy 2011, 39, 1958–1964. [Google Scholar] [CrossRef]
- Liu, D.; Niu, D.X.; Wang, H.; Fan, L.L. Short-term wind speed forecasting using wavelet transform and support vector machines optimized by genetic algorithm. Renew. Energy 2014, 62, 592–597. [Google Scholar] [CrossRef]
- Claudio, M.; Tiago, S.; Fernandez-Jimenez, L.A.; Ramirez-Rosado, I.J.; Terreros-Olarte, M.S. Short-term power forecasting model for photovoltaic plants based on historical similarity. Energies 2013, 6, 4152–4169. [Google Scholar]
- Baltas, A.E.; Dervos, A.N. Special framework for the spatial planning & the sustainable development of renewable energy sources. Renew. Energy 2012, 48, 358–363. [Google Scholar]
- Nicolae, G.; George, C.L.; Mariacristina, R.; Dario, Z. Power quality assessment in small scale renewable energy sources supplying distribution systems. Energies 2013, 6, 634–645. [Google Scholar]
- Chen, Z.S.; Su, S.I. Photovoltaic supply chain coordination with strategic consumers in China. Renew. Energy 2014, 68, 236–244. [Google Scholar] [CrossRef]
- Jo, J.H.; Loomis, D.G.; Aldeman, M.R. Optimum penetration of utility-scale grid-connected solar photovoltaic system in Illinois. Renew. Energy 2013, 60, 20–26. [Google Scholar] [CrossRef]
- Nadia, A.; Daniel, M.K. Innovations in financing that drive cost parity for long-term electricity sustainability: An assessment of Italy, Europe’s fastest growing solar photovoltaic market. Energy Sustain. Dev. 2014, 19, 130–137. [Google Scholar]
- Ahmad, B.A.; Zeeshan, A.K. Recent progress in renewable energy—Remedy of energy crisis in Pakistan. Renew. Sustain. Energy Rev. 2014, 33, 236–253. [Google Scholar]
- Peggy, M.; Kenneth, B.K. Modelling tools to evaluate China’s future energy system—A review of the Chinese perspective. Energy 2014, 69, 132–143. [Google Scholar]
- Zhou, S.; Zhang, X. Nuclear energy development in China: A study of opportunities and challenges. Energy 2010, 35, 4282–4288. [Google Scholar] [CrossRef]
- Wang, Y.; Zhou, S.; Hou, H. Cost and CO2 reductions of solar photovoltaic power generation in China: Perspectives for 2020. Renew. Sustain. Energy Rev. 2014, 39, 370–380. [Google Scholar] [CrossRef]
- Guo, X.D.; Guo, X.P. China’s photovoltaic power development under policy incentives: A system dynamics analysis. Energy 2015, 93, 589–598. [Google Scholar] [CrossRef]
- Liu, L.; Zong, H.; Zhao, E.; Chen, C.; Wang, J. Can China realize its carbon emission reduction goal in 2020: From the perspective of thermal power development. Appl. Energy 2014, 124, 199–212. [Google Scholar] [CrossRef]
- Zhao, X.; Ma, Q.; Yang, R. Factors influencing CO2 emissions in China’s power industry: Co-integration analysis. Energy Policy 2013, 57, 89–98. [Google Scholar] [CrossRef]
- Tan, Z.; Zhang, H.; Shi, Q.; Xu, J. Joint optimization model of generation side and user side based on energy-saving policy. Electr. Power Energy Syst. 2014, 57, 135–140. [Google Scholar] [CrossRef]
- SheikhiFini, A.; Moghaddam, M.P.; Sheikh-El-Eslami, M.K. A dynamic model for distributed energy resource expansion planning considering multi-resource support schemes. Electr. Power Energy Syst. 2014, 60, 357–366. [Google Scholar] [CrossRef]
- Zhu, H.; Huang, G. Dynamic stochastic fractional programming for sustainable management of electric power systems. Electr. Power Energy Syst. 2013, 53, 553–563. [Google Scholar] [CrossRef]
- Salman, A.; Razman bin, M.T. Using system dynamics to evaluate renewable electricity development in Malaysia. Renew. Electr. Dev. 2013, 43, 24–39. [Google Scholar]
- Li, L.; Sun, Z. Dynamic energy control for energy efficiency improvement of sustainable manufacturing systems using markov decision process. Cybern. Syst. 2013, 43, 1195–1205. [Google Scholar] [CrossRef]
- Santiago, M.; Luis, J.M.; Felipe, B. A system dynamics approach for the photovoltaic energy market in Spain. Energy Policy 2013, 60, 142–154. [Google Scholar]
- Garcia, E.; Mohanty, A.; Lin, W.; Cherry, S. Dynamic analysis of hybrid energy systems under flexible operation and variable renewable generation-Part II: Dynamic cost analysis. Energy 2013, 52, 17–26. [Google Scholar] [CrossRef]
- Guo, X.P.; Guo, X.D. Nuclear power development in China after the restart of new nuclear construction and approval: A system dynamics analysis. Renew. Sustain. Energy Rev. 2016, 57, 999–1007. [Google Scholar] [CrossRef]
- Frederick, A.A.; David, O.Y.; Alex, A.P. A systems dynamics approach to explore traffic congestion and air pollution link in the city of Accra, Ghana. Sustainability 2010, 2, 252–265. [Google Scholar]
- Jeon, C.; Shin, J. Long-term renewable energy technology valuation using system dynamics and Monte Carlo simulation: Photovoltaic technology case. Energy 2014, 66, 447–457. [Google Scholar] [CrossRef]
- Ali, K.; Mustafa, H. Exploring the options for carbon dioxide mitigation in Turkish electric power industry: System dynamics approach. Energy Policy 2013, 60, 675–686. [Google Scholar]
- Feng, Y.; Chen, S.; Zhang, L. System dynamics modeling for urban energy consumption and CO2 emissions: A case study of Beijing, China. Ecol. Model. 2013, 252, 44–52. [Google Scholar] [CrossRef]
- Li, F.; Dong, S.; Li, Z.; Li, Y.; Wan, Y. The improvement of CO2 emission reduction policies based on system dynamics method in traditional industrial region with large CO2 emission. Energy Policy 2012, 51, 683–695. [Google Scholar] [CrossRef]
- Nastaran, A.; Abbas, S. A system dynamics model for analyzing energy consumption and CO2 emission in Iranian cement industry under various production and export scenarios. Energy Policy 2013, 58, 75–89. [Google Scholar]
- Kamarzamana, N.A.; Tan, C.W. A comprehensive review of maximum power point tracking algorithms for photovoltaic systems. Renew. Sustain. Energy Rev. 2014, 37, 585–598. [Google Scholar] [CrossRef]
- Zheng, M.; Zhang, K.; Dong, J. Overall review of China’s wind power industry: Status quo, existing problems and perspective for future development. Renew. Sustain. Energy Rev. 2013, 24, 379–386. [Google Scholar]
- Yuan, X.H.; Ji, X.; Chen, H. Urban dynamics and multiple-objective programming: A case study of Beijing. Commun. Nonlinear Sci. Numer. Simul. 2008, 13, 1998–2017. [Google Scholar] [CrossRef]


| Scenarios | Policy Measures | Policy Objectives |
|---|---|---|
| Scenario 1 | No air-pollution control policies. | No policy objectives |
| Scenario 2 | fundamental policy: (1) Restrict new coal-fired power generation project; (2) Stimulate renewable energy generation; (3) Improve price mechanism of renewable energy generation; (4) Control energy consumption; (5) Improve the efficiency of coal utilization; (6) Adjust industrial structure. | fundamental policy: (1) Non-fossil fuel energy share should reach 13% in 2017. |
| Scenario 3 | fundamental policy: The same as above. supporting policy: (1) Restrict coal consumption; (2) Outline the ‘feed PV power to grid after self-consumption’ principle for the development of distributed PV power; (3) Set whole electricity subsidy and purchase mechanism for distributed PV power; (4) Accelerate power grids construction; (5) Increase benchmark prices for PV power generation; (6) Accelerate technology advancement to increase utilization hours and reduce cost. | fundamental policy: The same as above. supporting policy: (1) Installed PV capacity should reach 35,000 MW in 2017, and reach 100,000 MW in 2020; (2) Distributed PV installed capacity should reach 15,000 MW in 2017; and reach 40,000 MW in 2020; (3) Interregional power transmission to Jing-Jin-Ji region, Yangtse River Delta and Pearl River Delta should reach 68 million kWh. |
© 2016 by the authors; licensee MDPI, Basel, Switzerland. This article is an open access article distributed under the terms and conditions of the Creative Commons Attribution (CC-BY) license (http://creativecommons.org/licenses/by/4.0/).
Share and Cite
Guo, X.; Niu, D.; Xiao, B. Assessment of Air-Pollution Control Policy’s Impact on China’s PV Power: A System Dynamics Analysis. Energies 2016, 9, 336. https://doi.org/10.3390/en9050336
Guo X, Niu D, Xiao B. Assessment of Air-Pollution Control Policy’s Impact on China’s PV Power: A System Dynamics Analysis. Energies. 2016; 9(5):336. https://doi.org/10.3390/en9050336
Chicago/Turabian StyleGuo, Xiaodan, Dongxiao Niu, and Bowen Xiao. 2016. "Assessment of Air-Pollution Control Policy’s Impact on China’s PV Power: A System Dynamics Analysis" Energies 9, no. 5: 336. https://doi.org/10.3390/en9050336