Article

Online Diagnosis for the Capacity Fade Fault of a Parallel-Connected Lithium Ion Battery Group

1
School of Electrical Engineering and Automation, Harbin Institute of Technology, Harbin 150001, China
2
College of Electronic Science, Northeast Petroleum University, Daqing 163318, China
*
Author to whom correspondence should be addressed.
Energies 2016, 9(5), 387; https://doi.org/10.3390/en9050387
Submission received: 18 March 2016 / Revised: 27 April 2016 / Accepted: 9 May 2016 / Published: 20 May 2016

Abstract

:
In a parallel-connected battery group (PCBG), capacity degradation is usually caused by the inconsistency between a faulty cell and other normal cells, and the inconsistency occurs due to two potential causes: an aging inconsistency fault or a loose contacting fault. In this paper, a novel method is proposed to perform online and real-time capacity fault diagnosis for PCBGs. Firstly, based on the analysis of parameter variation characteristics of a PCBG with different fault causes, it is found that PCBG resistance can be taken as an indicator for both seeking the faulty PCBG and distinguishing the fault causes. On one hand, the faulty PCBG can be identified by comparing the PCBG resistance among PCBGs; on the other hand, two fault causes can be distinguished by comparing the variance of the PCBG resistances. Furthermore, for online applications, a novel recursive-least-squares algorithm with restricted memory and constraint (RLSRMC), in which the constraint is added to eliminate the “imaginary number” phenomena of parameters, is developed and used in PCBG resistance identification. Lastly, fault simulation and validation results demonstrate that the proposed methods have good accuracy and reliability.

1. Introduction

A battery system is the key power source of an electric vehicle (EV) and guarantees dynamic vehicle performance and range. To meet the power and capacity requirements for EVs, batteries are often connected in parallel or in series. Unfortunately, capacity fading of batteries can occur for various reasons, such as temperature [1,2,3]. On one hand, the capacity degradation inconsistency between cells will cause pack capacity fading. On the other hand, loose contacting could increase the contact resistance and lead to the early approach of the cut-off voltage during charge/discharge cycles, which also decreases the pack capacity. Furthermore, the increase of contact resistance is a potential cause of thermal runaway [4]. Therefore, fault diagnosis for capacity fading is essential for maintaining battery performance and safety.
The research on fault diagnosis is based on parameter estimation, state estimation, experience, and other methods [5]. Previous research on fault diagnosis mainly focuses on the capacity estimation of single cells and battery packs [6,7,8,9,10,11], internal resistance prediction [12], the power fading fault mechanism of single cell [13], etc. Gregory J. Offer et al. [14] proposed a diagnostic method for differential resistance increase. They obtained the differential resistance of battery packs by conducting a pulse current test. The fault of differential resistance increase has also been analyzed through electrochemical impedance spectroscopy (EIS). Yuejiu Zheng et al. [15] proposed a method for power fade fault identification of battery packs, in which the Shannon entropy was taken to distinguish the increase of internal resistance and contact resistance. The power fade fault was discovered by adding an auxiliary inspection window. Kazuhiko Takeno et al. [16] applied traditional frequency response method to measure the pack internal resistance. Jürgen Remmlinger et al. [17] used interval current pulse to identify internal resistance of single cell.
However, the existing methods need offline EIS tests, online inspection window tests and other auxiliary tests, and they are not online fault diagnoses in the strict sense. In addition, some of them need temperature compensation or battery module simulation to perform fault diagnosis. These disadvantages have hindered the advance of online fault diagnosis application. Little research has focused on online fault diagnosis of the capacity fade fault of PCBGs.
This work proposes a novel method to realize online and real-time capacity fault diagnosis for PCBGs. Firstly, parameter variation characteristics of a PCBG with different fault causes are analyzed in detail. Then online diagnosis for capacity fade fault of PCBGs is developed, in which PCBG resistance is taken as the indicator for both seeking the faulty PCBG and distinguishing the fault causes. Furthermore, for online applications, a novel RLSRMC, in which the constraint is added to eliminate the “imaginary number” phenomena of parameters, is developed and used in PCBG resistance identification. Lastly, fault simulation and validating results demonstrate that the proposed methods have good accuracy and reliability.

2. Online Fault Diagnosis for Capacity Fade

2.1. Fault Characteristic Analysis

In a PCBG, capacity degradation is usually caused by the inconsistency between a faulty cell and other normal cells, and the inconsistency often occurs for two potential reasons: an aging inconsistency fault or a loose contacting fault [14,15]. In this paper, a number of PCBGs connected in series is called a “battery pack”. A battery pack with 4 PCBGs in series, in which each PCBG has 2 cells connected in parallel, is called a “2P4S battery pack”. Figure 1 shows a 2P4S battery pack. In Figure 1a, Cell 3 is an aged cell, other cells are new cells, and the cell aging inconsistency fault occurs as a result. PCBG 2 is the PCBG with a capacity fade fault. The cell aging inconsistency fault greatly aggravates the losses of PCBG capacity, and will accelerate the aging of cells of the PCBG. In Figure 1b, Cell 7 is the cell with loose contacting fault, and PCBG 4 is the PCBG with capacity fade fault. The loose contacting will result in the increase of contact resistance. Also, the increased overpotential leads to the terminal voltage reaching cut-off voltage early, and thus the cell capacity decreases.
It should be noted that the factors mentioned above that cause cell capacity decrease cannot be measured directly. Fault diagnosis for capacity fade of battery packs consists of two main aspects: (1) seeking out the faulty PCBG, whose capacity limits the whole battery pack’s capacity; and (2) confirming the specific capacity degradation cause for the sought PCBG.
The characteristic of capacity fade fault for a PCBG in a battery pack is analyzed as follows. The open circuit voltage (OCV) and cell resistance are the main parameters which describe the battery behavior. The equivalent circuit model (ECM) of PCBG with two batteries is shown in Figure 2, which only takes the influence of OCV and cell resistance into consideration. In the ECM, a PCBG is equivalent to a single cell. The cell resistance R i gives the contact resistances R c along with the cell ohmic resistance R i , i.e., R i = R i + R c , where R i , f , R i , h and R i , f are cell resistance of a faulty cell, cell resistance of a healthy cell, and PCBG resistance of a faulty PCBG respectively. R i . f , R i , h and R i , p f are the ohmic resistances of a faulty battery, a healthy battery, and a faulty PCBG respectively. R c , f , R c , h and R c , p f are the contact resistances of a faulty battery, a healthy battery, and a faulty PCBG respectively. O C V f , O C V h and O C V p f are the OCVs of a faulty battery, a healthy battery, and a faulty PCBG respectively.
In this work, the fault diagnosis is based on the comparison of the PCBG resistances among PCBGs. As temperature is a major factor affecting the online identified PCBG resistances, the online identified PCBG resistances can be compared with each other only if the temperature influence have been compensated or eliminated. Because the cells in the same battery pack are always at the same ambient temperatures, it can be assumed that the temperature’s influence on the cell resistance in the same battery pack is the same and does not need to be considered separately.
To investigate the fault characteristic of capacity fade for PCBGs, the characteristics of PCBG OCV and PCBG resistance are analyzed. According to Thevenin’s equation and superposition theorem,
O C V p f = O C V h R i , f + O C V f R i , h R i , f + R i , h
R i , p h = R i , h / / R i , f = R i , h R i , f R i , h + R i , f
The cell aging inconsistency and cell loose contacting both lead to changes in cell resistance, and this change will cause faulty PCBG resistance. Consequently, the variation of faulty PCBG resistance will be discussed below.
Initially, the parameters of the cells in a PCBG are consistent. Thus the depth-of-discharge (DOD) of a fault cell and that of a healthy cell are the same. Figure 3 and Figure 4 respectively indicate the relationship between ohmic resistance and DOD, the relationship between OCV and DOD at different aging states. The data for Figure 3 and Figure 4 is obtained by the Hybrid Pulse Power Characterization (HPPC) test. The curves labeled as 0%, 10%, 22% and 51% indicate that the aging state is 0%, 10%, 22% and 51%. DOD is defined as the following equation:
D O D = 1 C N 0 t I d τ × 100 %
where CN represents the rated capacity of the new battery.
On one hand, batteries of a series connected battery pack will not be full charged because the batteries connected in series will not be charged with constant voltage (CV). On the other hand, the capacity of the EV will not be discharged to empty in practice and about 10% capacity will be reserved, generally. As a result, this paper focuses particularly on 5%–95% DOD of a cell. The behavior of a cell between 5%–95% DOD was analyzed and simulated.
Figure 3 and Figure 4 indicate that at the same DOD, R i , f increases and O C V f decreases. Then, the current of the faulty cell decreases, whereas that of the healthy cell increases. Therefore, for the healthy cell, the DOD increases, O C V h decreases, and R i , h slightly increases. As a result of the increase of R i , h and R i , f , R i , p f also increases. The variation of ohmic resistance for the battery is irreversible and slow [15]. Equation (2) shows that if cell aging inconsistency fault causes slow variation of R i , f , the variation of R i , p f is also slow. This means the variance of R i , f is almost consistent with that of healthy PCBGs. The analysis above shows that the cell aging inconsistency fault results in a larger R i , p f than PCBG resistances of healthy PCBGs while the variance of R i , p f is almost consistent with variance of PCBG resistance of healthy PCBGs.
For cell loose contacting fault, the cell resistance of the faulty cell would be greater than that of healthy cells. If R i , f increases, the current of the faulty cell will decrease, whereas that of a healthy cell will increase. As a result, DOD of a faulty cell decreases, whereas that of healthy cell increases. Figure 3 and Figure 4 indicate that the above mentioned DOD variation of the faulty cell and healthy cells causes the increase of O C V f , decrease of O C V h and increase of R i , h . With the increase of R i , h and R i , f (especially that of R i , p f ), R i , p f increases too. Cell loose contacting causes the cell resistance of a faulty cell to become unstable; thus, the dataset of R i , f is much looser than the dataset of cell resistance for healthy batteries [15]. According to Equation (2), if the dataset of R i , f is looser than that of other cells, the dataset of R i , p f is looser than dataset of PCBG resistance for healthy PCBGs. The analysis above shows that the cell loose contacting fault causes PCBG resistance and its variance of faulty PCBG to be larger than those of healthy PCBGs.
After the above analysis, we conclude that the two fault causes could be identified and distinguished by the PCBG resistance variation of the faulty PCBG. If capacity fade fault for the PCBG is caused by cell loose contacting, the PCBG resistance and the variance of the PCBG resistance of the faulty PCBG will be significantly greater than that of healthy PCBGs. If the capacity fade fault of the PCBG is caused by cell aging inconsistency, only the PCBG resistance of the fault PCBG will be significantly greater than that of healthy PCBGs, and the PCBG resistance variance of the faulty PCBG is consistent with that of healthy PCBGs.

2.2. Online Parameter Identification

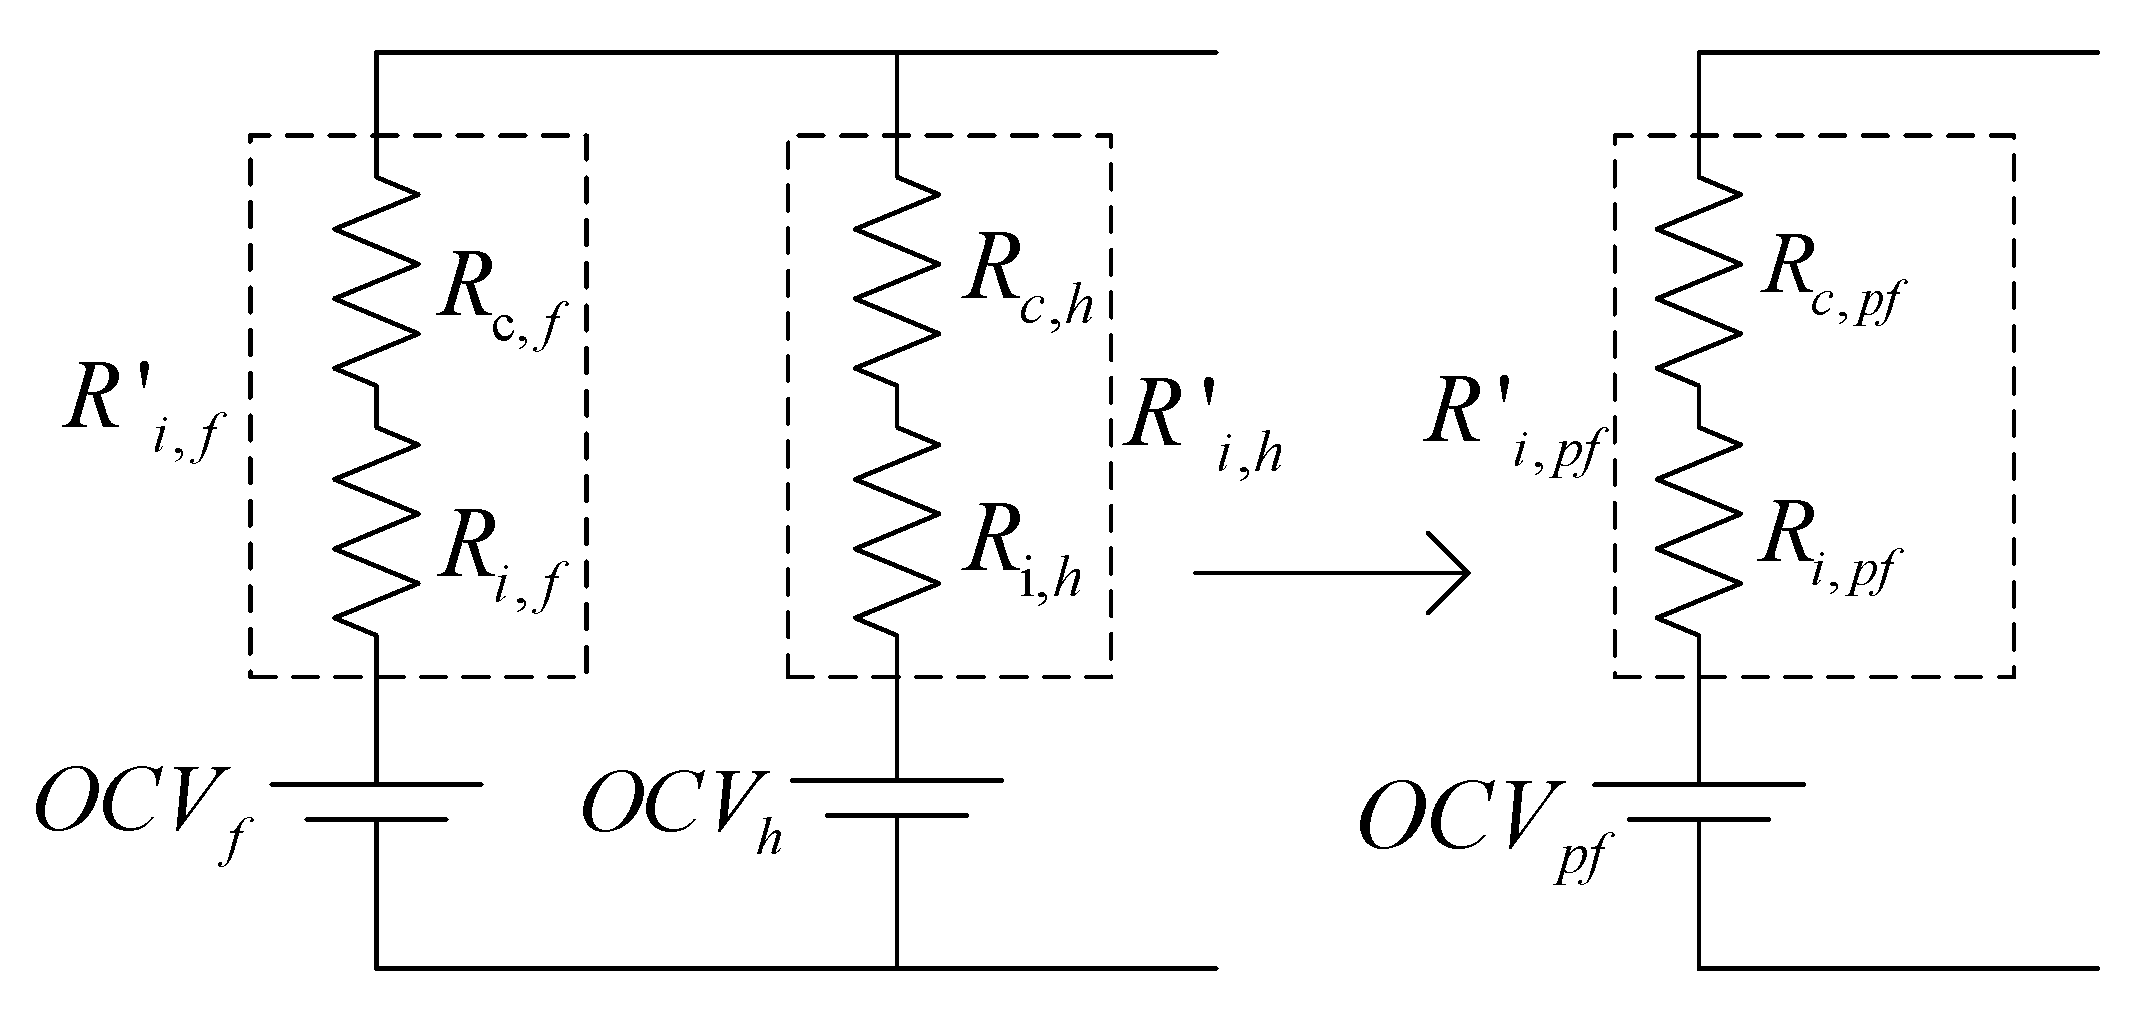
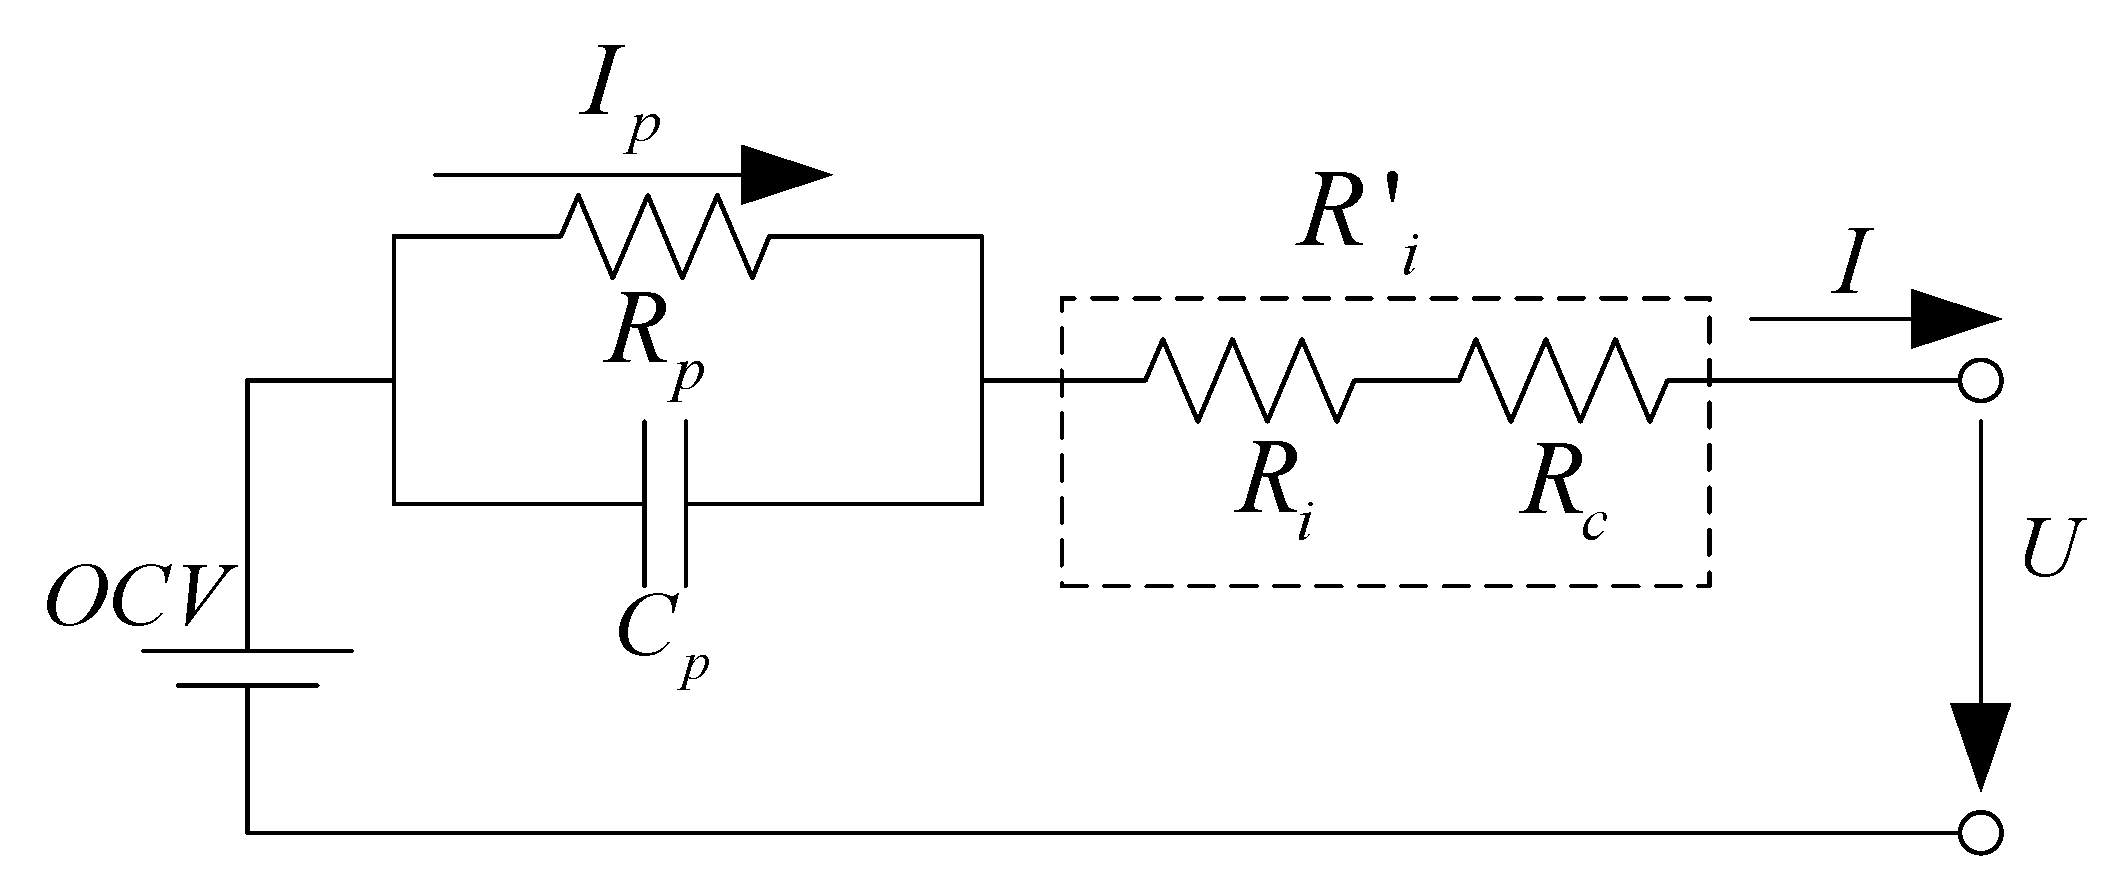
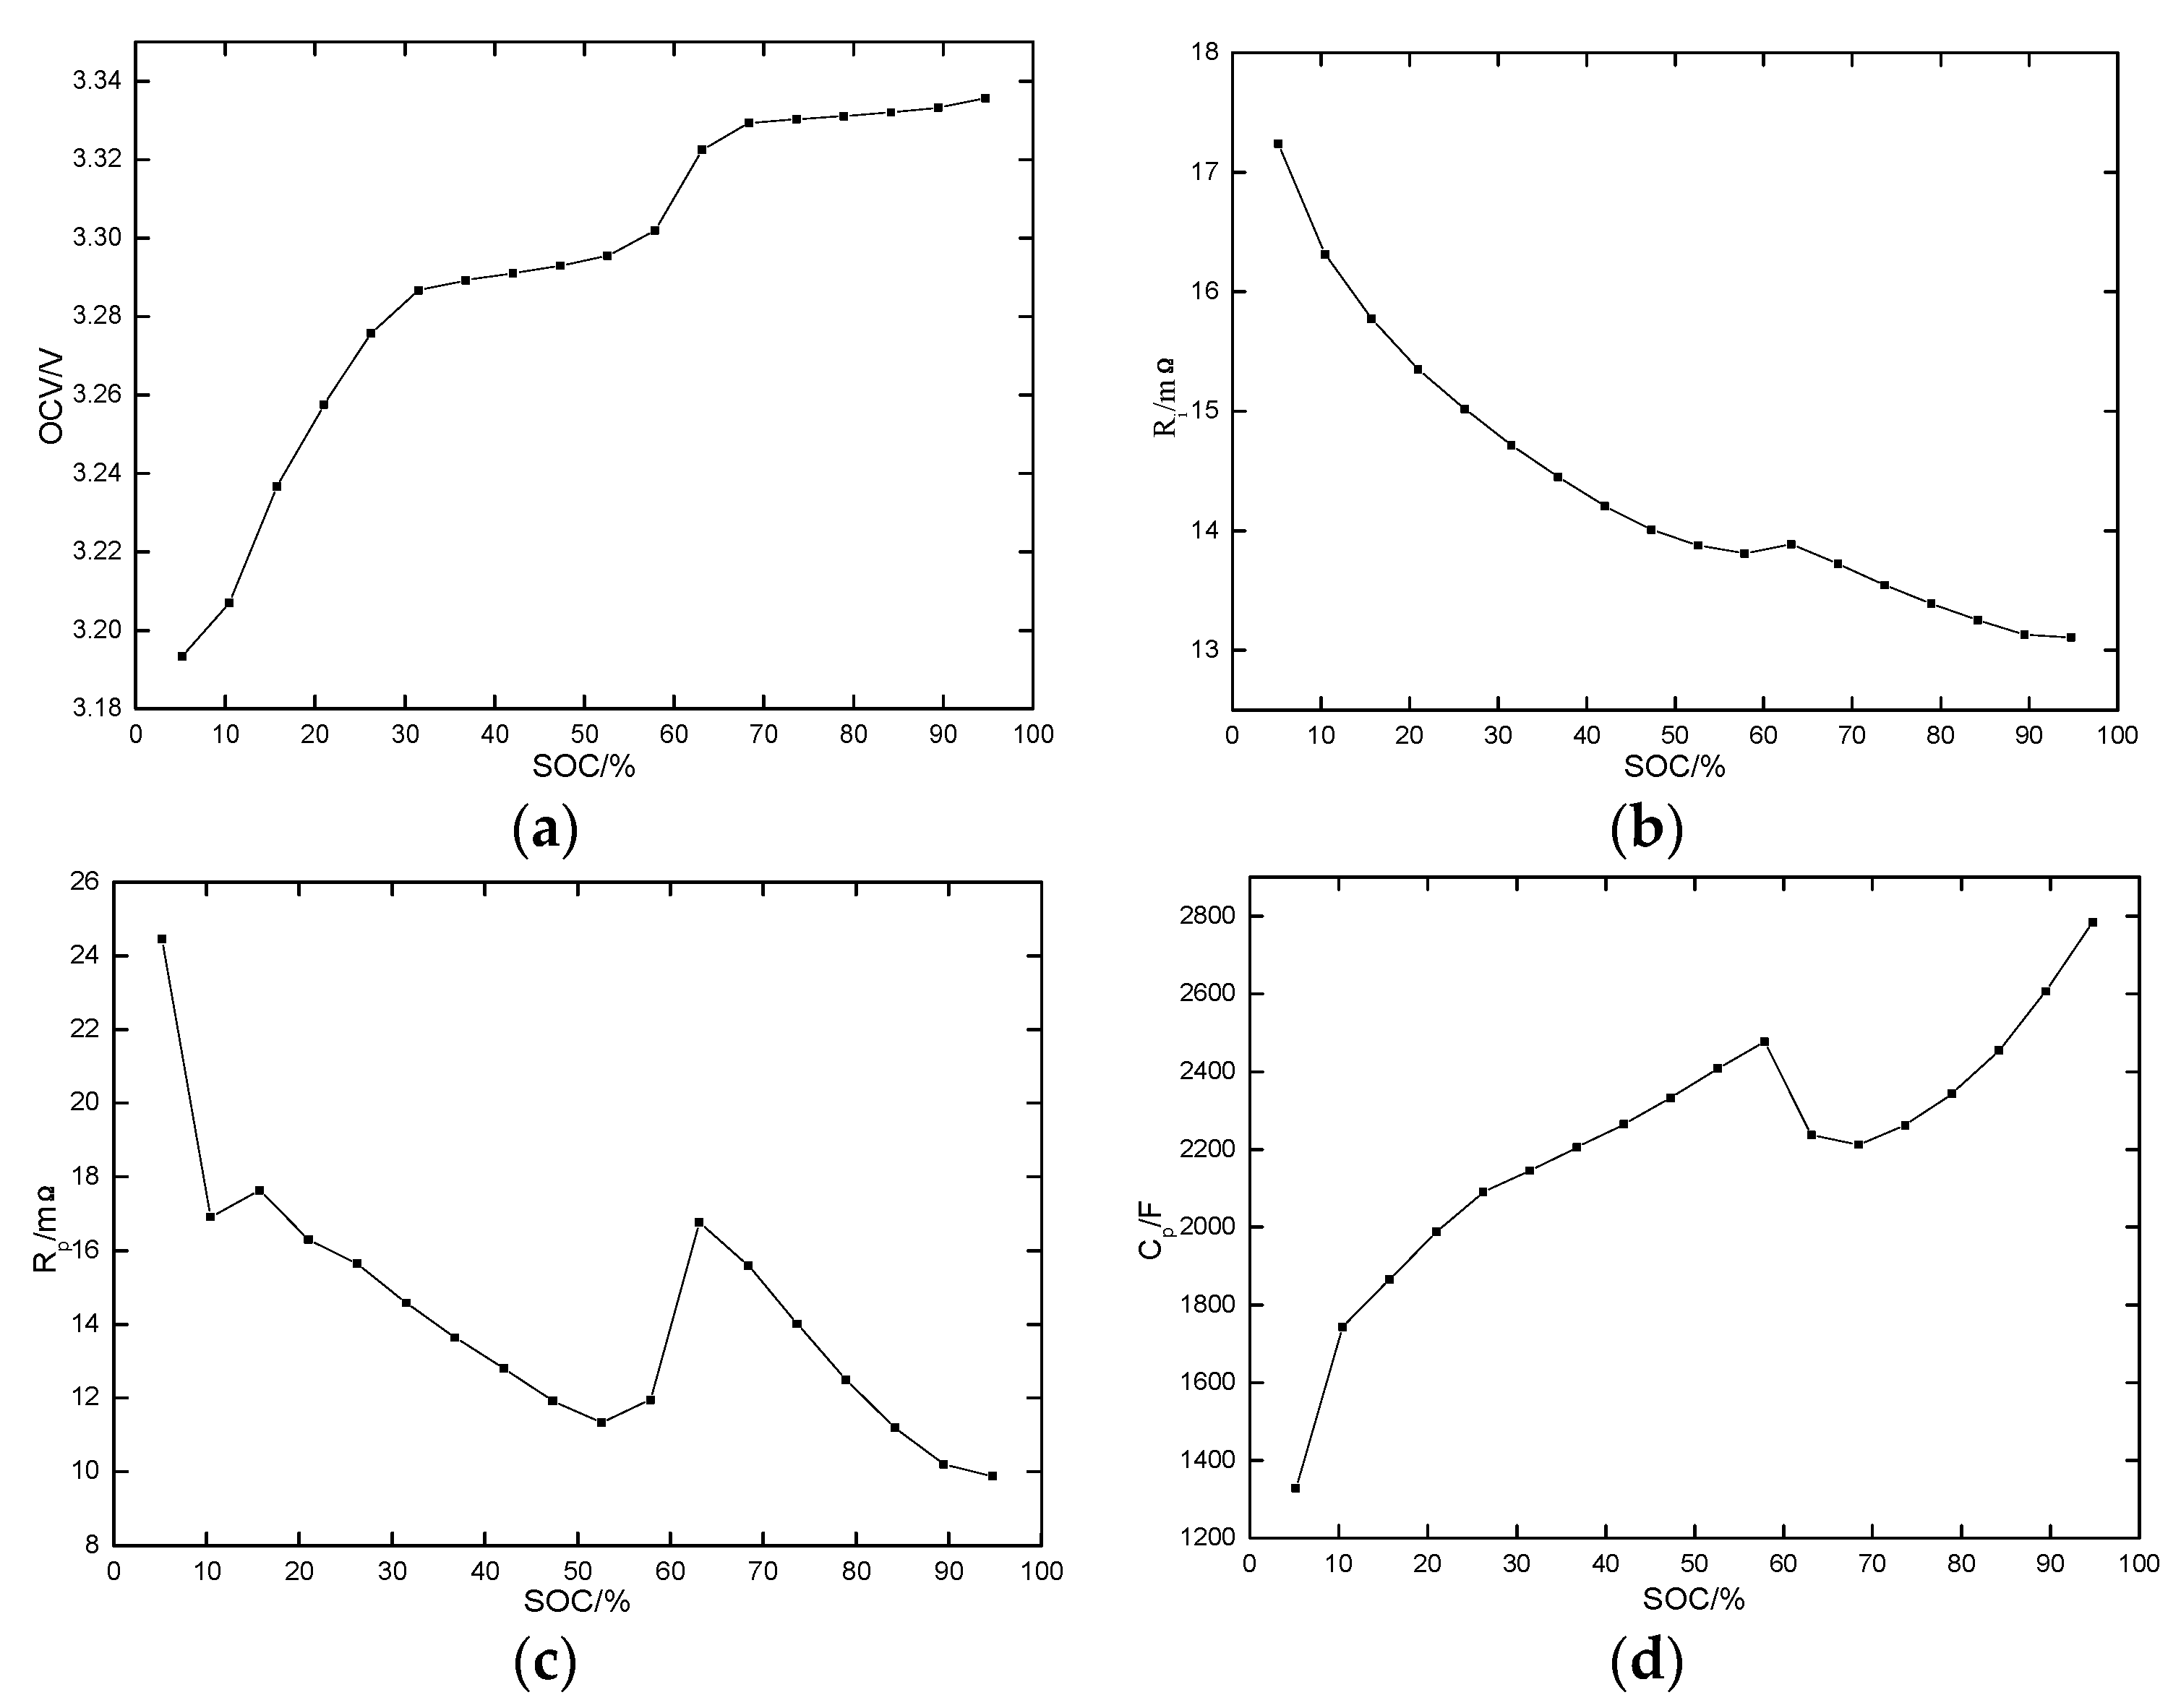
2.2.1. Description of the Battery Behavior

To facilitate the fault diagnosis, a “PCBG” is equivalent to a single cell. An accurate battery model is required to ensure accuracy of fault diagnosis. The selected model should not only provide a good fit to the dynamic characteristics of a battery but also have a reasonable computational complexity for a Battery Management System (BMS). Moreover, it is necessary to add an electric contact resistance to the ECM to present the contact resistances in the battery pack connections, as the contact resistances are comparable to internal resistances and cannot be neglected [14]. Thus, the ECM which considers the contact resistance of the cell is taken to analyze the capacity fade fault, as shown in Figure 5 [18,19,20].
The cell resistance or PCBG resistance R i gives the contact resistances R c along with the cell ohmic resistance R i , i.e., R i = R i + R c . OCV is open circuit voltage; and R p and C p are polarization resistance and polarization capacitance, respectively.
Based on the literature [15], the state equations of the ECM in Figure 5 are shown in Equations (4) and (5).
U ˙ C p = 1 C p R p U C p + I C p
U = U C p I R i + O C V
The state equation is expressed in the linear discrete system as the discrete state space equation:
U ( ( k + 1 ) T s ) = e T s C p R p U ( k T s ) + [ e T s C p R p R i ( 1 e T s C p R p ) R p ] I ( k T s ) R i I ( ( k + 1 ) T s ) + ( 1 e T s C p R p ) O C V
where Ts is the sampling time and k T s is the time series. With this discrete state space equation, parameters can be estimated by the optimal state estimation. The difference Equation (6) can be written as equation:
U ( ( k + 1 ) T s ) = θ 1 U ( k T s ) + θ 2 I ( k T s ) + θ 3 ( I ( ( k + 1 ) T s ) ) + θ 4
Equation (7) is converted into the following least squares equation:
U ( N ) = Ψ ( N ) θ
where
θ = [ θ 1 θ 2 θ 3 θ 4 ]
{ θ 1 = e T s C p R p θ 2 = e T s C p R p R i ( 1 e T s C p R p ) R p θ 3 = R i θ 4 = ( 1 e T s C p R p ) O C V
U ( N ) = [ U ( ( k + 1 ) T s ) U ( ( k + N ) T s ) ]
Ψ ( N ) = [ U ( k T s ) I ( k T s ) ( I ( ( k + 1 ) T s ) ) 1 U ( ( k + N 1 ) T s ) I ( ( k + N 1 ) T s ) ( I ( ( k + N ) T s ) ) 1 ] = [ ψ ( ( k + 1 ) T s ) ψ ( ( k + 2 ) T s ) ψ ( ( k + n ) T s ) ]
ψ ( ( k + 1 ) T s ) = [ U ( k T s ) I ( k T s ) ( I ( ( k + 1 ) T s ) 1 ]
If the parameter matrix θ is solved, then based on Equation (10) the parameters are as follows:
{ R i = θ 3 O C V = θ 4 1 θ 1 R p = θ 1 θ 3 θ 2 1 θ 1 C p = ( θ 1 1 ) T s ( θ 1 θ 3 θ 2 ) log θ 1
The sampling time in this work is Ts = 1 s, then
{ R i = θ 3 O C V = θ 4 1 θ 1 R p = θ 1 θ 3 θ 2 1 θ 1 C p = θ 1 1 ( θ 1 θ 3 θ 2 ) log θ 1

2.2.2. Mathematical Algorithm Selection

To ensure accurate online estimation results of the model parameters, a reasonable mathematical algorithm is needed. The recursive least squares algorithm with restricted memory (RLSRM) can eliminate the “data saturation” phenomenon effectively and track the variation of time-varying parameters [21]. Thus, the RLSRM algorithm is chosen to identify equivalent parameters of the PCBG online at first. But in the experiment, the identified C p using RLSRM algorithm sometimes is an imaginary number, while in practice C p is a real number. To eliminate “imaginary number” phenomena of C p , the RLSRMC algorithm is chosen [22].
Based on Equation (15), C p is
C p = θ 1 1 ( θ 1 θ 3 θ 2 ) log θ 1
In Equation (16), if θ 1 is a positive number in log θ 1 , C p must be a real number. This means the constraint is
θ 1 ε > 0
where ε is the minimum of θ 1 .
If ε is too large or too small, the optimal estimate of parameters could not be obtained. Based on Equation (10), θ 1 is
θ 1 = e T s C p R p
The sampling time in this work is Ts = 1s, so Equation (18) can be written as Equation (19).
θ 1 = e 1 C p R p
For a lithium ion battery, the minimum of R p C p is generally set to ( R p C p ) min = 0.1 , then the minimum of θ 1 is
θ 1 , min = e 10
Based on Equations (17) and (20), ε is set to ε = e 10 .
The steps for identifying the battery model parameters using RLSRMC algorithm are as follows:
(1)
Use the initial N groups of data to solve the initial value of the RLSRM directly using the least-squares method.
θ ^ N ( Ν ) = [ Ψ T ( N ) Ψ ( N ) ] 1 Ψ T ( N ) U ( N )
P ( N ) = [ Ψ T ( N ) Ψ ( N ) ] 1
where θ ^ N ( N ) is the estimated value of parameter θ at the N-th sampling time, which is solved by N groups’ data.
(2)
Solve P ( N + 1 ) , L ( N + 1 ) , and θ ^ N + 1 ( N + 1 ) using the recursive least squares method.
P ( N + 1 ) = P ( N ) P ( N ) ψ ( N + 1 ) ψ T ( N + 1 ) P ( N ) 1 + ψ T ( N + 1 ) P ( N ) ψ ( N + 1 )
L ( N + 1 ) = P ( N + 1 ) ψ ( N + 1 )
θ ^ N + 1 ( N + 1 ) = θ ^ N ( N ) + L ( N + 1 ) [ U ( N + 1 ) ψ T ( N + 1 ) θ ^ N ( N ) ]
In Equation (25), θ ^ N + 1 ( N + 1 ) is the estimated value of parameter θ at the (N + 1)-th sampling time, which is solved with (N+1) groups’ data.
(3)
Solve P * ( N + 1 ) , L * ( N + 1 ) , and θ ^ N ( N + 1 ) using RLSRM.
P * ( N + 1 ) = [ P 1 ( N + 1 ) ψ ( n ) ψ T ( n ) ] 1
L * ( N + 1 ) = P ( N + 1 ) ψ ( n ) [ 1 ψ T ( n ) P ( N + 1 ) ψ ( n ) ] 1
θ ^ N ( N + 1 ) = θ ^ N + 1 ( N + 1 ) L * ( N + 1 ) [ U ( n ) ψ T ( n ) θ ^ N + 1 ( N + 1 ) ]
In Equation (28), θ ^ N ( N + 1 ) is the estimated value of parameter θ at the (N + 1)-th sampling time, which is solved by N groups data.
(4)
Update the initial value of the next recursive operation. θ ^ N ( N ) is updated to θ ^ N ( N + 1 ) , and P ( N ) is updated to P * ( N + 1 ) .
(5)
If θ 1 < ε , then replace θ ^ N ( N + 1 ) by θ ^ N ( N + 1 ) . θ ^ N ( N + 1 ) is calculated as follows:
θ ^ N ( N + 1 ) = θ ^ N ( N + 1 ) + P 1 · ( N ) P 11 ( N ) [ ε θ ^ 1 ( N + 1 ) ]
P 1 · ( N ) is the first column of P ( N ) , and P 11 ( N ) is the data point of (1, 1) entry of P ( N ) .
(6)
Solve the battery model parameters from θ ^ N ( N + 1 ) . See Equation (15).
U ( N ) is the set of N groups sampling time series of U ( ( k + 1 ) T s ) ; the sampling time Ts is 1s. N is carefully determined. A large N is beneficial for estimation accuracy; the hypothesis that the estimated parameters are constant is suspicious because a large N makes the time interval too long to neglect parameter changes. N is related to the current, and the cell number of the PCBG. For the Federal Urban Driving Schedule (FUDS), N is 50 for a single battery, and N is 70 for a PCBG with two single cells.

2.3. Online Fault Diagnosis Algorithm

According to analysis, for the capacity fade fault of a PCBG in a battery pack, a PCBG with capacity fade fault can be identified by PCBG resistance deviation of PCBGs, and two common fault causes can be distinguished by the deviations of PCBG resistance variances. The online fault diagnosis for capacity fade of PCBG is proposed as follows.
(1)
Online and real-time identification of the PCBG resistance of the PCBGs, in which the RLSRMC algorithm is used. The steps of the identification are presented in Section 2.2.
(2)
Filtering process. In order to eliminate the interference, the average value of identified PCBG resistances for the prior 100 sample times is taken as the PCBG resistance of current sample time.
(3)
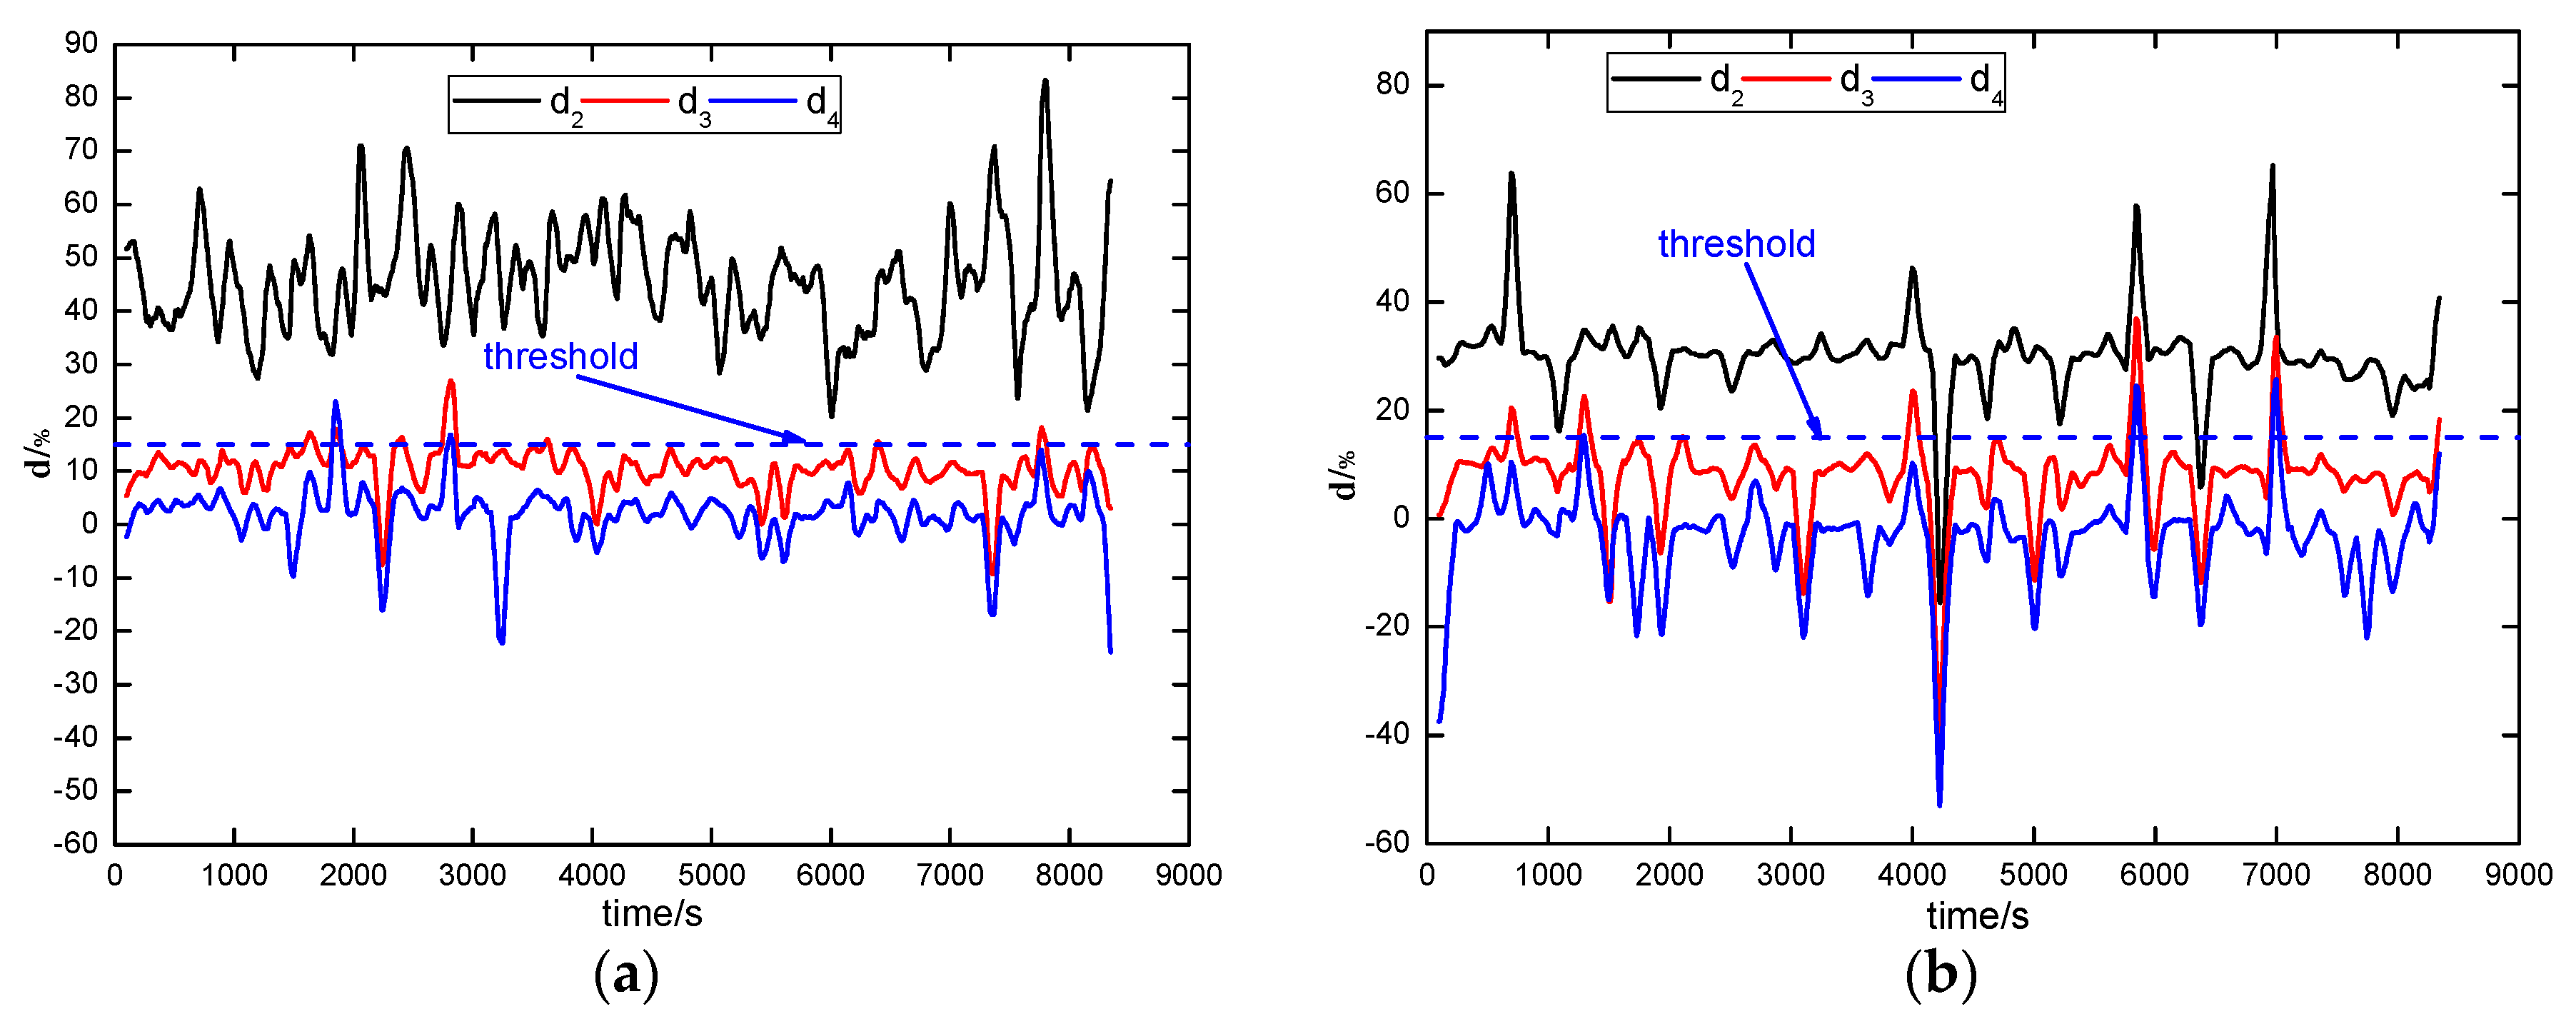
PCBG resistance deviation calculation. Taking the PCBG resistance of the first and second PCBG as reference values respectively, and calculate d n ( N ) , which is the PCBG resistance deviation of the n-th PCBG at the N-th sampling time according to Equation (30). R i , n ( N ) is the PCBG resistance of the n-th PCBG at the N-th sampling time, and R i , r e f ( N ) is the selected reference value of the PCBG resistance at the N-th sampling time.
d n ( N ) = R i , n ( N ) R i , r e f ( N ) R i , r e f ( N ) × 100 %
(4)
Identify the PCBG with capacity fade fault. If no significant PCBG resistance deviation is observed during the calculation process, there is no capacity fade fault occurs in the battery pack. Otherwise, the PCBG with an obviously larger deviation than other PCBGs is the PCBG with capacity fade fault.
(5)
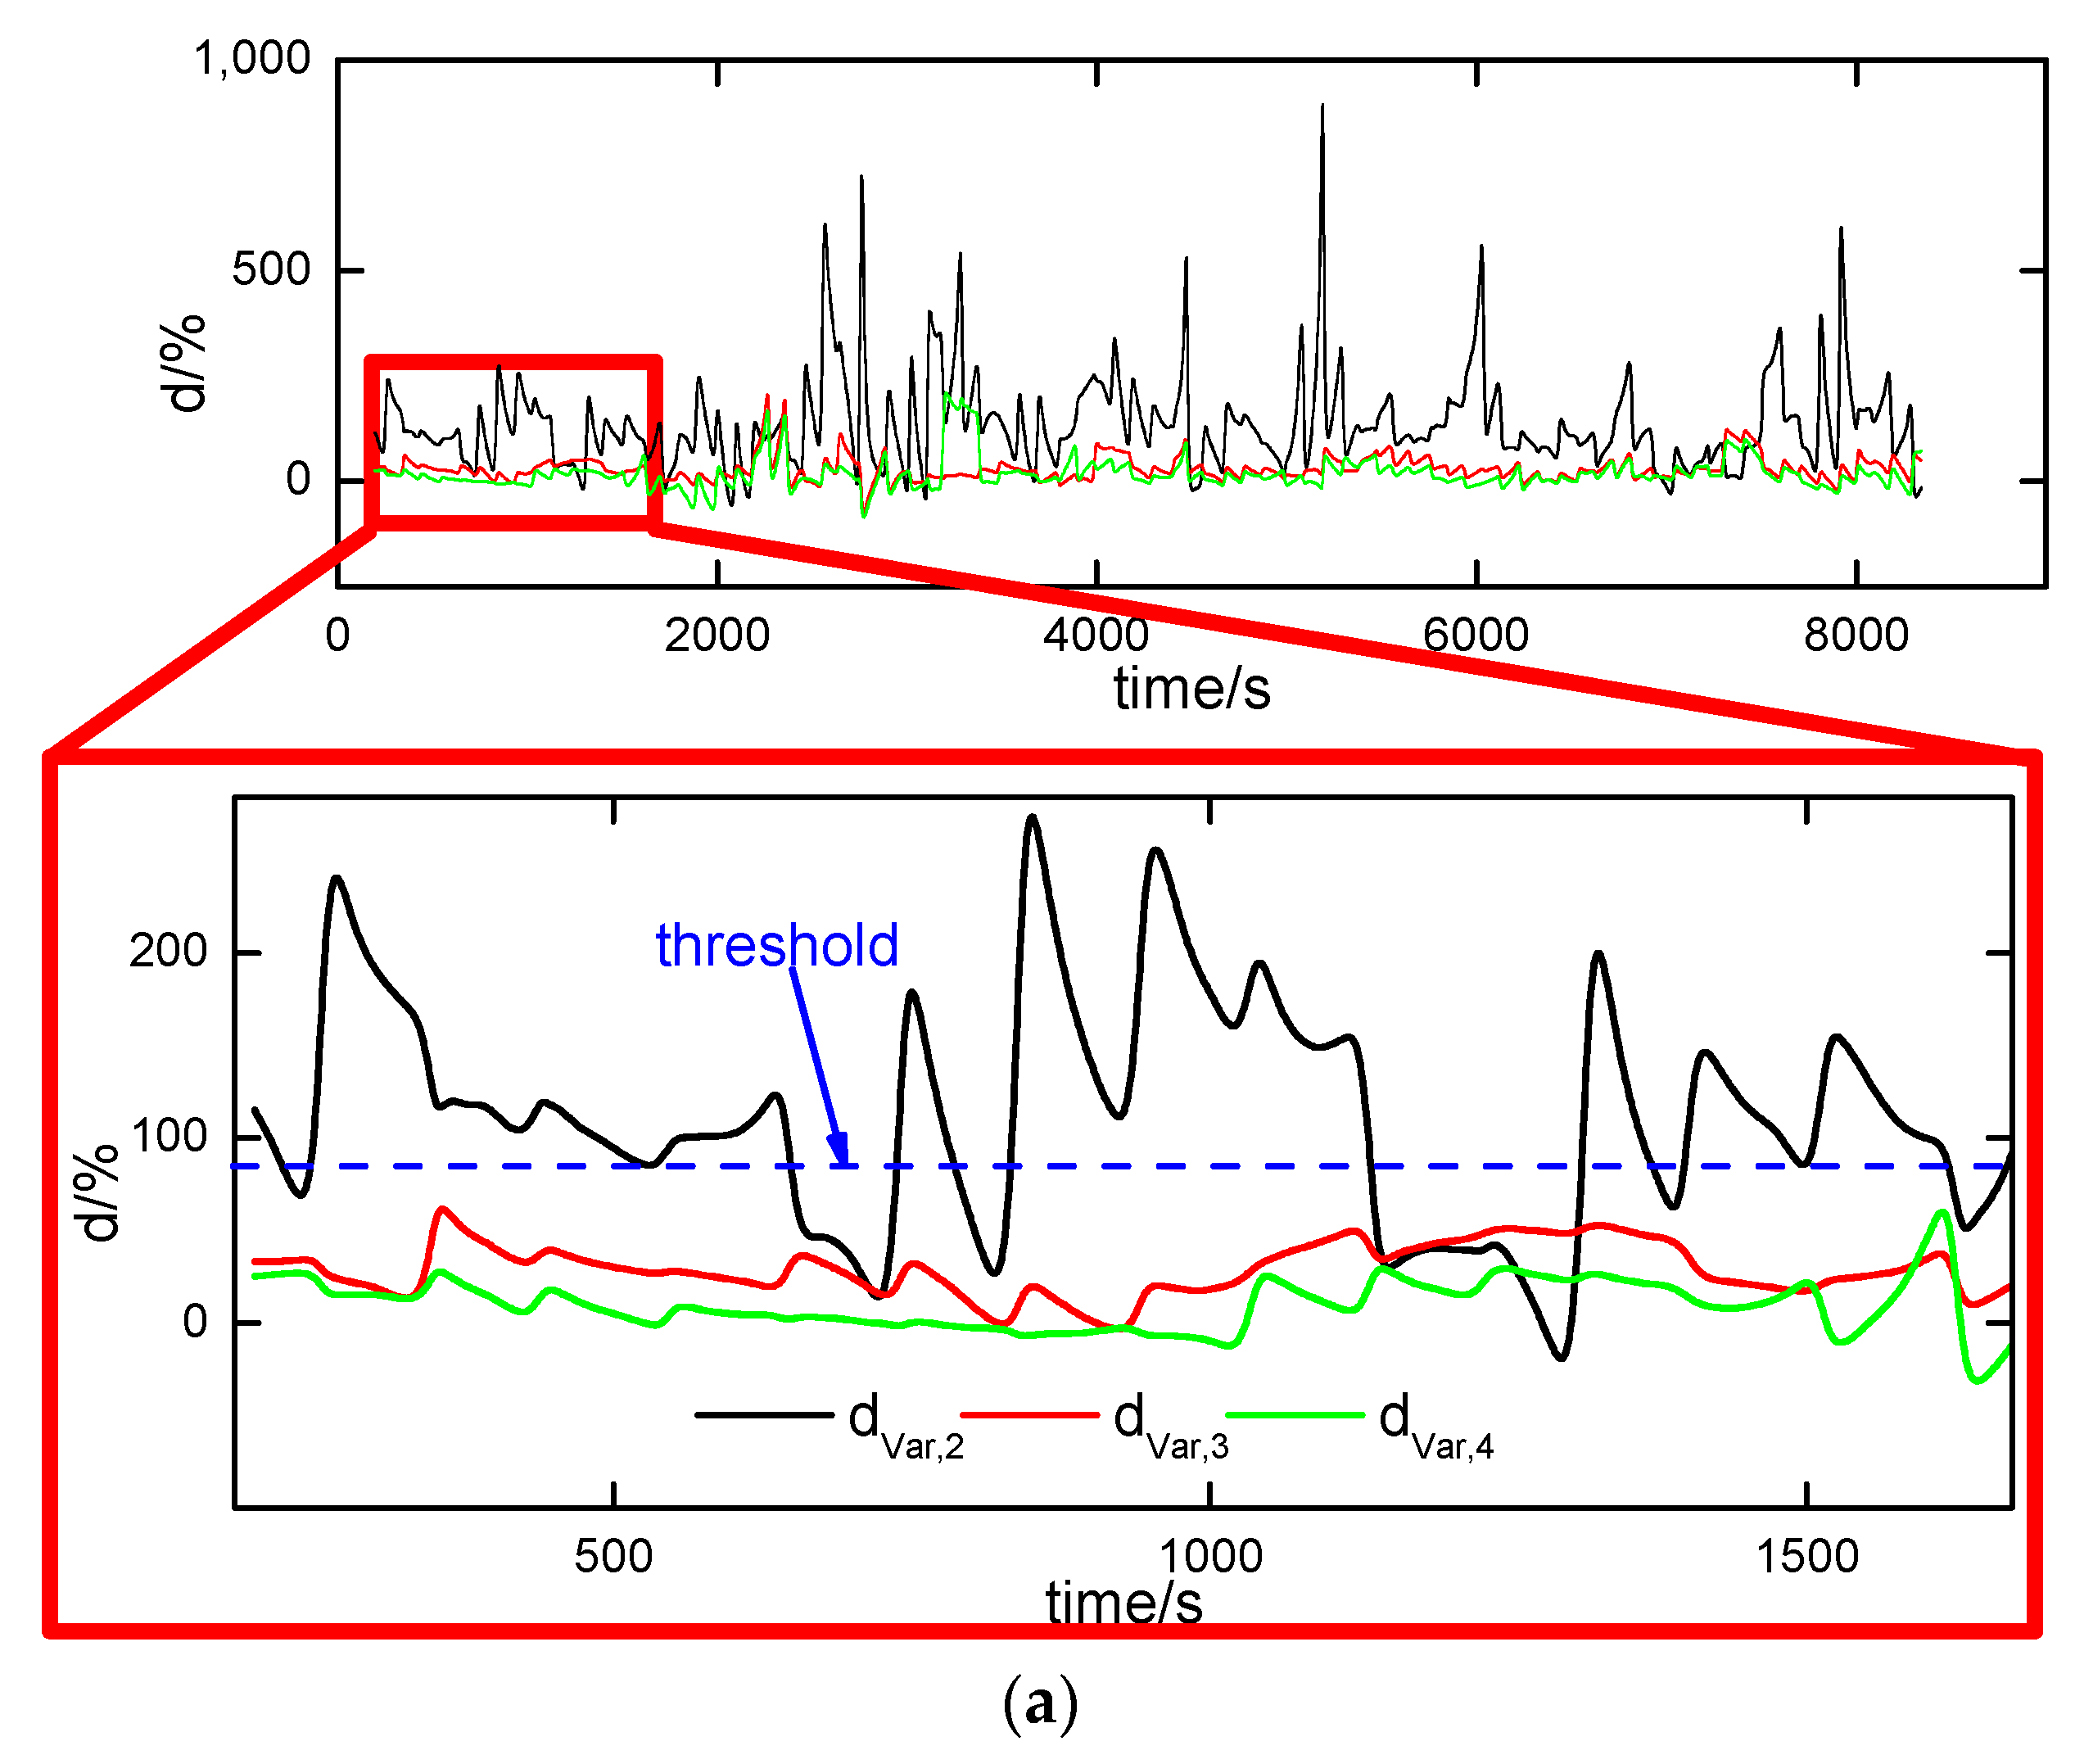
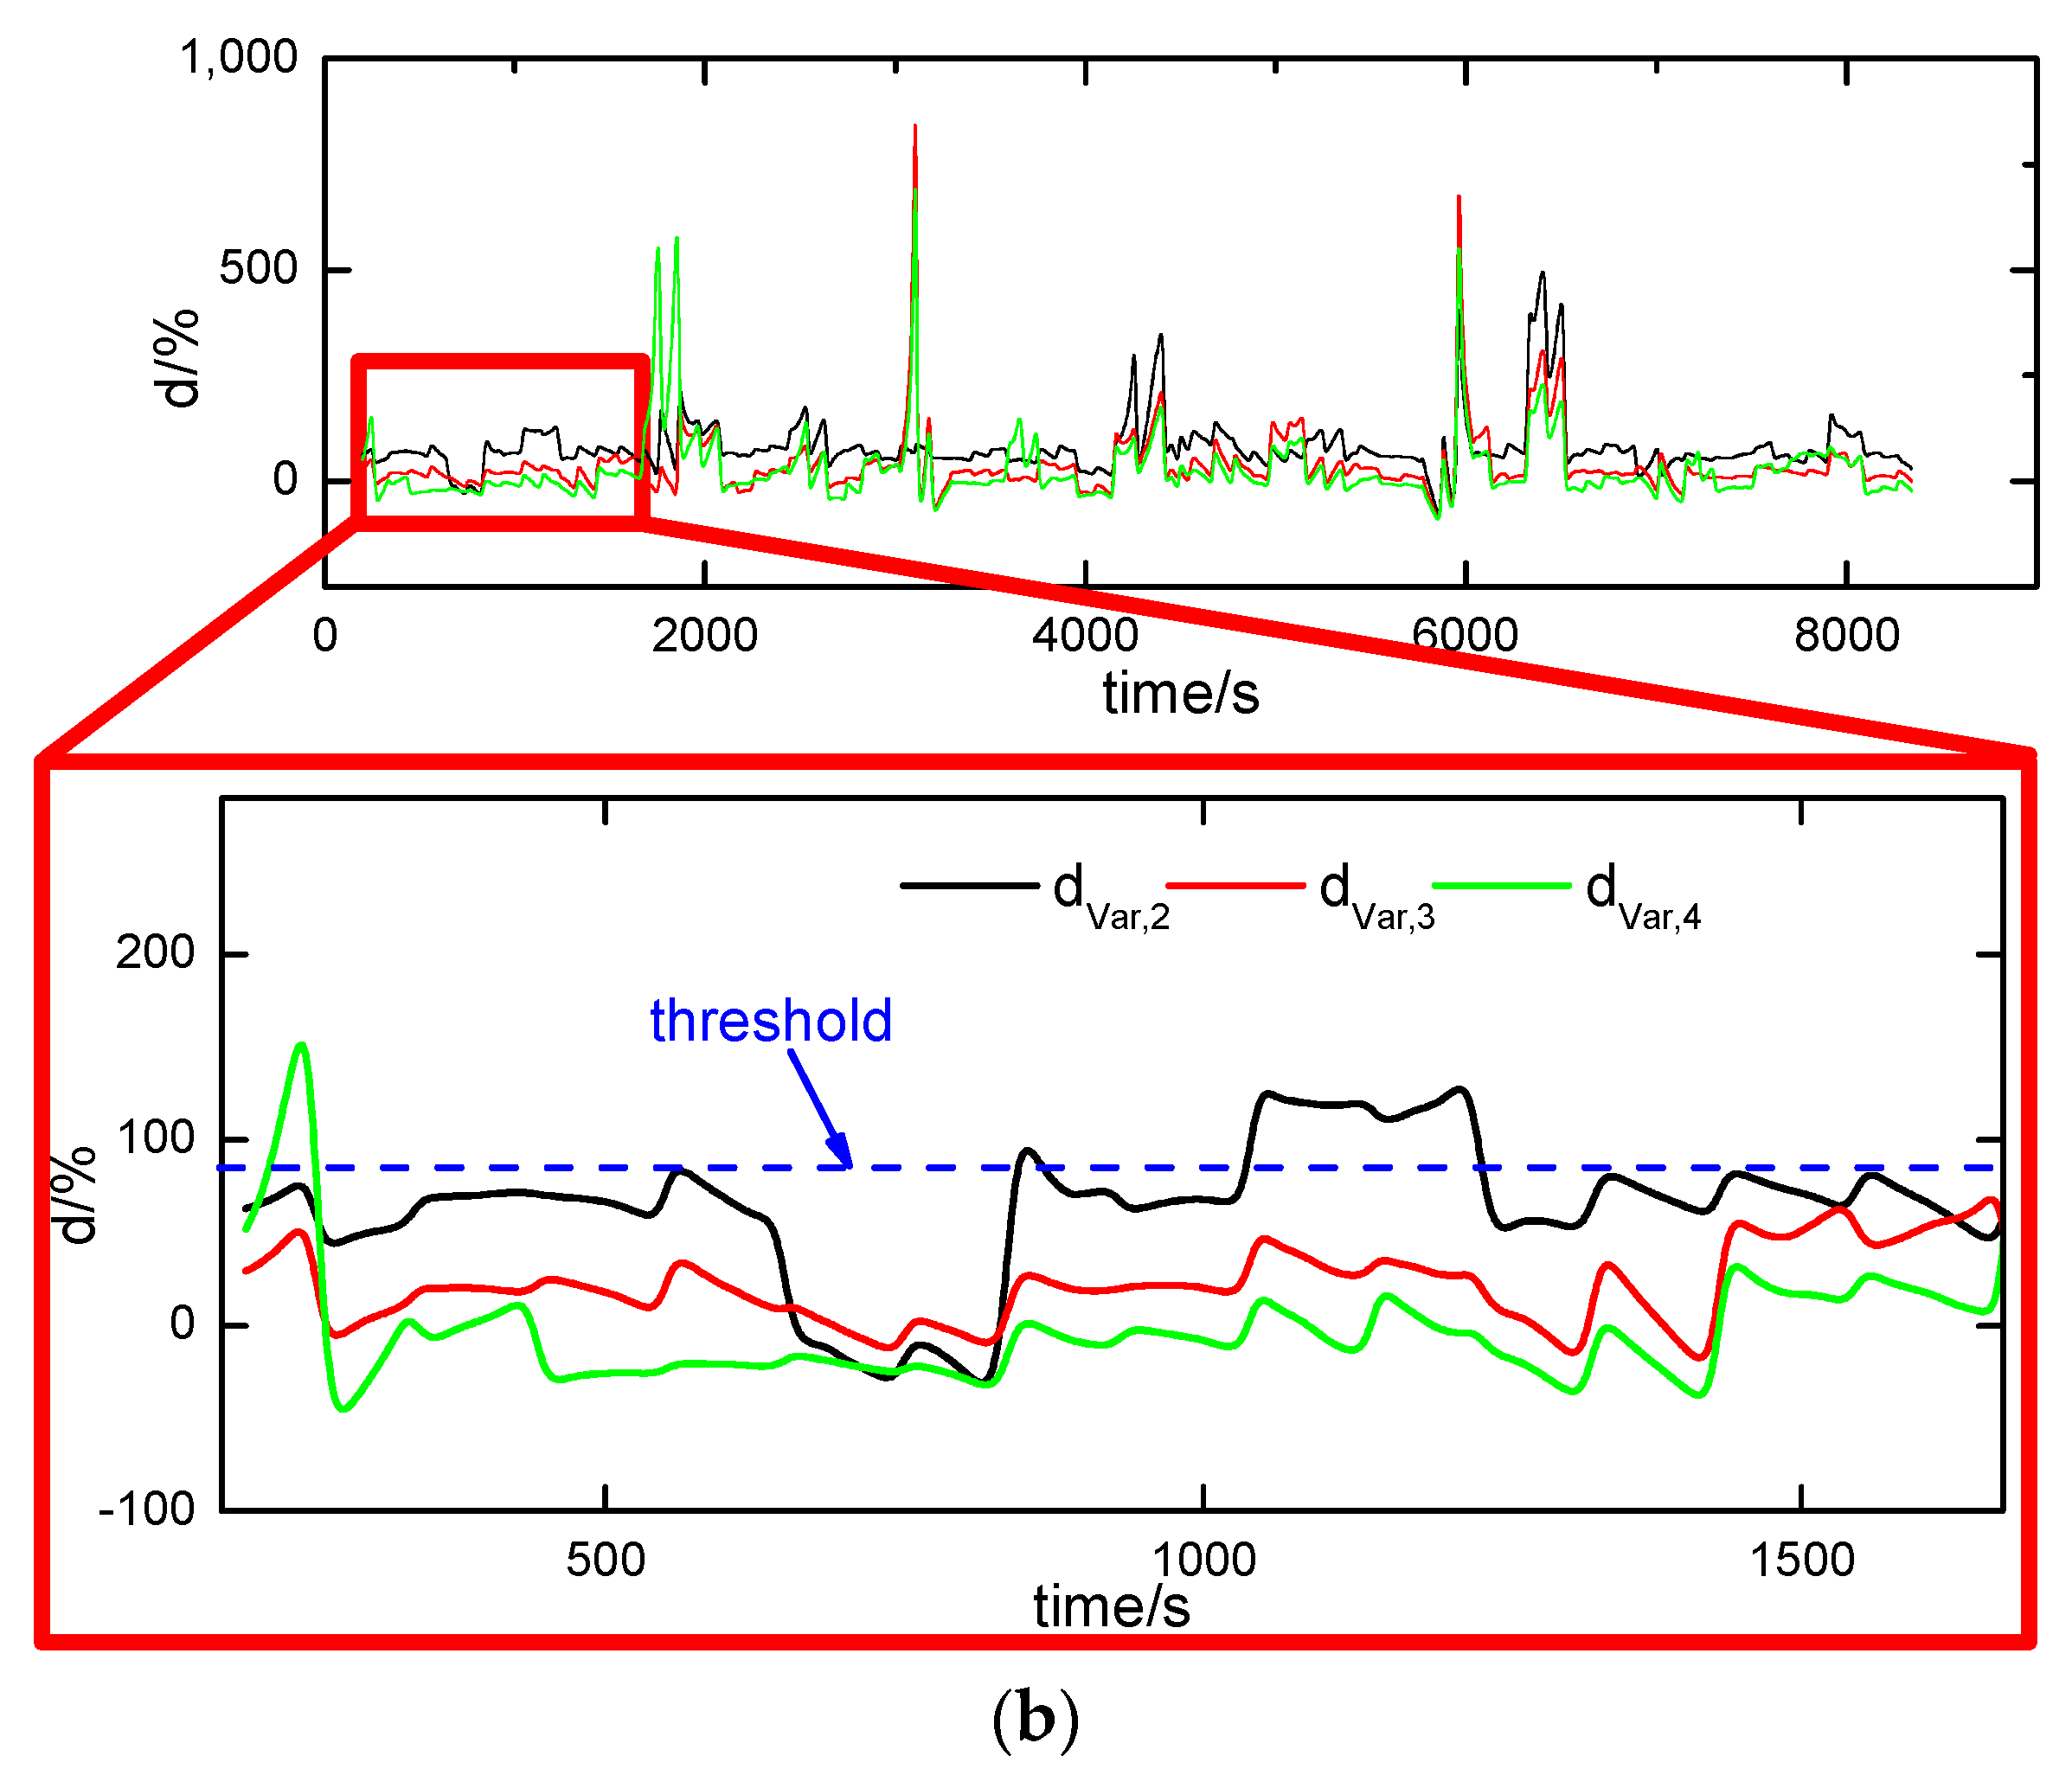
Distinguish the two common fault causes. If capacity fade fault occurs in PCBG, calculate the variance of PCBG resistances of PCBGs for every 100 sampling time. Subsequently, d V a r , n ( N ) is calculated, which is the deviation of PCBG resistance variance of the n-th PCBG at the N-th sampling time according to Equation (31). V a r n ( N ) is the variance of the n-th PCBG resistance at N-th sampling time. V a r r e f ( N ) is the selected reference value of the PCBG resistance variance at the N-th sampling time, which could be any one of the PCBG resistances of the healthy PCBGs. If the deviations of variance are relatively close to each other, this indicates that the capacity fade fault of PCBG is caused by cell aging inconsistency. Conversely, a significantly larger deviation of variance indicates that the capacity fade fault of PCBG is caused by cell loose contacting.
d V a r , n ( N ) = V a r n ( N ) V a r r e f ( N ) V a r r e f ( N ) × 100 %

3. Simulation and Experimental Design

3.1. Simulation Design

Due to the complexity of the internal reaction of the battery, a long-term battery experiment consumes a large amount of manpower and time, and the battery fault is not repeatable. Therefore, experimental study for battery fault diagnosis is very difficult. The battery fault simulation model based on Simscape can analyze the pre-set fault of the cell and the battery pack and can obtain real-time information, such as state of charge (SOC), terminal voltage and current, to validate the fault diagnosis method. The simulation model not only saves a great deal of experimental time, but also overcomes the issue that some parameters of the cell cannot be easily measured in experiment. It also provides a method to analyze the fault mechanism and fault characteristics from the view of electrical characteristics.

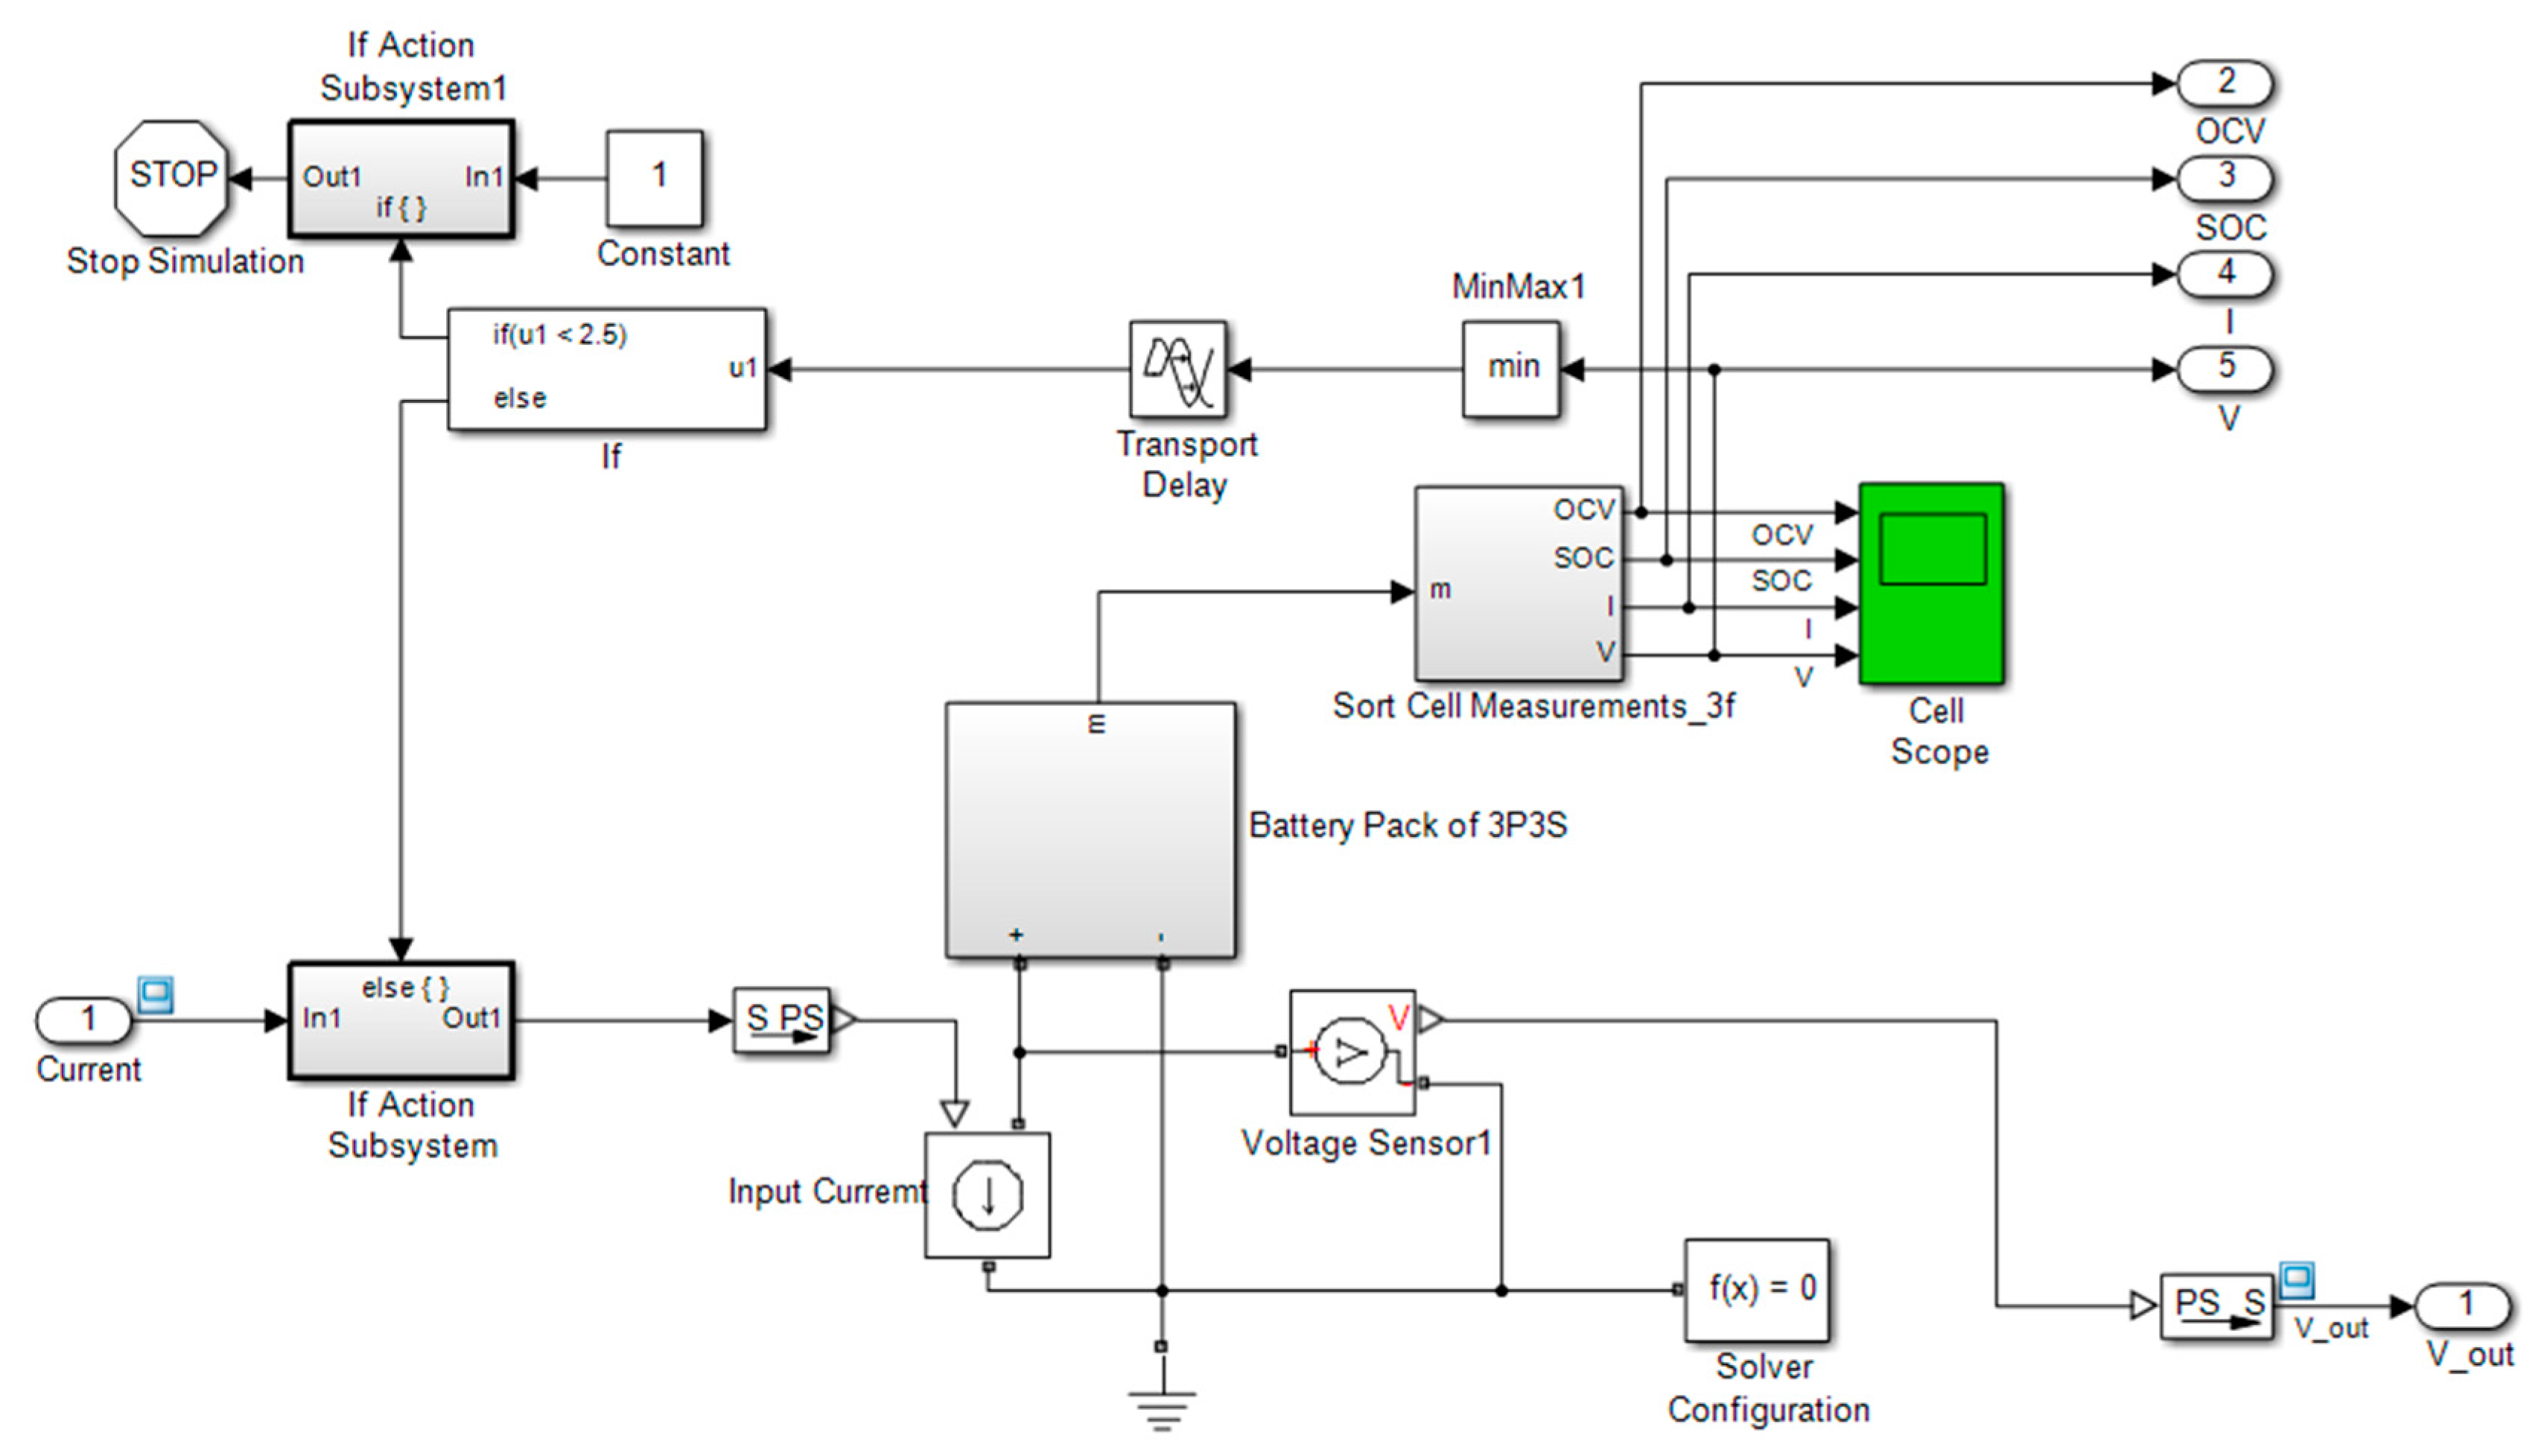
3.1.1. Single Cell Simulation Model

The simulation model is established by the Simscape module and language [23,24,25]. Each circuit element is a subsystem composed of a customized electrical module; the module is used to calculate the circuit parameters. Because the cells in the same battery pack are always at the same ambient temperatures, it can be assumed that the temperature’s influence on the cell resistance in the same battery pack are the same and do not need to be considered separately. Thus, parameters only depend on SOC and are independent of temperature. Parameters are obtained through lookup tables, taking SOC as the input. In the OCV module, the cell SOC is calculated with current integration method, and the SOC is taken as the input for other modules. The single cell simulation model can display and store all simulation parameters. This facilitates the inspection of parameters during the fault process and fault mechanism analyzing.
The simulation and experiments are conducted using a lithium ion battery made in China, and the battery parameters are shown in Table 1.
The ECM in Figure 5 indicates that we should estimate the OCV, R i , R p and C p at first, which vary with the SOC of the cell. The parameter estimation of the model is implemented with a lookup table. The lookup table of parameters comprises only one input (SOC), which corresponds to the parameter curve obtained with the HPPC test. To improve the simulation precision of the model, the SOC interval in the HPPC test is set to 5%. Figure 6 shows the parameters of a cell obtained by HPPC test.

3.1.2. Fault Simulation

The integral simulation system of a battery pack is shown in Figure 7. The battery pack in this system includes three PCBGs connected in series.
Due to the vibration of the electric vehicle in operation, the cell contact resistance increases randomly [15]. In Figure 5, the cell resistance includes the contact resistance, so the cell loose contacting also leads to the random increase of cell resistance. Because the random variation of the cell resistance increase for cell loose contacting fault cannot be known, cell loose contacting fault is replaced by cell resistance increase fault in the simulation. Cell aging inconsistency fault and cell resistance increase fault are simulated to validate the online module parameter identification method and the method for identifying the PCBG with capacity fade fault.
(1)
Simulation of PCBG capacity fade fault caused by cell resistance increase fault
The specific percentage values of the normal cell resistance are taken to simulate the cell resistance increase fault. In order to obtain the varying range of cell resistance for cell loose contacting fault, cell loose contacting fault was simulated in experiment. As is shown in Figure 8, in the cell loose contacting experiment, the nut for the ring conductor terminal of the Cell 4 in PCBG 2 is not tightened. During the experiment, the ring conductor terminal was shaken slightly by hand to simulate the cell loose contacting fault of a working electric vehicle. The cell resistance with loose contacting fault was measured by a HIOKI 3563 internal resistance tester. The result showed that the maximum of the cell resistance increase, which was caused by loose contacting, was 168 mΩ. The cell resistance is 14 mΩ, so maximum cell resistance is 12 times the normal cell resistance. In simulation, the cell resistance of the faulty cell was set to 150%, 500% and 1000% of the normal cell resistance.
(2)
Simulation of PCBG capacity fade fault caused by cell aging inconsistency fault
To obtain the ECM parameters of an aged cell at different aging state, a new cell was cycled with charging and discharging to simulate the aging process of a cell. Capacity test and HPPC test are taken at 200, 400 and 800 cycles, and the corresponding aging states are 10%, 22% and 51%, respectively. In the simulation, the parameters of the aged cell are obtained from the corresponding HPPC test. The simulation for the two kinds of reasons that caused capacity fade fault for PCBG both are simulated with FUDS.

3.2. Expriment Design

All experiments were performed with a channel of Arbin instruments’ BT2000 test bench (60 V, ±50 A), which has a voltage measurement accuracy of ±0.01% and a current measurement accuracy of ±0.02%. The Arbin instrument also comprises eight auxiliary voltage measurement channels. The experiment process is described below.
(1)
Selecting batteries with good consistency. For 24 cells of the same batch, the capacity test at a rate of 1C was conducted first. Then, eight cells whose capacities were closest to the average capacity were selected.
(2)
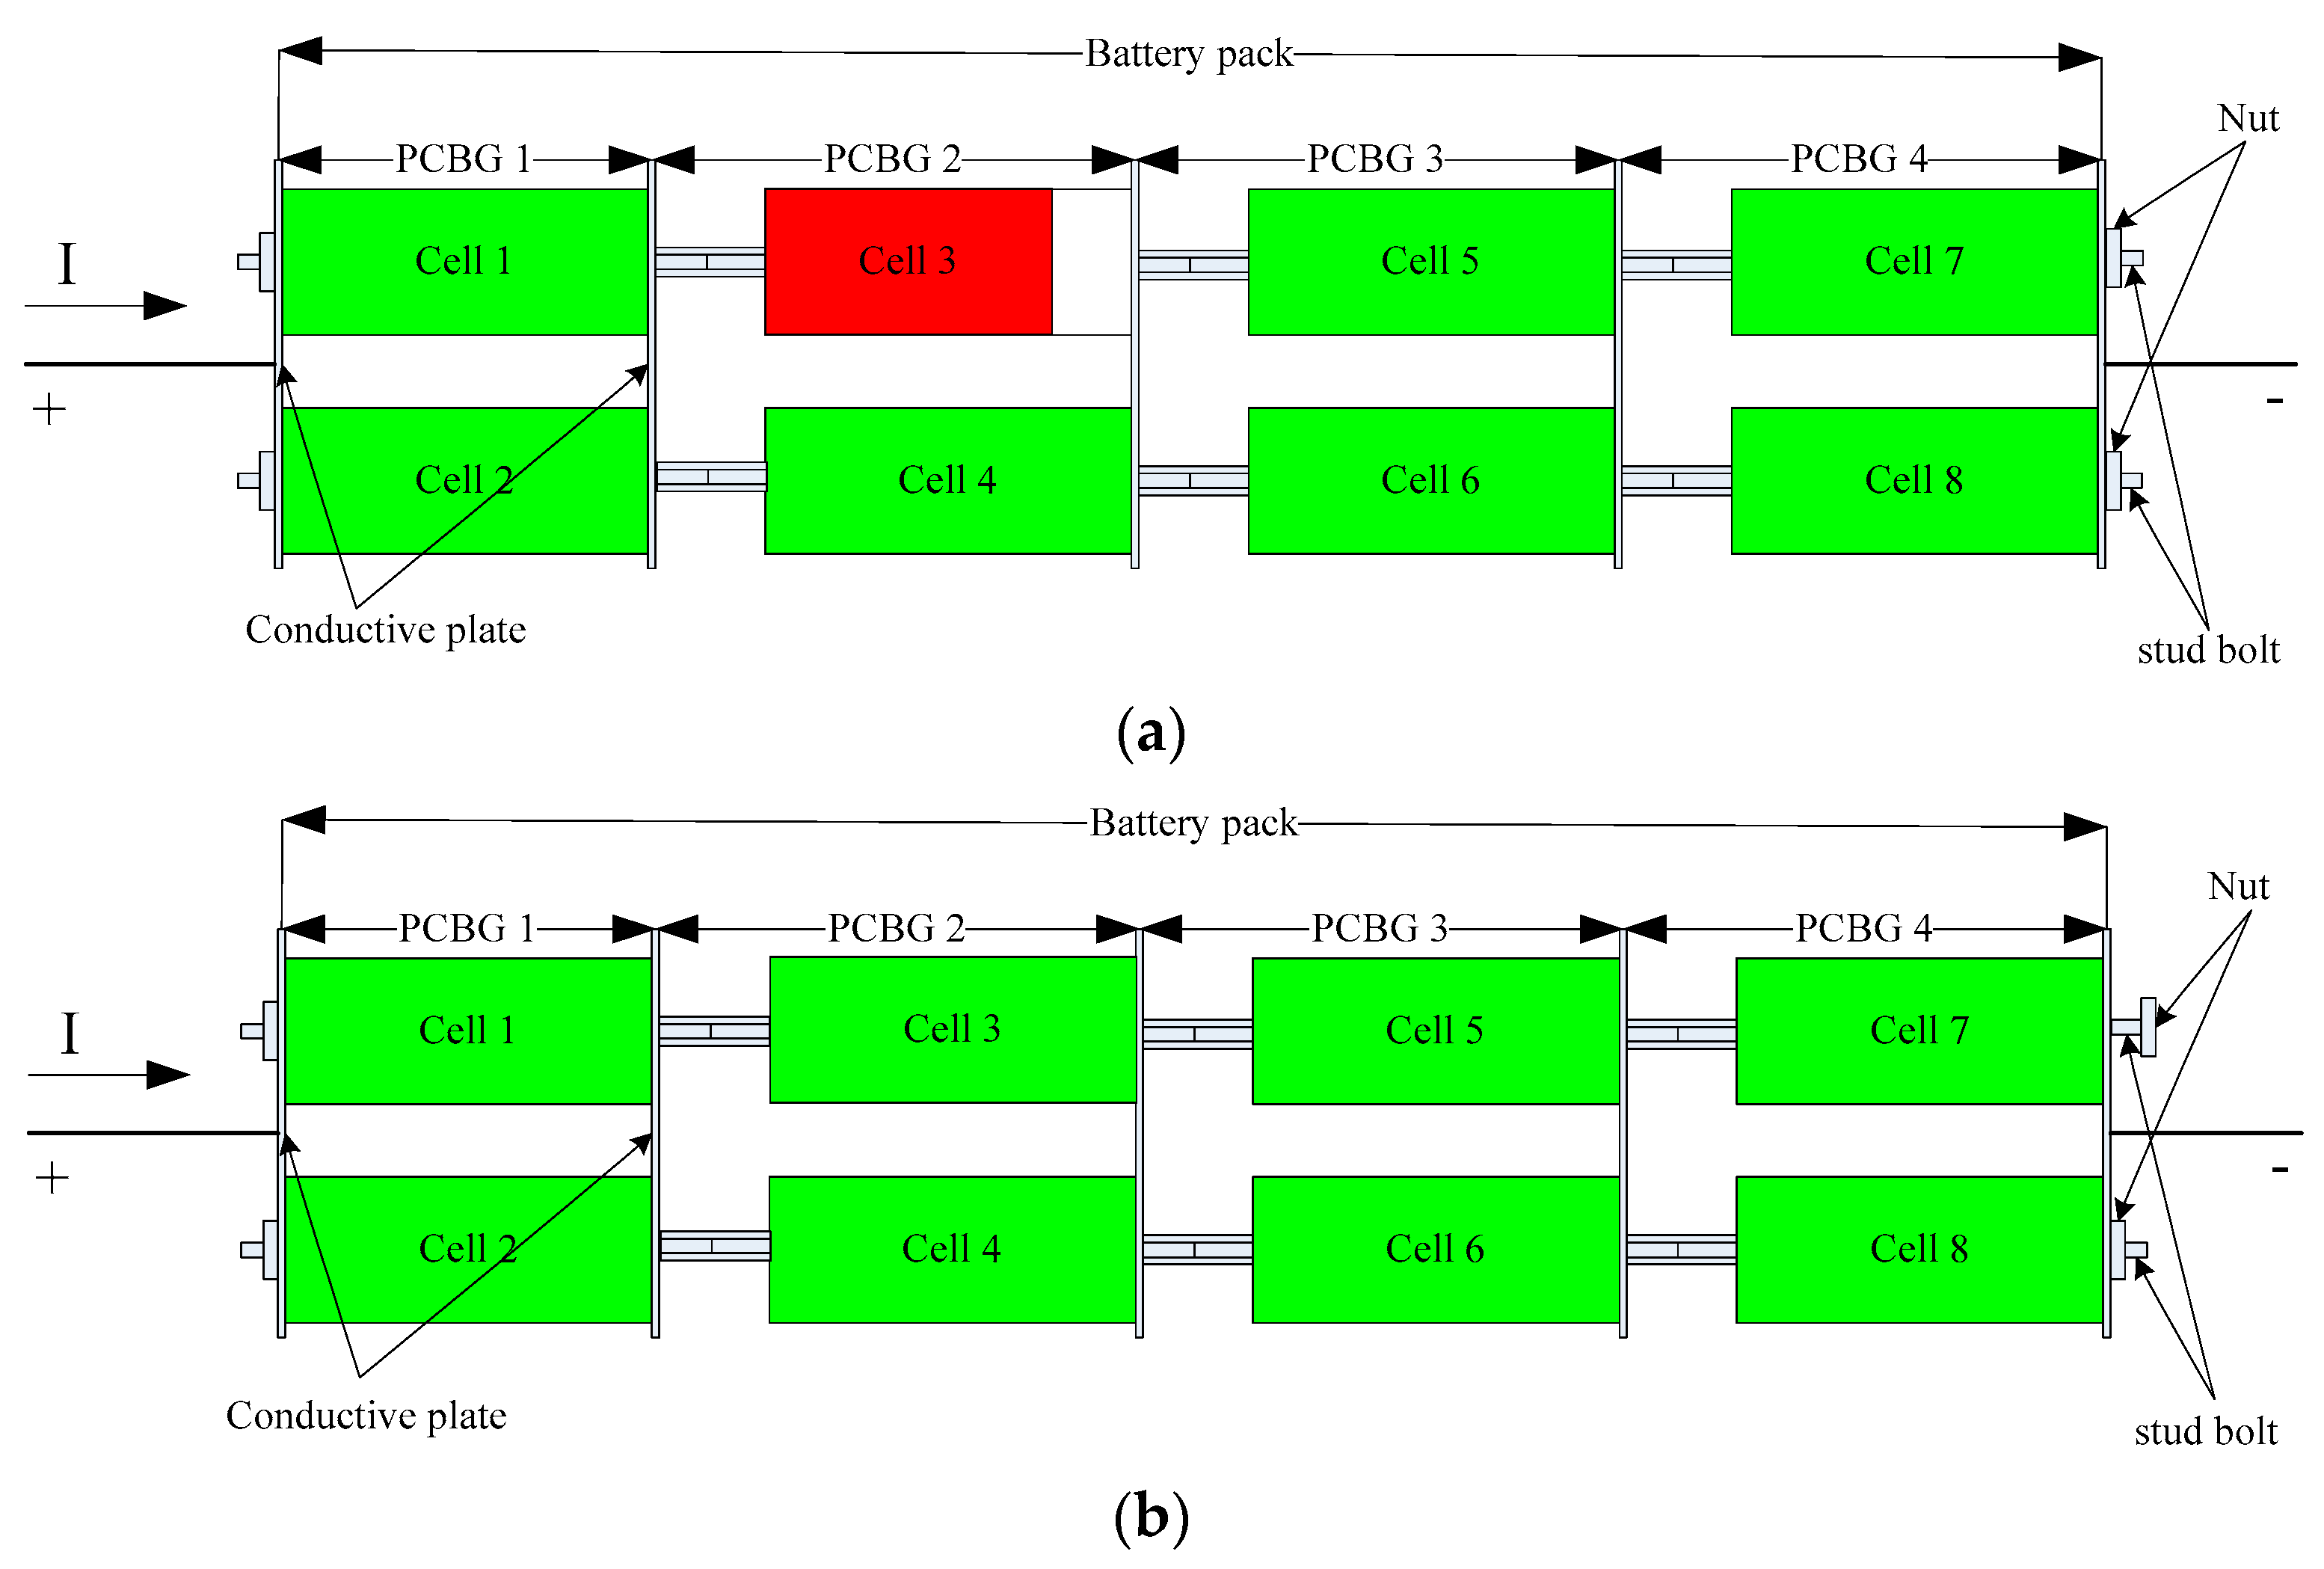
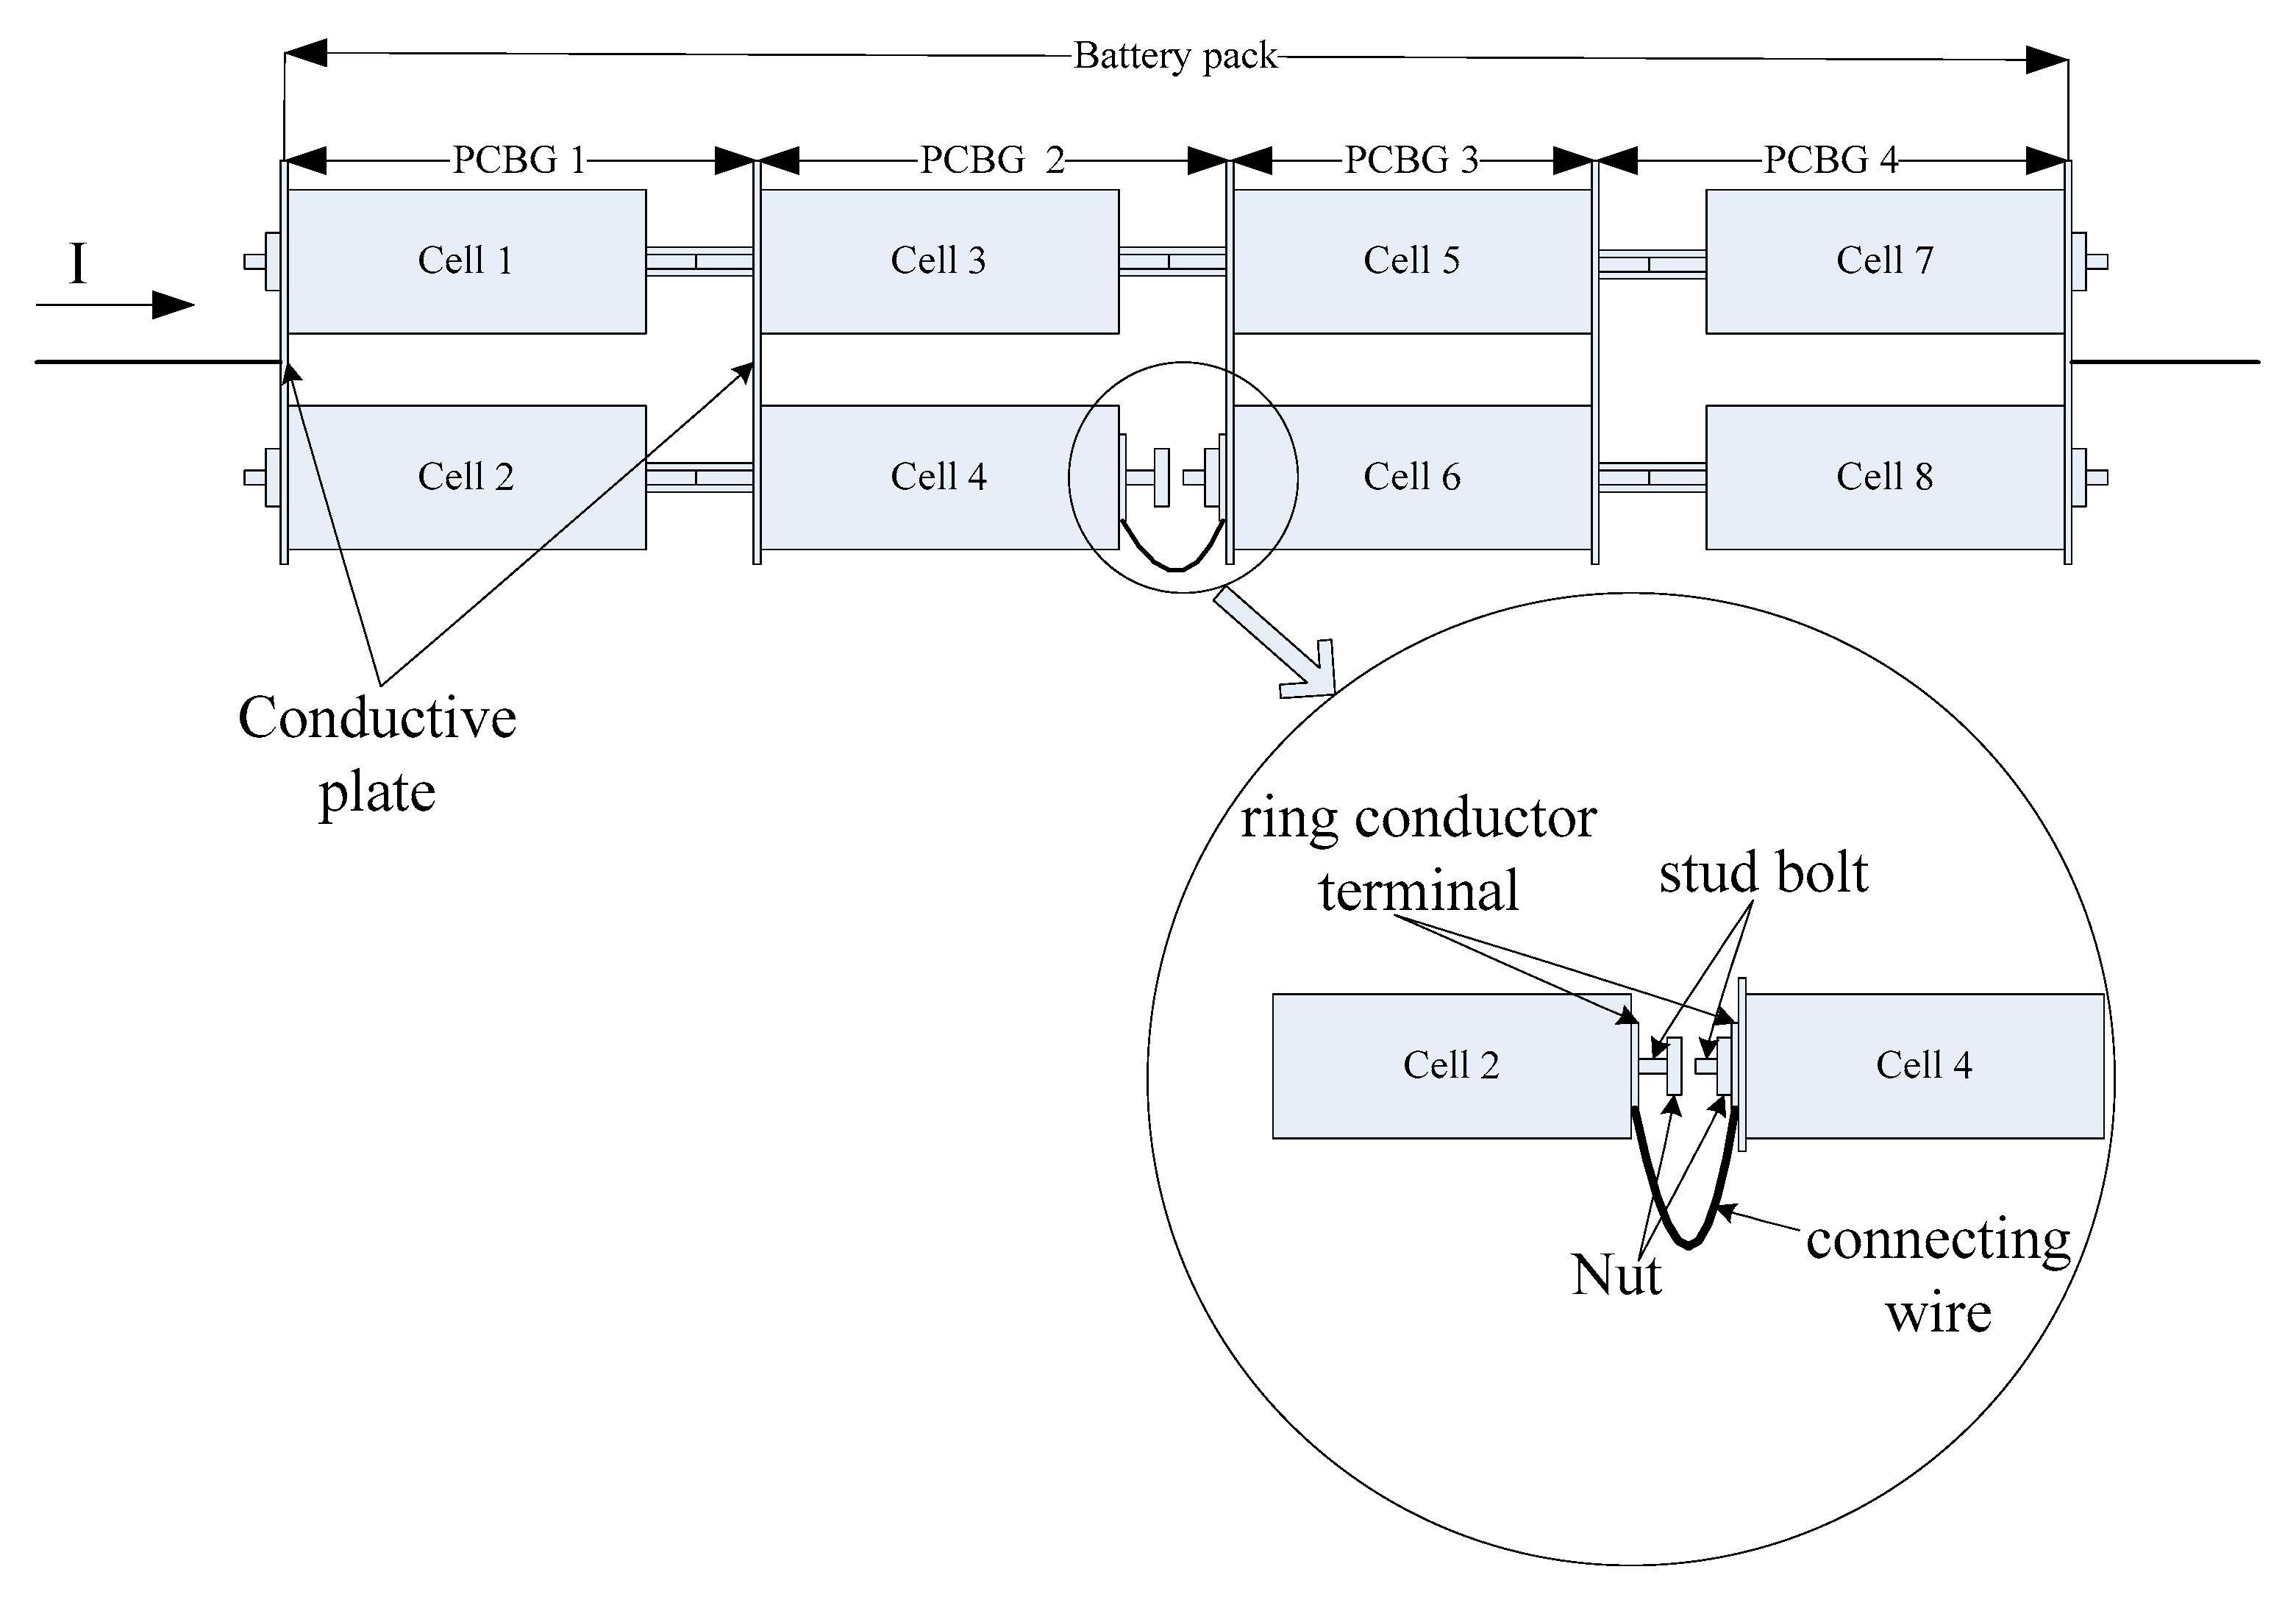
The eight cells comprised a 2P4S battery pack. The 2P4S battery pack is shown in Figure 8.
(3)
Experiment on PCBG capacity fade fault caused by cell loose contacting fault. The operation condition is FUDS. The cell with cell loose contacting fault is Cell 4 in the PCBG 2, as shown in Figure 8.
(4)
Experiment on PCBG capacity fade fault caused by cell aging inconsistency fault. The cell with cell aging inconsistency fault is Cell 3 in the PCBG 2, as shown in Figure 1a. The aging state of the aged cell is 22%.

4. Results and Discussion

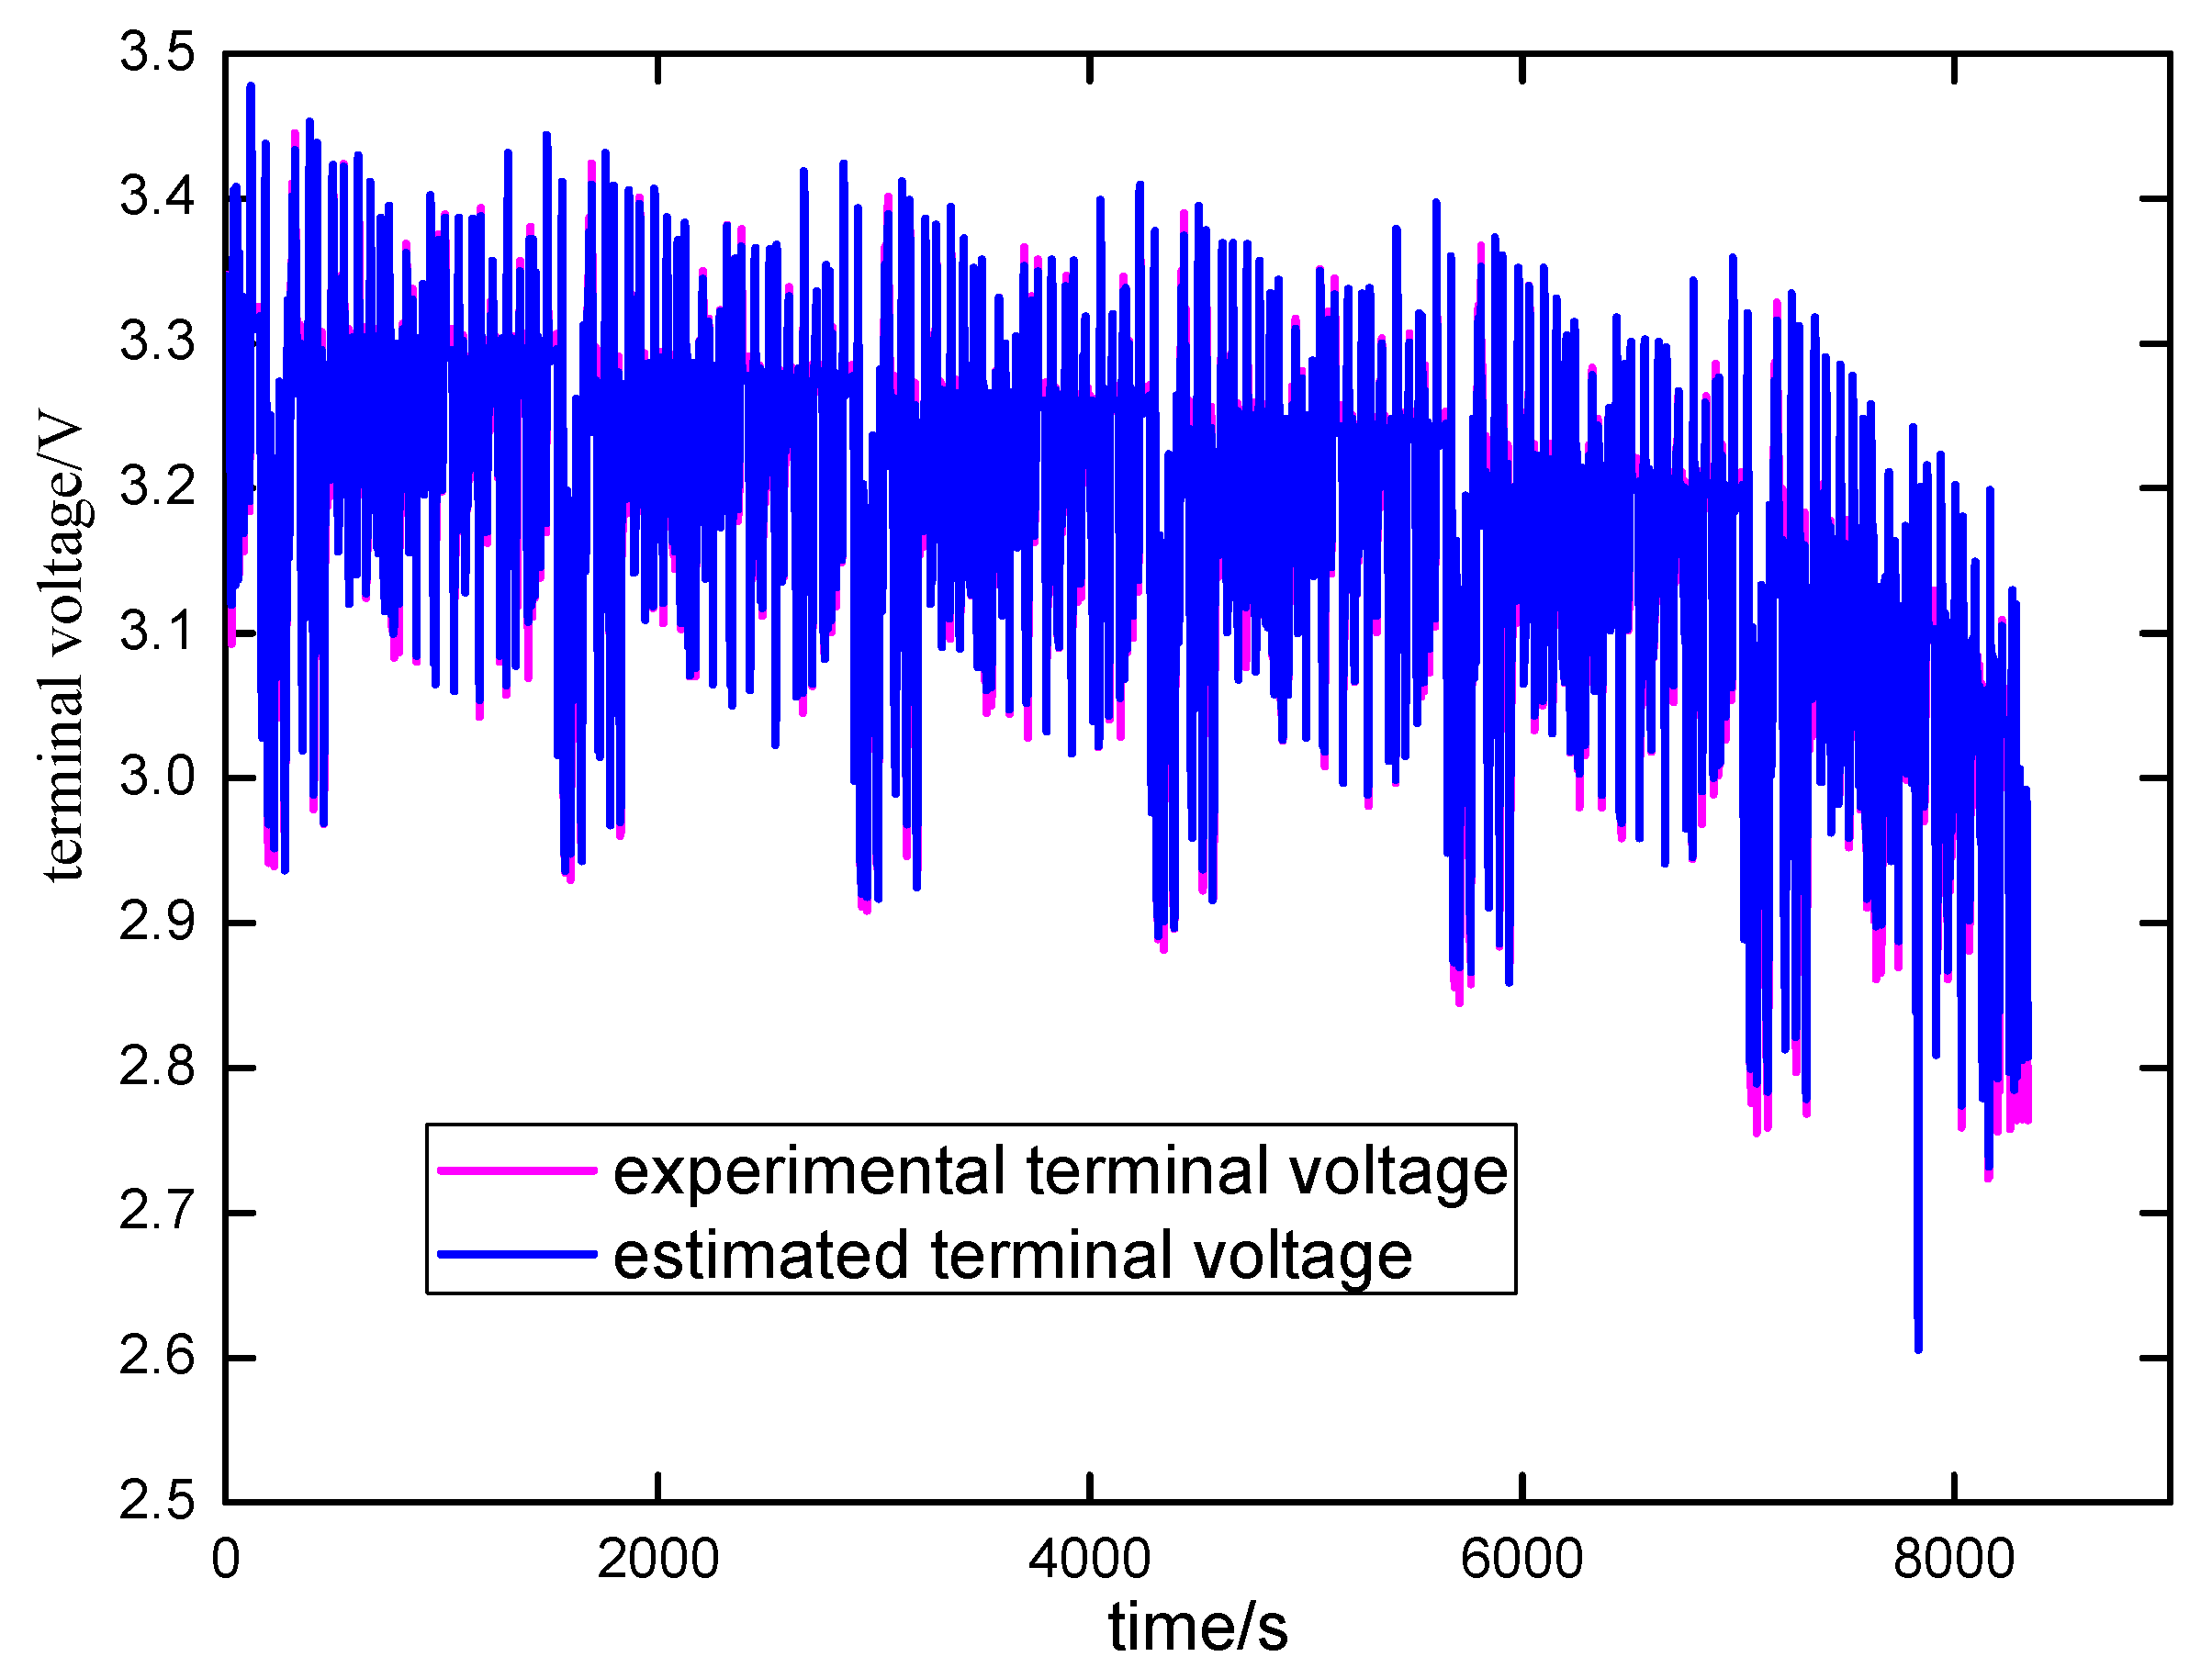
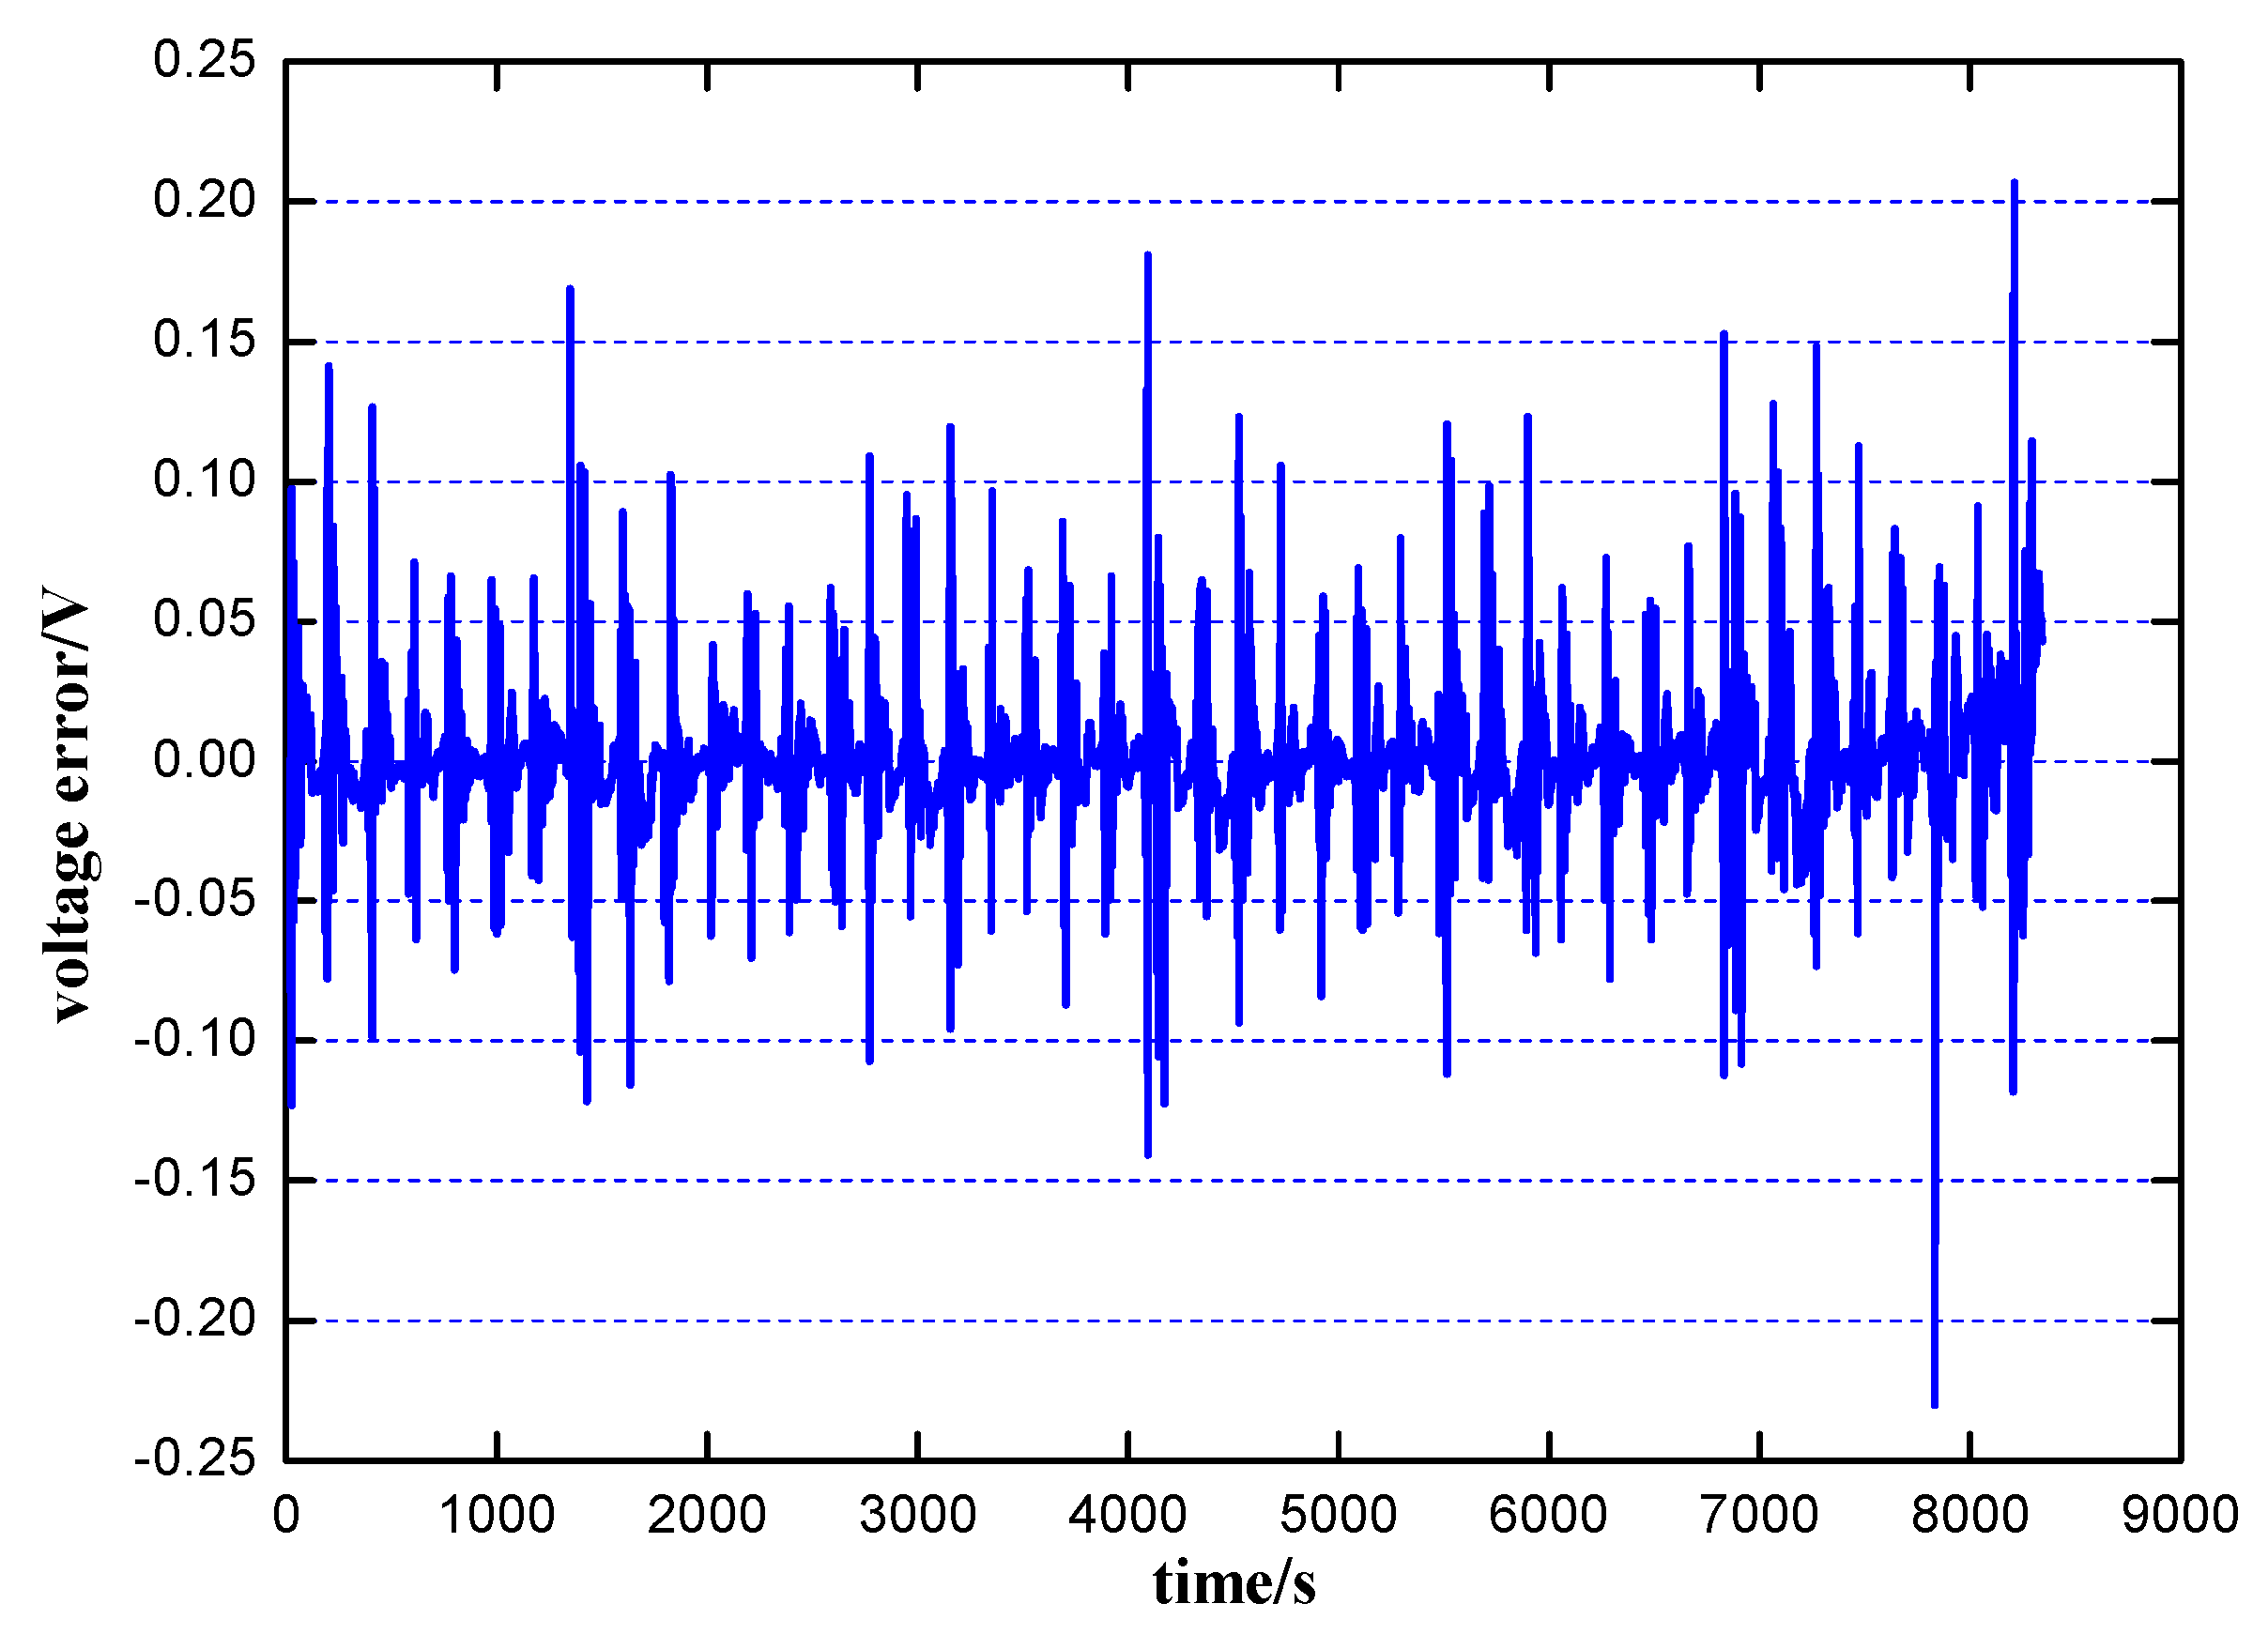
4.1. Validation of the RLSRMC-Based Identification Algorithm

The accuracy of the online parameter identification algorithm is verified through the error between the estimated terminal voltage and the experimental terminal voltage. As shown in Figure 5, the estimated terminal voltage is calculated with Equations (32) and (33) [26]. I p is the current of R p , τ = R p C p .
U ^ = O C V I × R i I p × R p
I p ( k T s ) = [ 1 ( 1 e d T s / τ ) d T s / τ ] × I ( k T s ) + [ ( 1 e d T s / τ ) d T s / τ e d T s / τ ] × I ( ( k 1 ) T s ) + e d T s / τ × I p ( ( k 1 ) T s )
The estimated terminal voltage and the experimental terminal voltage of the PCBG with two cells are plotted in Figure 9. The error between the estimated terminal voltage and experimental terminal voltage of the single battery for the first FUDS section is less than ±0.01 V. As shown in Figure 10, the terminal voltage error of the PCBG with two cells for the whole discharge period with FUDS is almost less than ±0.1 V.

4.2. Validation of Online Fault Diagnostic Algorithm

4.2.1. Simulation Result Analysis

As shown in Figure 7, cell resistance increase fault and cell aging inconsistency fault are both simulated with FUDS. On the basis of the simulation data, the parameters of the PCBGs are identified by RLSRMC algorithm. The identified PCBG resistances of the PCBGs are shown in Figure 11 and Figure 12. In Figure 11, the curves 1#, 2# and 3# denote the PCBGs with the cell resistance increased to 1000%, 500% and 150% of the normal cell resistance respectively. In Figure 12, curves 1#, 2# and 3# denote the PCBGs including cells with aging state of 51%, 22% and 10% respectively. The PCBG resistance of the healthy PCBG does not change, which is shown as curve 4# in Figure 11 and Figure 12. Figure 11 and Figure 12 show that the cell resistance increase fault and the cell aging inconsistency fault both cause the PCBG resistance to increase.

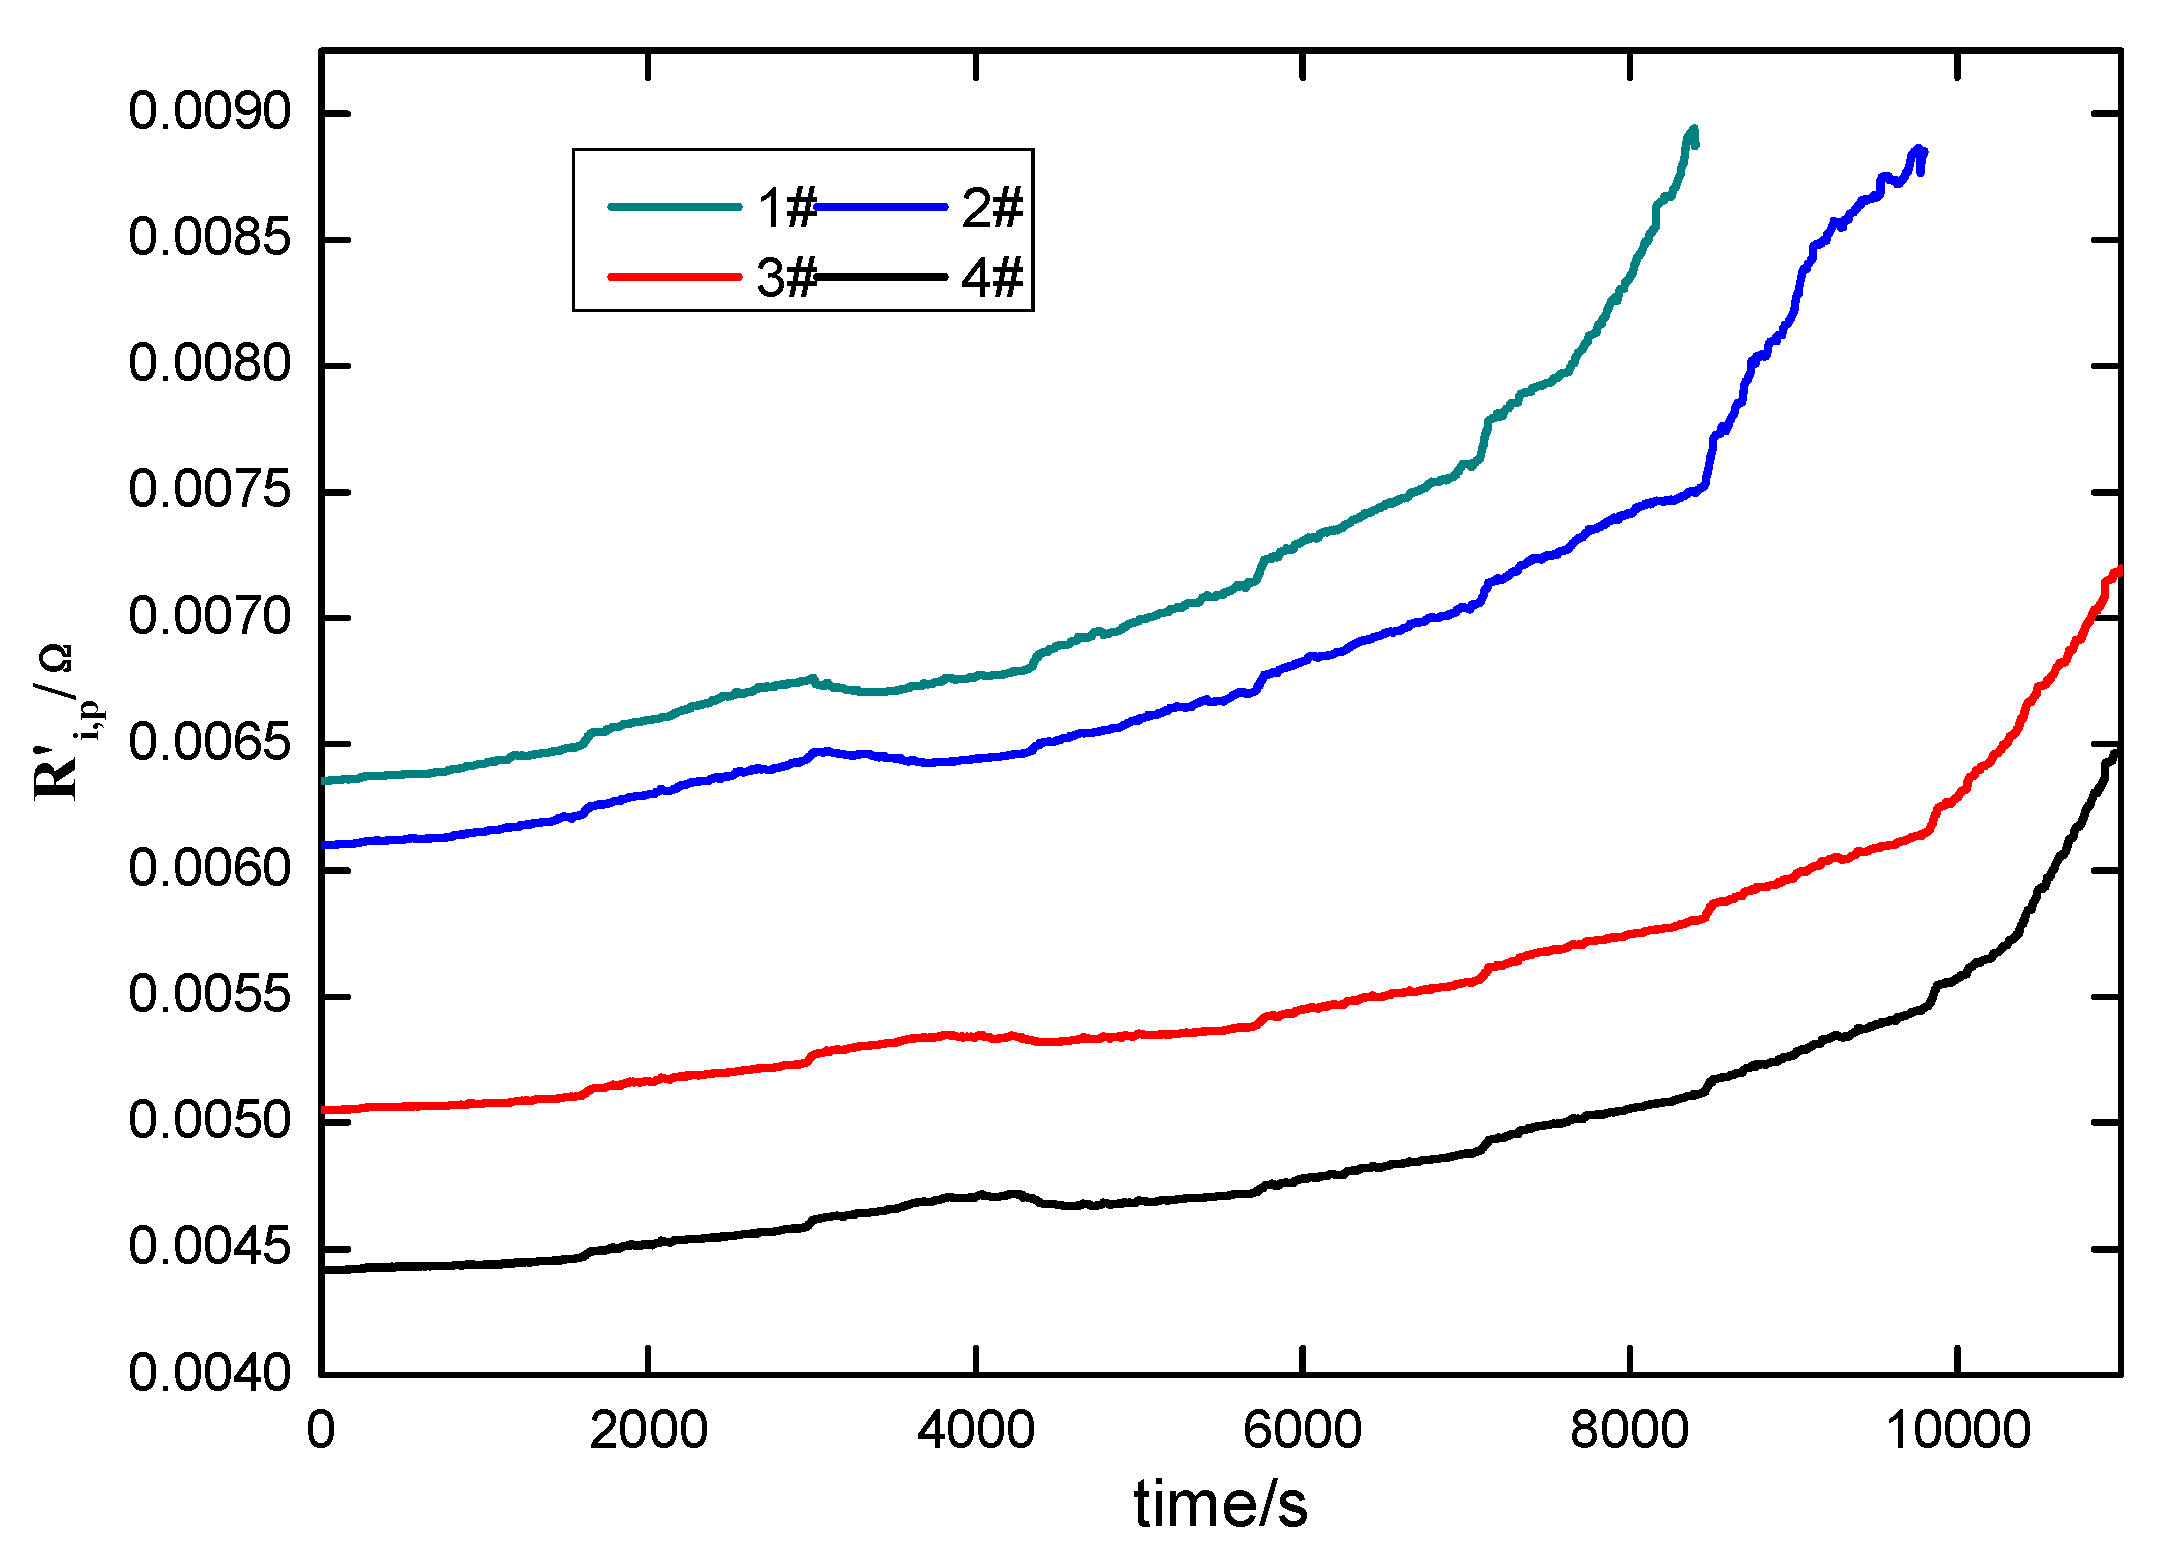
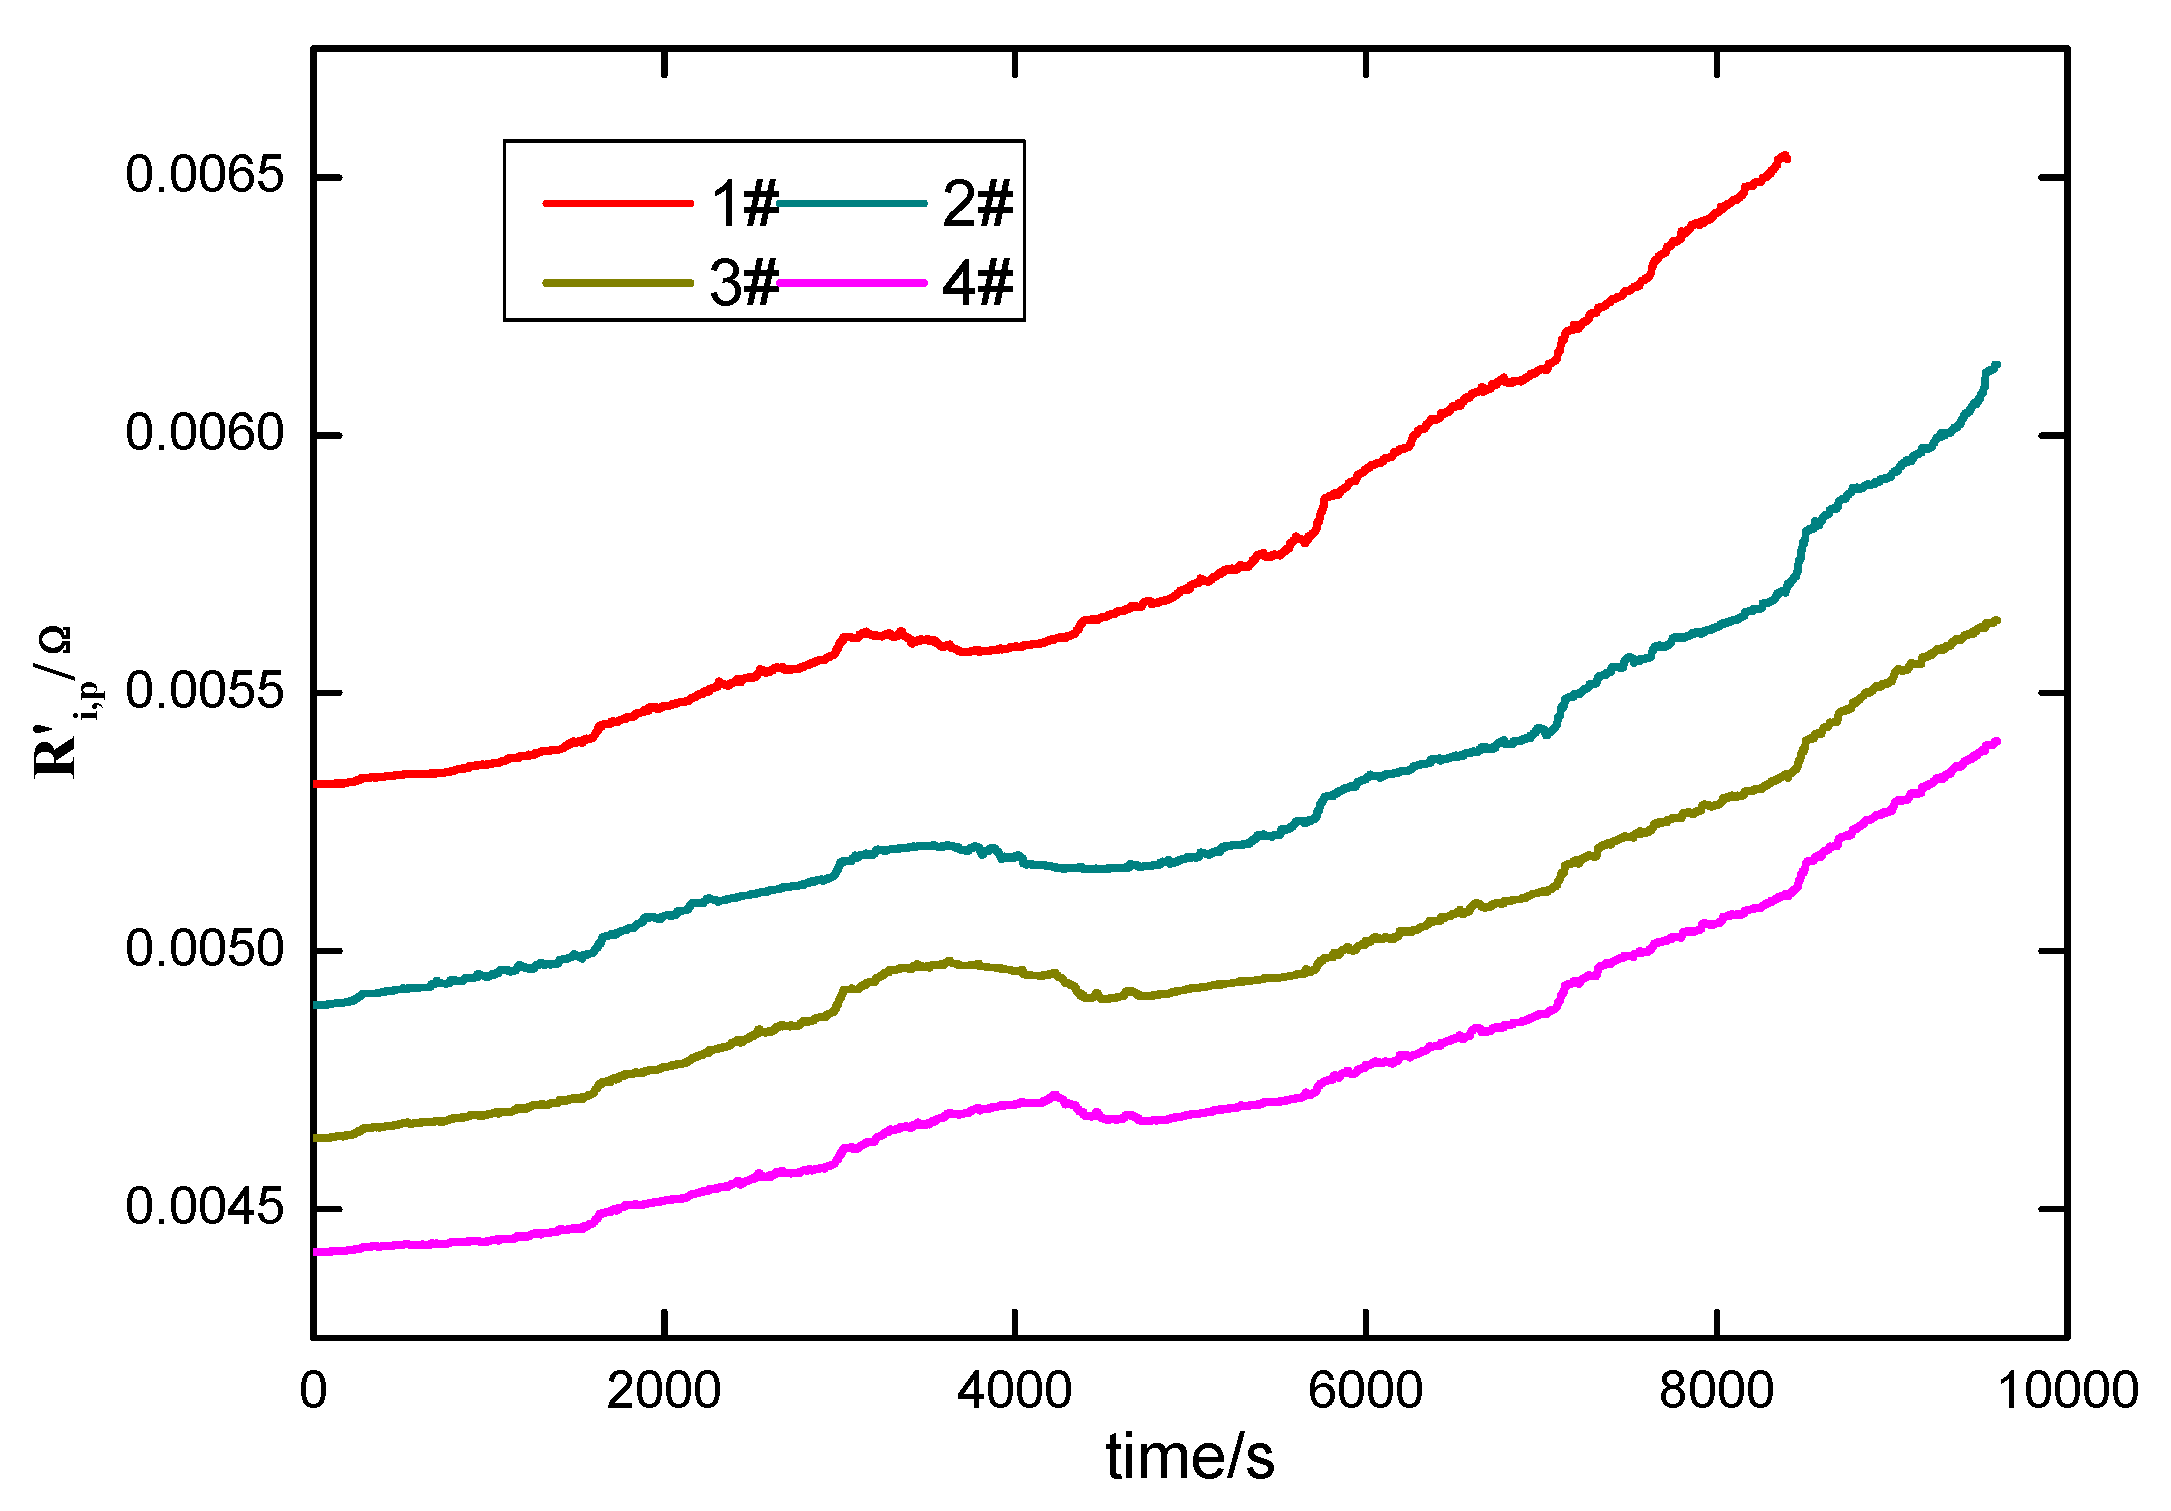
4.2.2. Experimental Result Analysis

The experimental data of the capacity fade fault of the PCBGs are processed according to the method mentioned in Section 2.3. Figure 13a,b are PCBG resistance deviation curves with cell loose contacting fault and cell aging inconsistency fault respectively, and the deviation is calculated according to Equation (30). In the battery pack, there are cell resistance deviations among healthy cells and this causes PCBG resistance deviations among healthy PCBGs. For healthy PCBGs with two cells, the acceptable deviation of PCBG resistance generally is in the range of 10%–20%. In this work, 15% is taken as the threshold of PCBG resistance deviation. According to experiments, in order to avoid interference and misjudgment, if d n is larger than the threshold for more than 200 s, it indicates that the n-th PCBG is the PCBG with capacity fade fault. Based on this principle, the second PCBGs of Figure 13a,b are the PCBGs with capacity fade fault.
Figure 14a,b shows the deviation of PCBG resistance variance for the cell loose contacting fault and cell aging inconsistency fault, and the deviation is calculated according to Equation (31). In Figure 14a, d var , 2 was significantly larger than d var , 3 and d var , 4 . In Figure 14b, the variances of the three PCBGs are close. In the battery pack, the variation rates of cell resistances for healthy cells are different and this causes the deviation of PCBG resistance variance among healthy PCBGs. For healthy PCBGs with two cells, the acceptable deviation of variance generally is in the range of 50%–100%. In this work, 85% is taken as the threshold of variance deviation. According to the experiments, in order to avoid interfere and misjudgment, if a deviation of the variance is larger than the threshold for more than 200 s, it indicates that the reason for capacity fade fault of the PCBG is loose contacting. On the contrary, the fault is caused by cell aging inconsistency. Based on this principle, in Figure 14a, the fault cause of second PCBG is a cell loose contacting fault. In Figure 14b, the fault cause for the second PCBG is a cell aging inconsistency fault. The diagnosis method identified the PCBG with capacity fade fault and the fault cause. The diagnosis results agree well with experimental results.

5. Conclusions

In this paper, an online capacity fault diagnosis method for PCBG is presented, producing four main contributions:
(1)
Online diagnosis could identify PCBGs with a capacity fade fault and identify the two common fault causes.
(2)
The PCBG resistance is taken as the indicator of capacity fade fault. The faulty PCBG can be identified by comparing the PCBG resistance values among PCBGs, and two fault causes can be distinguished by comparison of the deviation of the PCBG resistances variance.
(3)
The PCBG resistance is identified online based on the RLSRMC algorithm. By adding a constraint, RLSRMC algorithm eliminates the “imaginary number” phenomena of Cp.
(4)
The criterion is determined by experiments. The PCBG with a capacity fade fault was identified by taking 15% as the threshold of the PCBG resistance deviation, and the two fault causes were distinguished by taking 85% as the threshold of the deviation of PCBG resistance variance.

Acknowledgments

This research was supported in part by Science and Technology Project of State Grid Corporation of China (Heilongjiang Electric Power Science Research Institute). The author would also like to thank Bingliang Xu (State Grid Heilongjiang Electric Power Company Limited) for helpful suggestions.

Author Contributions

Hua Zhang developed the new method and completed the main parts of the manuscript. Lei Pei was involved in battery modelling. Rengui Lu and Yongping Zhao designed the other experimental parts. Chunbo Zhu, Tiansi Wang and Jinlei Sun gave some suggestions for the preparation of the manuscript. Kai Song checked the results and the whole manuscript.

Conflicts of Interest

The authors declare no conflict of interest.

Abbreviations

The following abbreviations are used in this manuscript:
EVselectric vehicles
EISelectrochemical impedance spectroscopy
PCBGparallel-connected battery group
RLSRMCrecursive least squares algorithm with restricted memory and constraint
OCVopen circuit voltage
ECMequivalent circuit model
DODdepth of discharge
BMSBattery Management System
RLSRMrecursive least squares algorithm with restricted memory
SOCstate of charge
FUDSFederal Urban Driving Schedule
HPPChybrid pulse power characterization
R i cell resistance
R i ohmic resistance of a battery
R c contact resistance of a battery
R p the polarization resistance
C p the polarization capacitance
I p the current of R p
Tsthe sampling time
f the faulty battery
h the healthy battery
p the parallel-connected battery group
n the n-th parallel-connected battery group
N the N-th sampling time
r e f the reference value
V a r variance

References

  1. Xiong, B.; Zhao, J.; Wei, Z.; Skyllas-Kazacos, M. Extended Kalman filter method for state of charge estimation of vanadium redox flow battery using thermal-dependent electrical model. J. Power Sources 2014, 262, 50–61. [Google Scholar] [CrossRef]
  2. Badrinarayanan, R.; Zhao, J.; Tseng, K.J.; Skyllas-Kazacos, M. Extended dynamic model for ion diffusion in all-vanadium redox flow battery including the effects of temperature and bulk electrolyte transfer. J. Power Sources 2014, 270, 576–586. [Google Scholar] [CrossRef]
  3. Zhang, Y.; Zhao, J.; Wang, P.; Skyllas-Kazacos, M.; Xiong, B.; Badrinarayanan, R. A comprehensive equivalent circuit model of all-vanadium redox flow battery for power system analysis. J. Power Sources 2015, 290, 14–24. [Google Scholar] [CrossRef]
  4. Sun, J.; Wei, G.; Pei, L.; Lu, R.; Song, K.; Wu, C.; Zhu, C. Online Internal Temperature Estimation for Lithium-Ion Batteries Based on Kalman Filter. Energies 2015, 8, 4400–4415. [Google Scholar] [CrossRef]
  5. Lu, L.; Han, X.; Li, J.; Hua, J.; Ouyang, M. A review on the key issues for lithium-ion battery management in electric vehicles. J. Power Sources 2013, 226, 272–288. [Google Scholar] [CrossRef]
  6. Sun, Y.; Jou, H.; Wu, J.; Wu, K. Auxiliary health diagnosis method for lead-acid battery. Appl. Energy 2010, 87, 3691–3698. [Google Scholar] [CrossRef]
  7. Sun, Y.; Jou, H.; Wu, J. Auxiliary diagnosis method for lead-acid battery health based on sample entropy. Energy Conv. Manag. 2009, 50, 2250–2256. [Google Scholar] [CrossRef]
  8. Widodo, A.; Shim, M.; Caesarendra, W.; Yang, B. Intelligent prognostics for battery health monitoring based on sample entropy. Expert Syst. Appl. 2011, 38, 11763–11769. [Google Scholar] [CrossRef]
  9. Remmlinger, J.; Buchholz, M.; Meiler, M.; Bernreuter, P.; Dietmayer, K. State-of-health monitoring of lithium-ion batteries in electric vehicles by on-board internal resistance estimation. J. Power Sources 2011, 196, 5357–5363. [Google Scholar] [CrossRef]
  10. Sun, Y.H.; Jou, H.L.; Wu, J.C. Novel auxiliary diagnosis method for state-of-health of lead-acid battery. In Proceedings of the 7th International Conference on Power Electronics and Drive Systems (PEDS 2007), Bangkok, Thailand, 27–30 November 2007; pp. 493–497.
  11. Sun, Y.H.; Jou, H.L.; Wu, J.C. Diagnosis Method for the Degradation of Lead-Acid Battery. In Proceedings of the IEEE International Symposium on Industrial Electronics (ISIE 2009), Seoul, Korea, 5–8 July 2009; pp. 1380–1385.
  12. Bohlen, O.; Buller, S.; De Doncker, R.W.; Gelbke, M.; Naumann, R. Impedance based battery diagnosis for automotive applications. In Proceedings of the 35th Annual IEEE Power Electronics Specialists Conference (PESC 04), Aachen, Germany, 20–25 June 2004; pp. 2792–2797.
  13. Abraham, D.P.; Liu, J.; Chen, C.H.; Hyung, Y.E.; Stoll, M.; Elsen, N.; MacLaren, S.; Twesten, R.; Haasch, R.; Sammann, E.; et al. Diagnosis of power fade mechanisms in high-power lithium-ion cells. J. Power Sources 2003, 119, 511–516. [Google Scholar] [CrossRef]
  14. Offer, G.J.; Yufit, V.; Howey, D.A.; Wu, B.; Brandon, N.P. Module design and fault diagnosis in electric vehicle batteries. J. Power Sources 2012, 206, 383–392. [Google Scholar] [CrossRef] [Green Version]
  15. Zheng, Y.; Han, X.; Lu, L.; Li, J.; Ouyang, M. Lithium ion battery pack power fade fault identification based on Shannon entropy in electric vehicles. J. Power Sources 2013, 223, 136–146. [Google Scholar] [CrossRef]
  16. Takeno, K.; Ichimura, M.; Takano, K.; Yamaki, J.; Okada, S. Quick testing of batteries in lithium-ion battery packs with impedance-measuring technology. J. Power Sources 2004, 128, 67–75. [Google Scholar] [CrossRef]
  17. Ceraolo, M.; Lutzemberger, G.; Huria, T. Experimentally-determined models for high-power lithium batteries. SAE Tech. Pap. 2011, 1. [Google Scholar] [CrossRef]
  18. Chen, M.; Rincon-Mora, G.A. Accurate electrical battery model capable of predicting runtime and IV performance. IEEE Trans. Energy Convers. 2006, 21, 504–511. [Google Scholar] [CrossRef]
  19. Li, X.; Song, K.; Wei, G.; Lu, R.; Zhu, C. A Novel Grouping Method for Lithium Iron Phosphate Batteries Based on a Fractional Joint Kalman Filter and a New Modified K-Means Clustering Algorithm. Energies 2015, 8, 7703–7728. [Google Scholar] [CrossRef]
  20. Roscher, M.A.; Assfalg, J.; Bohlen, O.S. Detection of Utilizable Capacity Deterioration in Battery Systems. IEEE Trans. Veh. Technol. 2011, 60, 98–103. [Google Scholar] [CrossRef]
  21. Wang, Z. Optimal State Estimation and System Identification; Northwestern Polytechnic University Press: Xi’an, China, 2004. [Google Scholar]
  22. Xiao, D. Theory of System Identification with Applications; Tsinghua University Press: Beijing, China, 2014. [Google Scholar]
  23. Wang, L.; Cheng, Y.; Zhao, X. A LiFePO4 battery pack capacity estimation approach considering in-parallel cell safety in electric vehicles. Appl. Energy 2015, 142, 293–302. [Google Scholar] [CrossRef]
  24. Wang, L.; Cheng, Y.; Zhao, X. Influence of connecting plate resistance upon LiFePO4 battery performance. Appl. Energy 2015, 147, 353–360. [Google Scholar] [CrossRef]
  25. Huria, T.; Ceraolo, M.; Gazzarri, J.; Jackey, R. High fidelity electrical model with thermal dependence for characterization and simulation of high power lithium battery cells. In Proceedings of the 2012 IEEE International Electric Vehicle Conference (IEVC), Greenville, SC, USA, 4–8 March 2012; pp. 1–8.
  26. Hunt, G.; Motloch, C. Freedom CAR Battery Test Manual for Power-Assist Hybrid Electric Vehicles; Idaho National Engineering & Environmental Laboratory: Idaho Falls, ID, USA, 2003. [Google Scholar]
Figure 1. Two fault causes of capacity fade fault for PCBG: (a) cell aging inconsistency fault; (b) cell loose contacting fault.
Energies 09 00387 g001
Figure 2. ECM of PCBG with two batteries.
Energies 09 00387 g002
Figure 3. Relationship between ohmic resistance and DOD at different aging states.
Energies 09 00387 g003
Figure 4. Relationship between OCV and DOD at different aging states.
Energies 09 00387 g004
Figure 5. Battery ECM considering contact resistance.
Energies 09 00387 g005
Figure 6. The parameters of a cell (a) OCV; (b) R i ; (c) R p ; (d) C p .
Energies 09 00387 g006
Figure 7. The simulation system of a battery pack.
Energies 09 00387 g007
Figure 8. Schematic drawing of battery pack for loose contacting fault experiment.
Energies 09 00387 g008
Figure 9. The estimated terminal voltage and the experimental terminal voltage of the PCBG with two cells.
Energies 09 00387 g009
Figure 10. The error between the estimated terminal voltage and experimental terminal voltage of the PCBG with two cells.
Energies 09 00387 g010
Figure 11. PCBG resistance vs. cell resistance increase fault.
Energies 09 00387 g011
Figure 12. PCBG resistance vs. cell aging inconsistency fault.
Energies 09 00387 g012
Figure 13. PCBG resistance deviation for PCBGs: (a) cell loose contacting fault; (b) cell aging inconsistency fault.
Energies 09 00387 g013
Figure 14. Deviation of PCBG resistance variance for PCBGs: (a) cell loose contacting fault; (b) cell aging inconsistency fault.
Energies 09 00387 g014aEnergies 09 00387 g014b
Table 1. Battery parameters.
ItemParameter (Unit)
Nominal Capacity5 Ah
Nominal Voltage3.2 V
Maximum Charge voltage3.65 V
Discharge Cut-off Voltage2.5 V
Standard charge current2.5 A
Maximum discharge current12.5 A

