1. Introduction
The recent increase in concern over the environment has generated opportunities for developing alternative fuel vehicles that reduce dependency on oil. Numerous studies have reported the benefits and advantages of pure electric vehicles (EVs), which use only electric energy, compared to the conventional internal combustion(IC)-based vehicles or hybrid EVs in terms of their environmental effects, manufacturing processes and product reliability [
1]. However, the advantages of pure EVs may be offset by the limited amounts of energy that can be stored in their batteries [
2]. This limitation can cause “range anxiety”, the fear of being stranded due to loss of energy in the battery. Unlike IC engine vehicles, which typically have a range of more than 200 miles and can be rapidly refueled, recharging the depleted battery of a pure EV may require several hours with a home charger. Even charging with the fastest charger still requires at least 30 minutes [
2,
3]. To solve this range problem, wireless charging EVs that use wireless power transfer technology have been introduced. The power for these vehicles can be supplied without human intervention, and the most advanced wireless charging technology can transfer power while a vehicle is moving. Therefore, the current range problem is expected to be solved by these systems for charging vehicles without halting their operation.
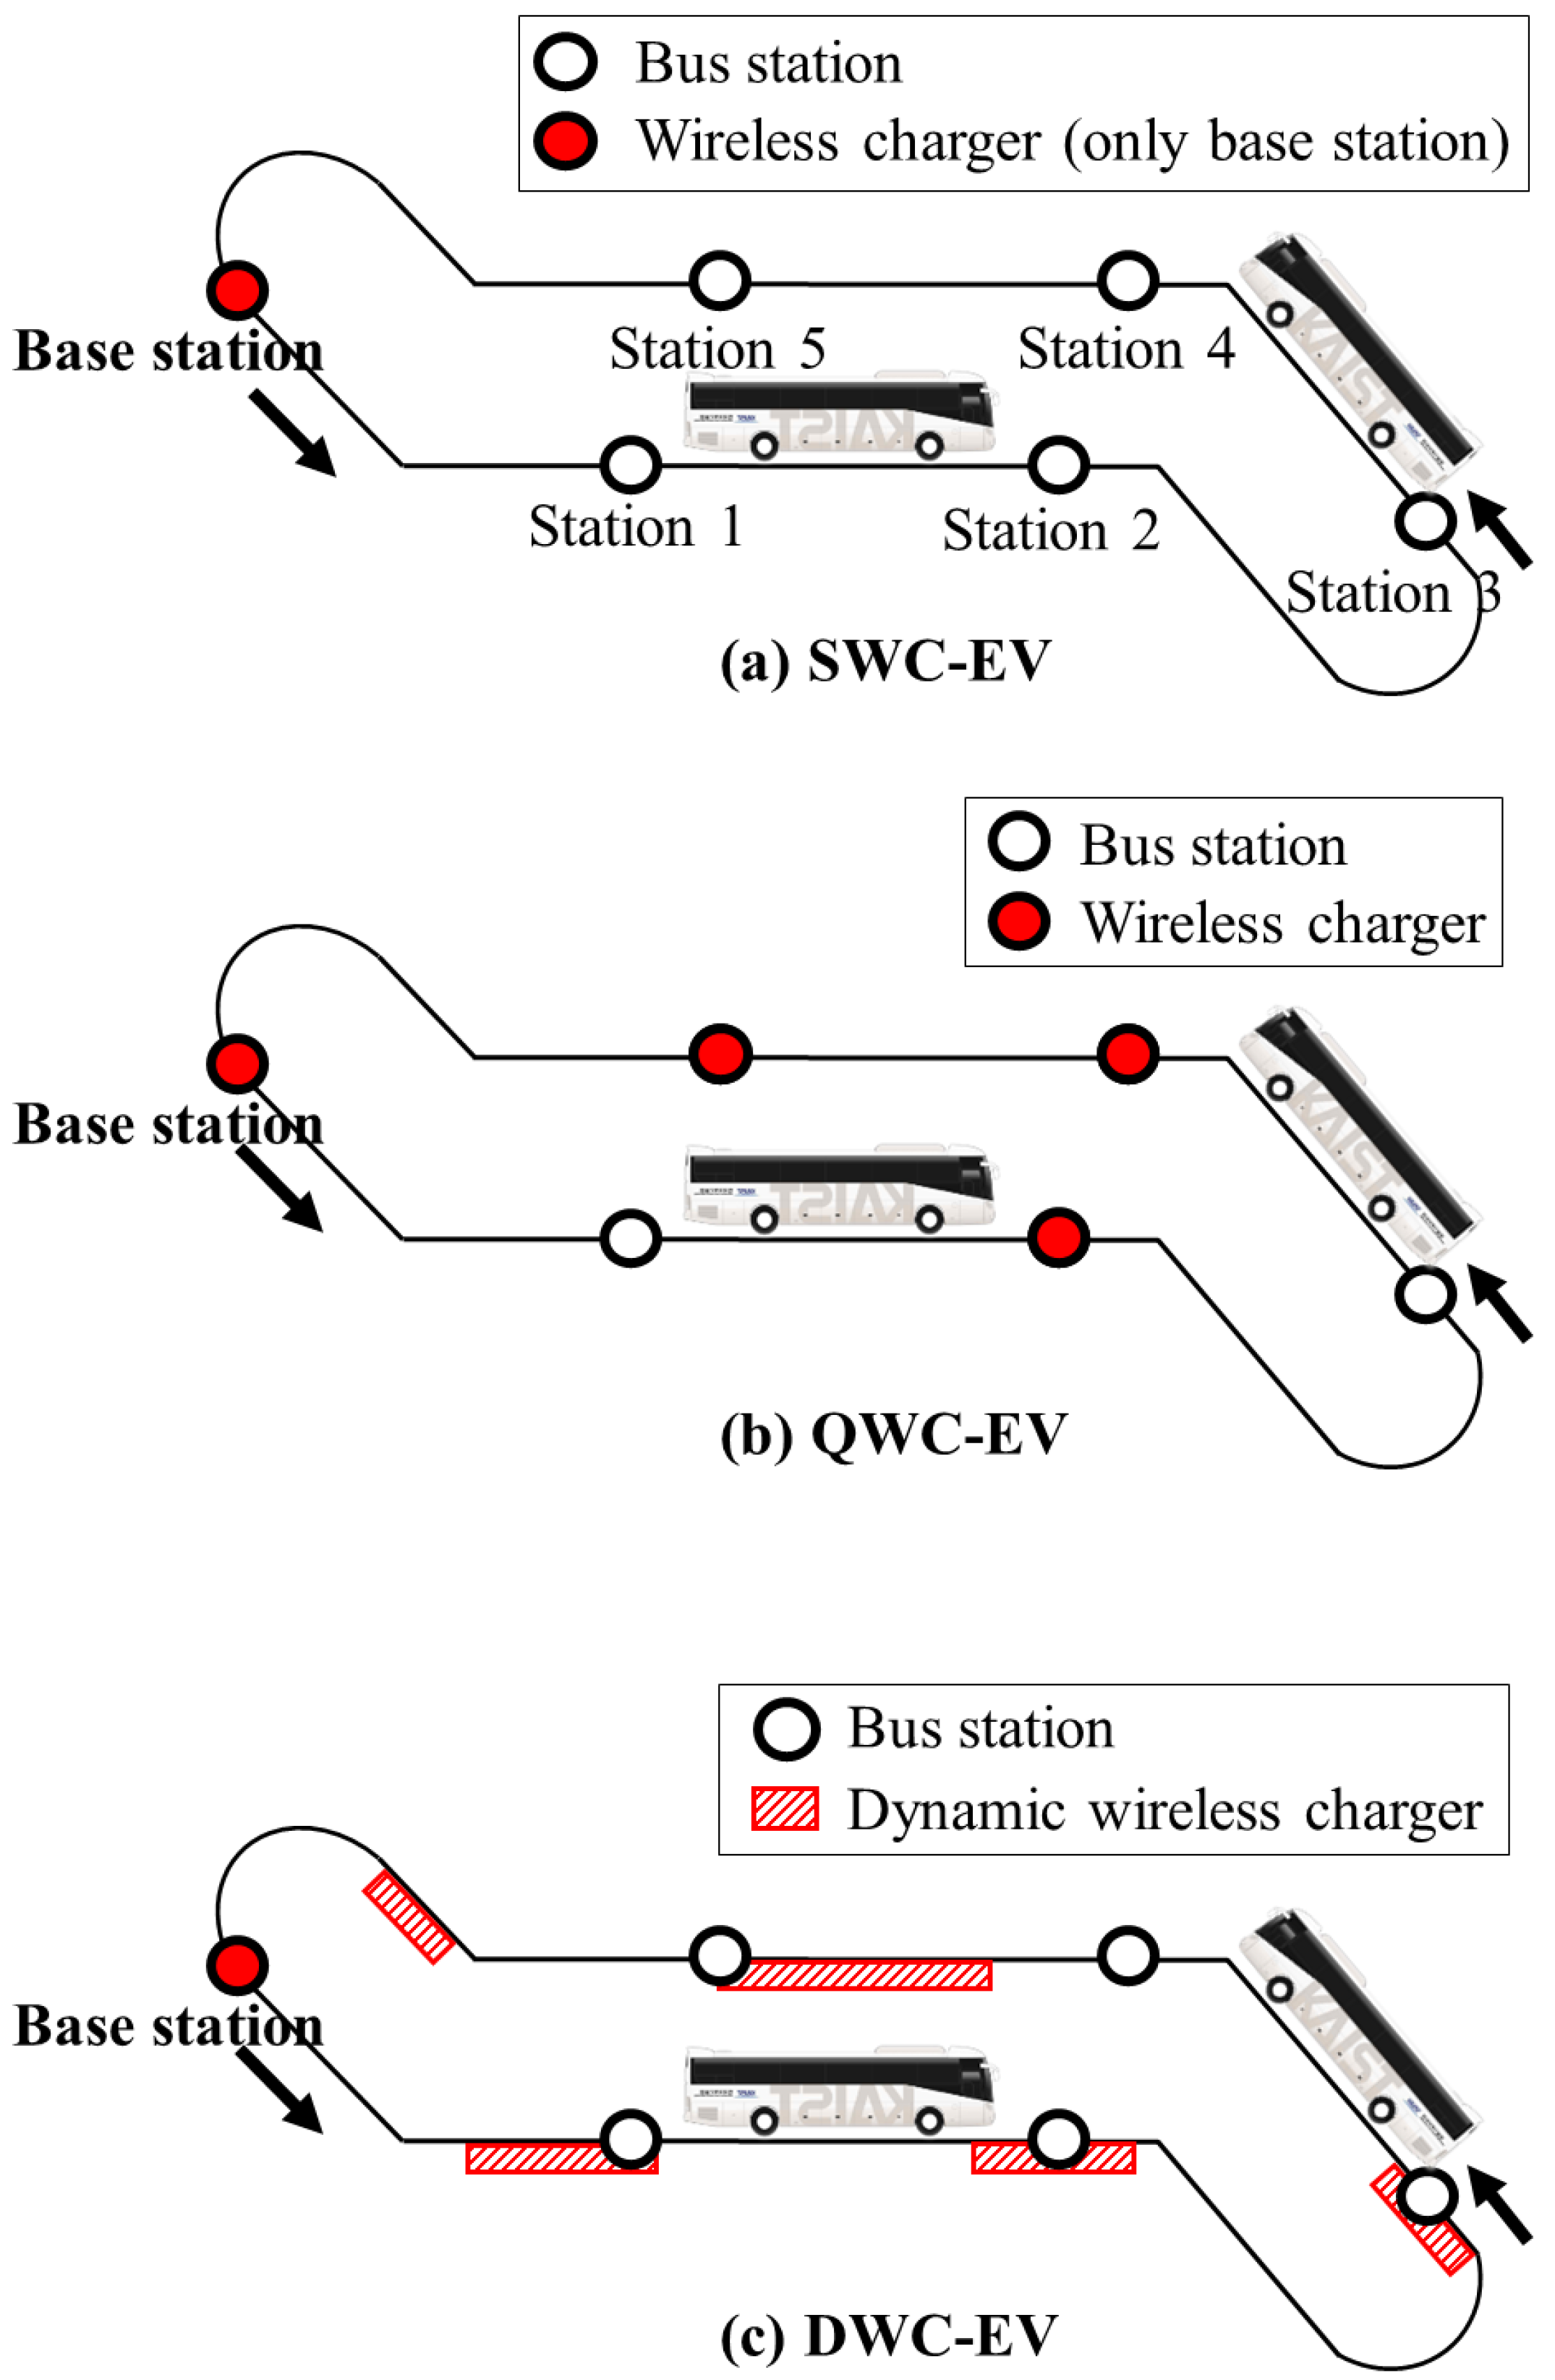
There are three types of wireless charging systems:
stationary wireless charging (SWC), where charging happens only when the vehicle is parked or idle,
quasi-dynamic wireless charging (QWC), in which power is transferred when the vehicle is moving slowly or in stop-and-go mode, and
dynamic wireless charging (DWC), in which power is supplied even when the vehicle is in motion. This classification of the systems for wireless charging EVs has been recently introduced in a number of studies and reports, including [
4,
5]. The SWC system was first introduced to eliminate the requirement for a connection cable to plug-in EVs. The DWC system is more advanced, and it utilizes power transmitters embedded in the road for the wireless transfer of electric power as the vehicle travels over it. DWC is also known as a
move-and-charge,
dynamic inductive charging,
ground-electrified or
road-way-powered system. Although DWC is the most advanced wireless charging solution, this does not necessarily mean that DWC will replace the SWC and QWC solutions. In particular, when wireless charging EV-based public transportation systems are designed, the costs and benefits of each system depend on the fleet size, service range and other cost factors, such as battery prices or charging installation costs. Depending on the operational conditions and costs, the SWC solution may be more competitive than DWC, or
vice versa.
In this paper, we compare the initial investment costs for installing the three types of wireless charging (SWC, QWC and DWC) in a new public transportation system (“EV type”, or “solution type”, refers to the type of wireless charging). Our analysis focuses on public transit applications, as the most current wireless charging EV applications have been developed and tested for public transit rather than personal vehicles [
6]. We are motivated to explore options for wireless charging EVs as an extension of our work in developing the On-Line Electric Vehicle (
), which is one of the first commercially-available DWC-capable EVs. The OLEVwas first developed at the Korea Advanced Institute of Science and Technology (KAIST), and it uses an innovative inductive power transfer technology called the shaped magnetic field in resonance system [
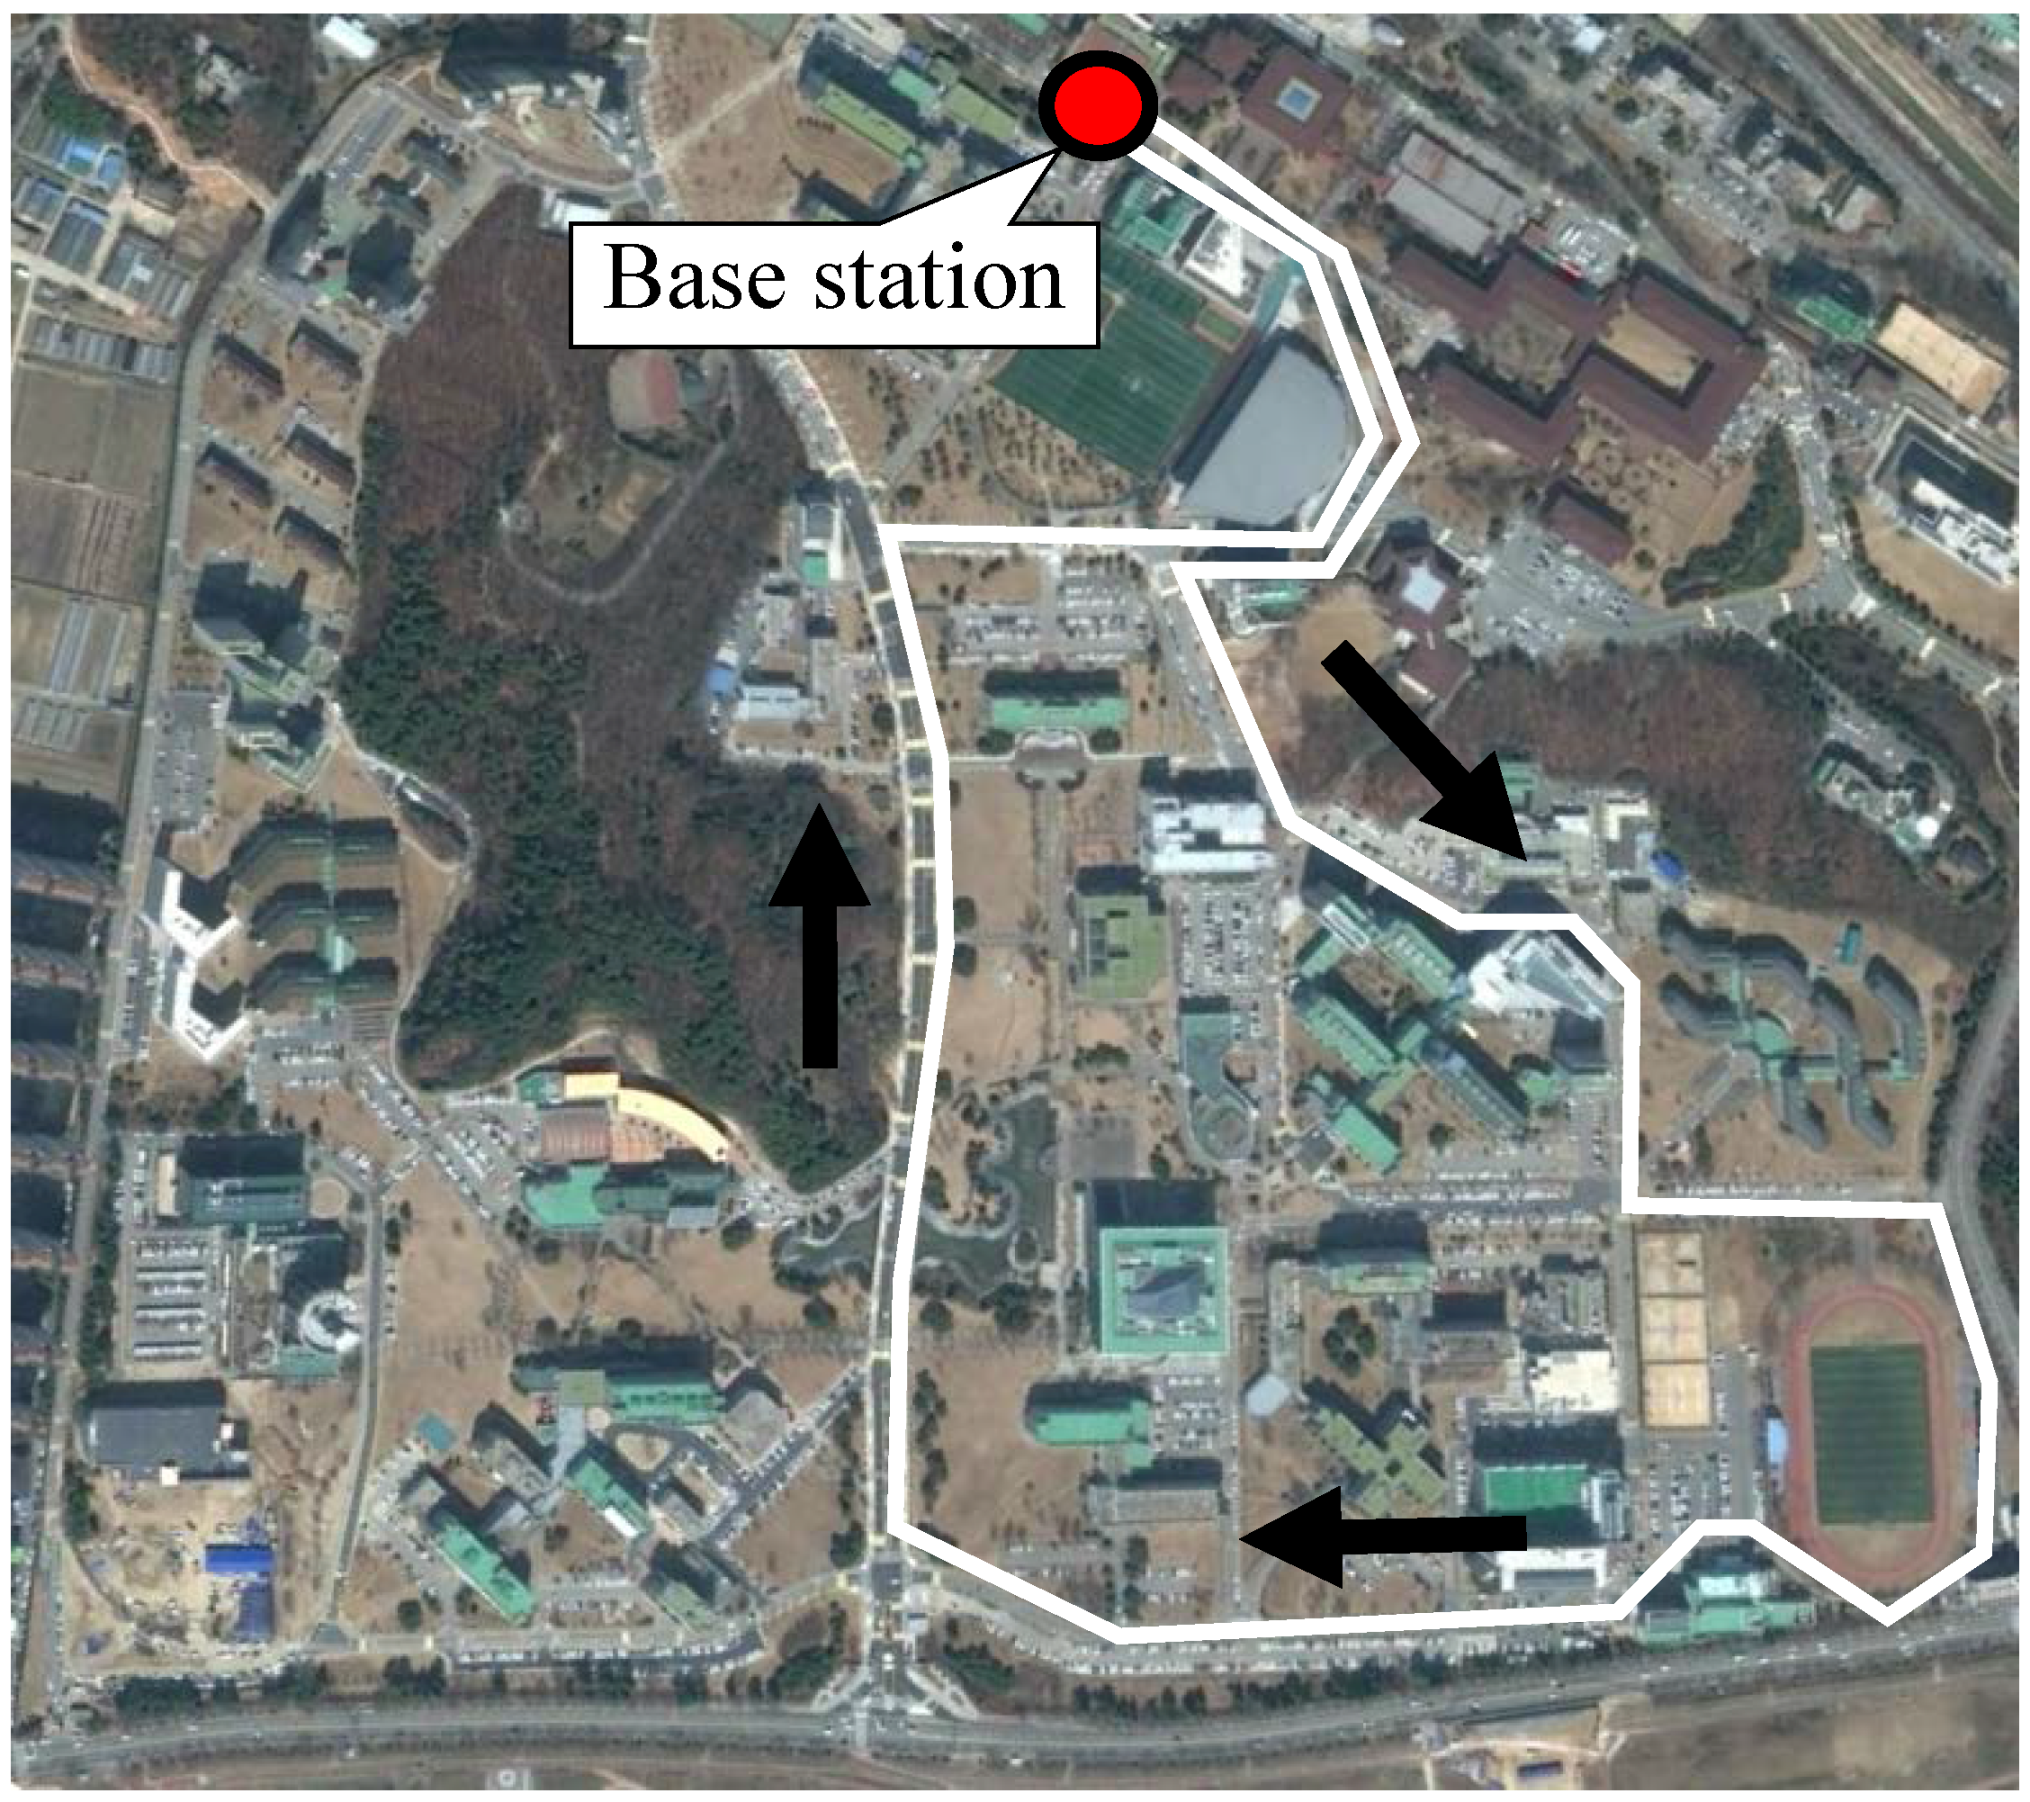
7]. The first commercial application of this technology was introduced in 2009 as the trolley in Seoul Grand Park. The second commercial version of the system was developed for the shuttle buses on the KAIST campus, which have been in operation since 2012 [
8].
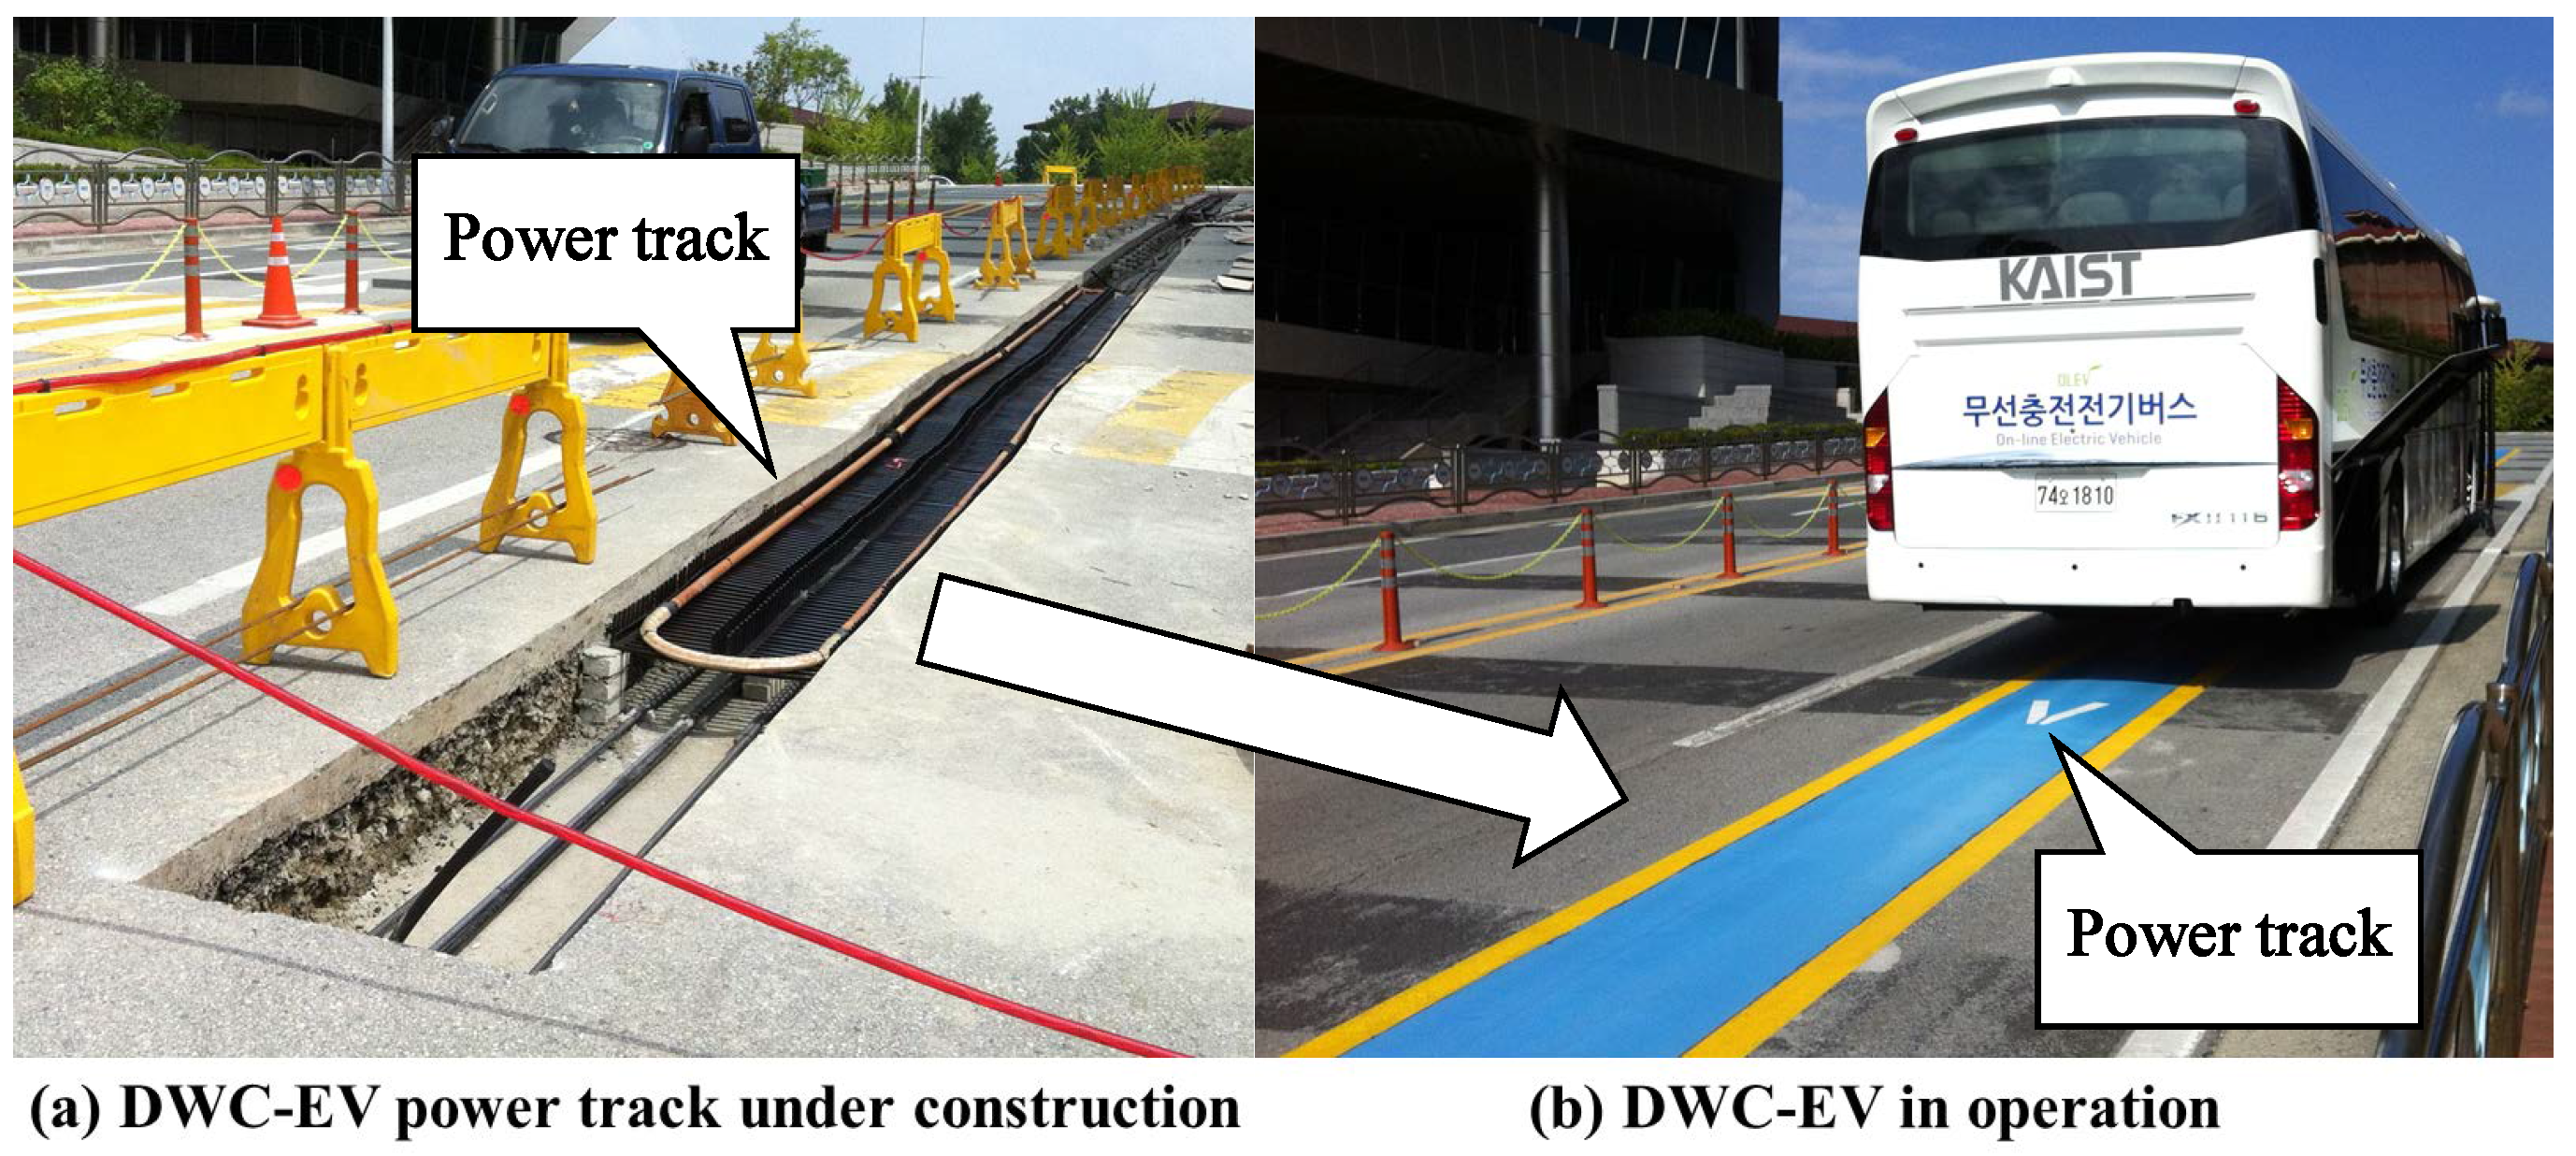
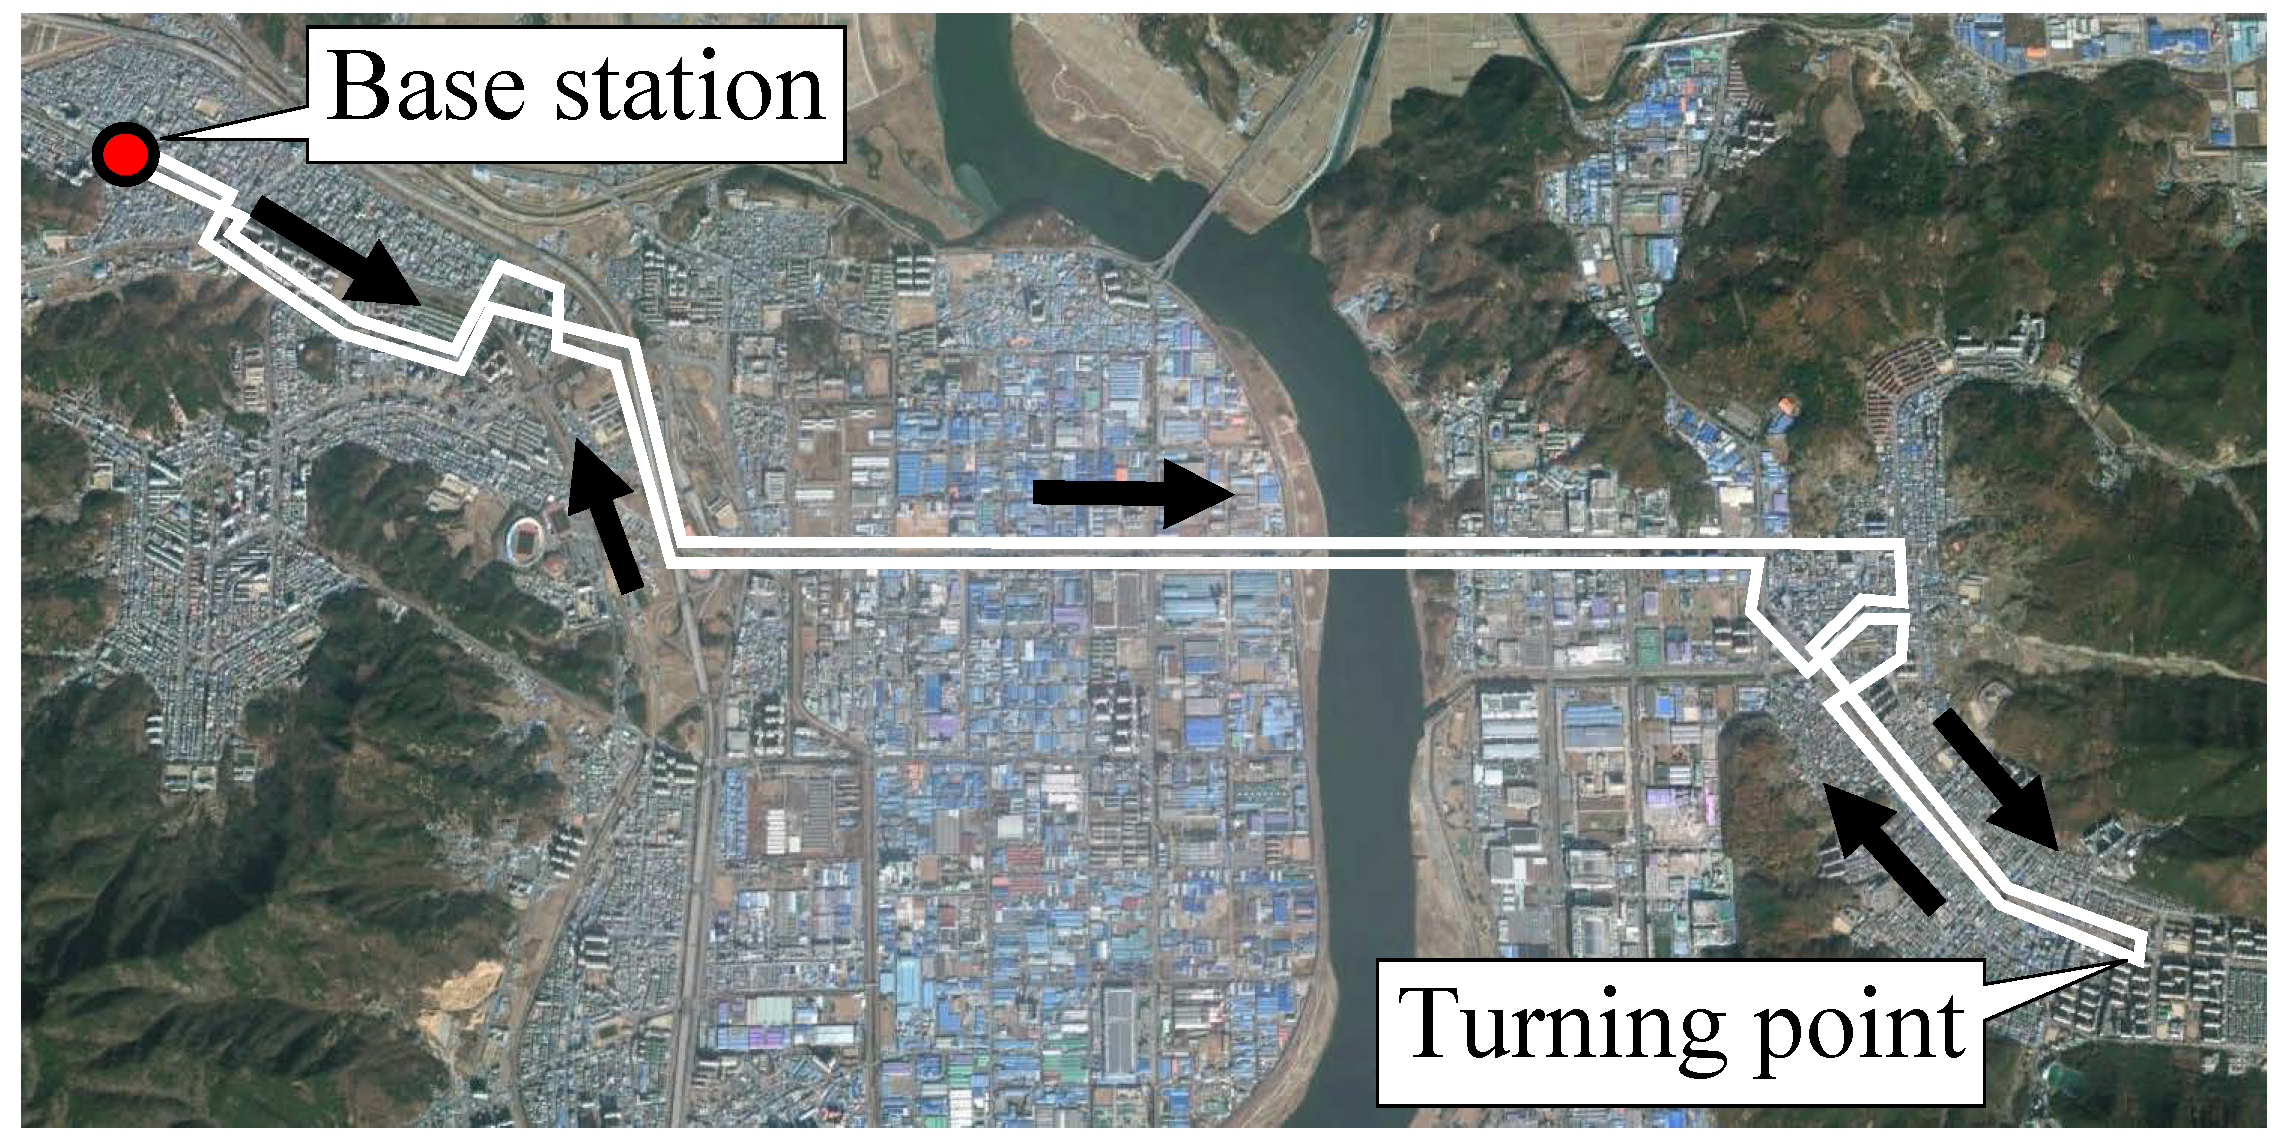
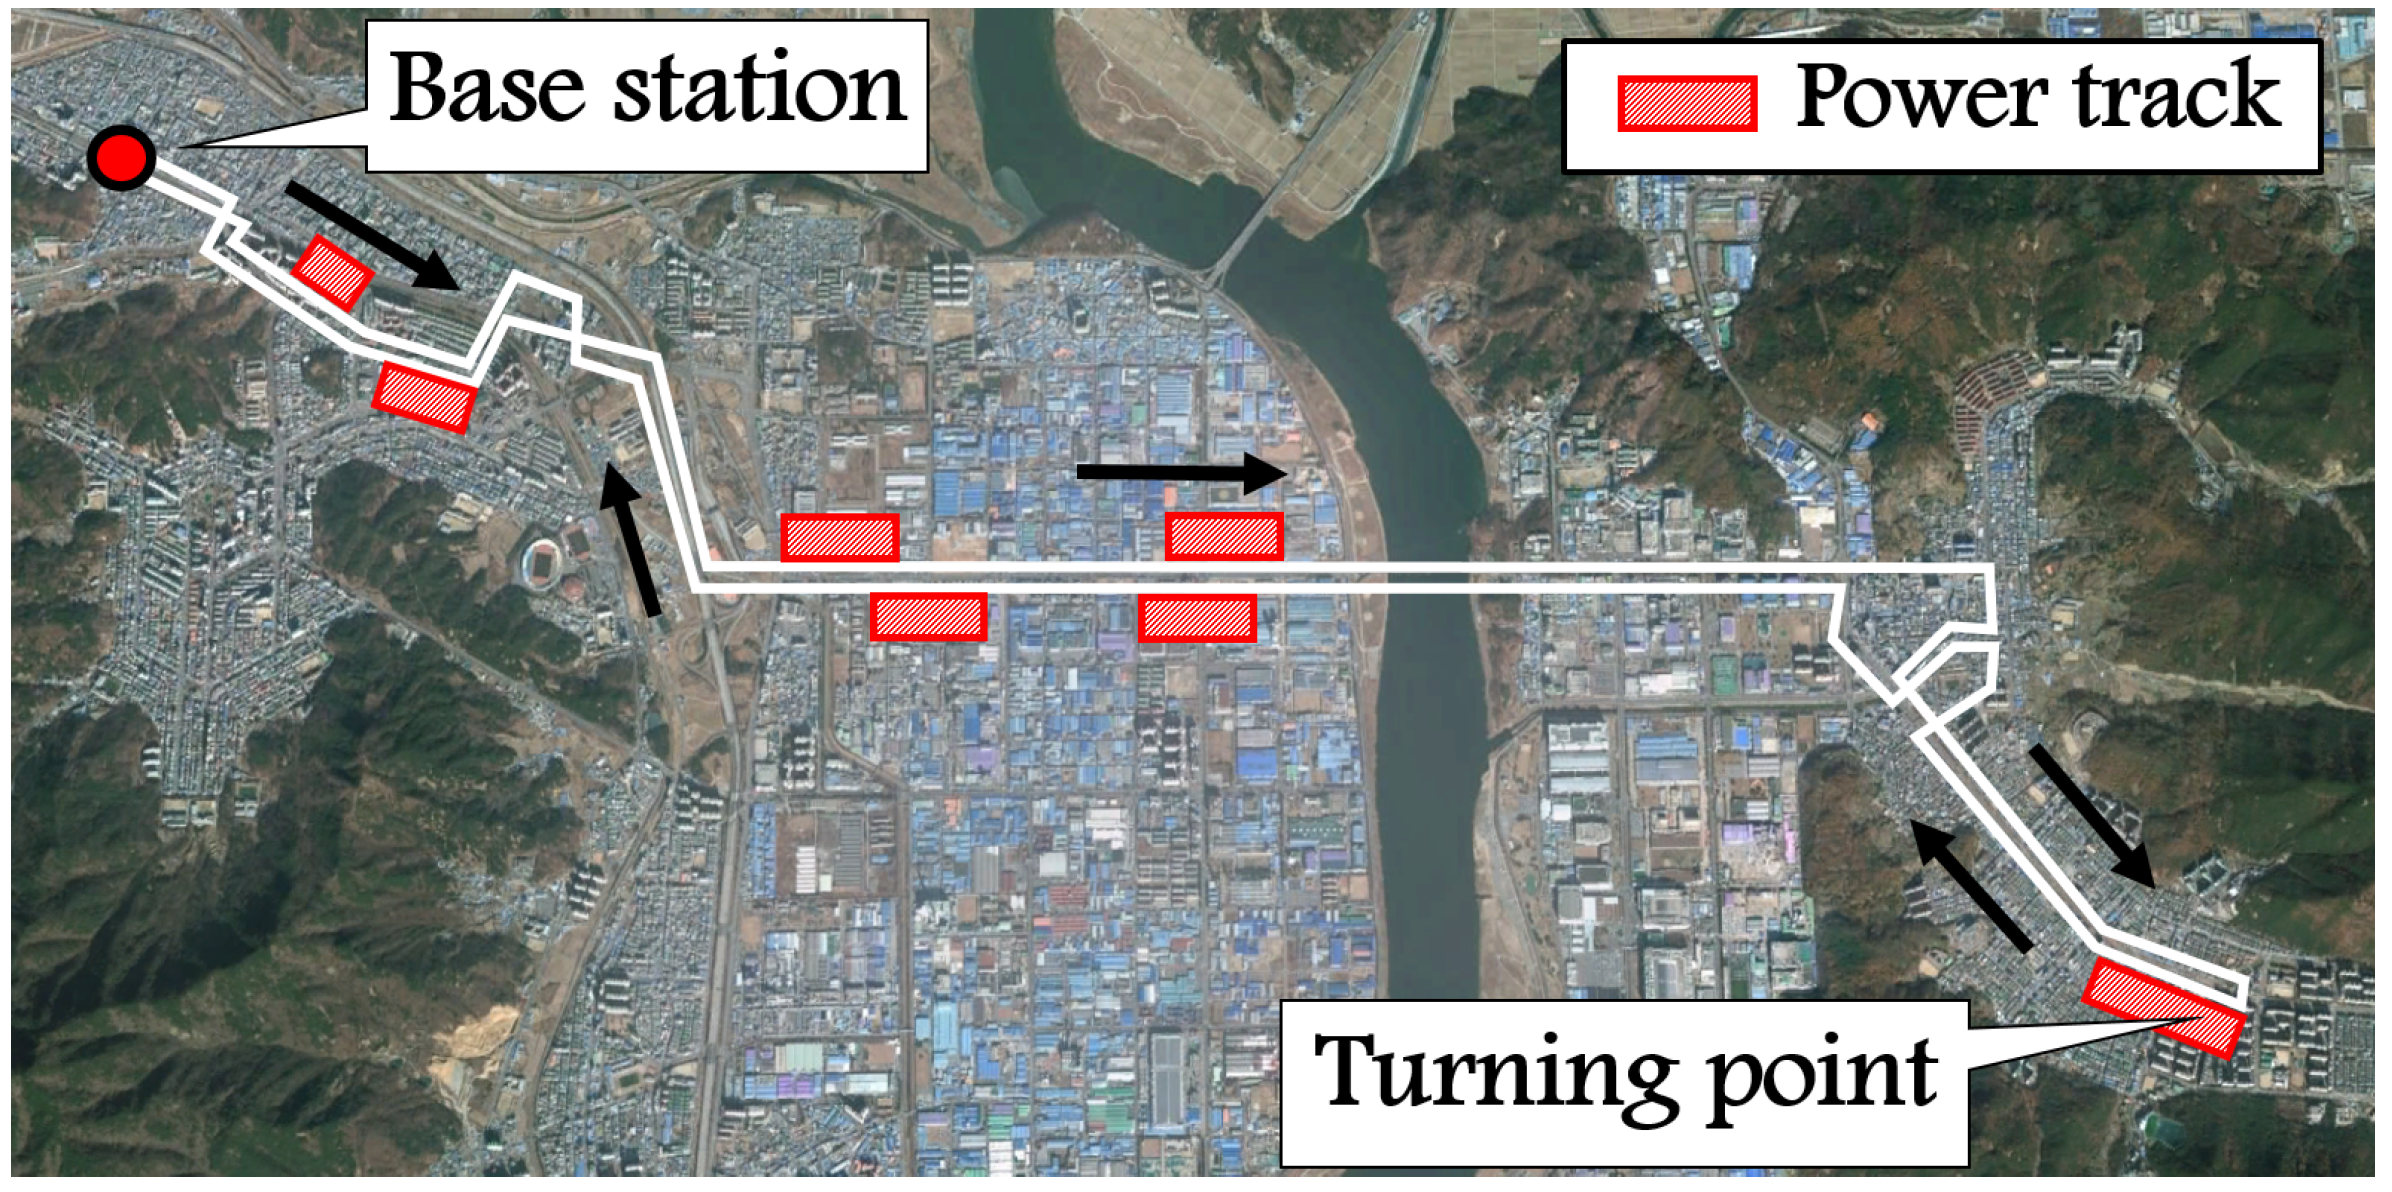
Figure 1 shows the OLEV currently serving as a campus shuttle on the KAIST campus and the power track installed under the road. The third commercial version has been operating as a public transit line in Gumi City, South Korea, since 2013. Although the KAIST OLEV is primarily designed as a DWC-based transportation vehicle, it can operate as SWC or QWC if the infrastructure is installed only at a base station or it allows charging only when the vehicle halts at a bus stop.
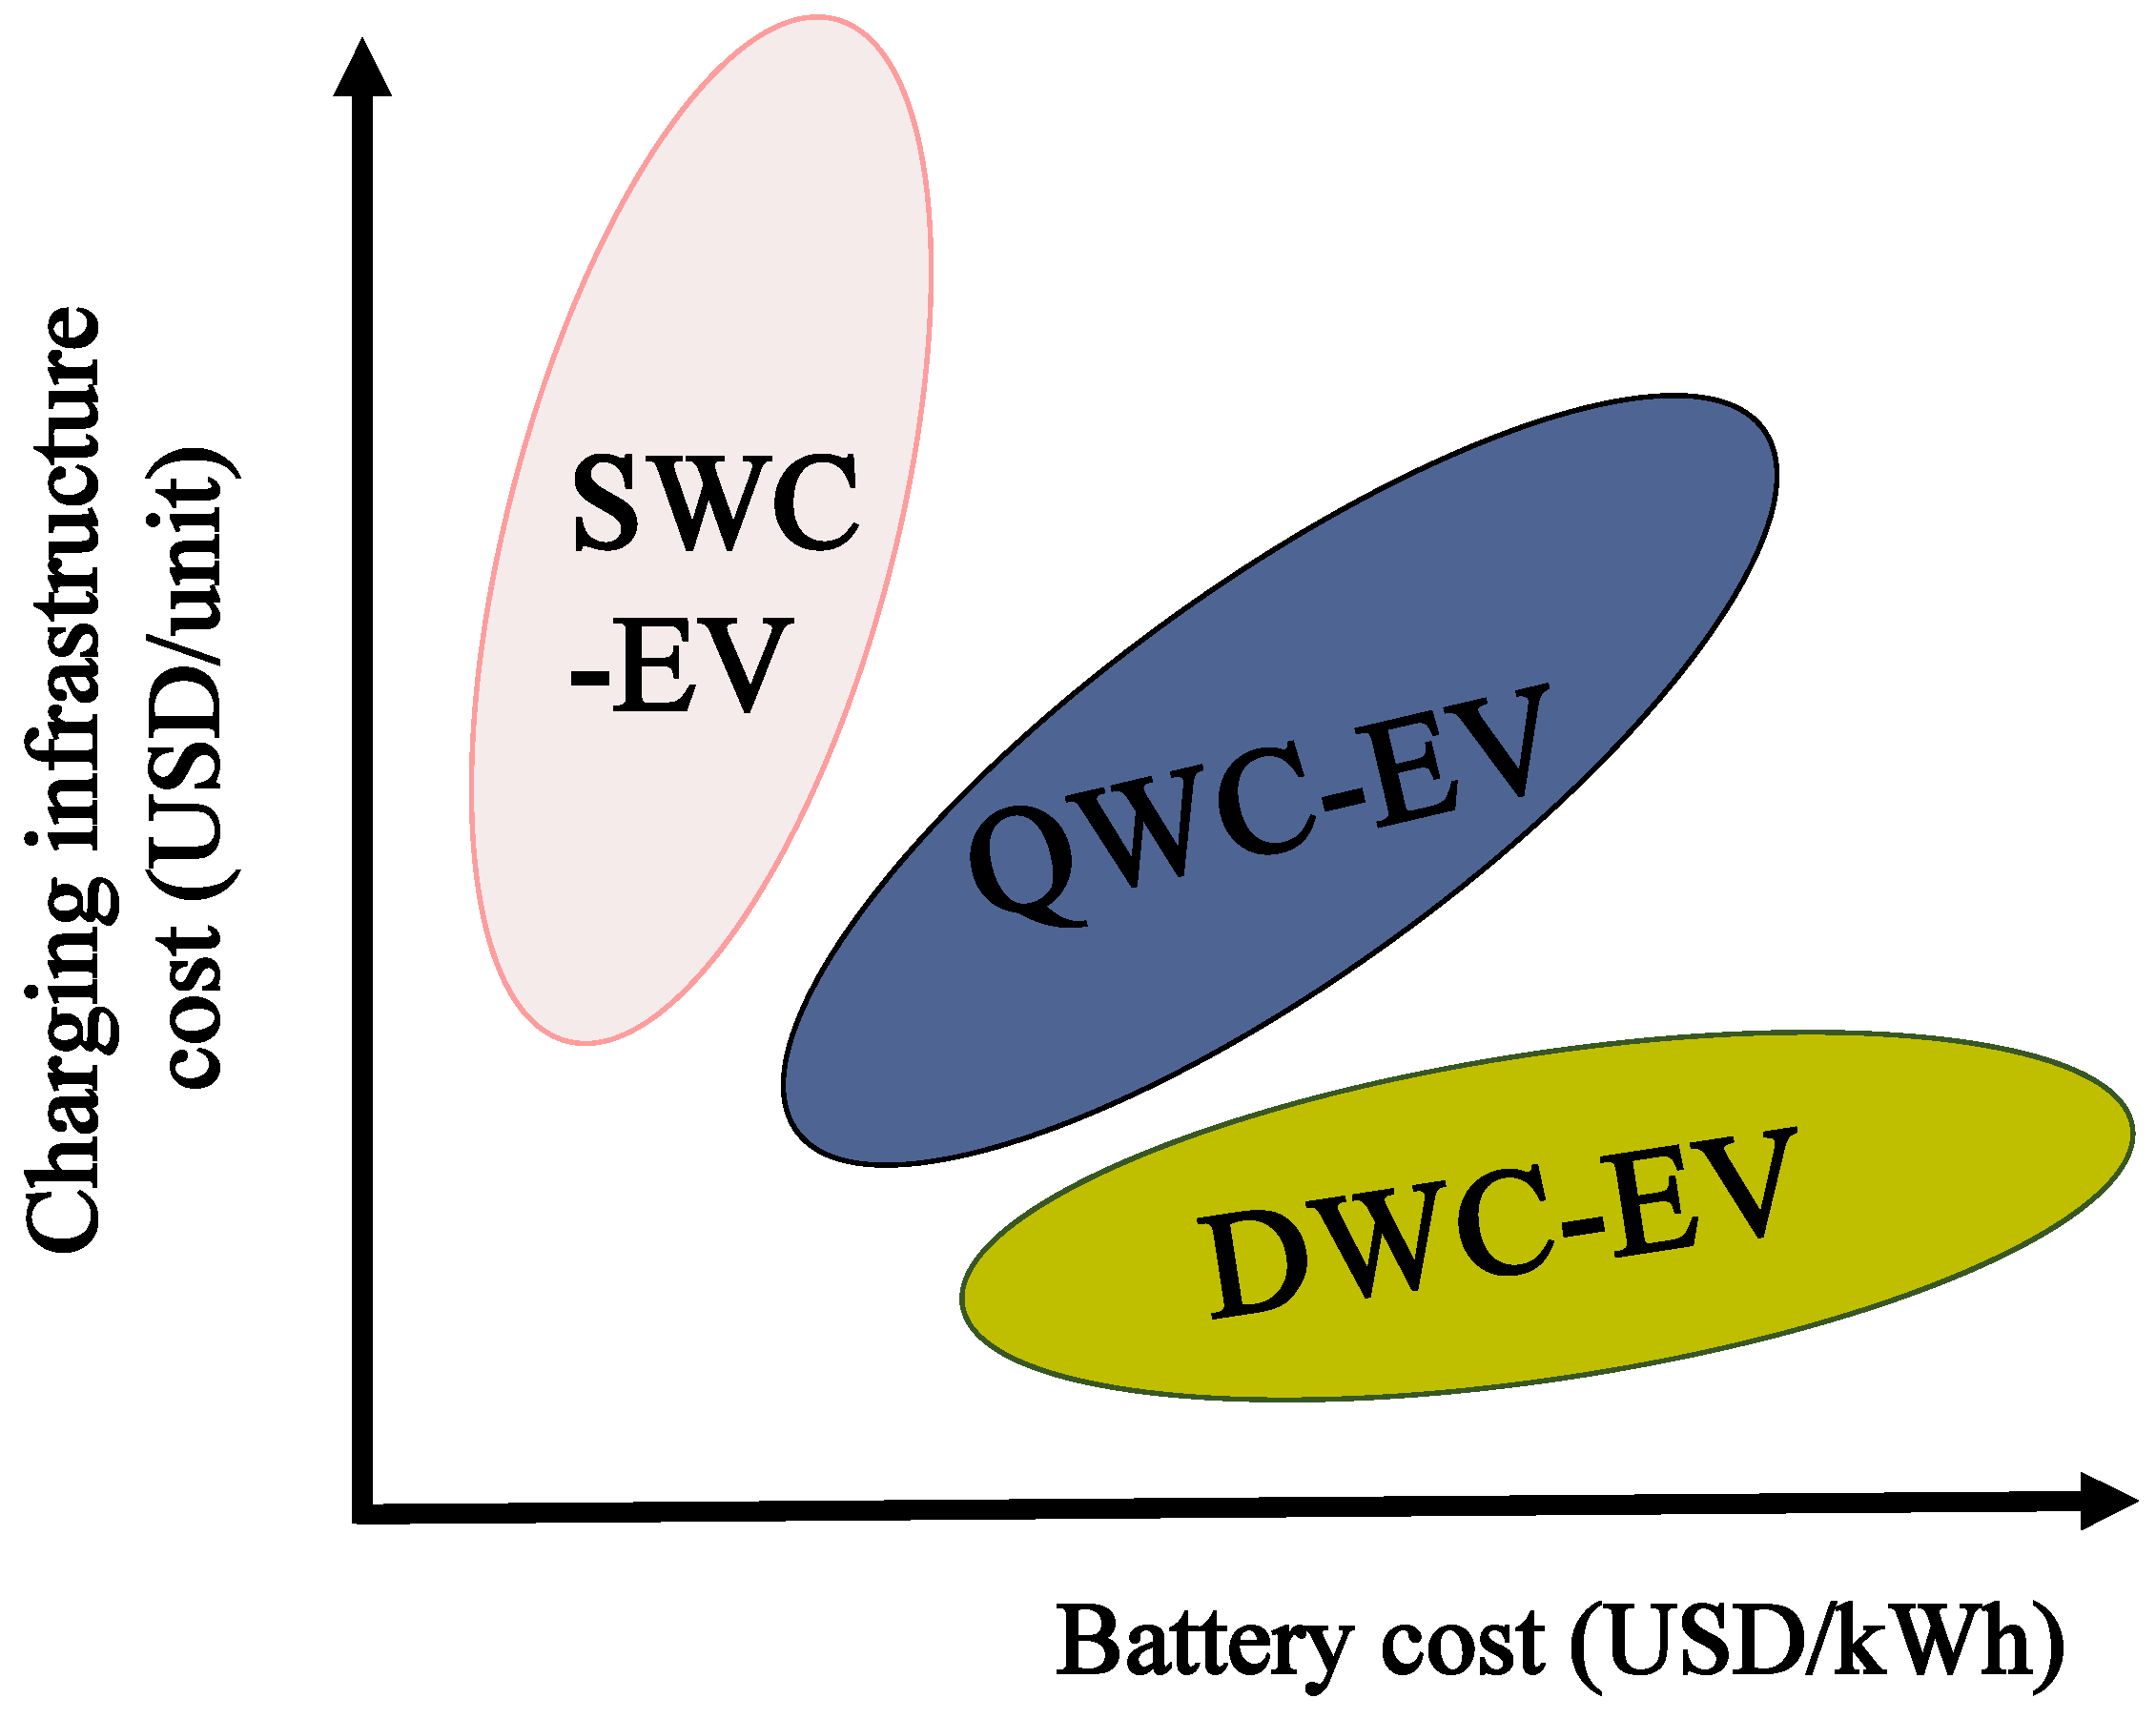
From the experience gained in the development and actual operation of the OLEV system, the engineers initially found that there were clear advantages and disadvantages for each type of wireless system. They therefore presented a qualitative cost-benefit analysis for each type, as shown in
Figure 2. This figure qualitatively illustrates the competitiveness of each type, depending on the costs of batteries and infrastructure. However, policy makers and investors will not make a multi-million-dollar decision based on this type of qualitative analysis. Suppose that someone asks the following very specific question: “The current battery cost in the market is $500/kWh, and the cost of the charging infrastructure is $10,000 per unit. If 10 buses will be operating on a specific route, how much investment is needed for the dynamic charging of EVs compared to the stationary charging of EVs?”. This kind of specific question cannot be answered by the qualitative estimate shown in
Figure 2. The cost analysis conducted in this paper quantitatively verifies the comparison shown in this figure. The initial cost investment analysis proposed in this paper is further motivated by the following considerations.
First, the development and commercialization of wireless-charging EVs depend on the evaluations of the new technology’s operational reliability. Once the reliability of such EVs is proven, the next step prior to mass commercialization is to analyze the startup and operating costs of these systems.
Second, researchers and engineers involved in these initiatives claim that DWC reduces the high investment costs of conventional plug-in EVs by allowing the batteries to be substantially downsized [
9]. For example, it was originally claimed that the KAIST OLEV system would have substantially reduced initial investment costs, as the technology used batteries one-fifth the size of those in conventional plug-in EVs (the supplemental file for this paper “CNN-Report-KAIST-OLEV.avi” contains the CNNreport mentioning the battery size of the KAIST-OLEV). In addition, it was also reported that DWC would be economical because it would effectively utilize the installed charging infrastructure, as a large number of vehicles would use the same road segments equipped with a charging system [
6]. However, none of these claims have been yet supported by any quantitative analysis.
Last, it is reasonable to expect that whenever a wireless charging EV-based transportation system is proposed, the policy-makers and stakeholder will request a cost analysis of the SWC, QWC and DWC options. Therefore, it is necessary to develop a method for comparing the initial investment costs for these different types of charging systems.
The cost comparison of different wireless charging systems is a significant part of the initial investment analysis. This type of comparison is important, not just because the costs of the chargers and required components are different for each type, but also because the type of charging system determines the cost of the batteries and the charging infrastructure. For example, consider a service route where 10 vehicles are circulating. Suppose that an SWC system is used for this service. Then, all 10 vehicles need a battery that is large enough to complete the required circulation. As a charger needs to be installed only at the base station for an SWC system, a larger expenditure must be made on the batteries than on the charger. Suppose that the QWC type is used instead. The cost of batteries can be reduced by installing chargers at the various bus stations. Further cost reduction on the batteries can be achieved if a DWC system is adopted. However, in these cases, the costs of the charging infrastructure will increase. This example clearly shows that depending on which type of wireless charging solution is used, the costs of the batteries and the charging infrastructure can radically change. If we consider that the combined costs of the batteries and the charging infrastructure account for a significant portion of the total investment in an EV-based transportation system, the decision on which type of wireless charging to use is critical [
10].
Furthermore, analyzing the costs of QWC and DWC systems is complicated, as the tradeoff between allocations for battery capacity and infrastructure must be considered. One of the key decisions in deploying QWC or DWC EVs for a public transit system is choosing where to allocate the charging infrastructure along the bus lines. The charging infrastructure should be allocated to supply sufficient electric power to the vehicles, and the location of the charging stations determines how frequently the vehicles are charged. This allocation should also be considered relative to the battery size. It should be noted that the battery capacity determines the maximum amount of energy that can be stored. If the battery capacity is low, the per-charging distance (or the maximum distance that the EV can travel on a fully-charged battery) will be short. Consequently, more frequent charging is required for smaller batteries, and a greater density of charging stations must be distributed along the routes. Therefore, in planning for a QWC or DWC-based transit system, the issue of charging infrastructure allocation should be considered together with the size of the batteries.
To deal with the complicated nature of initial investments, we use optimization models to evaluate the minimum initial investments required for QWC- and DWC-based solutions. These optimization models evaluate the optimal allocation of the charging stations in relation to battery capacity for the minimum total investment. For our analysis, we draw on two different routing scenarios and apply actual data collected from the OLEV systems currently operating on the KAIST campus and in Gumi City. Although the OLEV at Gumi City is primarily designed for DWC, the data collected from this system, such as the amount of energy consumption, the velocity trajectories, the road gradients and other operational data, can be used for the analysis of other types of charging systems. Moreover, as the options we consider all involve commercialized wireless charging EVs, credible cost figures can be used for the analysis.
We understand that the costs of ownership, lifetime cost analyses and any other return-on-investment analyses are important. However, the initial investment cost, which is the most basic cost-related analysis, needs to be assessed before any other investment and cost analyses. Therefore, the analysis proposed in this paper can be treated as the first step toward further investment and benefit analyses. It should also be noted that comparisons of costs for other classes of vehicles (such as an IC engine, hydrogen-fuel cell engine or any other alternative fuel vehicles) are beyond the scope of this paper. The proposed analysis seeks to answer the following questions:
The remainder of this paper is organized as follows.
Section 2 presents the related literature on the recent development of wireless charging technology, on the investment cost analysis of alternative fuel vehicles and on the system design issues for EV charging stations. This overview also shows how our research differs from previous studies.
Section 3 explains the system boundaries of this analysis and the data used. Our analysis uses data collected from the OLEV systems in the KAIST campus and Gumi City operations. The operational conditions for these systems are provided, so that readers can better understand the basis of the initial analysis.
Section 4 describes the model for determining the minimum investment cost for each type of EV and introduces the optimization models.
Section 5 presents the results of the analysis, comparing the investment costs among the three types of wireless charging systems. The cost structure conditions that are beneficial for each type of wireless charging are discussed. Finally,
Section 6 concludes the analysis and suggests how this research can be extended in the future.
4. Economic System Design Method
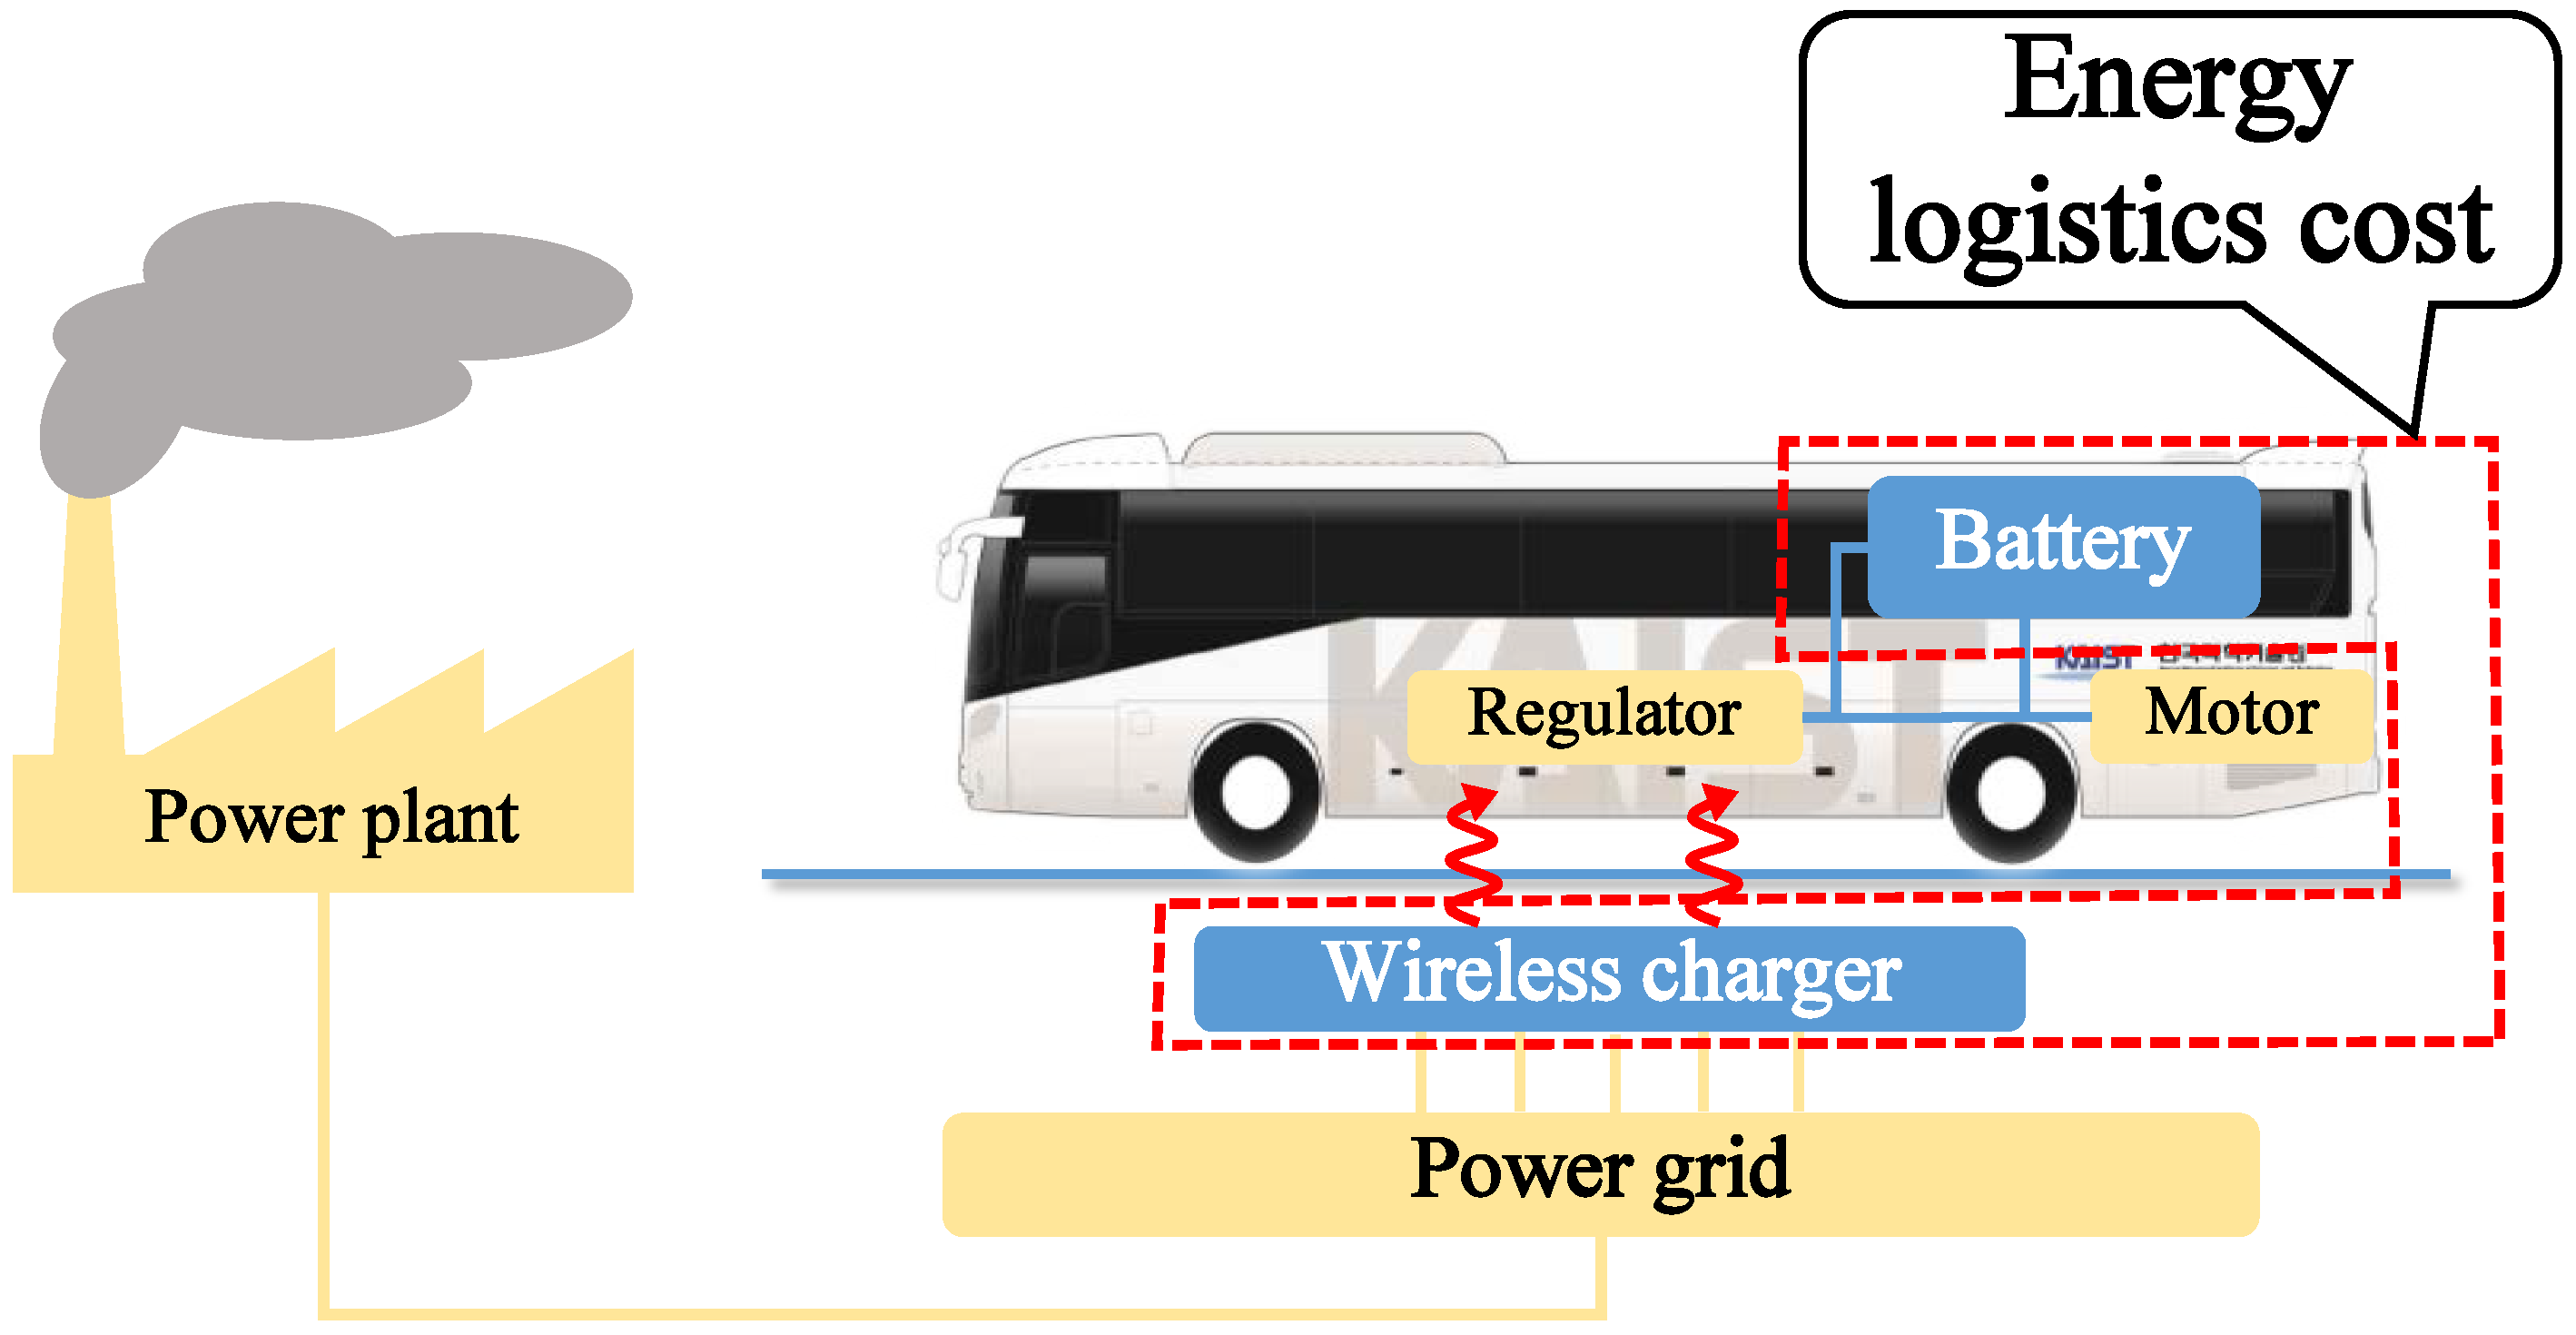
In this section, we provide the method for analyzing the initial investment for each type of EV system. In particular, this analysis is focused on the
energy logistics cost in transportation, which is defined as the cost of transferring and storing the energy needed to operate the transportation system. In the domain of EVs for public transit systems, the energy transfer and storage functions are performed by the charging infrastructure and the batteries, respectively. Therefore, the total cost includes the costs of the charging infrastructure and the batteries. In our analysis, we compare the energy logistics cost among the different types of wireless charging EV. Note that the energy logistics cost excludes the cost of generating electric energy and installing the energy grid. The system boundary of the cost analysis is described in
Figure 6. We focus on the energy logistics cost in the initial cost analysis for the following reasons.
The initial investment cost for an EV-based transit system is mainly composed of the cost of a fleet of vehicles and the cost of the charging infrastructure. The cost of the vehicles further breaks down into the costs of the batteries, the vehicle units and the other charging components. Note that the goal of our analysis is to compare the initial costs of different EV types for each scenario, rather than to evaluate the absolute investment amount. We assume that each type of EV uses the same type of vehicle units, and therefore, we exclude the vehicle unit cost. We then characterize the costs of the batteries and the charging infrastructure as the “energy logistics cost.” Therefore, analyzing the breakdown of costs within the energy logistics cost is adequate for understanding the different investment cost structures among the different types of EVs. Moreover, we should note that the energy logistics cost (including the battery and charging infrastructure costs) accounts for more than 80% of the total cost of an EV-based transit system [
6]. Therefore, understanding the cost structure of the energy logistics is critical for deciding on investments in EV-based transit systems.
We define
as the total energy logistics cost for one service route operated with EVs of
s type. Let
be the cost function of energy storage in the vehicles for type
s, where
. This cost is mainly determined by the battery size in the vehicle and the number of vehicles. Let
be the cost function of energy transfer for type
s. This cost is mainly a function of the sum of the charging units. Then, the total energy logistics cost can be approximated as:
Our analysis is concerned with evaluating
for each type of EV for a given route. That is, for each type
s, we try to find the minimum cost of
while satisfying the service requirement. Specifically, the service requirement is that the EVs operate with sufficient energy in their batteries. Therefore, for each type
s, the cost analysis seeks the minimum investment cost needed to complete the service, such that:
That is, the optimization in Equation (
2) involves finding the least amount of investment needed for a service using each type of EV.
The constraint in Equation (
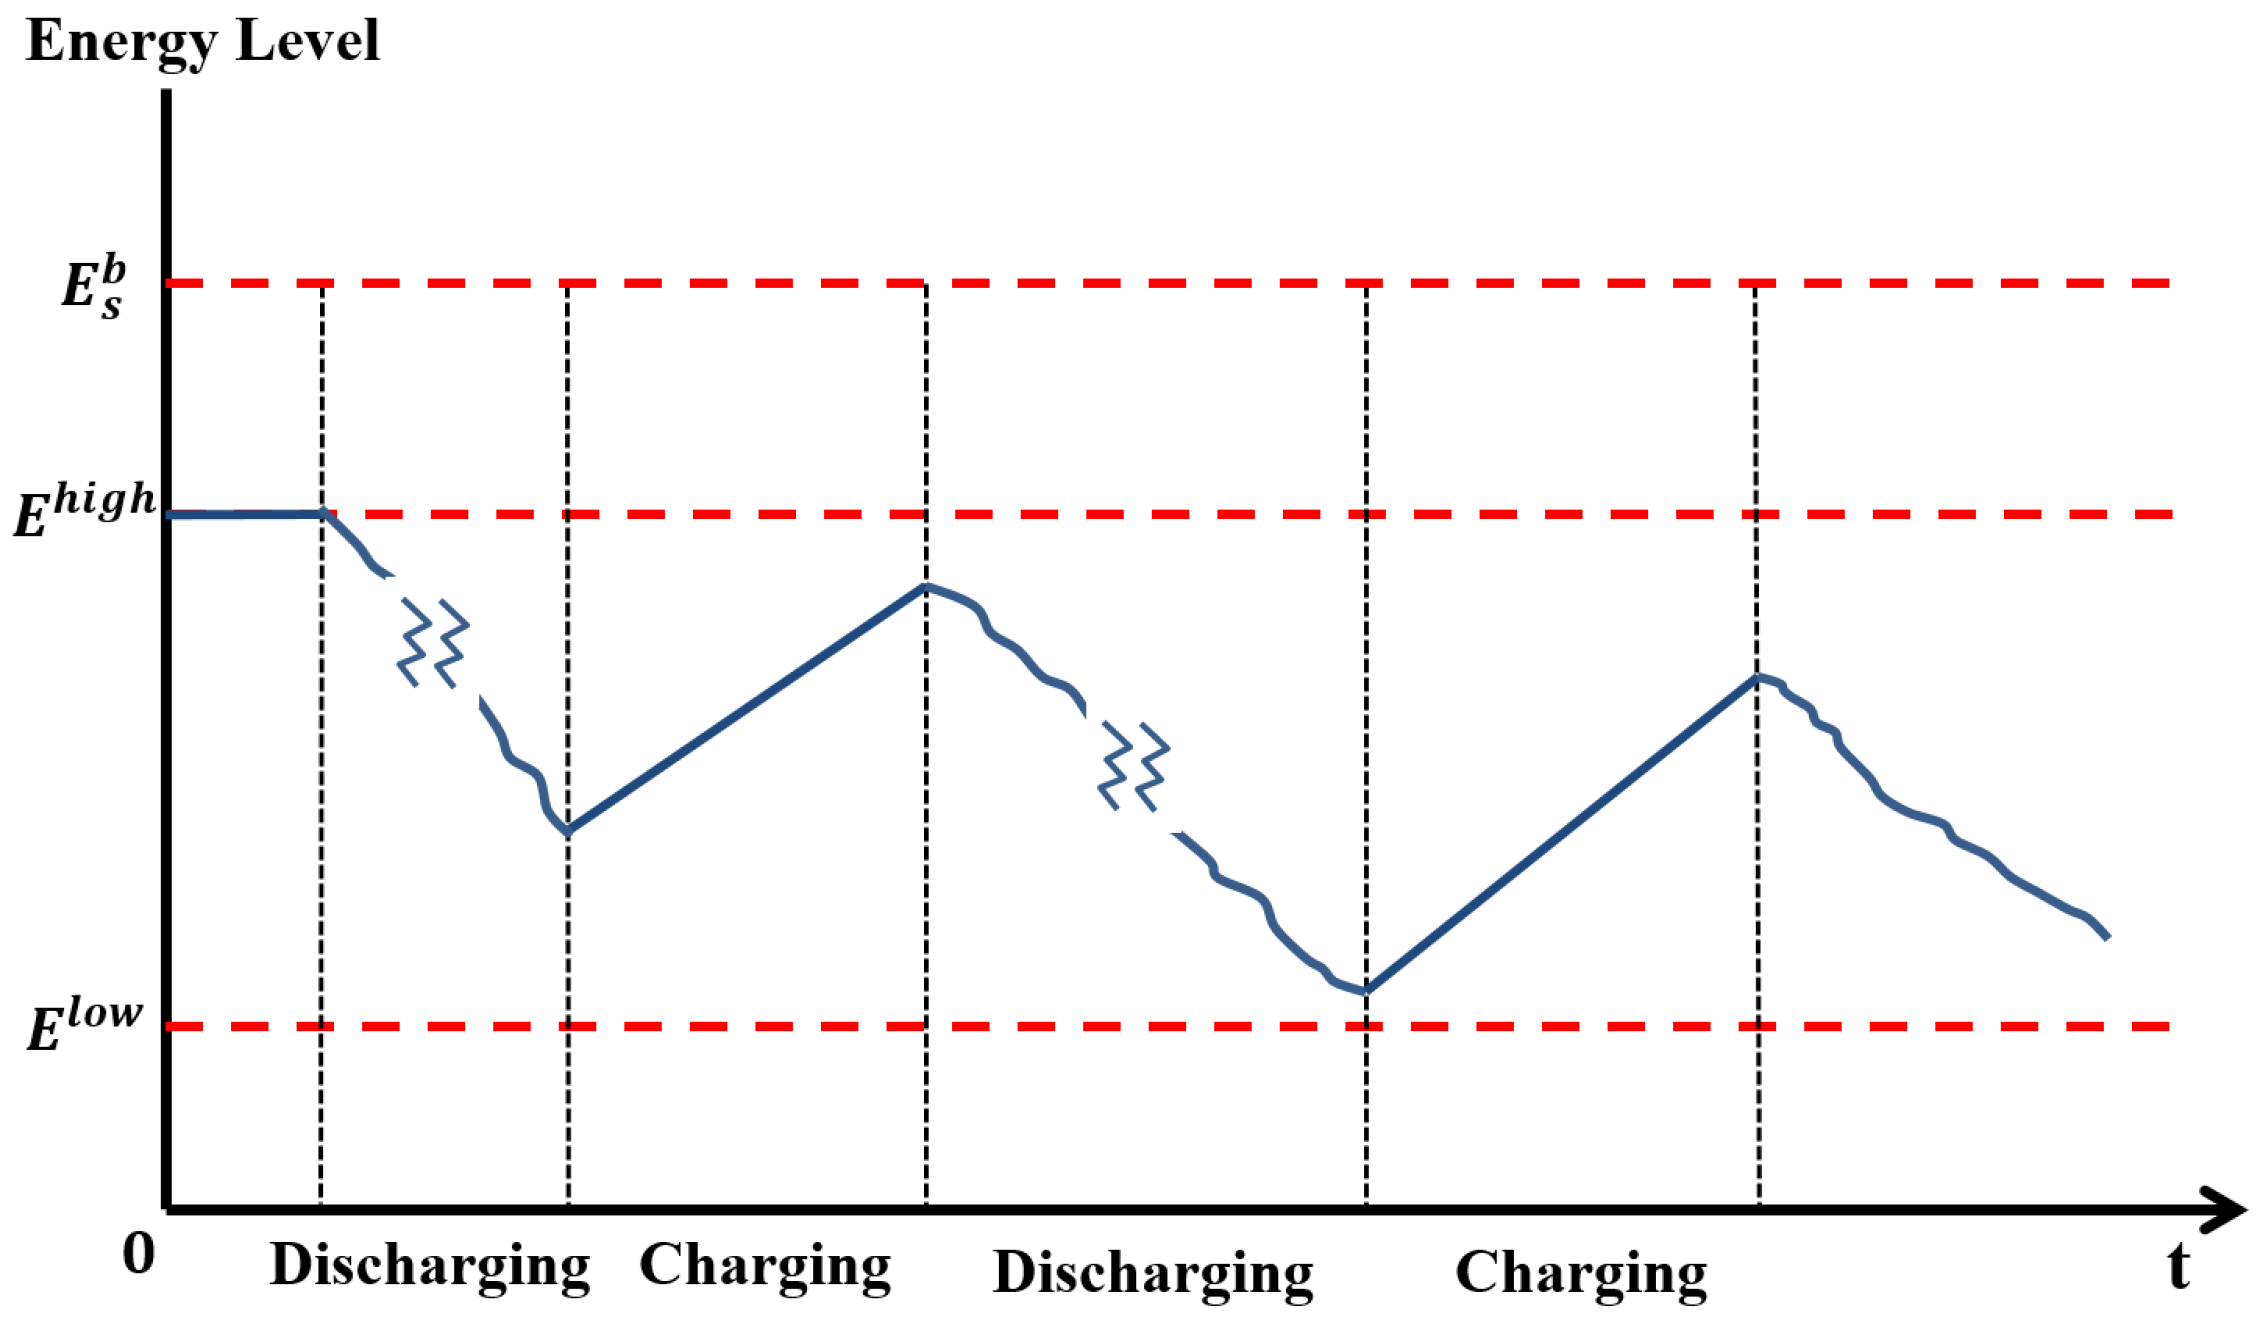
2) is directly related to the size of the battery. Let
be the size of the battery for type
s. Let
and
be the maximum and the minimum allowable energy levels in the battery, respectively. These limits are usually provided by the battery manufacturers to help guarantee the required battery life cycle, as the battery’s life is seriously degraded if it is overcharged or over-depleted. Therefore, the required energy levels are defined as:
where
and
are the proportional coefficients that present the upper and lower limits, respectively. These coefficients are provided by the battery manufacturers (in our analysis,
and
are used). The energy level should be within the lower and upper limits, as shown in
Figure 7. We assume that the cost of the battery is linearly proportional to the energy capacity of the battery. This assumption is reasonable, as an EV battery pack consists of multiple battery cells, and the capacity is determined by the number of cells contained in the battery pack. This approach to linear cost approximation is also widely used in the industry [
28].
4.1. Model for Stationary Wireless Charging
For the SWC, the charger can be installed only at the base station where the vehicles rest between services. Given that there is only one place that a vehicle can charge, the minimum energy logistics cost in Equation (
2) can be achieved by having the minimum battery size needed to complete a service. The amount of energy needed to complete a service (which is a decision variable) is denoted by
. The size of the battery for SWC is denoted by
. We define
k as the number of EVs in a given route and
as the battery cost per unit of energy capacity (cost/kWh) for the SWC system. Let
be the number of stationary wireless chargers in the base station and
be the unit cost per charger. Then, the objective function becomes
. Then, the optimization in Equation (
2) for the SWC EV
is specified as follows:
Note that once k and are given, this function monotonically increases with . Therefore, the minimum cost is achieved when .
4.2. Model for Quasi-Dynamic Wireless Charging
The QWC system charges the battery when the vehicle is stationary. In this analysis, the QWC-EVs are charged only at the bus stops and base station, where the vehicles make complete stops. Therefore, in the cost analysis of a QWC system, the primary issue is to identify where to install the wireless chargers at minimum cost. This problem is not as straightforward as in the SWC case, as the allocation of the chargers should be considered along with the amounts of energy consumption and depletion between the stations in a service. The optimization problem in Equation (
2) becomes a problem of identifying the minimum number of stations that need to have a charger for satisfying the operating condition. Note that this optimization problem includes the base station as a place to install a charger. As a vehicle is idle for some time at the base station, this station is the best candidate to install the charger. We assume that a vehicle rests long enough to fully charge the battery (
) at the base station. Using the base station as the reference point, any other point along the route is described by its travel distance
x from the base station. Let
L be the total distance of the route. Then, each bus begins its trip at
and completes it at
. As the route is a closed loop, the starting point (where
) and the end point (where
) both indicate the base station. Let
represent a station, where
. The sequence of the station index
i is such that
, where
is the distance of the
i-th station from the base station. Station
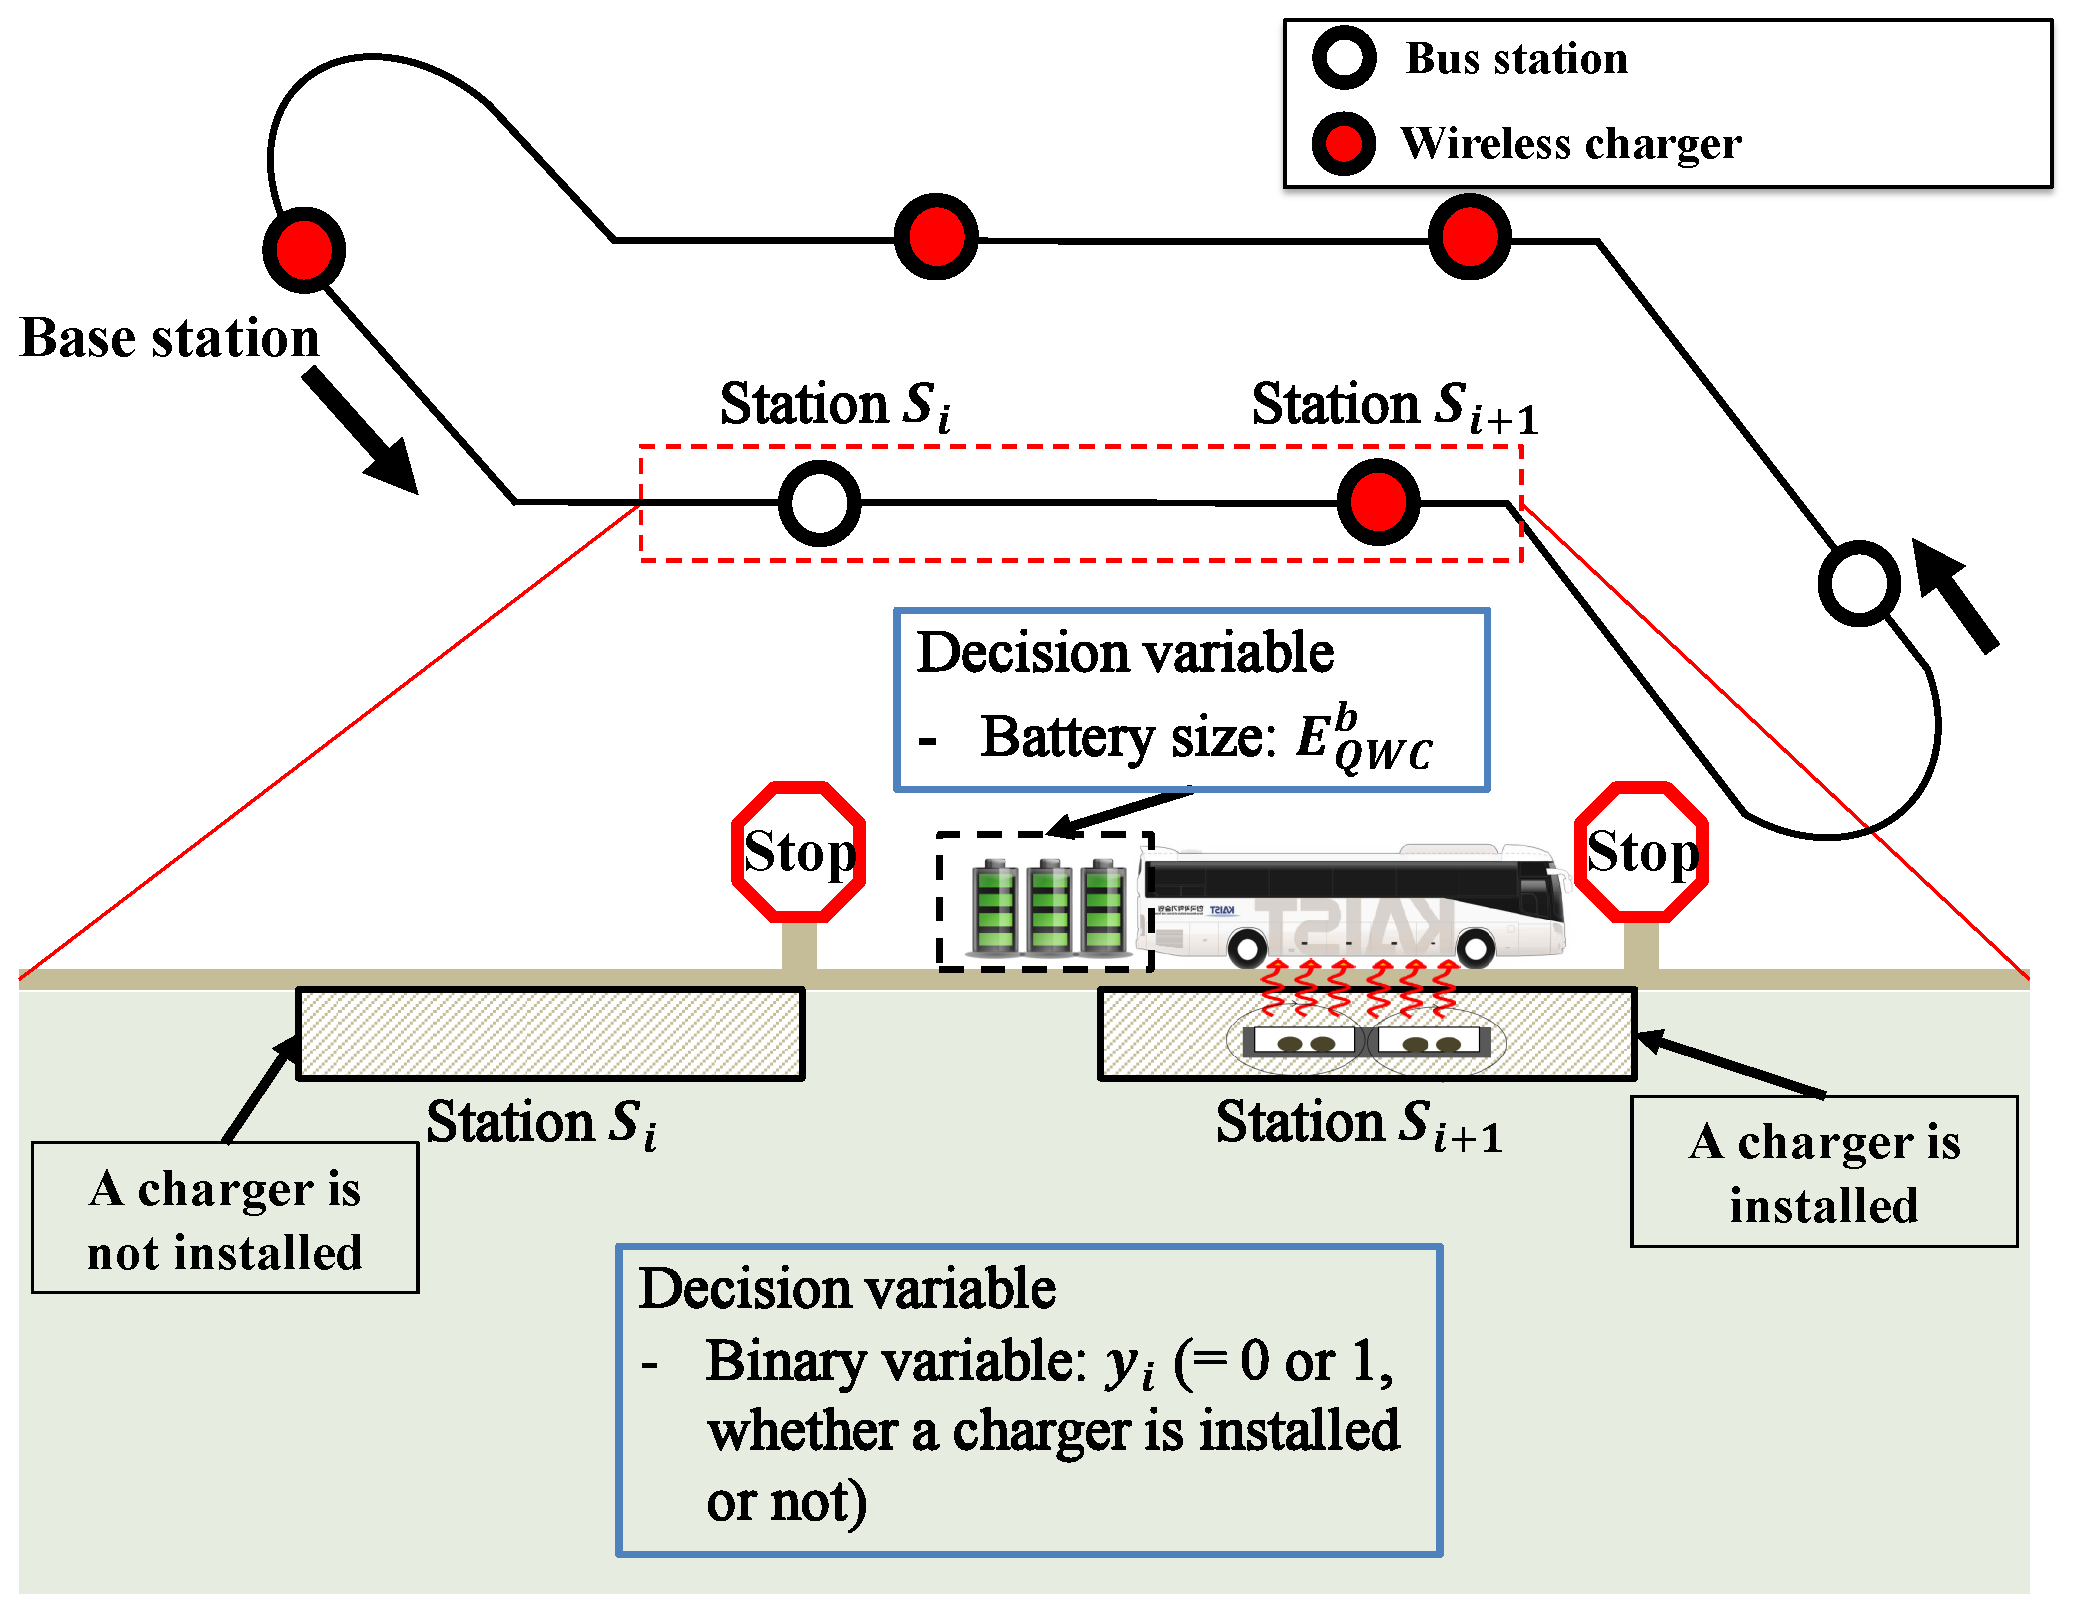
is the base station, which is the starting point of each trip. The bus covers this route and returns to the base station. Two types of decision variables are examined in this case. One type is
, which is defined as a binary decision variable that indicates whether a charger is installed at
. The other type is
, which is the battery size. These decision variables are described in
Figure 8. Let
be the energy level of the battery at the moment when the bus leaves station
. We define the amount of energy consumption from
to
as
. We define
as the amount of energy supplied at
, if a charger is installed at
. Then, the following energy balance equation can be constructed.
The energy level should be between
and
, such that:
Assume that there are
k EVs, and let
be the battery cost coefficient for QWC. Then, the energy storage cost is
. Suppose that
is the cost to install a charger at a bus station. Then, the optimization for QWC is constructed as:
Notice that
is defined in Equation (
3). Furthermore, note that the optimization problem involves a form of mixed-integer programming, and it can be solved with standard commercial software, such as IBM-CPLEX for small- and medium-sized systems, like those of the Gumi City and KAIST shuttle cases.
4.3. Model for Dynamic Wireless Charging
Notice that the cost optimization model presented for a DWC system is based on the previous study in [
29]. This subsection summarizes the model described in that study. For DWC, the cost analysis is more complicated than that for the first two types. As the charging can be done while the vehicle is in motion, we should consider both the vehicle speed and the road gradient when determining the allocation of chargers along the route. Due to the behavior of dynamic charging, the parameters should be described as functions of time. We let
t be the elapsed time that an EV has traveled from the base station, and let
be the amount of energy at
t. First we define
as the energy consumption from the battery at travel time
t. Over the course of a given route, the value
can be estimated by the analytical vehicle dynamics model, by a simulation of a vehicle dynamic method or by experiments on the actual vehicle [
1]. The detailed electromechanical configuration and power dynamics model of the EV are found in [
1,
30]. We define
as the energy supply at time
t, when the vehicle is on the power track installed along the road. In the DWC system, the vehicle will be in one of the following states:
In
, the energy in the battery is being depleted while the vehicle operates. Therefore, the battery’s energy level,
, decreases with a power demand of
. In
,
changes with a rate of
. Then, the rate of charge
for each state can be expressed as follows:
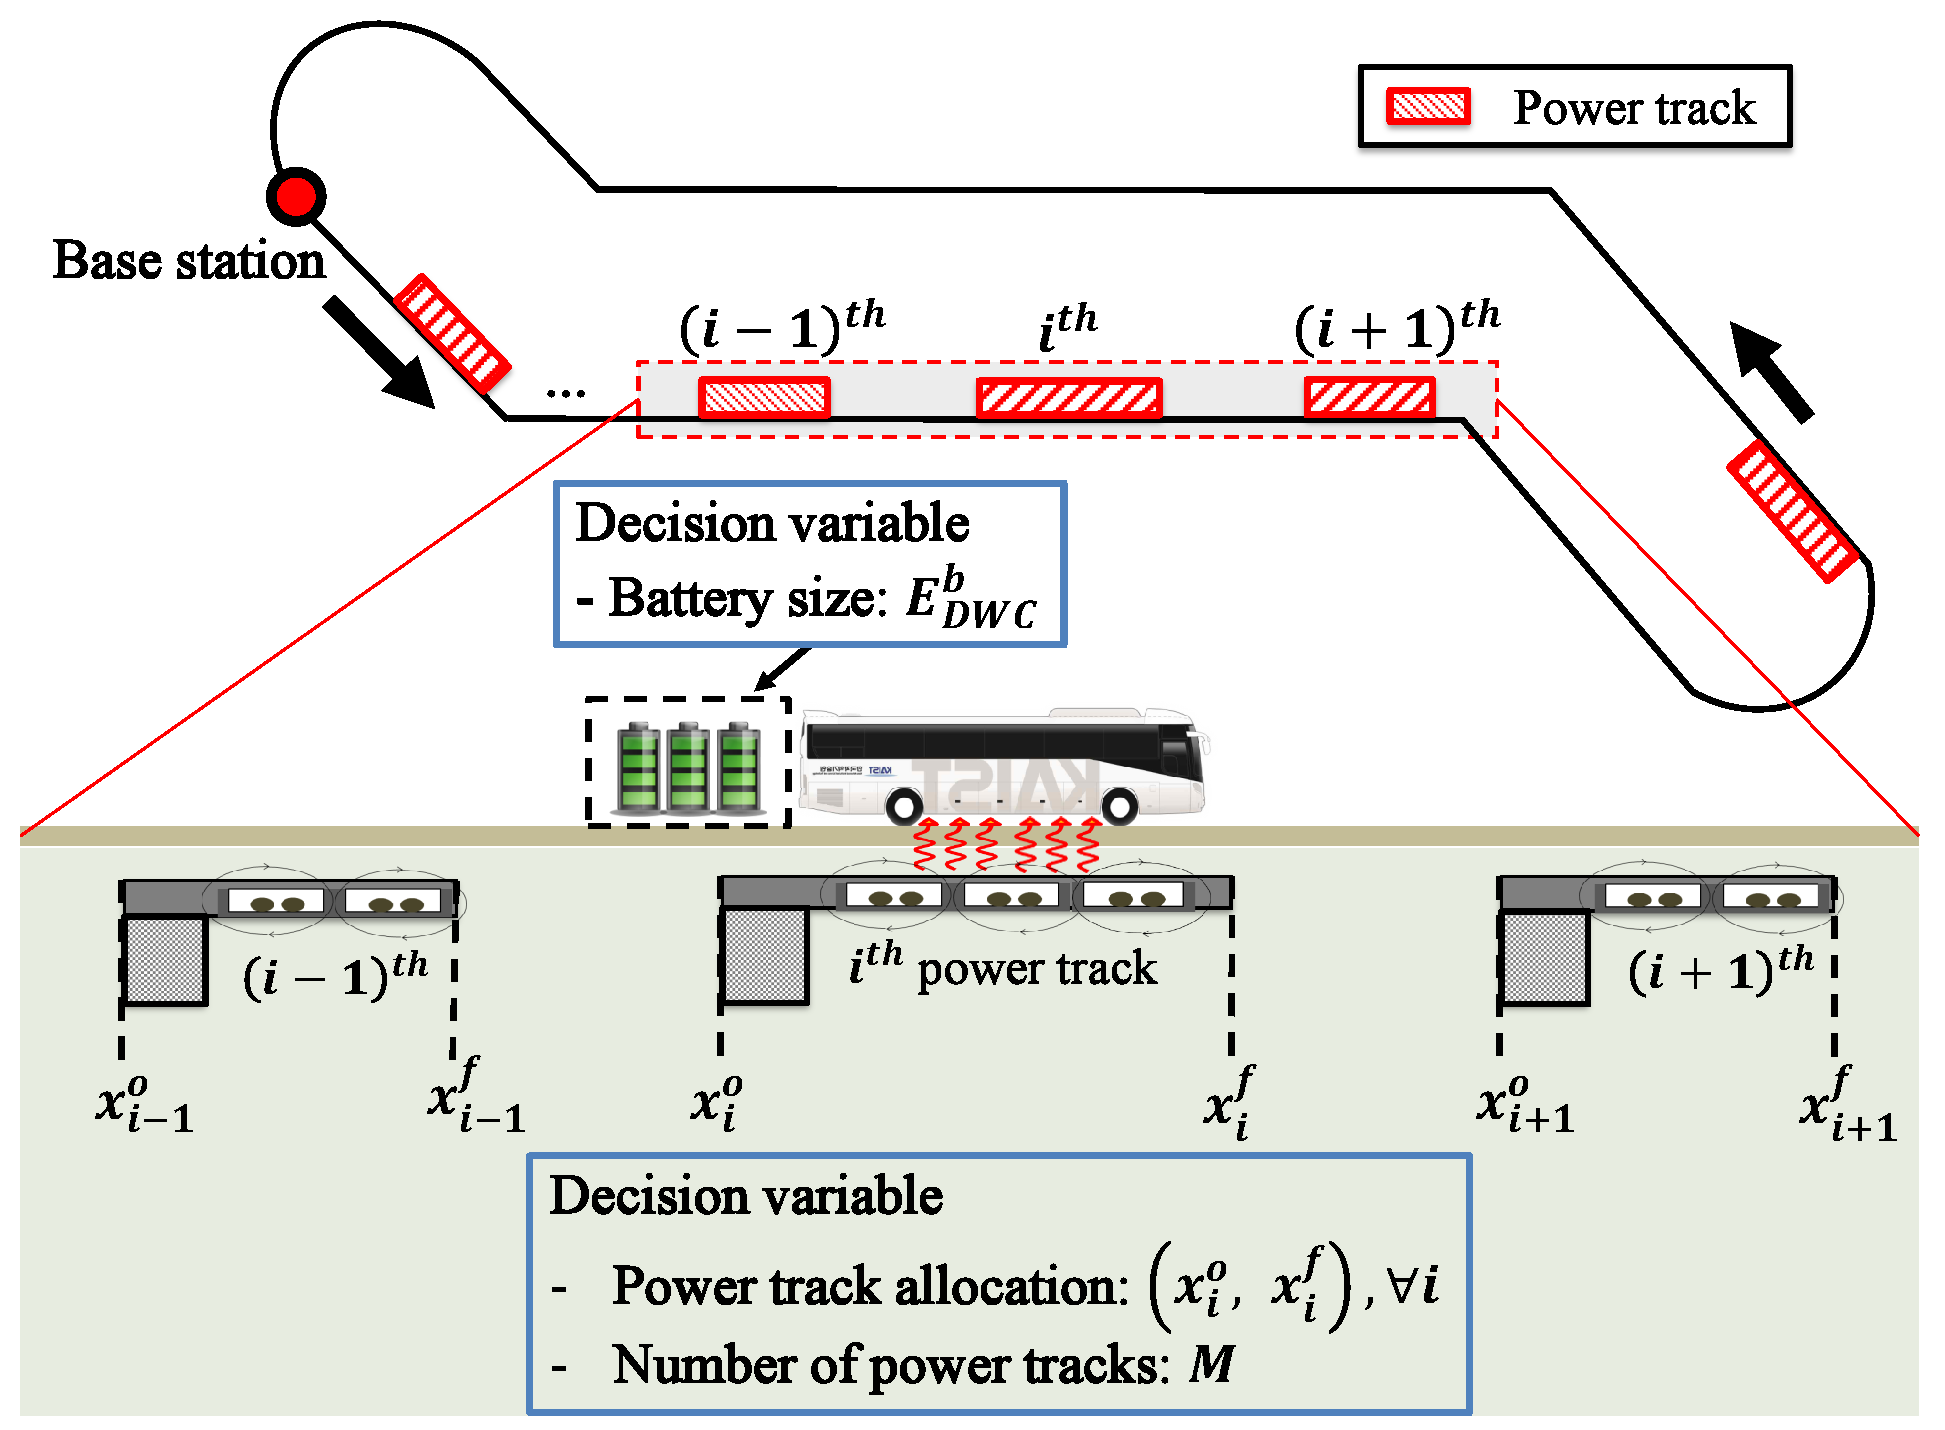
In a DWC system, the battery size and power track allocation are the two sets of decision variables. Again, each vehicle in the system has an identical battery size, which is denoted by
. We let the base station be the reference point, and any point can be expressed by the travel displacement
x away from the base station. Then, the location of the
i-th power track is represented as both its start point
and end point
. We denote the number of power tracks as
M, which is one of the decision variables. Then, all of the power tracks can be expressed by ordered pairs of the start and end points (
) for
. The decision variables for a DWC system are shown in
Figure 9. Note that the locations of power tracks are expressed by the distance variables with their start and end points. However, the amount of charging on each power track depends on the elapsed time spent on that power track. Therefore, the relationship among the displacement variable and the temporal variable has to be defined. We define a function
to represent the relation between the displacement variables and the temporal variables, such that:
We expect that the vehicle will follow the regulated speed trajectory while in service. If we know the travel time starting from the base station (reference point), then we can easily evaluate the travel distance at the elapsed time. As
is a monotonically-increasing function, an inverse function
is presented as follows:
With Equation (
14), the location of the
i-th power track, (
), can be restated as time variables, (
,
), which indicate the times at which the vehicle enters and leaves the
i-th power track. Note that the energy logistics cost for DWC includes the battery and power track installation costs. We break the power track cost into the variable and fixed costs. The variable cost is a function of the power track lengths. The fixed construction and materials costs can also vary, depending on the power track length. The length of each power track is calculated by the distance between its start and end points,
. Then, the total length of the power tracks is
. Regardless of the length of the power track, there is a fixed cost to install one unit of power track. This cost involves the installation of an inverter and other costs for connecting the inverter to the grid. We define this cost as the fixed cost. Suppose that there are
k vehicles in the system. Then, the energy logistics cost is presented as follows:
The optimization problem aims to minimize the energy logistics cost by finding the optimal decision variables
,
, … and
.
The relationships between
and
are described in Equation (
3). The constraints in Equations (17)–(19) represent the battery energy state constraints. The relations between displacement and the temporal variables are presented in Equation (20). The constraints for installing the power tracks are defined in Equations (21)–(22). The decision variables and their boundary conditions are defined in Equations (23)–(26). Note that the algorithm for this problem can be found in [
29]. One example result of the optimization problem is shown in
Figure 10 and
Table 3.
6. Discussion and Conclusions
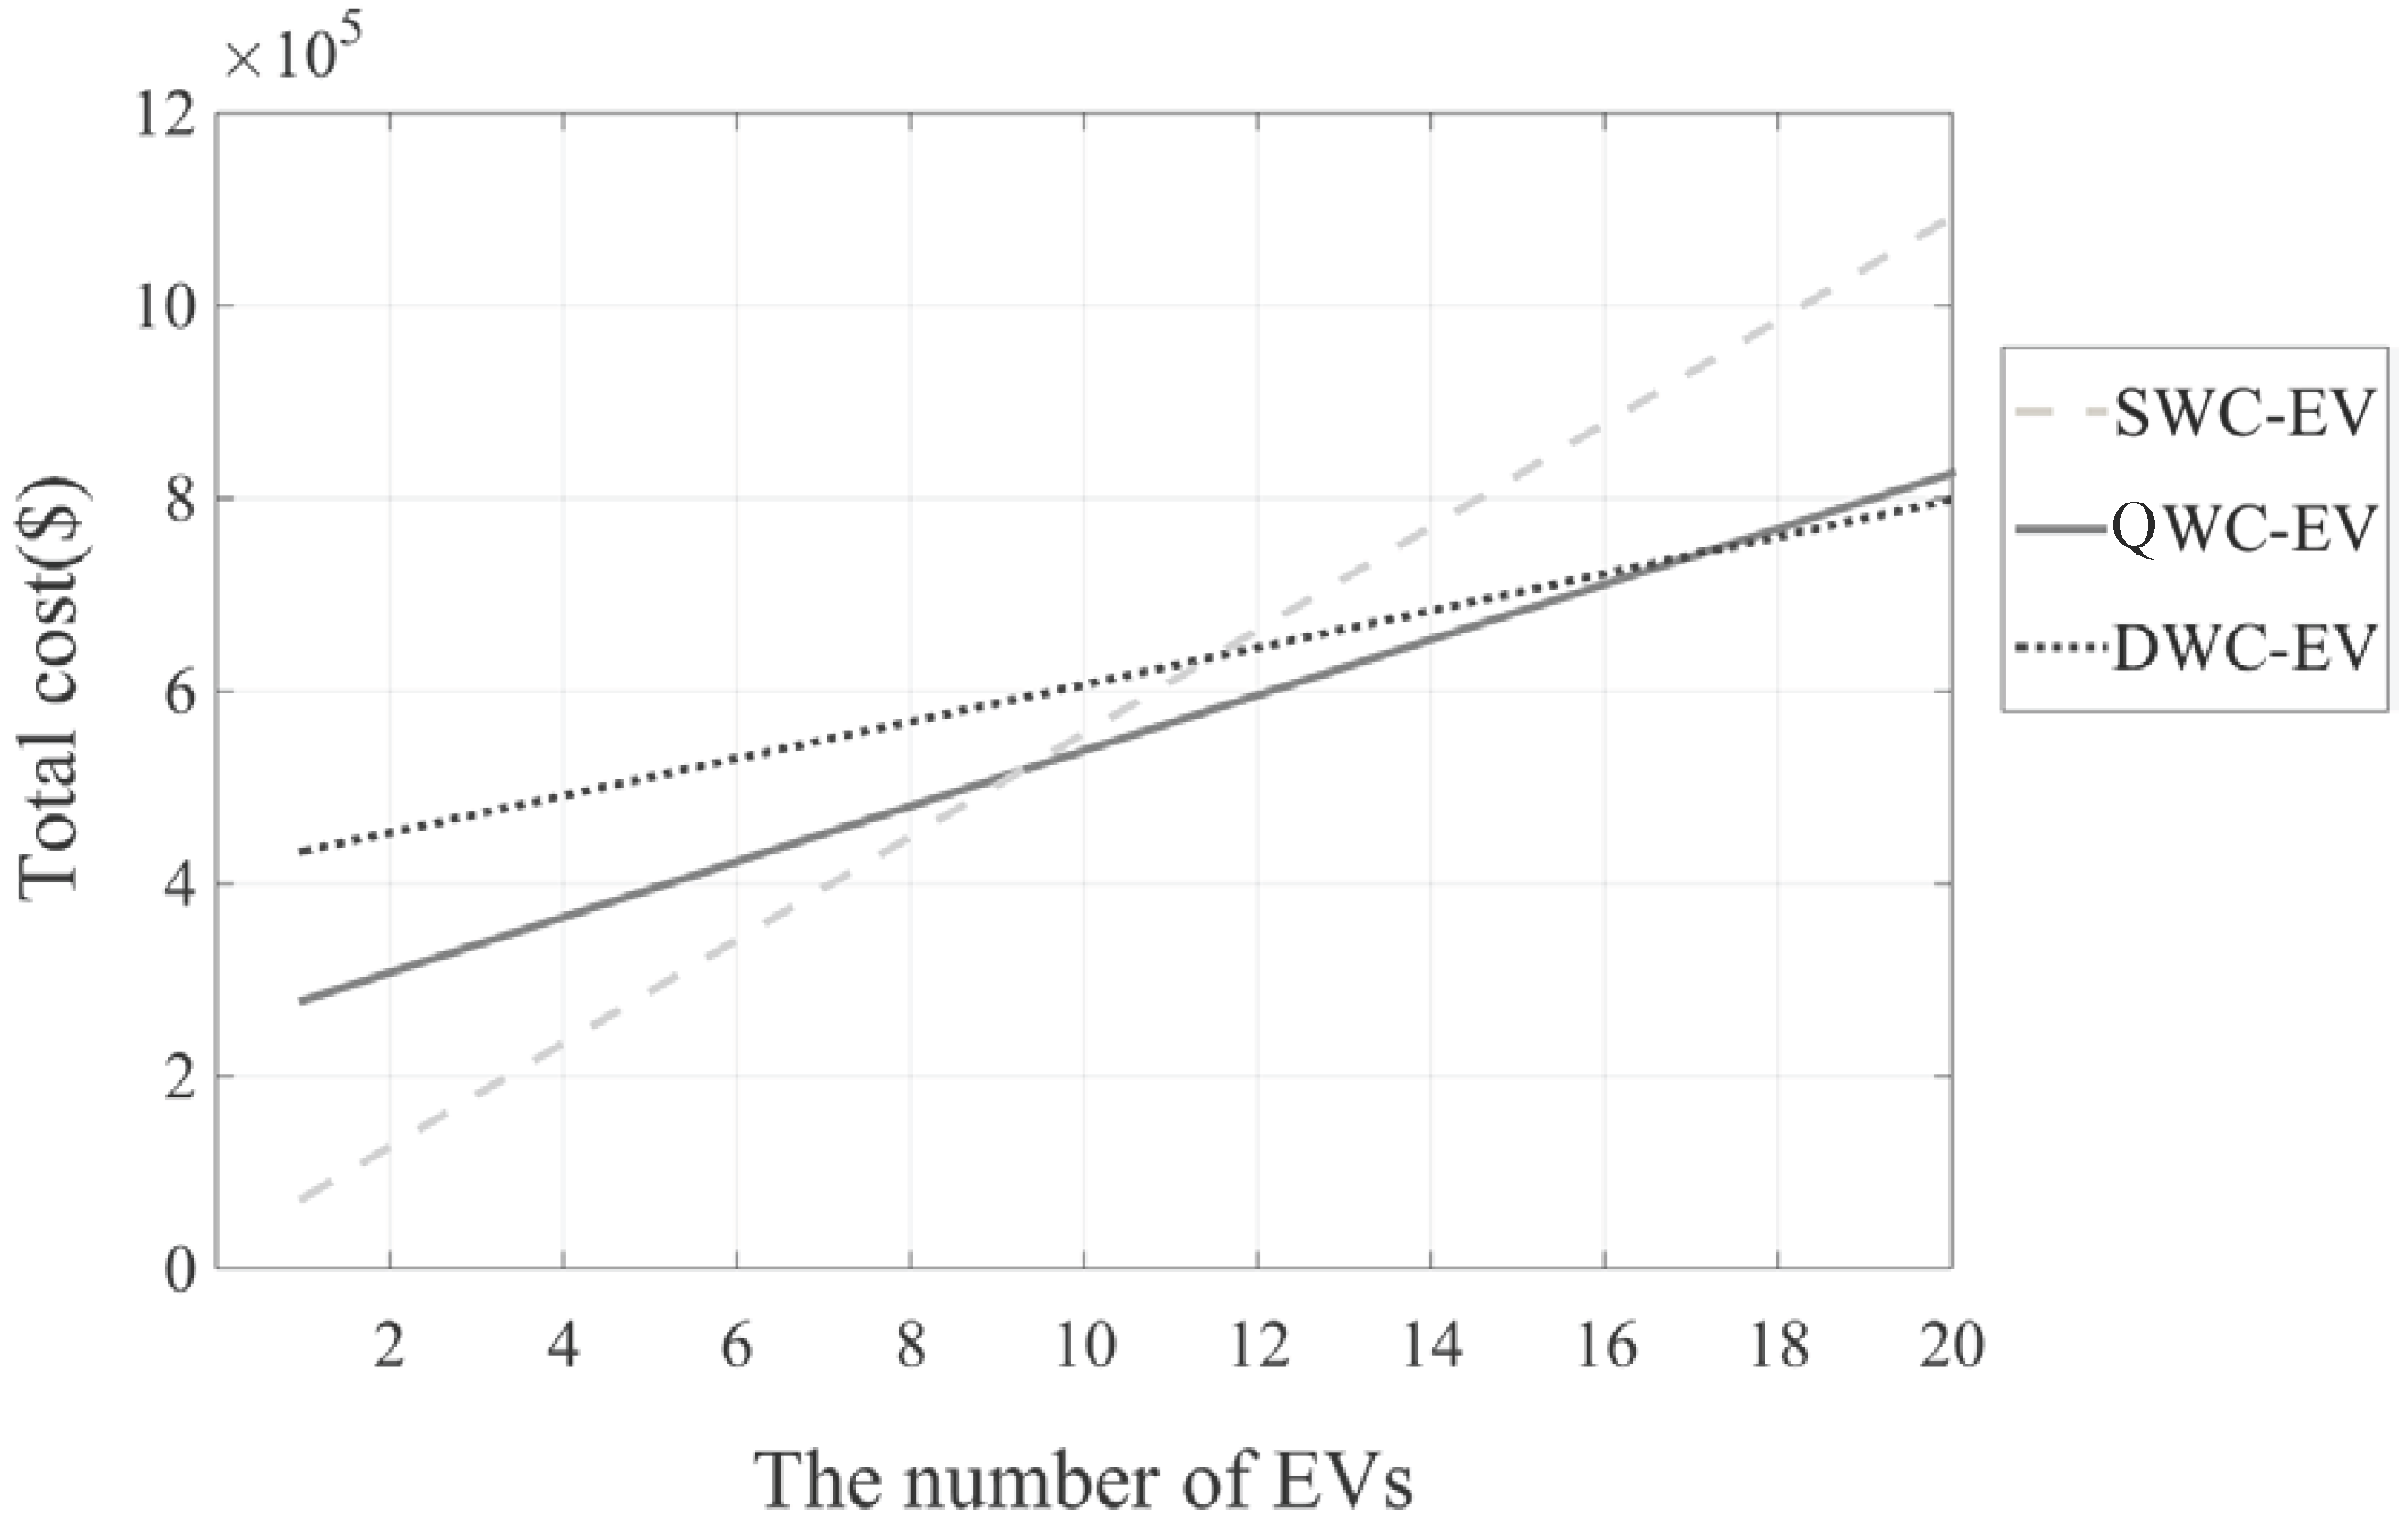
In this paper, we present an initial investment cost analysis of the wireless charging-based mass transportation system by comparing the costs of installing the SWC, QWC and DWC systems. To provide a creditable cost analysis for the emerging transportation system, our analysis is based on two commercialized wireless-charging public transportation systems—the KAIST shuttle and Gumi City OLEV routes. We try to use the actual cost figures from these two commercialized systems and to provide engineers and policy makers with realistic insights into the deployment and economic operations of these systems. For the initial investment analysis, we introduce optimization-based models for three types of EVs. These optimization models are developed to deal with the complex tradeoffs between the costs of battery size and of charging infrastructure. The total battery cost for a fleet of vehicles and the infrastructure cost for a route make up a significant portion of the total investment required for an EV-based transportation system. Therefore, analyzing this cost tradeoff is critical. Our optimization model estimates the minimum initial investment cost for each type of EV for a given service route. The numerical analysis, conducted with the proposed optimization models, quantitatively validates the qualitative cost-benefit analysis for each type of EV as proposed by an earlier study. In other words, we show in numeric terms that a DWC system is beneficial when the battery costs are high, but the costs of charging infrastructure are low. If the cost structure is the opposite, SWC is more beneficial. The cost-benefit outcome of a QWC system is somewhere between that of the DWC and SWC systems. We also show numerically that DWC is not economical for a short distance service, such as the KAIST shuttle system. This finding somewhat contradicts previous arguments by some DWC proponents, who claim that DWC is beneficial for short-range transportation systems. We speculate that these proponents have believed that short-range EVs do not require a significant investment for charging infrastructure. Given the fact that wireless charging infrastructure is more expensive than the conventional plug-in chargers, a short-range service that requires only a limited wireless charging infrastructure might be believed economical. However, these proponents underestimate the issue of battery cost. The benefit of DWC-type EVs is that they are able to operate with smaller batteries even for long-distance travel. This benefit cannot be utilized if the service distance is short. We also show that there is a minimum fleet size needed for DWC systems at current cost figures. For the Gumi City case, a DWC fleet needs at least 18 vehicles to be competitive against the SWC- or QWC-type EVs. We understand that the current cost figures for DWC are subject to change, as DWC is still in the early stages of commercialization. For example, most of the wireless charging components in the OLEV are custom made, as there is no standardization of the parts and components. We understand that there is an active discussion toward standardizing these parts and components. If such parts are made in a mass production process, DWC systems will become more competitive.
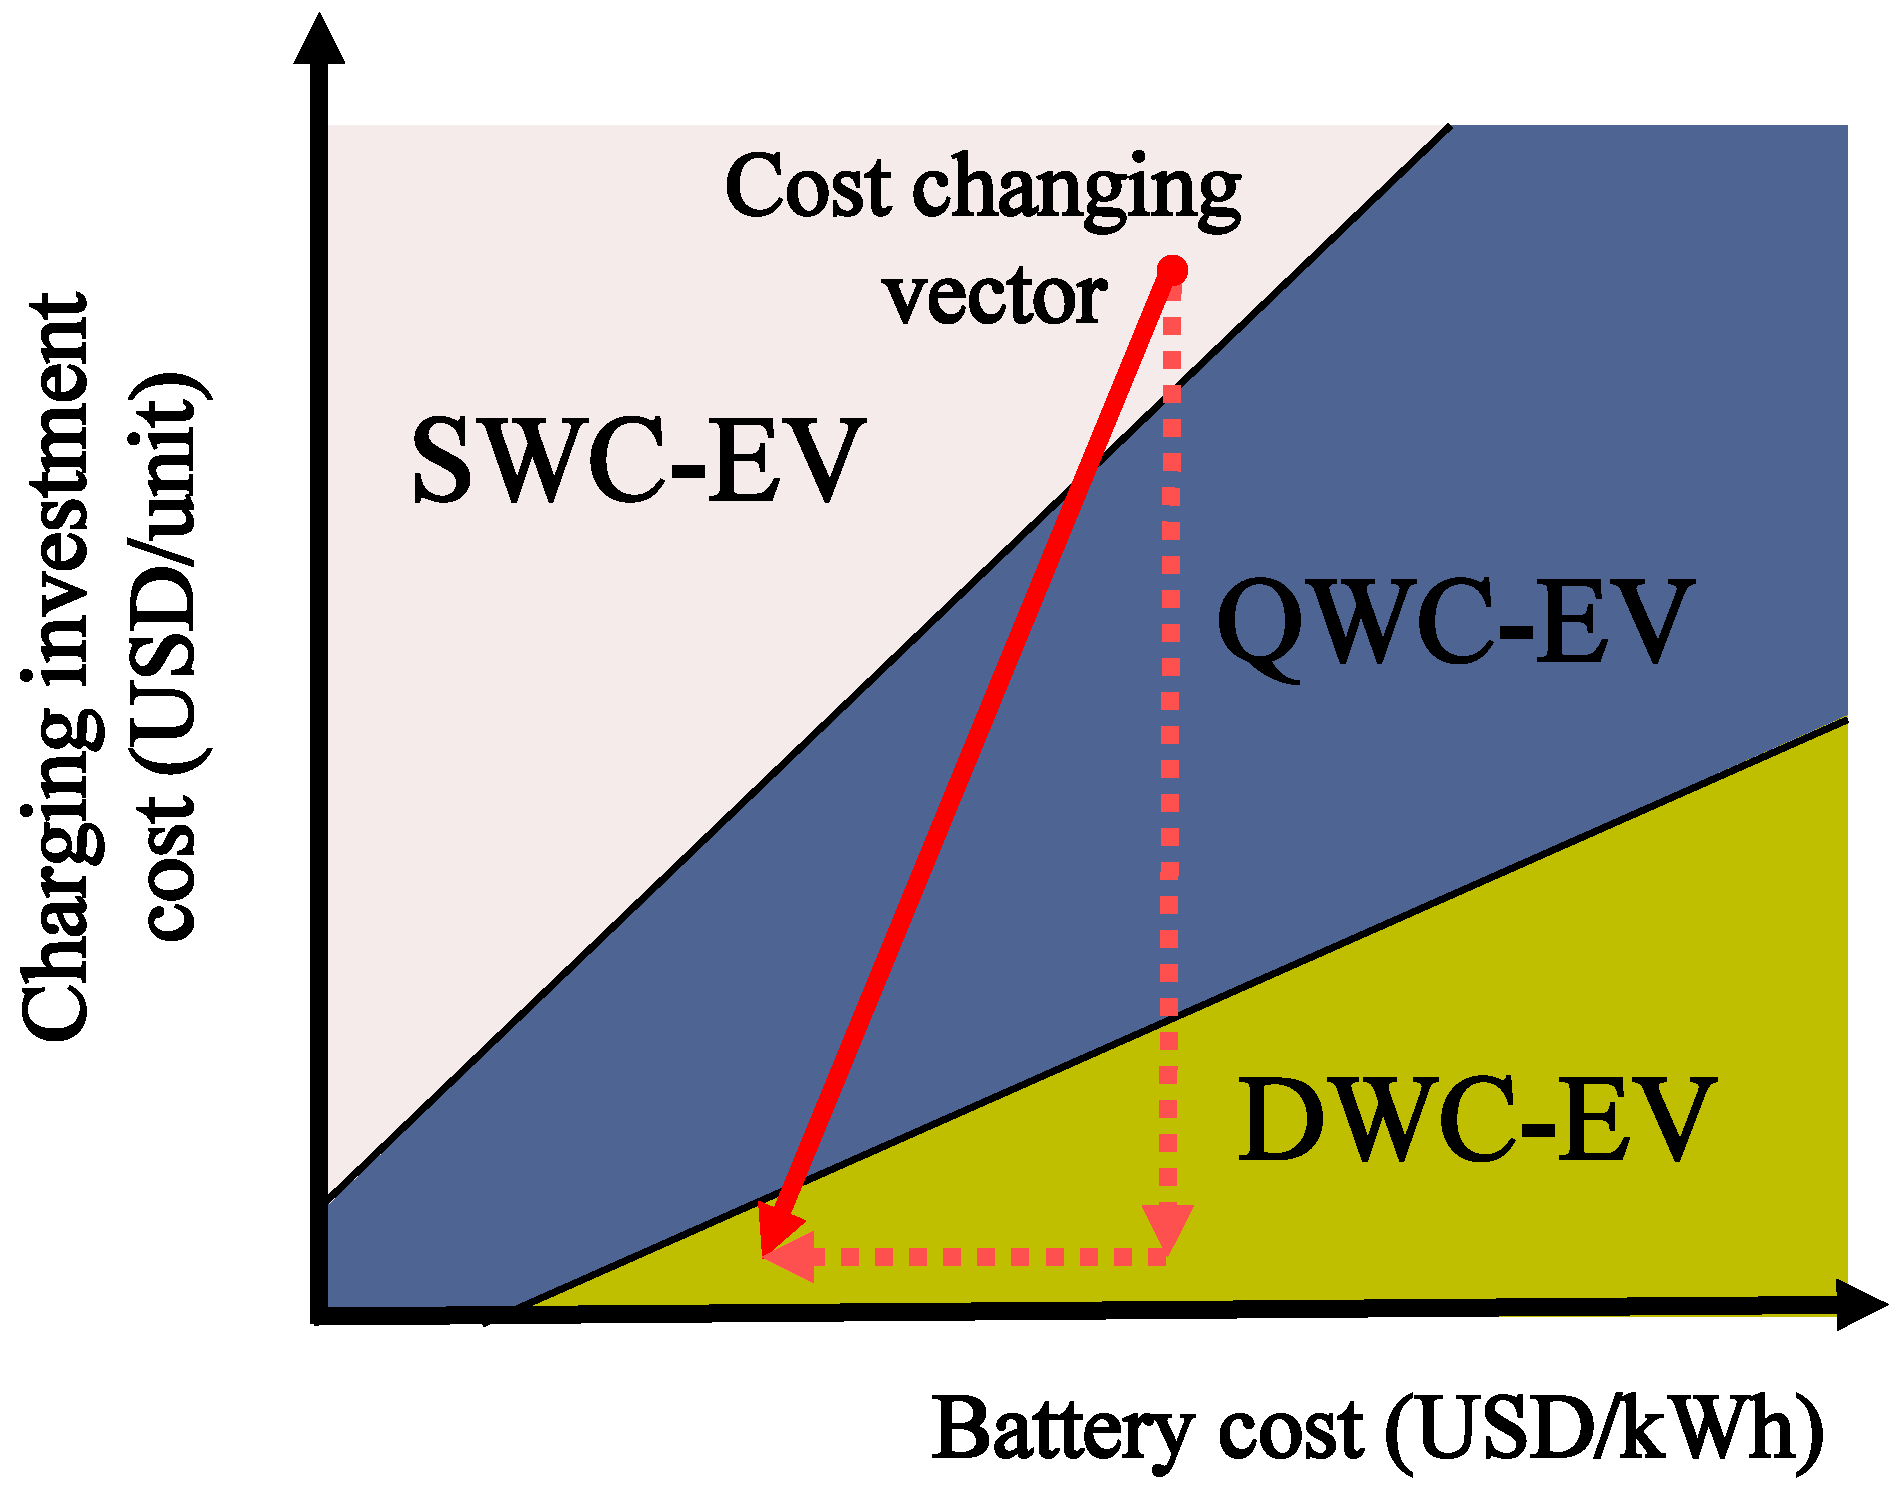
Figure 14 shows a qualitative analysis of the cost trend for the battery-infrastructure cost space based on the finding in the cost sensitivity analysis in the previous section. Note that DWC systems may not be competitive with the SWC or QWC types due to the currently high costs of infrastructure or may not be competitive unless the systems involve greater numbers of EVs. However, considering the past and current trends in technology development, we suggest the movements in cost as depicted in a vector of
Figure 14. The rate of the cost decline in batteries has been very sluggish for the last several decades. However, there is a significant opportunity for reducing the cost of the charging infrastructure. Note that as shown in the first panel of
Figure 1, the parts for the power tracks are now custom made, and the construction is all done manually. If the parts are mass-produced and if standardized construction methods are introduced, significant cost reductions are expected. As a result, the vector representing the expected cost trend in
Figure 14 shows that the costs of infrastructure are expected to decline faster than the costs of batteries. In this paper we provide only qualitative figures concerning the future cost vector. However, it would be interesting to investigate these trends quantitatively. We reserve this study for the future.
This paper introduces mathematical models to analyze the initial investment costs for different types of EVs, as categorized by their methods of charging. This is the first paper to present a cost-benefit analysis comparing the DWC, QWC and SWC systems. We emphasize that the method of analysis and approach, as well as the structure and logics of the modeling used in this paper are not limited to the KAIST OLEV system and can be used for any type of charging system. The costs, which are the input values for the analysis, are the only KAIST OELV-specific figures.
We understand that there is still plenty of room for improvement in our method and analysis. First, our analysis does not consider the number of SWC chargers needed as the number of EVs increases. Due to the queue waiting issue, more chargers should be added to support additional EVs. Conventional queuing theory can be applied to determine the appropriate number of chargers for an SWC system. Furthermore, the analysis assumes that the cost of installing a QWC charger at a bus stop is identical to the fixed cost of a DWC charger. This, however, is a very broad approximation, and further investigation is needed to ascertain more accurate costs for QWC systems.
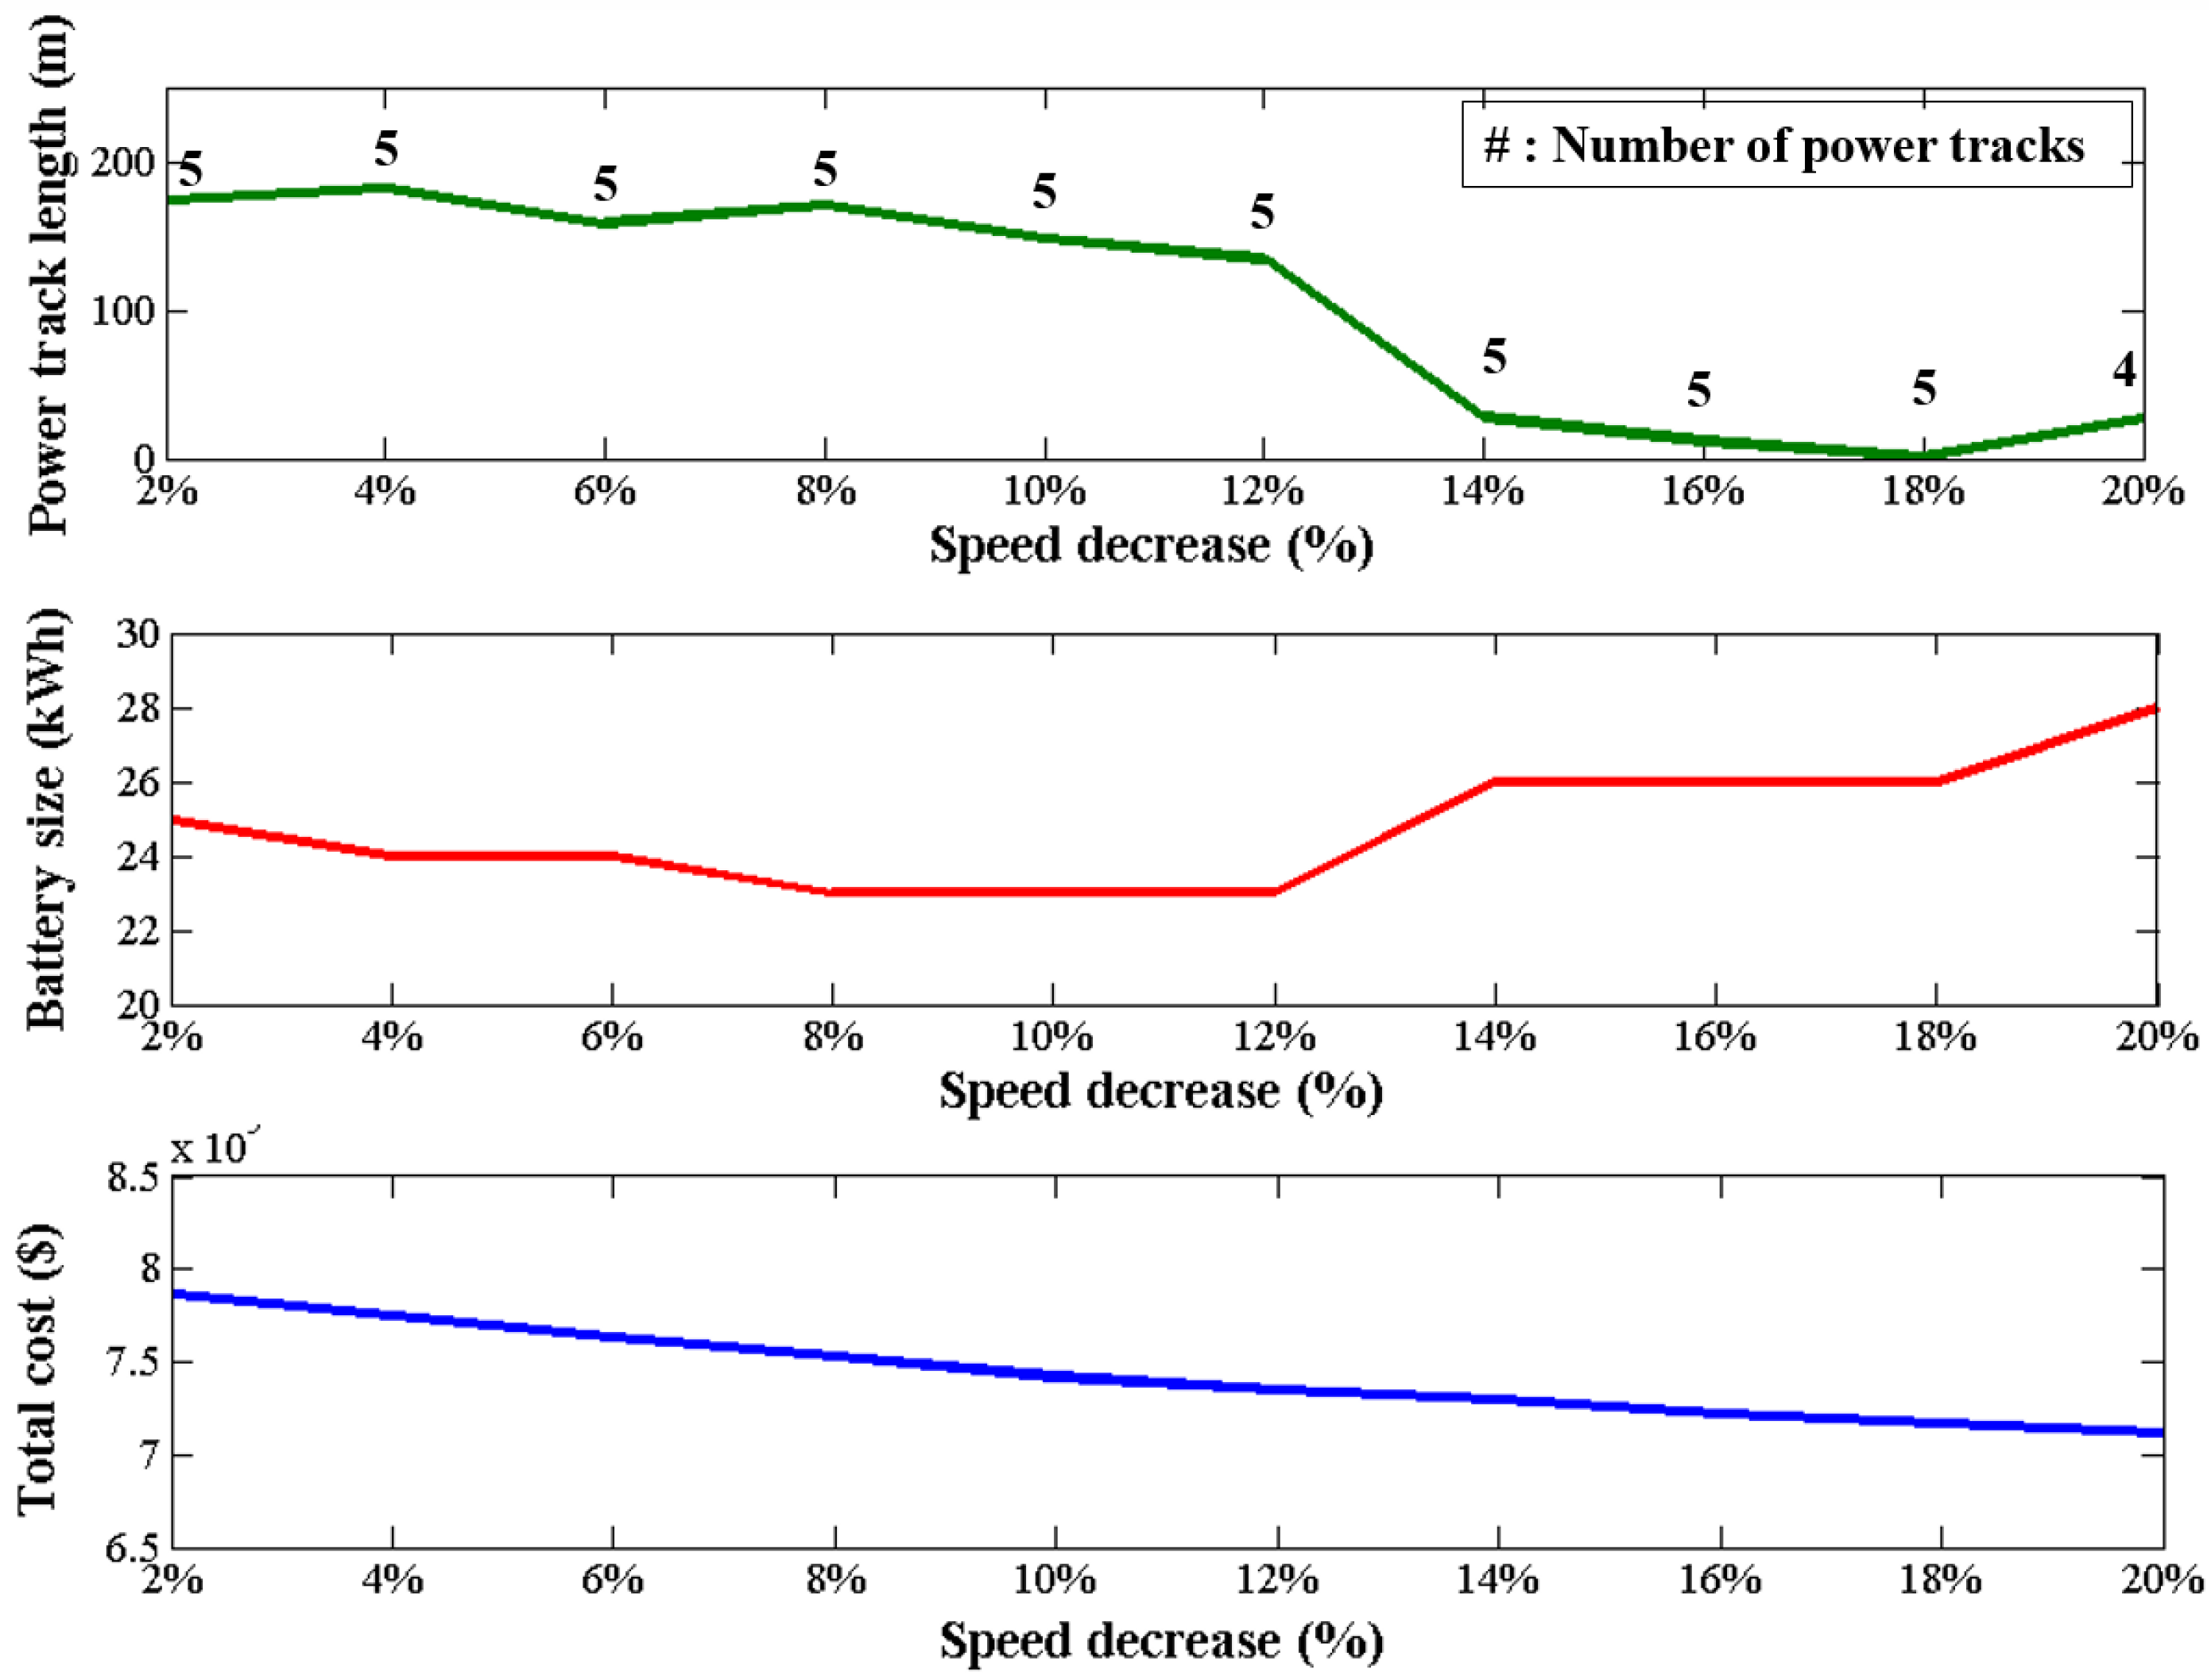
Another interesting analysis for future research is the investigation of the optimal speed profile for the DWC EV. Again, the amount of charging required directly depends on the speed of the vehicle on the charging infrastructure. We use the standard speed regulations in the analyses. Instead, it will be of interest to develop an economical speed profile for DWC. As preliminary research, we performed a sensitivity analysis of the velocity of the EV.
Figure 15 shows the total cost response as the speed of the vehicle is reduced for the case when there are 20 vehicles in Gumi City under current market conditions.
As the speed is reduced, the amount of charge per length is increased, and therefore, the total length of the power track is reduced, as shown in the first panel in
Figure 15. Interestingly, the battery size increases slightly, as shown in the second panel. Overall, the total cost gradually drops as indicated in the third panel in
Figure 15.
This analysis is intended to illustrate the idea that the total cost is sensitive to vehicle speed. With this idea, an optimal velocity profile can be developed. We reserve further investigation of this to a future study.
The level of the power supplied from the power tracks is also a critical factor in the allocation of the power track. That is, if the power level is higher, the overall power track length might be shorter. The proper power level requires extensive investigation, and we reserve this topic for future research.
There might be situations in which the battery level is lower than anticipated due to an unexpected traffic condition. One of the approaches for dealing with this type of uncertainty is to use stochastic optimization or robust optimization. However, these approaches are completely different from the optimization method proposed in this manuscript. Again, the approach provided in this paper has its own academic value, although the uncertainty is not exclusively addressed. This is the first paper to logically deal with the issue of the initial investment in different types of wireless charging EVs. As the first study in this area, the proposed deterministic optimization approach provides guidance and direction for more complicated research in the future.
Finally, in calculating the costs of DWC systems, we assume that the variable cost for one meter of power track is 1/100 of the fixed cost, which is based on the market data. However, this cost assumption could easily change if the construction operations and the manufacturing of parts are undertaken more systematically and on larger scales. A sensitivity analysis on this cost ratio might be another topic for future research. In this paper, we focus on initial cost analysis. With extensions of this method, further conventional economic analyses can be performed, such as calculations of return-on-investment, cost-benefit, cost-of-ownership and environmental impact analyses across various types of wireless charging systems. We also propose these topics for future research.


