Review

Electrical Market Management Considering Power System Constraints in Smart Distribution Grids

1
Department of Computer Science, State University of New York (SUNY) Korea, 119 Songdo, Moonhwa-ro, Yeonsu-Gu, Incheon 406-840, Korea
2
Department of Computer Science, Stony Brook University, New York, NY 11794, USA
*
Authors to whom correspondence should be addressed.
Energies 2016, 9(6), 405; https://doi.org/10.3390/en9060405
Submission received: 30 March 2016 / Revised: 9 May 2016 / Accepted: 9 May 2016 / Published: 25 May 2016
(This article belongs to the Special Issue Decentralized Management of Energy Streams in Smart Grids)

Abstract

:
Rising demand, climate change, growing fuel costs, outdated power system infrastructures, and new power generation technologies have made renewable distribution generators very attractive in recent years. Because of the increasing penetration level of renewable energy sources in addition to the growth of new electrical demand sectors, such as electrical vehicles, the power system may face serious problems and challenges in the near future. A revolutionary new power grid system, called smart grid, has been developed as a solution to these problems. The smart grid, equipped with modern communication and computation infrastructures, can coordinate different parts of the power system to enhance energy efficiency, reliability, and quality, while decreasing the energy cost. Since conventional distribution networks lack smart infrastructures, much research has been recently done in the distribution part of the smart grid, called smart distribution grid (SDG). This paper surveys contemporary literature in SDG from the perspective of the electricity market in addition to power system considerations. For this purpose, this paper reviews current demand side management methods, supply side management methods, and electrical vehicle charging and discharging techniques in SDG and also discusses their drawbacks. We also present future research directions to tackle new and existing challenges in the SDG.

1. Introduction

The base existing electrical system in most countries was developed when energy production was relatively cheap. As a result, conventional power systems usually have large centrally dispatched power plants, long transmission lines, and unidirectional distributed systems with extra capacity to improve reliability [1]. Although the conventional power system structures had many problems such as the large amount of technical and nontechnical losses (10% up to 52% [2]) and environmental pollution (40% of CO2 coming from power generation [3]), it has been used in the same way for the last century.
Recently, the rapid technology advancement has been changing people’s lifestyle and accordingly, the electricity demand, resulting in about a 2% increase in the electrical energy consumption per year, a trend that is predicted will continue [4]. This rising demand, climate change, growing fuel costs, outdated power system infrastructures, and new power generation technologies have motivated changes in the power system architecture [5]. The most important factor is the large number of distributed generations (DGs) being installed on the distribution network. The amount of renewable energy resources (RERs) installed globally as of 2012 reached 15% [6]. This large amount of DGs can help to decrease power loss and price of energy, and increase the reliability of power. On the other hand, the technical issues, such as stability constraints, limit the penetration of RERs in the power system [7].
In order to overcome this limitation, the microgrid (MG) concept was developed. A MG is defined as a cluster of small generation systems, storage devices, and associated combined heat and power (CHP) loads [8] able to operate in both grid connected and autonomous (islanding) modes to increase power quality and reliability [9]. Controlling, maintaining the stability, especially in the autonomous mode, and implementing demand and resource side management of MGs without communication systems is a very complicated and low efficiency process [10]. As a solution, the smart distribution grid (SDG) concept was proposed.
The smart grid (SG) can be defined as an electrical system that uses two-way, cyber-secure communication methods and computational intelligence across an integrated electricity generation, transmission, substations, distribution and consumption to achieve a system that is clean, safe, secure, reliable, resilient, efficient, and sustainable. This description covers the entire spectrum of the electricity energy system from generation to consumption [11]. The concept of SGs in large-scale generators or transmission line is not a new idea and has been evolving and improving for a long time because the components have been under the control of utility companies [12]. Large-scale generators [13] or transmission lines [14,15] use two-way communication and intelligent computational systems; however, as there are not always smart connections between them and distribution networks (loads), the conventional network could not solve the aforementioned challenges.
Since the electrical distribution systems are spread over wide geographical areas with numerous clients including electrical power consumers, DGs, and different kind of energy storage systems (ESSs), implementation of SDG is much more complicated than for other parts of SGs. Integrating many DGs into the SDG, on the one hand, can increase the power generation flexibility, but on the other hand, also can makes the power flow control and maintenance of stability much more complicated [16].
SDG still is in early stages of development and based on the authors’ best knowledge, there is no large commercial implementation of a complete SDG to date. Nonetheless, some research centers have designed and installed small size SDGs. For example, the Illinois Institute of Technology (IIT), after facing many power quality problems and outages between 2002 and 2006, decided to change their power system topology. Finally in 2010, by installing two Allison gas-fired turbines, they changed the power system of their campus to a simple SDG. A multi-agent control system gave this SG the ability of real-time reconfiguration and power supply optimization [17]. Santa Clara University (SCU) has been developing its SDG since 2011 by installing smart sub-meters in buildings and energy sources, such as solar, fuel cells, and micro-turbines, in its campus electrical network [18]. West Virginia University (WVU) developed a SDG in a small city called Etown based on six integrated inter-related aspects of community life and economic enterprise: Energy, Environment, Ecology, Electronics, Experimentation, and Education. Researchers in WVU can perform tests in a controlled environment of Etown before integrating it into a larger network [19]. These SDGs are used as power supply systems for real consumers; therefore, they have some limitations for testing new methods. Because of these limitations, some research centers have preferred to build SDG testbeds.
As an example of such a SDG testbed, the Consortium for Electric Reliability Technology Solutions (CERTS) formulated CERTS MG in 1998, primarily operated by American Electric Power, as a test facility in Columbus, Ohio [20]. The CERTS MG, which includes a 1 MW fuel cell, 1.2 MW of solar photovoltaic panels, two 1.2 MW diesel generators, a 2 MWh to 4 MWh storage system, a fast static switch, and a power factor correcting capacitor bank, is used for the development of a SG control architecture [21]. With the same idea, researchers at the University of Texas at Arlington (UTA), have installed a 1 MW experimental MG test bed that can be operated either in AC or DC mode and can be connected to or disconnected from the grid. This grid can be used to validate simulated models and permits one to explore conditions such as faults and instabilities that would not be intentionally imposed on an operational MG [22,23]. European research centers are also actively conducting research on SGs. The total investment in SG projects in Europe was about 3.15 billion EUR until 2014 and between them 578 projects have implementation sites. However, most of them do not have a SDG with complete components such as smart metering, smart demand management, and smart source management [24].
Pacific Northwest Smart Grid (PNSG) is a large and commercial SG project that began in 2010 and has about 60,000 customers across five US states: Idaho, Montana, Oregon, Washington, and Wyoming. This project is designed to help to validate new SG technologies, quantifying SG costs and benefits, and advancing standards for interoperability and cyber security approaches of SG. In addition to Bonneville Power Administration and eleven utilities, University of Washington and Washington State University are involved in this 178 million USD project [25]. Table 1 summarizes the major global SG implementations.
Since there is still a long way to go to practically implement SG in distribution systems, much research has been conducted to establish the theoretical requirements of such an implementation. Surveys on many different aspects of SG research have been done in [12,16,27,28,29,30,31,32,33]. Cardense et. al. in [12] comprehensively surveyed papers related to SDG in the ISI Web of Science up to 2012, categorized them in different classifications, and investigated the popularity of each class. In [27] the authors reviewed the standardization roadmaps of SG around the world and proposed some recommendations for future work in this area. Fang et al. in [16] reviewed the SG literature up to 2011 using three different categories: the smart infrastructure system, the smart management system, and the smart protection system. The authors of [28] and [29] provided comprehensive surveys on demand response in power systems up to 2008 and 2011, respectively. Su et al. in [30] reviewed electrical vehicles (EVs) in SGs and discussed different kinds of EVs, the standards of chargers, battery technologies, and general issues of energy management system with EVs. As communication plays a principle role in SGs, a large amount of researches has been done in this area. Gungor and Lambert [31] explained different communication networks used in the power system to help researchers better understand the hybrid network architecture in the power system. Akyol et al. [32] prepared a survey report for U.S. Department of Energy and analyzed how, where, and what types of wireless communications are suitable to enhance the security and reliability of the nation’s energy infrastructure. Wang et al. [33] provided a good survey on communication architectures in the power system. They also discussed the network implementation issues such as delay, reliability, and security in the power system settings.
However, none of these surveys pays enough attention to the inter-workings of power systems and their limitations. Converting the conventional power system into a smart one changes the penetration level of DGs, the load curve, and the electricity price. As a result, the power flow, power loss, critical route, stability, protection, and reliability also change. Therefore, our survey focuses on the electrical market considering the power system constraints in the SDG. We complement the existing surveys by:
(1)
Providing a comprehensive review of the state of the art literature on SDG.
(2)
Categorizing papers from the perspective of the electrical market, considering power system constraints.
(3)
Discussing challenges and proposing future research directions in SDG.
The rest of this paper is organized as follows: Section 2 describes the demand side management (DSM): definition, different types, and drawbacks. The supply side management (SSM) in the presence of RERs is reviewed in Section 3. EVs and the effects of high penetration level of EVs in power system are discussed in Section 4. Finally, Section 5 concludes this survey.

2. Demand Side Management

The idea of demand side management (DSM) and demand response (DR) are not new. DSM and DR methods emerged in electrical systems in the 1970s and have evolved over the past four decades [34]. However, because of the lack of proper electrical network infrastructures, they did not fully prosper and many customers still see only flat, average-cost based electricity rates which give them no indication that electricity values change over time [35]. In this section, first, DR and DSM are defined and their benefits are reviewed. Then, the load modeling requirements for DR, classifications of DR models, and a review of recently published papers in this area are presented. Finally, the future research directions are proposed.

2.1. Definition and Benefits
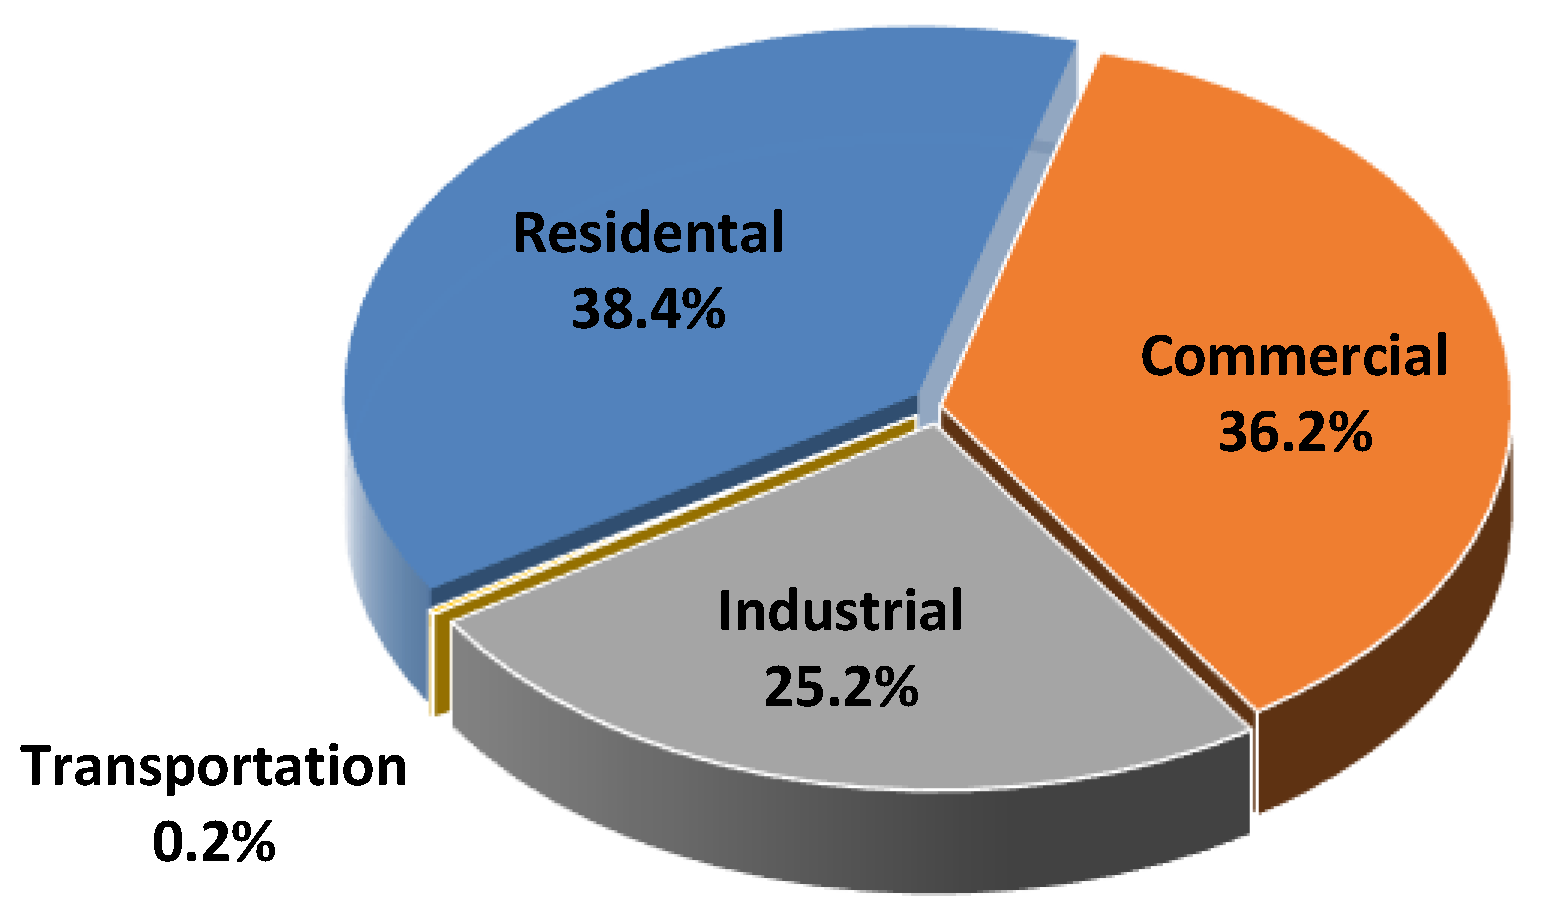
The U.S. Department of Energy defined DR as “changes in electric usage by end-use customers from their normal consumption patterns in response to changes in the price of electricity over time, or to incentive payments designed to induce lower electricity use at times of high wholesale market prices or when system reliability is jeopardized” [35]. Under this definition, the DSM includes all activities which aim to alter the consumer’s demand profile, in time and/or shape, to match the supply profile [34].
Implementing DSM leads to economic and technical benefits for utilities and customers, including both participants and none participants. Participating customers in DSM programs change their consumption pattern to decrease their electricity bill. If the number of participants is large enough, the peak load of power system can be shaved and the electricity price of peak load can be reduced. In this situation, non-participating customers pay less for their consumption as well [28]. In addition, lowering peak load quenches the power system thirst for new infrastructures and decreases power system investment cost. Furthermore, DSM can help improve the system reliability, stability, and power losses [36]. The most important drawback of DSM is its deployment cost. The participants need to be equipped with new electrical meters, control and monitoring systems, generation units, and communication systems. To analyze the feasibility of DSM, [37] proposes a market model with a new independent company called DR provider (DRP) to participate in long-term power market by providing price-based DR resources. The proposed long-term market model formulates DSM investments and its profit as a constrained dynamic multi-period optimization problem and solves it with a genetic algorithm. By using this method, utilities can understand how much they should invest in DSM to maximize their profit.

2.2. Load Modeling

In order to manage customer demand, knowing the exact load behavior is necessary. Much research has been done to understand and model the load. A Markovian model of home electricity for distribution grid studies is proposed in [38]. This study validates the proposed model with measurements of electricity load of 20 homes over four months and categorizes different loads based on the house size, type of heating system, and the time of day, without considering the number of occupants or house appliance details. This kind of load modeling can be used to predict the consumption of a distribution network to plan for DSM, but cannot be used to study the DR of each customer. Since DSM changes or shifts the consumption of some appliances over time, the appropriate load model should use the electrical consumption of each home appliance, such as TVs, vacuum cleaners, and so on, as its basic building block. Richardson et al. [39] monitored 1693 houses in Belgium for around three years and proposed “wet” appliances (washing machines, tumble dryers, and dishwashers) as shiftable loads using a clustering algorithm. This research shows that Belgium has the potential of reducing 96 MW of peak demand in its residential sector (from 2.3 GW) by shifting the wet appliances. Richardson et al. [40] presented a detailed model of domestic lighting based on modeling the operation of individual bulbs and using a time-series representation for the number of active occupants within a dwelling. This model, which was developed as a part of the CERTS project, can provide one-minute resolution lighting electricity demand profiles for individual dwellings. They further developed a model of a dwelling with different appliances [41]. They used a comprehensive time-use survey of how people spend their time in the UK to model the probability of dwelling residents’ behavior. This model considers the energy profile of different home appliances, the maximum number of home residents, temperature of the day, etc. to stochastically model a house load for DR study. This load model, which is implemented in Microsoft Excel, can be downloaded from [42].

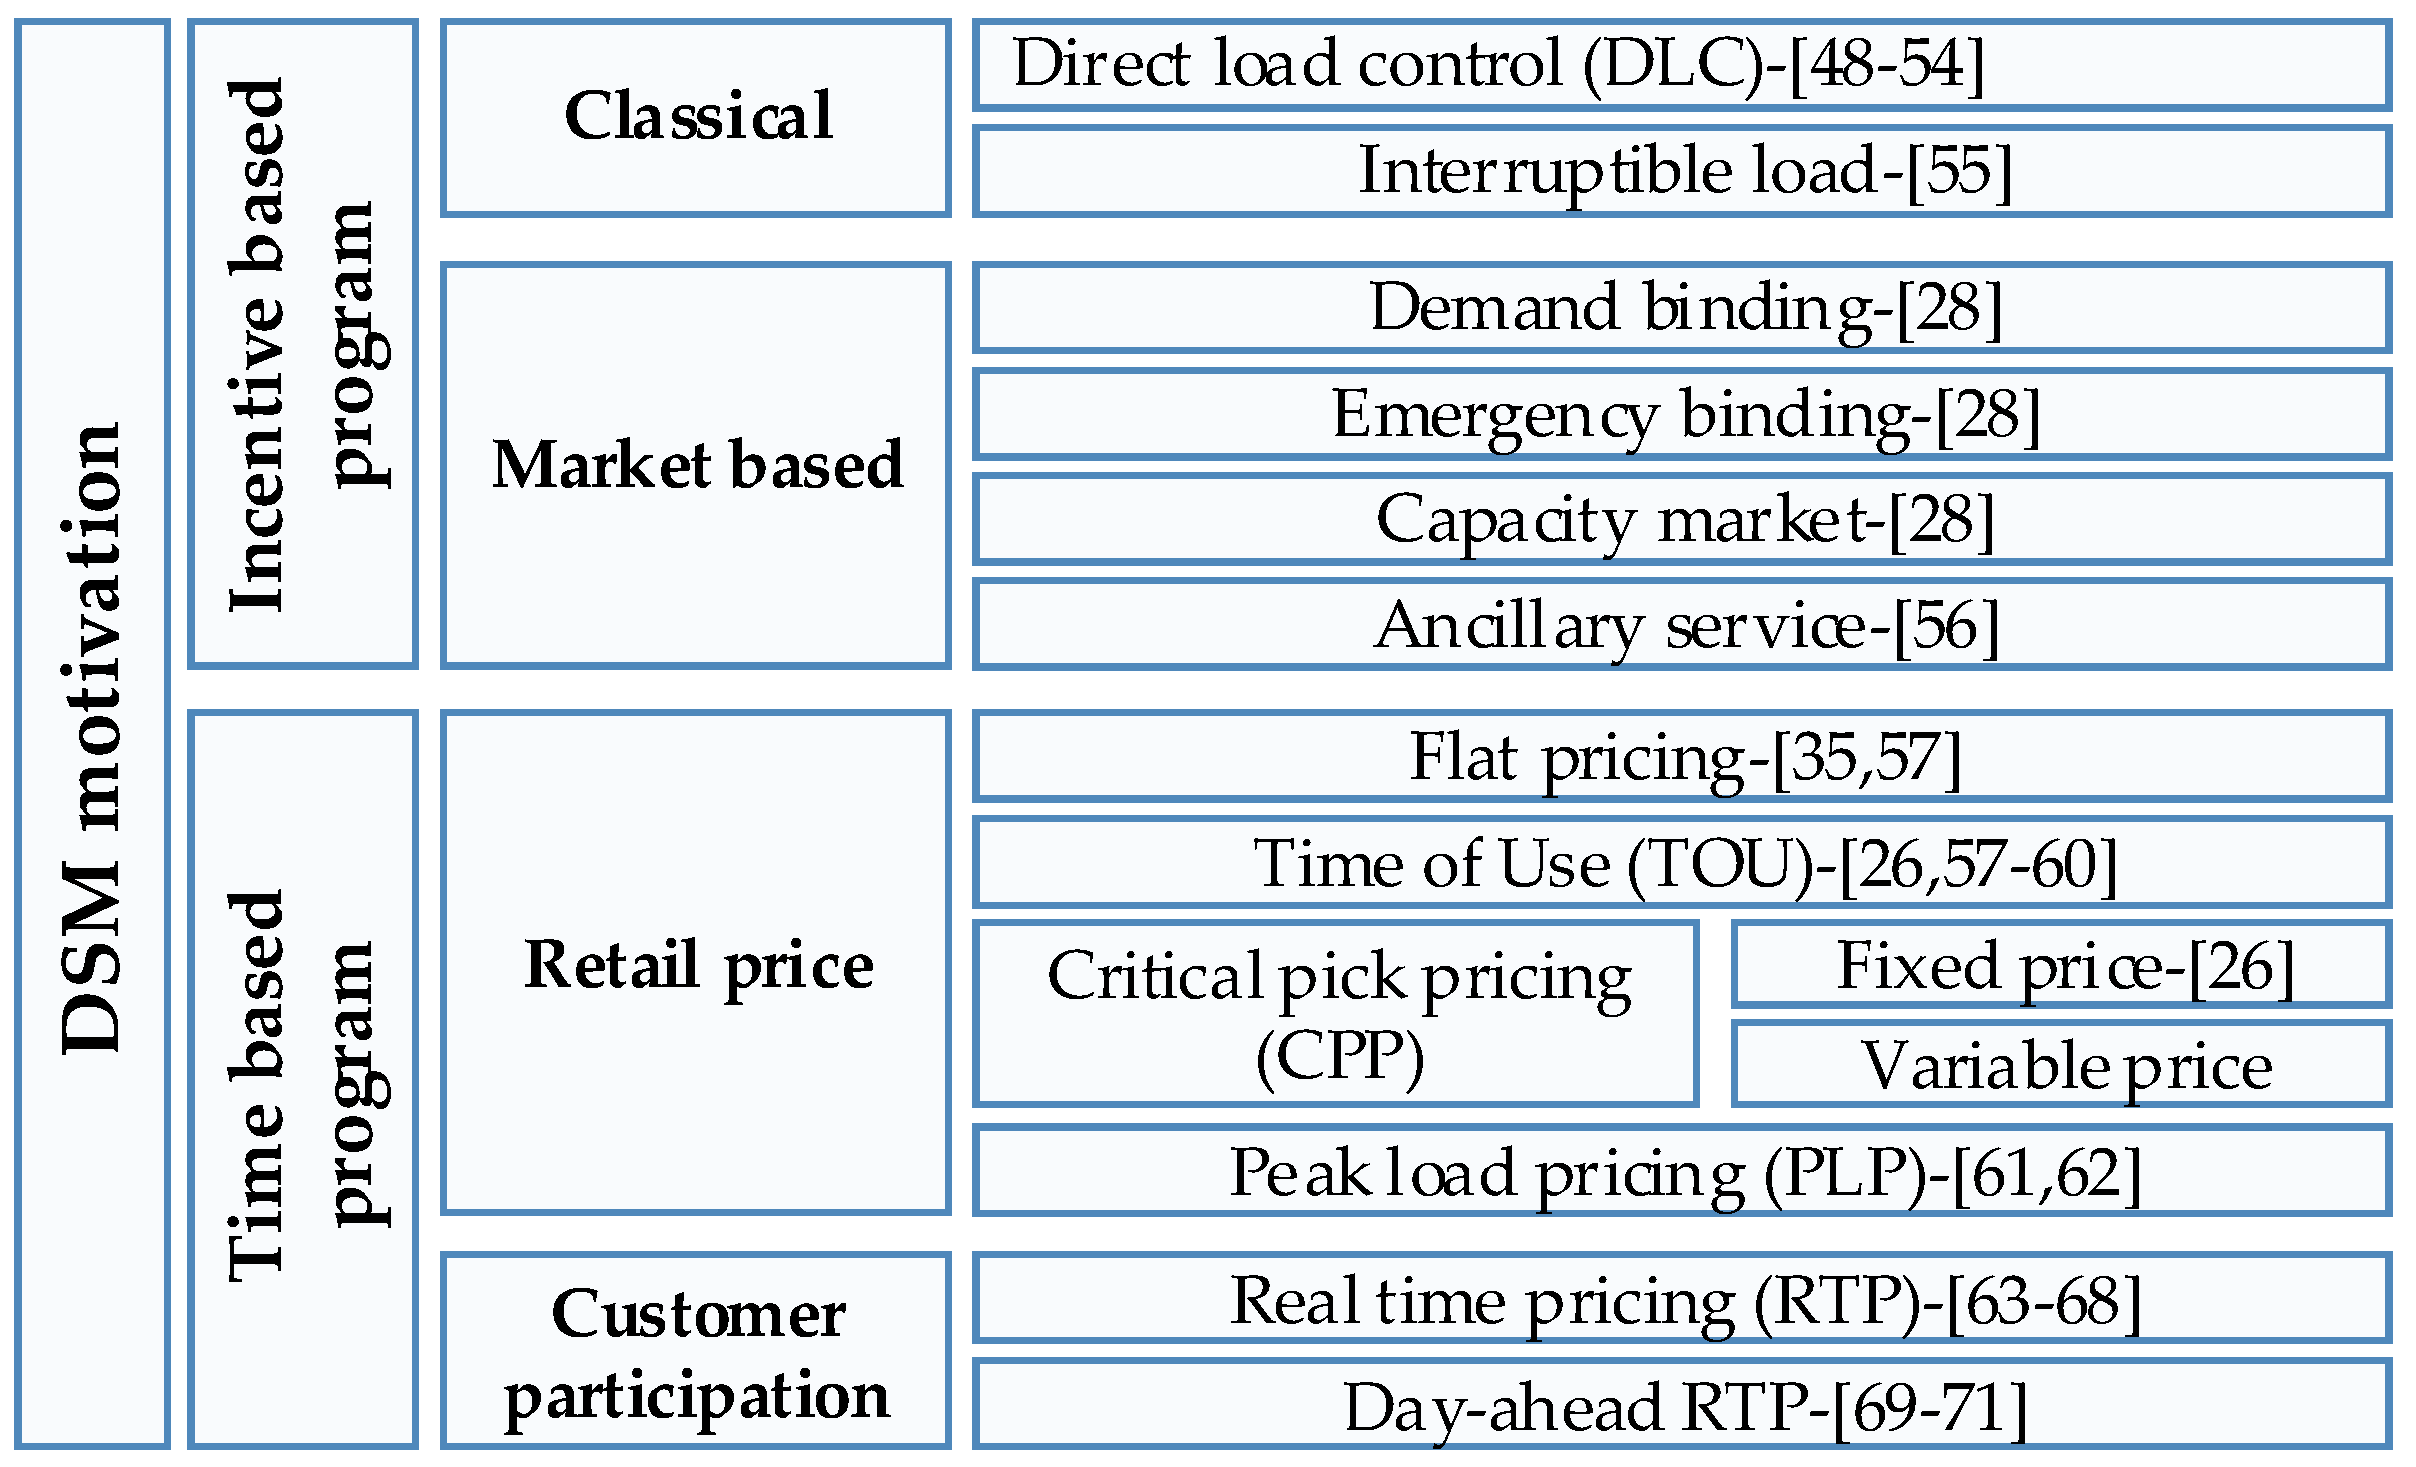
2.3. Classification of DSM Models

The authors of [29] surveyed different papers in this area up to 2013 and categorized them based on control mechanism, method of motivation offered, and decision variables. Among them, the motivation method has a major influence on DSM success in SG. This subsection updates the motivation-based categories reported in [29] by surveying recent papers in this area.
Figure 1 shows the percentage of each customer type in electricity consumption during 2015 in the USA [43]. Each sector has special characteristics and responds differently to motivation methods. Although the industrial sector uses less electrical energy than the residential and commercial sectors, each industrial customer is a high energy consumer, with typical peak loads of tens to hundreds of MWs, and has a significant impact on the power system [44]. In addition, as most large industry consumers have supervisory control and data acquisition (SCADA) systems, the implementation of DSM in industry is much simpler than in traditional power systems. There are many works in this area, for instance, [45] assesses the potential of DSM in the meat industry. The customers in the commercial sector consume a large portion of the electricity and typically have a similar energy consumption pattern. The main source of power consumption of this sector is from heating, ventilation and air conditioning, lighting systems, and electronic equipment. Therefore, the implementation of DSM in this sector is easier than that of the residential sector. In [46] the authors propose several common methods to decrease the electricity load and DSM of commercial buildings and [47] provides a method for validating the DSM for commercial buildings.
The implementation of DSM in the residential sector is much more complicated than in other sectors because it has a large number of customers and numerous different factor affecting their loads. The DSM motivation methods can be categorized into two main programs: incentive based, which is usually more appropriate for the industrial sector, and time based, which is more useful for the residential sector. Figure 2 depicts the different DSM schemes based on motivation method.

2.3.1. Incentive-Based Programs

Incentive-based programs offer fixed or time-varying payments to customers who reduce their electricity usage during periods of system need or stress [72]. Incentive-based programs can be divided into classical methods and market-based methods. In classical methods, consumers receive incentives in the form of bill credits or discount rates. On the other hand, in market-based methods, customers are rewarded depending on their contribution.
One of the classical methods is direct load control (DLC) where the power utility can remotely turn off some customers' electrical equipment [48]. This method needs a real-time communication system and can reduce the power consumption during critical times. In [49], loads of customers are divided into scheduling loads and vital loads. Utilities can directly control scheduling loads to reduce the peak demand but they cannot control vital loads. Although this method can severely decrease human comfort, some companies still use this type of program. For example, Idaho Power Company pays incentive credits to residential customers who allow their air conditioners to be switched on less frequently during the afternoon in June, July, and August [50]. The authors of [73] developed a general model for a domestic electrical heater and a method to identify the model’s parameters based on measuring the power consumption of the heater with or without the water temperature. This paper proposes a DLC method based on the proposed model, which negligibly decreases comfort levels. Another classical method is an interruptible load method, where customers receive an upfront incentive payment to reduce their load to a predefined value but pay a penalty if they do not respond [28]. This method is widely used in the industrial sector, where power consumption is reduced during specific periods with one hour in advance alerts [55].
In market-based programs, a customer bids on a specific load reduction in the electricity market and it is accepted if it is less than the market price. When the bid is accepted, the customer must curtail his/her load by the amount specified in the bid or otherwise receives penalties. In a demand binding program, consumers bid on the wholesale market. In the emergency binding program, utilities permit customers to reduce more than the bid and pay additional incentives proportional to the amount of load reduction during an emergency. In a capacity market program, customers participate in a day-ahead (DA) market and reduce their power when a system contingency arises. Lastly, the ancillary service program allows customers to participate in spot markets and provide their power reduction as a reserve [28]. O’Brien et al. in [56] designed a fair compensation mechanism for DSM participants based on game theory. They assume that there are some aggregators in the electrical market to manage the DSM program, such as selling spinning reserve in the wholesale market, and use a Shapley value based on reinforcement learning algorithm estimation to fairly distribute the DSM profit between the participants. In all of these methods, in order to determine the amount of reduction, the baseline load threshold must be calculated for each customer, which is a complicated procedure. In addition, it is possible for some customers to receive rebates for the reduction of their power loads for other reasons that are coincident with the system emergency [74].

2.3.2. Time-Based Programs

In this category, the price of consumption is varied based on the time of usage. In general, a time-based (pricing-based) DSM encourages self-interested customers to make the required decisions by giving monetary incentives instead of other incentive methods [75]. In other words, this method informs customers about the varying cost of generation at different times and makes them participate in the program to reduce the overall cost. The time-based programs can be divided into two subcategories: retail price-based programs where the customers do not participate in the determination of price and customer participation programs where the price is varied based on a customer’s behavior [29].
One of the retail price-based programs is the flat pricing program where the energy price is fixed as in the common traditional programs, although utilities can still change the energy price for different seasons. In this program, reducing the energy usage is the only way to decrease the total energy bill. This method does not need any modern system and therefore it is still used in some areas [35]. In order to have consumers participate in DSM, the time of use (TOU) program applies different prices for different periods of the day or different days of the week. For example, CSGC offers a TOC program, which charges customers 4 cents per KWh during the off-peak period and 6 cents during the peak period of the non-summer season, and 17 cents for the peak period in summer. In this program, 82% of a year is off-peak period [26]. TOU usually does not help reduce the overall energy consumption, but rather mostly helps to shift the peak amount to off-peak periods. The implementation of TOU does not need communication infrastructure and only requires meters that can record the time of energy usage. The authors of [58] investigated the response of New Zealand household demand to TOU and estimated the short-run elasticity of consumers. The experimental performance of different TOU programs and the customers’ behavior in response to an in-home display are reviewed in [59].
In contingency situations, the cost of production increases considerably and TOU program cannot help to reduce customers’ demand. In order to solve this problem, the critical peak pricing (CPP) method uses the idea of TOU and also changes the peak price in contingency situations. The participants usually receive a notification of the new energy price one day in advance. This method, which selects one price for critical periods or alters it in different events, can be divided into two subcategories: fixed price and variable price. For example, CSGC offers a fixed price CPP with an off-peak price similar to the proposed TOU program (4 cents per kWh for 82% of year) and decreases the peak price to 5 cents and 12 cents per KWh in non-summer and summer season in normal periods, respectively. However, it charges a high price of 33 cents and 51 cents per kWh for non-summer and summer, respectively, during 1% of the year (peak energy events). Customers are notified of these peak energy events one day-ahead and can plan for them [26]. CPP implementation requires an unidirectional communication link to inform about the peak events. In peak load pricing (PLP), one day is divided into multiple periods having different prices determined based on the power consumption of previous periods [61]. In [62], one day is divided into 5-minute periods and the price of each period is determined based on the difference between the real and the desired value of electricity demand in previous periods. This method can adjust the consumption into the desired value in some time intervals.
The retail price model has a critical drawback. Since the price of each time period is independent from customers’ behavior and each customer decides individually, it is possible that all customers may decide to simultaneously use power during the same off-peak period and, consequently, a new “rebound” peak may occur [76,77]. In order to mitigate this problem, the customer participation methods real-time pricing (RTP) and day-ahead RTP (DA-RTP) are proposed. In RTP, retailers determine the price of the next time period (e.g. 15 min) based on the power requested by customers. Implementation of this method requires two-way real-time communication and a complicated computational process for determining the optimum price [29]. Here, the accurate prediction of electricity price is necessary for scheduling. A real-time forecasting of electricity price in SG is developed in [78] using genetic optimal regression and relevance vector machines.
In order to alleviate these problems, DA-RTP determines the price of different periods of the next day based on the day-ahead requests of customers [69]. Further, the authors in [79] use the DA-RTP and try to shift the demand curve to match the desired curve. The authors suggest that the desired curve can be a curve with the minimum energy cost for customers; however, they do not propose anything about how to find this curve. The disadvantage of DA-RTP is that customers must plan for their next day electrical loads. Planning for the next day electricity consumption is not only inconvenient, but also may become a source of error. Deng et al. [80] proposed a method to supply electrical load in both the DA market and the spot market. This paper formulates DSM as a convex optimization problem with linear constrains and uses dual decomposition and a stochastic gradient method to solve the price uncertainty. The authors of [70] use a similar idea and apply a penalty function for DA prediction errors based on the price difference of the spot market and the DA market. The basics of convexity, Lagrange duality, distributed sub-gradient, and Gauss-Seidel iterations methods for solving optimization problems are reviewed in [81]. We can observe from these results that realizing the DSM considering the power system constraints as a convex optimization problem is not always possible.
In addition to these DSM techniques, there are some other methods which are combinations of the abovementioned techniques. Eksin et al. in [63] implemented a method that combines TOU and RTP. In this method, a system operator uses a temporal linear function of total real-time demand profile and total real-time production of RERs in each time period, and customers use a complicated game theory-based method to maximize their own profit considering uncertainty in total demand and renewable production. Furthermore, it is important to focus on the method and not the name used to represent the method. For example, some literatures use the term RTP, but the price does not change with respect to the real-time consumption [82]. The method used in this paper is actually TOU with multiple time periods.

2.4. Future Research Directions

2.4.1. Cost Minimization of Each Customer (D1)

Most of previous DSM programs aim to decrease the total cost of the distribution power grid. For this purpose, three different objective functions are generally chosen: minimization of the retailers’ cost function [70], maximization of social welfare [69,83], and minimization of the total energy cost of customers [80], considering customer discomfort [84]. The authors believe that these goal functions are not commonly accepted by the customers. These objective functions do not directly benefit customers, and as a result, customers tend to contribute less in these DSM program.
If the DSM programs can help each customer maximize his/her own profit, customers would participate more in this program. A similar trend can be observed in the power system. Prior to deregulation, the cost of the whole system was optimized using optimal power flow methods. However, in the deregulated electrical market having different generation companies, each company optimizes its own profit rather than the whole system cost [85]. Therefore, considering the benefit of each customer should be one of the important goals of future research.

2.4.2. Decision Authority of Customers (D2)

Some papers [30,83,86] propose DLC methods that centrally control each appliance. These methods decrease the security and comfort of customers, and based on the authors’ opinion, it is another reason that discourages the customers’ participation in DSM. Consequently, DSM programs should increase the liberty of customers to permit each customer to make their own decisions.

2.4.3. Prevent Rebound Peak (D3)

In order to overcome the rebound peak problem, a multi-agent framework considering the piecewise linear function for each customer’s cost is proposed in [64]. However, this method neglects the correlation of loads with each other and assumes that the price of each customer depends only on its own load. Therefore, different customers still can make the same decision. In other words, this method cannot always prevent the rebound peak. The RTP method is a good solution for preventing rebound peaks.

2.4.4. Technical Constraints (D4)

In order to prevent the rebound peak, a central algorithm is used in [76]. This algorithm changes the load profile to minimize the energy bill of each customer. However, this method cannot guarantee an optimized solution, nor does it consider power constraints. As observed from [76], another limitation of existing research in DSM is that most of them do not consider the power system limits such as the maximum capacity of distribution lines, power stability, power losses, and so on. For example, a game-theoretic real-time price market is proposed in [65] to maximize the profit of each participant and uses a dual decomposition technique to solve this problem in a decentralized manner. By neglecting power loss and the corresponding non-linear power flow equations, the proposed optimization method satisfies Slater’s condition and the dual decomposition can be implemented.
In other words, this method does not have the ability to consider the power loss and the nonlinear power system constraints. The authors of [70] show that a varying electricity price can help satisfy the power system constraints. However, implementation details are not presented. Therefore, a practical DSM program must consider all power system constraints.

2.4.5. Different Kinds of Load (D5)

A practical DSM program should manage different type of loads including electrical loads and heating loads. The heating loads have extensive potential to shift over time and they are highly correlated with the electrical demand, particularly, in systems that have CHP generation systems. Table 2 lists some other recent research projects on DSM of SDG with their specifications.

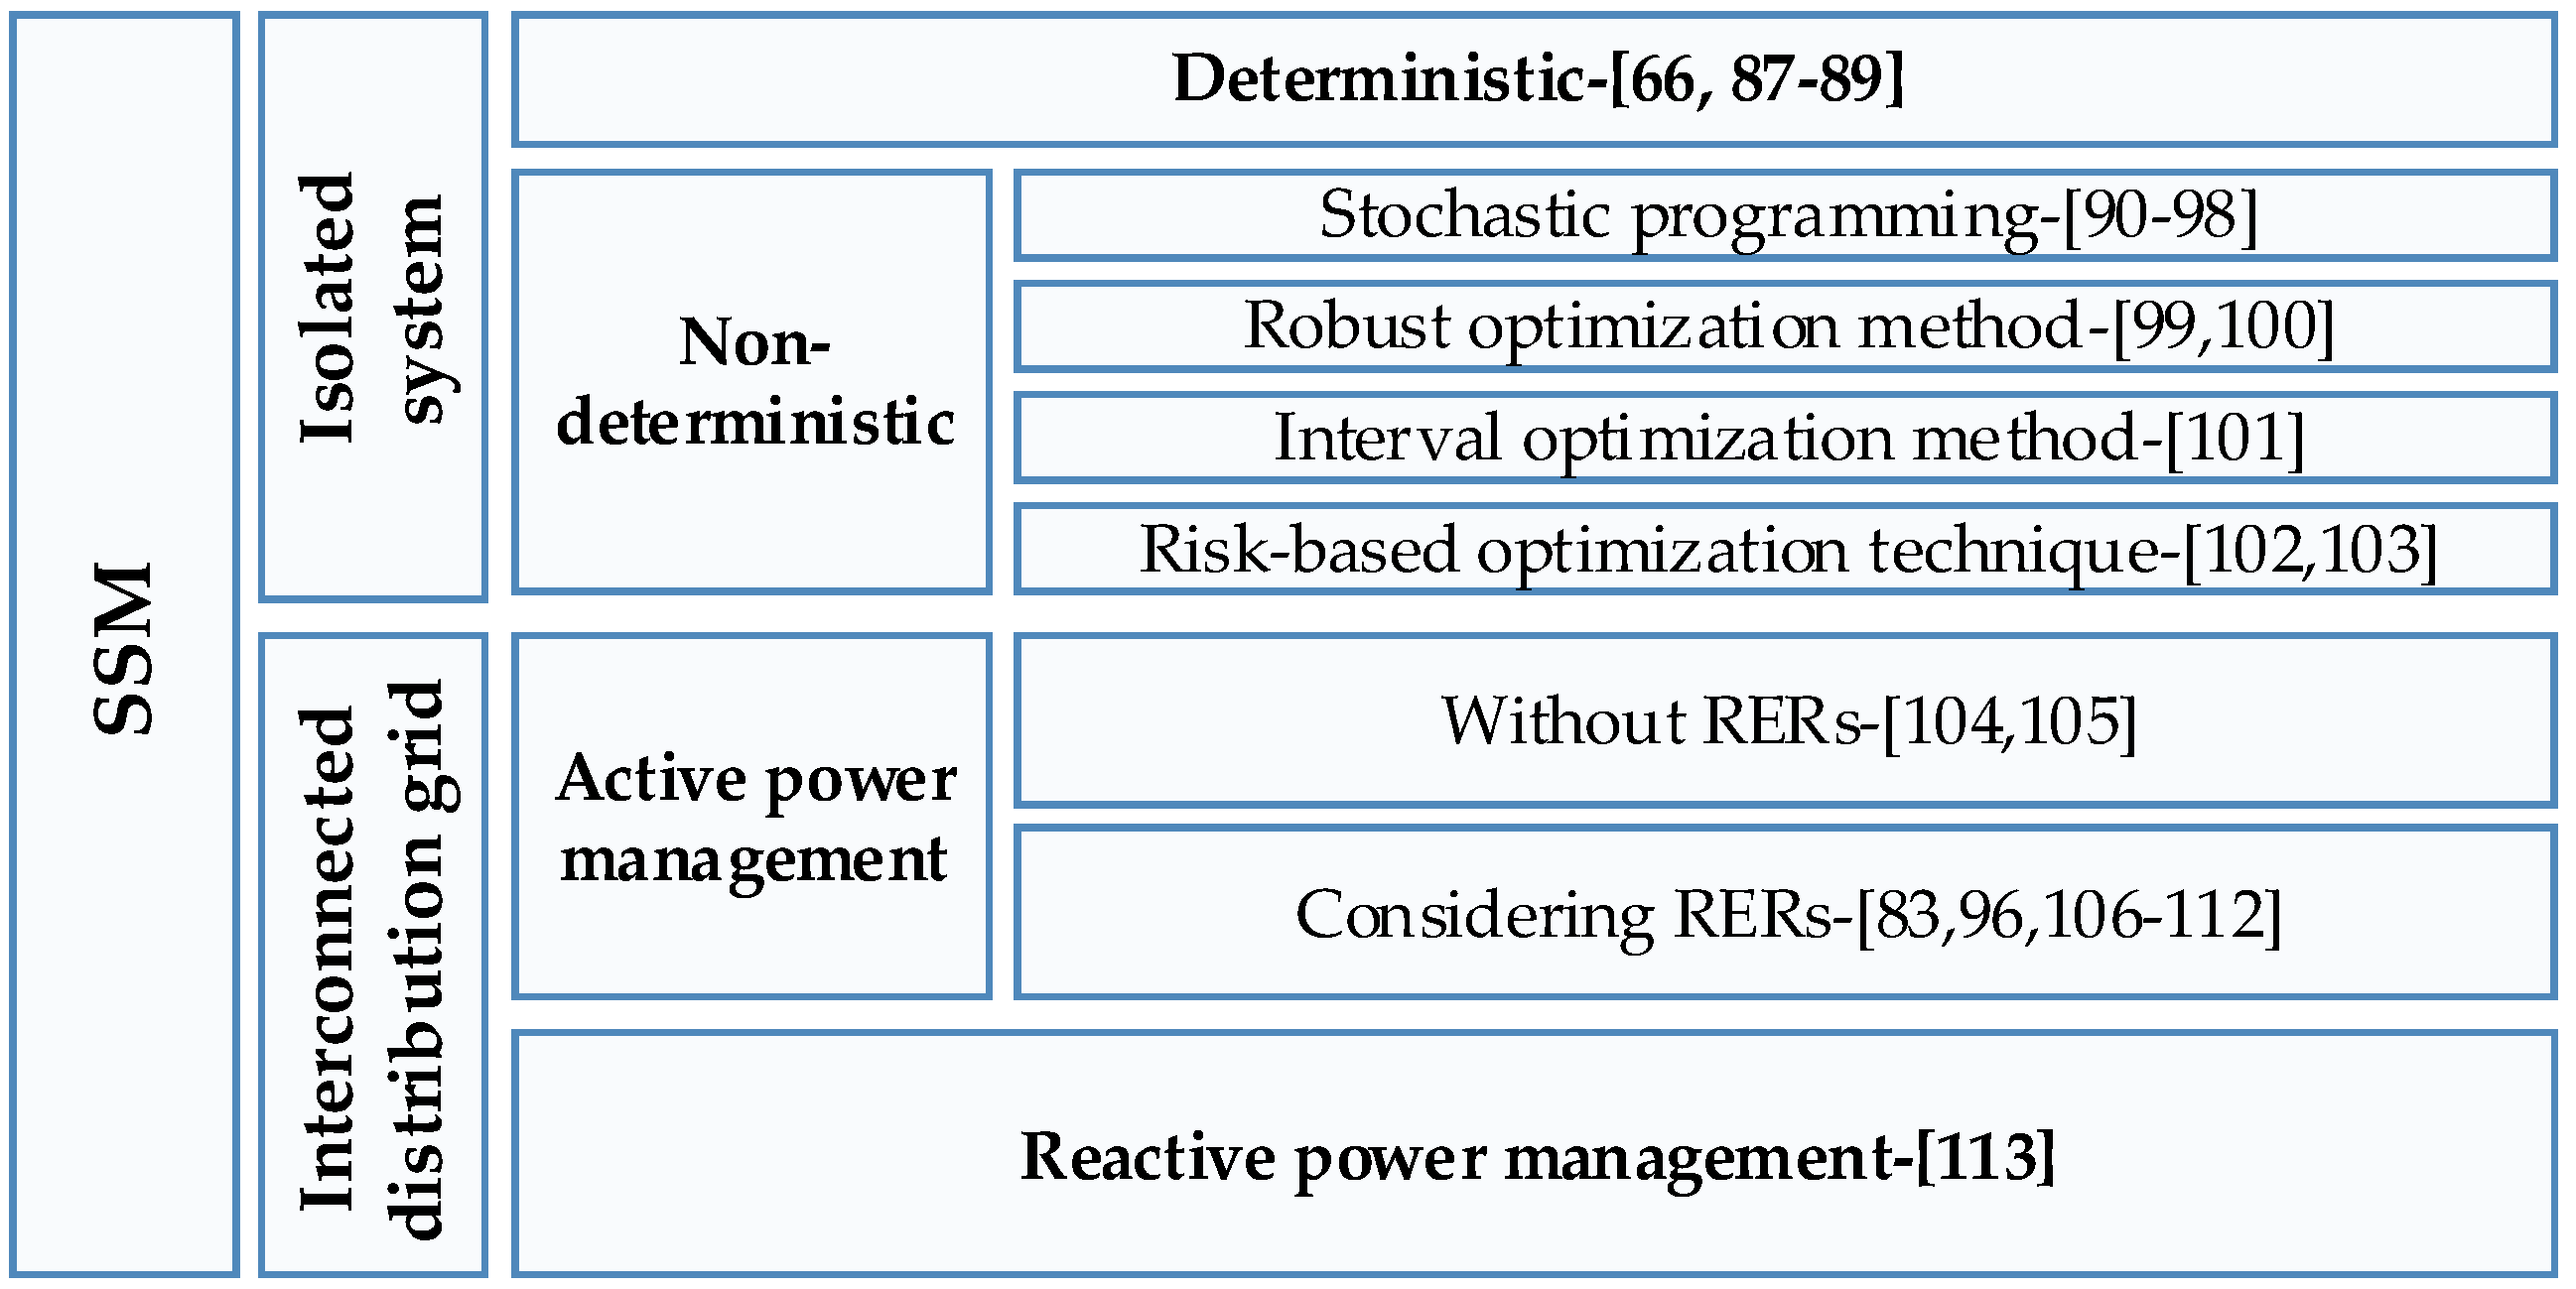
3. Supply Side Management

The power consumed in SG is mainly supplied from four sources: (1) power generated from RERs, (2) power generated from small thermal generators or CHP sources, (3) power stored in ESSs, and (4) power purchased from other grids. Scheduling these sources such that the system has a minimum cost and satisfies all constraints is called supply side management (SSM).
There are two main different directions in SSM. Some of them focus on an isolated grid that only have the first three of the abovementioned sources and cannot purchase/sell electrical power from/to somewhere outside the grid. These works minimize the generations cost in addition to satisfying the technical requirements of the system. For this purpose, they develop different kinds of unit commitment (UC), power dispatch, and optimal power flow (OPF). On the other hand, there are literatures that study interconnected distribution grids having a reliable source of power supply. However, their distribution grids have DGs that have to be adequately scheduled to decrease the cost of operation. As a result, they aim to develop mechanisms to maximize the profit of the distribution system. Figure 3 categorizes recent literature on SSM. In the following two subsections, the literature on SSM in isolated and interconnected SDGs is reviewed.

3.1. SSM in Isolated Systems

UC is a process of scheduling the states (on or off) of generators and determining the output power of each generator such that the total cost over specific time duration, typically one day, is minimized. Usually, UC decisions are made a day-ahead of the system operation and the generators unavailability or loads uncertainty are unknown in advance. In the conventional power system, UC finds the minimum cost generation schedule in order to meet the forecasted demand for each hour (deterministic UC) and the uncertainty is handled by imposing conservative reserve requirements. Since the deterministic method cannot obtain accurate solution in the presence of high uncertainty, such as the high penetration level of RERs, it is not appropriate for SGs. However, the deterministic UC is often used in the SG literature to simplify computation [87,88].
In order to consider the carbon emissions of power generators including thermal generators, DGs, and EVs in SGs, a novel deterministic UC model is proposed in [87]. Typically, UC models consider carbon emissions in two ways: their weighted value is added to the goal function or the value is limited as an optimization constraint. However, this paper uses carbon emission trading (CET) an emissions permit or allowance, which is equivalent to one metric ton of carbon dioxide (CO2) emissions and can be sold privately or in the international market at the prevailing market price, to model the carbon emission cost. For this purpose, first, UC without considering carbon emissions is implemented by an improved PSO algorithm to calculate the total output and emissions of each unit in advance. Then, a heuristic method is used to decrease the emission. In [88] Macedo et al. presented a mixed-integer nonlinear programing model to solve the optimal operation problem of a radial distribution network simultaneously considering dispatchable DGs, switchable capacitor banks, voltage regulators, on-load tap-changers, RERs, and ESSs. This method also can model the upper distribution substation as a local generator and purchase power from that. Despite considering different devices of distribution network and nonlinear constraints, the RERs are modeled as deterministic and it is not accurate in SDGs with a high RER penetration level.
When an optimization problem faces high uncertainty, non-deterministic methods can give more secure and economical solutions. Non-deterministic UC can be divided into four different categories depending on the way in which they address the uncertainty: stochastic programming [90,91,92,93], robust optimization [99,100], interval optimization [101], and risk-based optimization [102,103].
Firstly, stochastic programming optimizes the expected cost over the probability distribution of uncertainties. Markovian chains and the Monte Carlo method are two common methods to calculate the probability distribution used in stochastic programing. The states or scenarios in a stochastic programing increase exponentially with the number of uncertainty sources and hours. Therefore, it is difficult to select an appropriate number of scenarios to balance modeling accuracy, solution feasibility, and computational efficiency. Secondly, in a robust optimization method, in order to reduce the calculation burden and ensure solution feasibility against all possible realizations, the optimal solution of the worst-case in a given uncertainty set is calculated. However, the worst-case scenario should be carefully chosen to provide a reasonable tradeoff between the uncertainty and the cost-effectiveness of UC [102]. The robust optimization method can work with a set of moderate information about the underlying uncertainty, such as the mean and the range of the data [99]. Thirdly, in an interval optimization method, which can be regarded as a special type of the robust optimization, bounds of uncertainty are considered and UC decisions should be feasible for all these bounds. Lastly, in a risk-based optimization technique, the risk is formulated by multiplying the cost of the uncertain events by their occurrence probability. The risk-based optimization methods consider the operational risks of the power system, by adding the operational risks multiplied by the cost of their occurrence to the objective function and/or limit the risks values within the bounds of constraints [102]. In other words, the risk-based UC is a deterministic UC with probability reserve management.
Specifically, for stochastic programing, a stochastic UC considering the generators unavailability and loads uncertainty is proposed in [90]. This method uses discrete scenarios for modeling generators unavailability according to a two-state Markov process model and a continuous distribution function and predefined amount of reserve as constraints for load uncertainty. The authors of [91] model a wind generation as a discrete Markov process with state transition matrices established based on historical data instead of scenarios. Since the mean absolute error of DA load forecast is much less than that of the DA wind forecasts, the uncertainty of load forecasting is ignored for simplicity. A stochastic UC based on Markovian transition probability matrix considering two sources of uncertainty is proposed in [92]. The uncertainties are from lack of knowledge about energy production of RERs (demand is modeled as negative generation) and N-1 contingencies (events that happen because of loss of any one of power system components). They formulate their UC as a mixed-integer nonlinear optimization problem and solve it using a decomposition method. Still, the abovementioned stochastic methods aggregate wind generations from different places as one Markovian process and so the transmission constraints cannot be considered. A DA OPF considering Renewable Energy Certificate (REC) value is proposed in [93] where it uses a probabilistic real-time adjustment cost to calculate the uncertainty of demand and supply and solves the optimization problem using a genetic algorithm. A REC is a paper or electronic certification which represents the property rights to the environmental, social, and other non-power attributes of renewable energy generation, and traded in market to expand the RERs. This method considers RERs with internal ESS in order to make them dispatch-able and reduce uncertainty.
For the robust optimization method, a two-stage adaptive robust UC model in the presence of a nodal net injection uncertainty set (combination of non-dispatchable generation uncertainty and real-time demand variation) is proposed in [99]. The first-stage makes commitment decisions and the second-stage calculates dispatch actions by minimizing the sum of the UC cost and the dispatch cost under the worst-case realization of the uncertain nodal net injection or, i.e., minimizing the maximum cost of nodal net injection. a robust optimization approach to maximize the total social welfare under the worst-case wind power output and demand response scenario is developed in [100]. The problem is formulated as a multi-stage robust mixed-integer programming problem. Both of these robust method use Benders’ decomposition to solve their robust optimization problems. Using an interval optimization method, the model in [91] is extended to [101] so that each wind node is modeled as a separate Markovian chain to consider the transmission constraints. Here, a synergistic combination of Markov-based optimization and interval optimization is developed to reduce the dimension of the pure Markov-based stochastic UC problem.
For the risk-based optimization method, a risk-based DA UC method by considering the risks of load loss, wind curtailment, and branch overflow caused by wind power uncertainty in both objective function and constraints in isolated distribution system is proposed in [102]. This method linearizes the nonlinear terms and uses a mixed integer linear program to solve the proposed risk-based UC. Using the conditional expectation of the risk value instead of its actual value is proposed by [103] to magnify the events having higher probabilities. This method defines a condition value at risk (CVAR) commitment with respect to a certain probability level as the lowest dispatch cost such that the dispatch cost is not exceeded. In addition, this paper formulates the reserve requirements in isolated systems based on overall demand and penetration of renewable technologies instead of selecting a predefined value.
In addition, it is possible that DR participation in UC decisions can improve the efficiency of the power generation scheduling and DR. Since UC is usually performed a day-ahead, it can be blended with DA-RTP or the capacity market. The security constrained UC method proposed in [72] considers DR as a source of reserve power. In this method, DR provider, which participates in electricity markets as a medium between ISO and retail customers, considers the load curtailing as an ancillary service to decrease the price of supplying power reserve. A stochastic UC method with uncertain DR is proposed in [94] based on the price elasticity where the dependency of prices between different time intervals is ignored. This paper solves the problem in two stages, the generators are scheduled in the event of generation contingency in the first stage and the optimum DR and real-time power generations are determined in the second stage. Furthermore, the cross price elasticity is considered in [95] to propose a method to calculate the penalty and incentive for DR participants.
In conclusion, it can be observed that, although the sharp rise in the penetration level of RERs calls for non-deterministic methods instead of deterministic methods, the main idea of UC in an isolated SDG and a conventional power system is quite similar. In the next subsection, SSM methods in interconnected SDGs are surveyed.

3.2. SSM in Interconnected Distribution Grids

The MG concept creates an opportunity to increase the penetration level of DGs in distribution power systems. Management of these DGs and ESSs along with the transmitted power between other MGs or upstream networks is one of the important issues of SDGs. A multi agent-based SSM is developed in [104] to reduce the system peak and cost, and facilitate power trading among MGs having ESSs and incentive-based DR. It considers an agent for any loads, generation units, storage systems, MG, DR, and the network; and proposes virtual local markets, which allow customers to participate in DR and trading with each other. The energy exchange among MGs and a power plant is formulated in [105] using a prospect theory-based static game and the impact of MG subjectivity on MG energy exchange is investigated. It shows that subjective MGs at low (high) battery levels request more (less) energy from the power plant. Then, this paper provides criteria on the energy price in the local energy market for avoiding the impact of user subjectivity in the trade.
A stochastic SSM in an interconnected MG having EVs and RERs is formulated in [106]. This method minimizes the expected operational cost of the interconnected MG and power losses over the next 24 h, while accommodating the intermittent nature of RERs. Also the battery degradation cost is considered in the goal function and minimized. Although power loss is considered in the constraints, there is no strategy to consider the power system constraints. The authors of [83] consider a MG with a centrally shared wind turbine, an ESS, and several micro CHPs with different owners. This study proposes a hierarchical optimization method using Q-learning to minimize the cost for the whole community (all micro CHPs cooperate to generate power for the whole community) and applies an algorithm to determine the house bill based on their consumption and generation. Yet, there is no guarantee that this method is the best solution for all customers. Yang et al. in [107] modeled various devices, e.g., appliances, batteries, thermal generators, and wind turbines, in a MG and develop a large-scale mixed-integer programing with coupling constraints to minimize the total economic cost of the MG. To solve the problem more efficiency, the problem is decoupled using Benders’ decomposition into a set of sub-problems, which can be solved distributedly on each device.
These papers all study active power management. However, there are also some papers that study reactive power management. A decentralized reactive power management based on s Nash bargaining solution to control voltage locally is proposed in [113]. This method ignores the power losses of the system and pays incentives for DGs’ reactive power based on the cost reduction of utilities in reactive power compensators.

3.3. Future Research Directions

This subsection discusses the future research directions for a practical SSM program. Although the SSM in the isolated SG seems similar to that of the traditional power system, the SSM in the interconnected SDG is a new idea and many challenges still remain to be solved. Like the DSM methods, the existing SSM in the interconnected SDG has several drawbacks that need to be resolved. Since a practical SDG needs a competitive market to attract more investment in RERs, any SSM program should consider each generator’s profit instead of the system-wide profit. Furthermore, at high RER penetration levels, stochastic modeling of energy production becomes very important due to the uncertainty of the power output of RERs. In this case, the SSM program should use non-deterministic optimization methods while working in harmony with the DSM program to decrease the cost and improve the reliability and quality of the power system.
The importance of coordination between demand and supply management program using transactive energy (TE) techniques is described in [114]. The research shows that TE mechanisms can considerably reduce the balancing energy requirements of the network using the real-time supply and demand management. The Gridwise Architecture Council defines TE as “a set of economic and control mechanisms that allows the dynamic balance of supply and a demand across the entire electrical infrastructure” [115]. In other words, the TE mechanism is described in [116] as a decentralized real-time, dynamic pricing method considering the influence of the supply and demand using two way communication techniques. Consequently, TE mechanisms are one of the important requirements of future SSM programs.
Another important requirement of a practical SSM program is improving the technical issues of power systems. Most of research in this area neither proposes methods to improve the power system constraints such as power loss or stability, nor considers these constraints in their optimizations. Since power system equations are intensively nonlinear, some papers try to simplify them. Three neural networks are used in [108] to model the behavior of power systems to quickly calculate power loss, dynamic behavior of reactive power, and battery life degradation. This paper focuses on a stochastic optimal control of MG having multiple RERs, but does not consider the economic details. The main specifications of a practical SSM program in a SDG are as follows:
(S1)
Consider the profit of each generator instead of all generators and encourage different owners to participate.
(S2)
Model the probabilistic distribution of output power for different RERs.
(S3)
Consider the contingency scenarios and uncertainty of loads.
(S4)
Consider the power system constraints and a strategy to improve them.
(S5)
Work in coordination with practical DSM (TE mechanisms).
In sum, SSM has attracted many researchers in recent years employing similar ideas. Table 3 lists some other recent research in SSM, along with their drawbacks.

4. Electrical Vehicles

The transportation system and electric power generation have many issues in common and can be linked together. They consume more than 60% of the global primary energy demand and are primarily responsible for the greenhouse gas problem [119]. Recently, the growth of the EV industry is making this link much stronger. Generally, an EV can be defined as any vehicle that uses batteries as some part or all of its energy source. However, this paper only investigates EVs that can plug into the power grid to charge their batteries.
It is now a well-known fact that EVs use energy much more efficiently than conventional internal combustion engine vehicles. The efficiency of EVs can reach up to 65%, while conventional vehicles have efficiencies of less than 20% [120]. In other words, the combination of EVs and SG with high penetration of RERs has a high potential to reduce the greenhouse gas emissions, in addition to decreasing the energy cost. However, supplying power for a large number of EVs would have a significant impact on the power grid and the electricity demand. Consequently, many research efforts have been made recently in this area. In this section, after briefly reviewing different types of EVs and their evaluations, the total cost of ownership (TCO), grid to vehicle (G2V) concept, and vehicle to grid (V2G) concept are presented. Finally, the future directions of EV research from a SG perspective are discussed.

4.1. EV Types and Evolution

Plug-in EVs (PEVs) are generally classified into battery EVs (BEVs), extended-range EVs (EREVs), and plug-in hybrid EVs (PHEVs). There is no internal combustion engine in BEVs. They have a large battery bank as the energy source, which is charged by a cord from the power grid. On the other hand, EREVs and PHEVs use an internal combustion engine and have a relatively smaller battery bank. In EREVs, the combustion engine, which is coupled with an electricity generator, only produces the electricity needed to charge the battery and vehicle is driven only by electrical motor, while in PHEVs, the combustion engine operate in parallel with an electrical motor [121]. A good review of different EV architectures, their energy storages, their chargers and power convertor technologies, and their internal control systems are presented in [122]. Since BEVs do not have combustion engines, they have many advantages. They have much fewer moving parts, do not need regular oil changes, regenerate better breaking loss, and have much less maintenance cost. However, the size, weight, and the cost of their battery bank limits the vehicle’s miles of travel (VMT) with one charge. Under this circumstance, one of the most important challenges of EVs, especially BEVs, is their urgent need for fast charging infrastructures for long-distance travel.
Based on the US standards for electrical vehicles, there are three kinds of chargers: level one, which works with a single phase 120 V, 12–16 A; level two, which works with a single phase 240 V, 40 A; and level three or fast charging methods, which use three phase 480 V, 60 to 150 kW off-board charging systems. In [123] researchers estimated that the charging infrastructures for level one and two in residential and commercial buildings cost around 900 USD and 1800 USD, respectively. Since a typical medium sized BEV-100, (with VMT of 100 miles) consumes 0.36 kWh per mile and has 40 kWh battery energy [124], a full charging cycle takes more than 20 h, 4 h, and 15 min with level one, level two, and level three chargers, respectively. However, the average VMT per day is around 25 miles and it is likely that EVs do not always need to be fully charged every day.
Due to the charging challenges of EVs, exact information about driving behavior is needed. A review of driving patterns including daily traveling distance, the number of daily trips, and the departure and arrival times of each household in the US was performed in [125]. The authors of [126] studied the behavior of drivers and their traveling distance in the Western Australia Electric Vehicle trial to determine the specifications of public charging infrastructures based on drivers’ charging preferences. This paper uses advanced discrete choice models and shows that drivers prefer to charge EVs at home or work, and they are sensitive to charging cost and duration. Xi et al. in [127] optimized the locations of public charging infrastructures using a linear integer programming method that first, predicts where EVs’ owners live and then simulates the relationship between the service rates and the chargers deployed. They applied the model to the US central-Ohio region and demonstrate that a combination of level one and two chargers maximizes the available charging energy.
The price of EVs is another challenge of EVs’ popularity. An overview of commercial EVs with their specifications and prices is presented in [121]. It can be seen in this overview that the price of EVs is higher than that of conventional vehicles. However, the maintenance and energy cost of EVs are much less than that of the conventional one. In order to help customers to choose a vehicle type, TCO of EVs is investigated in [124,128,129,130]. In [128], TCO for annual VMT is developed based on a large data set of driving profiles from Germany. Regarding the high price of fossil fuel in Europe, this paper shows that PHEVs are a cost effective solution for many drivers as PHEVs have relatively low variable costs, unlimited total range, and their initial investment is not so high compared to a conventional vehicle. The sensitivity of BEV economics to charging strategy, vehicle range, and driving pattern is studied in [124]. This paper shows that the cost of unachievable VMT has a significant impact on the TCO modeling, such that if another low cost vehicle (e.g., second conventional vehicle in house) is available, the BEV-75 is more cost effective than having another conventional vehicle. A TCO model of PHEVs with details such as maintenance costs, and salvage value are formulated in [129]. This paper compares the proposed model with previous studies in this area and demonstrates using a sensitivity analysis that the results are very sensitive to the value of uncertain parameters like fuel cost. A 20% rise in gasoline prices decreases payback period of mid-size PHEV-20 in comparison to a conventional vehicle to around 30%. All of these research show that TCO of EVs and conventional vehicles is almost the same and depends on uncertain values, such as fuel cost, initial cost, and taxes. A TCO model for EVs is developed in [130] and hypothesizes that the provision of TCO information on fuel economy labels could increase the consumer demand for hybrid and plug-in vehicles. A comprehensive summary of the literatures that predict the penetration rate of EVs in the future is presented in [131]. These literatures use three different forecasting methods: agent-based, consumer choice, and time series. As in the TCO model, the future penetration rate of EVs depends on the uncertain values. Most of the forecasting results show a penetration level of more than 20% and some of them of more than 60% by 2040.
There are many factors, which are not quantified in TCO models, that may also affect customers’ willingness to pay more for PHEVs, such as fewer trips to gas stations, lower CO2 and greenhouse gas emissions, less noise and vibrations, better acceleration, cabin preconditioning, better handling due to balanced weight distribution, and lower center of gravity [129]. Rezvani et al. in [132] presented a comprehensive overview of how consumers perceive EVs and why they purchase EVs.
The evolution of EVs in four generations is reviewed in [133]. In the first generation, manufacturers agreed on some common standards, such as conductive charge coupler [134]. In the second generation, the efficiency is improved and the EVs are equipped with communication system and connected to smart meters in order to improve the charging process (G2V). In the third generation, which could be implemented after at least 5 successful years of the second generation, EVs connect to loads, houses, or isolated networks, and the level three chargers are extended into public areas. Finally, in the fourth generation, the two-way communication between SGs and vehicles is implemented and vehicles can inject active and reactive power to the power grid to improve the stability and controllability of the SG (V2G). In the following two subsections, existing work on G2V and V2G are presented.

4.2. Grid to Vehicle (G2V)

Increasing the penetration level of EVs imposes new stress to the existing power systems. Based on market forecasting theories, the penetration level of EVs will reach at least 20% in the near future, and it means that there will be more than 25 million EVs in the US alone. Then, if each EV needs 10 kWh per day on average (driving about 25 miles), the daily energy demand will increase by 250 GWh (about 8% of the total demand of the US [43]). In order to anticipate this problem, many research focus on EVs’ load prediction. A load profile database for EVs was built in [135] based on car-use profiles of current conventional vehicles in six European countries (Germany, Spain, France, Italy, Poland, and the United Kingdom). This study determined the load profile between different weekdays for each country based on car traveling distance and speed using a simple charging mechanism. A methodology to estimate the electric energy and power consumed by light-duty EVs is proposed in [136] and [137] using the travel patterns of US surveys (National Household Travel Survey) from 2003 and 2009, respectively. The method proposed in [137] calculates the expected values and the standard deviations of EV electricity energy consumption, and shows that since the standard deviations are large compared to the expected values, the daily electricity energy consumption of an individual EV cannot be precisely predicted. However, the results can be utilized to estimate the overall energy consumption of an EV fleet. The authors of [138] developed a tool, which estimates the additional demand of EVs using Monte Carlo simulations performed on a large fleet of EVs over several days, and demonstrated that the electrical load of this group at each hour of the day can be modelled by a normal distribution to simplify the estimation procedure.
Preliminary results of a survey among 1,754 new EV buyers between April and October 2013 are summarized in [139]. This study obtained some interesting results: (1) many customers have charging infrastructures (level one) at their homes; (2) consumers are much more likely to purchase a PHEV than a BEV; (3) without incentives or policies to control charging behavior, EV electricity demand will likely peak at around 6–8 pm in residential areas and between noon and 2 pm in commercial areas [136]. In [140] the authors also point out that the peak amount from uncontrolled charging of EVs will be a serious problem for California’s old power grid in the near future.
The influence of EV charging on the power system is briefly reviewed in [141]. Generally, uncontrolled charging of EVs has many adverse effects on the power system. In addition to overloading of system elements, other adverse effects of a high EV penetration level include: (1) current and voltage imbalance due to a large number of high power stochastic single phase loads [142]; (2) power quality problem due to high total harmonic distortions of battery chargers [143]; (3) adverse effects on power system devices, such as decrease in the life expectancy of transformers [144,145] and cables [143], or circuit breakers and fuse blowouts [146]; (4) increased voltage deviations [147]; (5) increased power losses [148]; and (6) economic influence, which has not been completely analyzed yet. A huge amount of electricity demand is added to the power system, that even during off-peak periods, changes the balance between supply and demand. Hence, more comprehensive studies are needed.
In detail, a method for determining residential distribution transformer life in the presence of EVs is investigated in [144] and shows that a simple charging method can reduce transformer lifespan by 37%. A method for estimating the impact of EVs charging on overhead distribution transformers is presented in [145] based on detailed travel demands. This paper proposes a new smart charging algorithm that manages EV charging based on estimated transformer temperatures to prolong the transformer lifespan. The authors of [148] propose a comprehensive approach for evaluating the impact of different levels of EV penetration on distribution network investment and incremental energy losses. This paper shows that with 60% penetration of EVs in two large scale real distribution networks, energy losses can increase by 40% from the nominal load in off-peak hours (based on whole electrical loads excluding EVs) and investment costs can increase by 15% from the total actual distribution network value.
Charging strategies have a significant influence on the EV affecting the power system. Table 4 shows the different types of charging strategies and a list of the literature on each type with their specifications (which will be described in Section 4.4). In the non-smart charging method, chargers operate without considering the real-time conditions. In a simple (or unconstrained) charging method, as soon as an EV connects to the grid, the charging procedure with nominal power starts, whereas in a delayed charging method, it starts after a predefined delay. This delay can be set manually in such a way that the EV’s charger uses the lower tariff of off-peak periods. However, a PHEV total fueling cost model presented in [149], demonstrates that in many situations, delaying the PHEV charging until the off-peak periods rather increases the fuel consumption and energy price.
The adverse impacts of EVs will arise, if the charging procedures are not controlled. Therefore, a simple central controller method for EVs is proposed in [138] to prevent the peak demand. In the smart charging methods, vehicles are charged only when it is most beneficial. For this purpose, algorithms should measure some parameters, analyze and predict the energy price and driving behavior, and decide on the amount and time of EV charging. This is the link that connects EVs and SGs. In the direct control, retailers or aggregators control all the EVs of their region and determine when and how much they can charge. However, in the indirect control, the control is applied by changing the energy price or giving incentives.
In real systems, since many uncertainties are associated with the planning of the EV charging procedure, such as the time of departure or arrival, the state of charge (SOC), and the size of their battery, most of the existing research works employ the direct control or centralized methods. In [150] a direct smart charging mechanism, which optimally allocates available charging capacity considering network constraints and EVs’ preferences, was presented. In this method, EVs owners can pay more to have a higher preference for faster charging. However, the proposed preference algorithm cannot manage the whole power system capacity and needs an upper optimization mechanism to allocate the remaining capacity. Most of the research in DSM considers EVs as a curtailable load and controls them like other loads. For example, a direct control method for EVs charging for their DSM programs is proposed in [67,106]. Although considering the power system issues, which are mentioned above, is essential, when the penetration level of EVs increases, most of the existing research in this area only studies the economic issue or technical issues without considering their influence on each other. In an attempt to address this issue, a direct method to design a measurement-based, real-time, and distributed charging algorithm using a dual-decomposition approach is used in [86]. This method applies an approximated calculation to consider the maximum limitation of power system components.
Using the direct control method is another weakness of these studies. Direct methods are suitable for public places such as parking lots and do not motivate for house charging. Based on realistic vehicular mobility/parking patterns, a centralized EVs recharge scheduling system for parking lots is proposed in [151]. In order to show the performance of the method, the authors compared the proposed method with two different scheduling mechanisms, first-come-first-served and earliest deadline first, using two objective functions, maximizing the total parking lot revenue and maximizing the total number of EVs. However, indirect charging methods are a more promising concept as they are more likely to be accepted by customers than direct control methods, as suggested in [152]. This paper develops an agent-based electricity market equilibrium model with variable electricity prices as an incentive for EVs to consume electricity when the supply of renewable generation is high. This method uses a stochastic model to determine mobility behavior and an optimization model to minimize vehicle charging costs. However, it has two drawbacks: (1) the variable electricity prices are calculated based on marginal generation costs and do not change based on real-time loads, and (2) power system issues are neglected. Fortunately, most of the adverse effects of EVs on the power system can be compensated by the V2G concept, which is reviewed in the next subsection.

4.3. Vehicle to Grid (V2G)

The idea of discharging a parked EV to a power grid or V2G concept was first presented in 1997 [153]. Here, each EV has a bidirectional charger, which can charge the battery from the grid or discharge the battery for supplying power to the grid. Since vehicles are in use for only about 4% of the time and parked during the other 96% of the time [30], a bidirectional charger and EVs’ batteries can provide almost all the benefits of ESSs for the power grid. Therefore, this new extra load can rather benefit the SG. The V2G concept can benefit the SG by: (1) providing peak demand; (2) providing ancillary service; and (3) supporting RERs.

4.3.1. Providing Peak Demand

The initial idea behind using a storage device in the power system was to buy energy during off-peak periods at a low price and sell it during peak periods at a high price. Based on this basic idea, the influence of EVs discharging during peak periods is more effective than the DLC method [153]. However, there are two important issues that need to be considered. First, a large number of EVs causes the power demand in the peak and off-peak period to be closer to each other, and therefore, the energy price difference between the peak and off-peak (incentive) decreases. Second, battery degradation during the charging and discharging periods translates into costs, possibly even more than the incentive amount. Providing peak demand under different conditions is investigated in [154] and it is shown that with perfect forecasting and without considering the battery degradation factor, the incentive is around 200 USD annually and it is not sufficient to motivate owners to participate in this service. EV parking lots participating in the energy market are simulated in [82]. This paper proposes a method for maximizing the profit of parking lot owners and compares the results with different DSM methods, such as TOU, CPP, and incentive methods. The results with one thousand parking lots, participating in the Spanish electricity market considering battery degradation, show that the expected profit could amount to 200 EUR per day. However, the number of charging cycles and the amount of SOC have negative influences on the battery life [155]. When an EV wants to sell active power during peak periods, the average SOC of battery, in addition to the number of charging cycles, is increased, resulting in a significant reduction of battery life. Simulation results demonstrate that the cost related to the battery life reduction are about twice as high as the benefits of providing peak demand, while other papers, which consider battery degradation factor, do not model the effect of high SOC.

4.3.2. Providing Ancillary Service

Since in any given time, many EVs could be connected to the power grid, aggregated EVs can provide ancillary services without significantly influencing their main duty. EVs with a proper bidirectional convertor can supply active and reactive power for power systems and better control the system than a central controller as they are distributed over the grid. The aggregated EVs can offer ancillary services, such as providing active power balancing and frequency regulation [136], spinning and non-spinning reserves [156], and reactive power, voltage control, and loss minimization [157].
In detail, the active power balancing markets in Germany and Sweden are investigated in [136] and the possible EVs’ profits under different conditions are obtained. The study concludes that each EV can earn 30-80 EUR per month in Germany, whereas no profits are possible in Sweden. Here, the spinning reserve can be described as a specific amount of additional generating capacity, which must respond immediately and reach full capacity within 10 min after requests. Therefore, the spinning reserve providers must have the ability of decreasing or increasing the active power to regulate frequency. For this reason, EV aggregators are paid for having a given available and synchronized capacity and receive additional payments for energy delivered to the network. Since the response speed of EV is between 4 s and 1 min, participation of EV aggregators in the spinning reserve is appropriate from the network perspective. Moreover, the battery will typically only charge and discharge slightly and oscillate around the initial charge state. A study on the participation of EVs in reserve provision in [156] states that the average net income from this service can reach up to 700 USD for BEVs and more than 3000 USD for PHEVs or EBEVs that do not always need to be fully charged. A novel two-stage optimization method is proposed in [157] to minimize the network energy losses using smart charging and discharging of PHEVs. This method employs a Monte Carlo method to simulate the uncertain nature of customers’ loads and PHEV charging profile to demonstrate that a 22.5% reduction in nominal power loss can be expected with 90% of PHEV penetration.

4.3.3. Supporting RERs

RERs have uncertain outputs, and therefore their penetration level in the power system is limited by the ability of system controllers. Since EV aggregators in V2G can work as controllers in the power system, they can help to increase the penetration level of RERs in the power system. On the other hand, increasing the penetration level of RERs can decrease the energy price [152] so it can also help to increase the penetration level of EVs. Conversely, EVs can help RERs to grow as well. Some literature proposes EVs as controllable loads, which can change their consumption in order to compensate the fluctuations of RERs output [158,159]. Some works [160] categorize EVs with controllable load as a V2G concept. Injecting the stored energy of EVs into the grid for smoothing the output of RERs is another way to help increase the penetration level of RERs [161,162,163,164].
It is shown in [158] that a surface around 15 m2, about the size of a parking lot space, can produce an average daily energy of about 12 kWh, and represents a solar to vehicle concept for large parking lots. A two-stage charging scheme for an EV aggregator is proposed in [159] to minimize the charging cost of each individual participator, while taking uncertain renewable generation and aggregator’s capacity into account. This study uses a Nash equilibrium to minimize the cost of each EV, and the charging amount is change based on the RERs’ outputs.
V2G could stabilize a large-scale (one-half of US electricity) wind power plant with 3% of the EV fleet being dedicated to the regulation of output power of RERs [161]. A simple strategy for an effective utilization of EV battery capacity for mitigating the impact of PVs based on V2G concept is proposed in [162]. This method develops a controllable charging/discharging pattern to optimize the use of the limited EV battery capacity to control voltage rise when PVs produce more power than they can consume. However, this paper does not directly consider the economic issues and the battery degradation factor. A hierarchical stochastic control scheme is presented in [163] to coordinate of EV charging and wind power in a MG. This scheme, consisting of two layers, minimizes the power exchange between the MG and the main grid while ensuring that all EVs are almost fully charged before their use. Minimizing the power exchange reduces the uncertainty of RERs and the demand from the main grid, and may help to increase the penetration level of RERs. However, this method also does not consider the economic benefits. A stochastic UC method based on the Monte Carlo technique is presented in [164] to integrate a large-scale wind power and EVs in V2G mode. This paper emphasizes that the aggregated EVs can improve the system condition and analyzes the dynamic process of stored energy in aggregated EVs based on the distribution pattern of user trips. The paper also proposes an EV aggregator model considering time-varying storage capacity and develops a day-ahead security constrained UC for EVs and wind power.

4.4. Future Research Direction

High penetration level of EVs in the near future is expected to change the power system in many aspects. EVs have different working modes, and there are many uncertainties when planning their uses. They behave like controllable loads in G2V mode and dispatchable small sources in V2G mode. Under these circumstances, most of the existing research treats EVs like other load elements and controls them with direct strategies. However, a practical SDG management system should consider the EVs charging and discharging process as a new element and indirectly control their power to prevent many adverse effects, while giving the decision authority to EV owners. Ideal EVs charging mechanisms should let each customer maximize his/her own profit and implement a reasonable incentive method to encourage EVs to operate in V2G mode. The main specifications of an ideal smart charging mechanism for EVs in a SDG are as follows:
(E1)
Use the smart indirect charging control to allow owners to maintain their own authority.
(E2)
Maximize the profit of each individual EV to increase the motivation of using EVs.
(E3)
Consider all the technical constraints of the power system in G2V mode.
(E4)
Propose incentive methods to improve the power system conditions in V2G mode.
(E5)
Work in coordination with practical DSM and SSM (Section 2.4 and Section 3.3).

5. Conclusion

In this paper, we have reviewed recent literature on SDGs from economic and power technical perspectives. A SDG includes the loads, distributed generations, storage devices and EVs, distribution lines, communication system, and control mechanism. We first presented challenges of SDGs and different SDG implementations around the world. Then, we investigated different electrical market management schemes in DSM, SSM, and EVs. For each category, we critically evaluated the existing work by discussing their limitations, and identified future directions for developing a practical SDG management system for the future SG. Finally, we conclude that the practical SDG management system should meet some specifications as follows:
  • Controlling different loads, generations, and EVs, while considering their and the grid uncertainty; in other words, the management system must connect the DSM program, SSM program, and EVs charging/discharging method together.
  • Using indirect methods to give decision authority to participants: planning demand and generation on a distribution grid under high uncertainty can be easily done by using centralized methods but it can also decrease the popularity and security of SDGs.
  • Creating a competitive market to attract more participants: the benefits to individual customers should be valued more than minimizing the total cost of the system.
  • Considering the technical issues of the power system: many existing works simplify calculations by neglecting the nonlinear power system equations, such as power loss, stability, voltage, and current constraints.
  • Considering the limitations of communication and computational resources.

Acknowledgments

This research was funded by the Ministry of Science, ICT and Future Planning (MSIP), Korea, under the “ICT Consilience Creative Program” (IITP-2015-R0346-15-1007) supervised by the Institute for Information & Communications Technology Promotion (IITP) and under the “Basic Science Research Program” (2013R1A1A10104 89, 2015R1C1A1A01053788) through the National Research Foundation (NRF).

Author Contributions

Poria Hasanpor Divshali and Bong Jun Choi provided a comprehensive review of the state of the art literature in smart distribution grid related to demand side management and supply side management considering the system constraints and also including electric vehicles. Poria Hasanpor Divshali and Bong Jun Choi provided a critical evaluation of different methods discussing their key features and limitations to present promising and practical future research directions for the smart distribution grid system.

Conflicts of Interest

The authors declare no conflict of interest.

Abbreviations

The following abbreviations are used in this manuscript:
SDGSmart Distribution Grid
SGSmart Grid
MGMicro-Grid
EVElectrical Vehicle
DGDistributed Generations
CHPCombined Heat and Power
RERRenewable Energy Resources
ESSEnergy Storage Systems
DRDemand Response
DRPDemand Response Provider
DSMDemand Side Management
SSMSource Side Management
SCADASupervisory Control and Data Acquisition
DADay-Ahead
DLCDirect Load Control
TOUTime of Use
CPPCritical Peak Pricing
PLPPeak Load Pricing
RTPReal-Time Pricing
OPFOptimal Power Flow
UCUnit Commitment
CVARCondition Value At Risk
CETCarbon Emission Trading
RECRenewable Energy Certificates
SOCState Of Charge
TCOTotal Cost of Ownership
VMTVehicle Miles of Travel
G2VGrid to Vehicle
V2GVehicle to Grid
BEVBattery EV
EREVExtended-Range EV
PHEVPlug-in Hybrid EV
TETransactive energy

References

  1. Hashmi, M. Survey of smart grids concepts worldwide. Technical Research Centre of Finland, 2011. [Google Scholar]
  2. Najjar, M.; Ghoulam, E.; Fares, H. Mini renewable hybrid distributed power plants for Lebanon. Energy Procedia 2012, 18, 612–621. [Google Scholar] [CrossRef]
  3. Lo, C.-H.; Ansari, N. The progressive smart grid system from both power and communications aspects. Commun. Surv. Tutor. IEEE 2012, 14, 799–821. [Google Scholar] [CrossRef]
  4. World Energy Outlook 2014. Availabe online: http://www.worldenergyoutlook.org/weo2014/ (accessed on 8 May 2016).
  5. Gungor, V.C.; Sahin, D.; Kocak, T.; Ergut, S.; Buccella, C.; Cecati, C.; Hancke, G.P. A survey on smart grid potential applications and communication requirements. IEEE Trans. Ind. Inform. 2013, 9, 28–42. [Google Scholar] [CrossRef]
  6. Renewables 2015 global status report. Availabe online: http://www.ren21.net/wp-content/uploads/2015/07/GSR2015_KeyFindings_lowres.pdf (accessed on 8 May 2016).
  7. Reza, M. Stability Analysis of Transmission System with High Penetration of Distributed Generation. Ph.D. Thesis, Delft University of Technology, Delft, The Netherlands, 2006. [Google Scholar]
  8. Lasseter, R.H. Microgrids and distributed generation. J. Energy Eng. 2007, 133, 144–149. [Google Scholar] [CrossRef]
  9. Piagi, P.; Lasseter, R.H. Autonomous control of microgrids. In Proceedings of the 2006 IEEE Power Engineering Society General Meeting, Montreal, QC, Canada, 2 June 2006.
  10. Divshali, P.H.; Alimardani, A.; Hosseinian, S.H.; Abedi, M. Decentralized cooperative control strategy of microsources for stabilizing autonomous VSC-based microgrids. IEEE Trans. Power Syst. 2012, 27, 1949–1959. [Google Scholar] [CrossRef]
  11. Gharavi, H.; Ghafurian, R. Smart grid: The electric energy system of the future. Proc. IEEE 2011, 99, 917–921. [Google Scholar] [CrossRef]
  12. Cardenas, J.A.; Gemoets, L.; Rosas, J.H.A.; Sarfi, R. A literature survey on smart grid distribution: an analytical approach. J. Clean. Product. 2014, 65, 202–216. [Google Scholar] [CrossRef]
  13. Sheble, G.B. Real-time economic dispatch and reserve allocation using merit order loading and linear programming rules. IEEE Trans. Power Syst. 1989, 4, 1414–1420. [Google Scholar] [CrossRef]
  14. Chattopadhyay, B.; Sachdev, M.; Sidhu, T. An on-line relay coordination algorithm for adaptive protection using linear programming technique. IEEE Trans. Power Deliv. 1996, 11, 165–173. [Google Scholar] [CrossRef]
  15. Dutta, P.; Gupta, P.D. Microprocessor-based UHS relaying for distance protection using advanced generation signal processing. IEEE Trans. Power Deliv. 1992, 7, 1121–1128. [Google Scholar] [CrossRef]
  16. Fang, X.; Misra, S.; Xue, G.; Yang, D. Smart grid-The new and improved power grid: A survey. Commun. Surv. Tutor. IEEE 2012, 14, 944–980. [Google Scholar] [CrossRef]
  17. Flueck, A.J.; Nguyen, C.P. Integrating renewable and distributed resources-IIT perfect power smart grid prototype. In Proceedings of the IEEE Power and Energy Society General Meeting, Minnesota, MN, USA, 25–29 July 2010.
  18. Wilson, K.; Cieslicki, D. Smart Grid at Santa Clara University. Availabe online: http://www.comsocscv.org/docs/Talk_051210_SmartGridWAN.pdf (accessed on 8 May 2016).
  19. ETown Concept for Smart Grid Simulation and Demonstration Projects. Availabe online: http://rri.wvu.edu/wp-content/uploads/2012/12/ETown_Concept_for_Smart_Grid_Simulation.pdf (accessed on 8 May 2016).
  20. Lasseter, R.H.; Eto, J.H.; Schenkman, B.; Stevens, J.; Vollkommer, H.; Klapp, D.; Linton, E.; Hurtado, H.; Roy, J. CERTS microgrid laboratory test bed. IEEE Trans. Power Deliv. 2011, 26, 325–332. [Google Scholar] [CrossRef]
  21. Alegria, E.; Brown, T.; Minear, E.; Lasseter, R.H. CERTS microgrid demonstration with large-scale energy storage and renewable generation. IEEE Trans. Smart Grid 2014, 5, 937–943. [Google Scholar] [CrossRef]
  22. Turner, G.; Kelley, J.P.; Storm, C.L.; Wetz, D.; Lee, W.-J. Design and active control of a microgrid testbed. IEEE Trans. Smart Grid 2015, 6, 73–81. [Google Scholar] [CrossRef]
  23. The University of Texas Forms Microgrid. Availabe online: http://www.utexas.edu/research/cem/micro_team.html (accessed on 8 May 2016).
  24. Covrig, C.F.; Ardelean, M.; Vasiljevska, J.; Mengolini, A.; Fulli, G.; Amoiralis, E.; Jiménez, M.S.; Filiou, C. Smart Grid Projects Outlook 2014; Joint Research Centre of the European Commission: Petten, The Netherlands, 2014. [Google Scholar]
  25. Huang, P.; Kalagnanam, J.; Natarajan, R.; Sharma, M.; Ambrosio, R.; Hammerstrom, D.; Melton, R. Analytics and transactive control design for the pacific northwest smart grid demonstration project. In Proceedings of the 2010 First IEEE International Conference on Smart Grid Communications (SmartGridComm), Gaithersburg, MD, USA, 4–6 October 2010.
  26. SmartGridCity Pricing Plan Comparison Chart. Availabe online: http://smartgridcity.xcelenergy.com/media/pdf/SGC-pricing-plan-chart.pdf (accessed on 8 May 2016).
  27. Rohjans, S.; Uslar, M.; Bleiker, R.; González, J.; Specht, M.; Suding, T.; Weidelt, T. Survey of smart grid standardization studies and recommendations. In Proceedings of the 2010 First IEEE International Conference on Smart grid Communications (SmartGridComm), Gaithersburg, MD, USA, 4–6 October 2010.
  28. Albadi, M.H.; El-Saadany, E. A summary of demand response in electricity markets. Electr. Power Syst. Res. 2008, 78, 1989–1996. [Google Scholar] [CrossRef]
  29. Vardakas, J.S.; Zorba, N.; Verikoukis, C.V. A survey on demand response programs in smart grids: Pricing methods and optimization algorithms. Commun. Surv. Tutor. IEEE 2015, 17, 152–178. [Google Scholar] [CrossRef]
  30. Su, W.; Eichi, H.; Zeng, W.; Chow, M.-Y. A survey on the electrification of transportation in a smart grid environment. IEEE Trans. Ind. Inform. 2012, 8, 1–10. [Google Scholar] [CrossRef]
  31. Gungor, V.C.; Lambert, F.C. A survey on communication networks for electric system automation. Comput. Netw. 2006, 50, 877–897. [Google Scholar] [CrossRef]
  32. Akyol, B.; Kirkham, H.; Clements, S.; Hadley, M. A Survey of Wireless Communications for the Electric Power System; Pacific Northwest National Laboratory: Richland, WA, USA, 2010. [Google Scholar]
  33. Wang, W.; Xu, Y.; Khanna, M. A survey on the communication architectures in smart grid. Comput. Netw. 2011, 55, 3604–3629. [Google Scholar] [CrossRef]
  34. Alizadeh, M.; Li, X.; Wang, Z.; Scaglione, A.; Melton, R. Demand-side management in the smart grid: Information processing for the power switch. EIEEE Signal Process. Mag. 2012, 29, 55–67. [Google Scholar] [CrossRef]
  35. Benefits of Demand Response in Electricity Markets and Recommendations for Achieving Them; A report to the United States Congress Pursuant to Section 1252 of the Energy Policy Act of 2005; U.S. Department of Energy: Washington, DC, USA, January 2006.
  36. Mohagheghi, S.; Yang, F.; Falahati, B. Impact of demand response on distribution system reliability. In Proceedings of the 2011 IEEE Power and Energy Society General Meeting, Michigan, MI, USA, 24–29 July 2011.
  37. Moghaddas Tafreshi, S.M.; Saliminia Lahiji, A. Long-term market equilibrium in smart grid paradigm with introducing demand response provider in competition. IEEE Trans. Smart Grid 2015, 6, 2794–2806. [Google Scholar] [CrossRef]
  38. Ardakanian, O.; Keshav, S.; Rosenberg, C. Markovian models for home electricity consumption. In Proceedings of the 2nd ACM SIGCOMM Workshop on Green Networking, Toronto, ON, Canada, 15–19 August 2011.
  39. Labeeuw, W.; Stragier, J.; Deconinck, G. Potential of active demand reduction with residential wet appliances: A case study for Belgium. IEEE Trans. Smart Grid 2015, 6, 315–323. [Google Scholar] [CrossRef]
  40. Richardson, I.; Thomson, M.; Infield, D.; Delahunty, A. Domestic lighting: A high-resolution energy demand model. Energy Build. 2009, 41, 781–789. [Google Scholar] [CrossRef] [Green Version]
  41. Richardson, I.; Thomson, M.; Infield, D.; Clifford, C. Domestic electricity use: A high-resolution energy demand model. Energy Build. 2010, 42, 1878–1887. [Google Scholar] [CrossRef] [Green Version]
  42. Richardson, I.T. Domestic Electricity Demand Model-Simulation Example. Availabe online: https://dspace.lboro.ac.uk/dspace-jspui/handle/2134/5786 (accessed on 19 May 2016).
  43. Electric Power Monthly with Data for August 2015. Availabe online: http://www.eia.gov/electricity/monthly/current_year/february2015.pdf (accessed on 19 May 2016).
  44. Samad, T.; Kiliccote, S. Smart grid technologies and applications for the industrial sector. Comput. Chem. Eng. 2012, 47, 76–84. [Google Scholar] [CrossRef]
  45. Alcázar-Ortega, M.; Álvarez-Bel, C.; Escrivá-Escrivá, G.; Domijan, A. Evaluation and assessment of demand response potential applied to the meat industry. Appl. Energy 2012, 92, 84–91. [Google Scholar] [CrossRef]
  46. Motegi, N.; Piette, M.A.; Watson, D.S.; Kiliccote, S.; Xu, P. Introduction to Commercial Building Control Strategies and Techniques for Demand Response; Lawrence Berkeley National Laboratory: Berkeley, CA, USA, 2007. [Google Scholar]
  47. Alcázar-Ortega, M.; Escrivá-Escrivá, G.; Segura-Heras, I. Methodology for validating technical tools to assess customer demand response: Application to a commercial customer. Energy Convers. Manag. 2011, 52, 1507–1511. [Google Scholar] [CrossRef]
  48. Palensky, P.; Dietrich, D. Demand side management: Demand response, intelligent energy systems, and smart loads. IEEE Trans. Ind. Inform. 2011, 7, 381–388. [Google Scholar] [CrossRef]
  49. Xiong, G.; Chen, C.; Kishore, S.; Yener, A. Smart (in-home) power scheduling for demand response on the smart grid. In Proceedings of the Innovative Smart Grid Technologies (ISGT), 2011 IEEE PES, Hilton Anaheim, CA, 17–19 January 2011.
  50. Idaho Power Company. Availabe online: https://www.idahopower.com/EnergyEfficiency/Residential/Programs/ACCoolCredit/default.cfm (accessed on 8 May 2016).
  51. Kim, B.-G.; Zhang, Y.; van der Schaar, M.; Lee, J.-W. Dynamic pricing and energy consumption scheduling with reinforcement learning. IEEE Trans. Smart Grid 2015. [Google Scholar] [CrossRef]
  52. Kwac, J.; Rajagopal, R. Data-driven targeting of customers for demand response. IEEE Trans. Smart Grid 2016. [Google Scholar] [CrossRef]
  53. Hassan, N.U.; Khalid, Y.; Yuen, C.; Tushar, W. Customer engagement plans for peak load reduction in residential smart grids. IEEE Trans. Smart Grid 2015, 6, 3029–3041. [Google Scholar] [CrossRef]
  54. Steen, D.; Tuan, L.A.; Carlson, O. Effects of network tariffs on residential distribution systems and price-responsive customers under hourly electricity pricing. IEEE Trans. Smart Grid 2016, 7, 617–626. [Google Scholar] [CrossRef]
  55. Aalami, H.; Moghaddam, M.P.; Yousefi, G. Demand response modeling considering interruptible/curtailable loads and capacity market programs. Appl. Energy 2010, 87, 243–250. [Google Scholar] [CrossRef]
  56. O’Brien, G.; El Gamal, A.; Rajagopal, R. Shapley value estimation for compensation of participants in demand response programs. IEEE Trans. Smart Grid 2015, 6, 2837–2844. [Google Scholar] [CrossRef]
  57. Yao, E.; Samadi, P.; Wong, V.W.; Schober, R. Residential demand side management under high penetration of rooftop photovoltaic units. IEEE Trans. Smart Grid 2016, 7, 1597–1608. [Google Scholar] [CrossRef]
  58. Ragnarsson, E. Price it right: Household response to a time-of-use electricity pricing experiment in Auckland, New Zealand. Master’s Thesis, University of Otago, Dunedin, New Zealand, 2012. [Google Scholar]
  59. Faruqui, A.; Sergici, S.; Sharif, A. The impact of informational feedback on energy consumption—A survey of the experimental evidence. Energy 2010, 35, 1598–1608. [Google Scholar] [CrossRef]
  60. Feng, D.; Sun, T.; Fang, C.; Shi, Y.; Xu, S. Optimal Demand Contracting Strategy Under Uncertainty and Its Implication for Advanced Pricing. IEEE Trans. Smart Grid 2016. [Google Scholar] [CrossRef]
  61. Samadi, P.; Mohsenian-Rad, H.; Schober, R.; Wong, V.W. Advanced demand side management for the future smart grid using mechanism design. IEEE Trans. Smart Grid 2012, 3, 1170–1180. [Google Scholar] [CrossRef]
  62. Huang, H.; Li, F.; Mishra, Y. Modeling dynamic demand response using monte carlo simulation and interval mathematics for boundary estimation. IEEE Trans. Smart Grid 2015, 6, 2704–2713. [Google Scholar] [CrossRef]
  63. Eksin, C.; Deliç, H.; Ribeiro, A. Demand response management in smart grids with heterogeneous consumer preferences. IEEE Trans. Smart Grid 2015, 6, 3082–3094. [Google Scholar] [CrossRef]
  64. Wang, Z.; Paranjape, R. Optimal residential demand response for multiple heterogeneous homes with real-time price prediction in ashould be a spacemultiagent framework. IEEE Trans. Smart Grid 2015. [Google Scholar] [CrossRef]
  65. Namerikawa, T.; Okubo, N.; Sato, R.; Okawa, Y.; Ono, M. Real-time pricing mechanism for electricity market with built-in incentive for participation. IEEE Trans. Smart Grid 2015, 6, 2714–2724. [Google Scholar] [CrossRef]
  66. Mojica-Nava, E.; Barreto, C.; Quijano, N. Population games methods for distributed control of microgrids. IEEE Trans. Smart Grid 2015, 6, 2586–2595. [Google Scholar] [CrossRef]
  67. Xu, Z.; Hu, Z.; Song, Y.; Wang, J. Risk-averse optimal bidding strategy for demand-side resource aggregators in day-ahead electricity markets under uncertainty. IEEE Trans. Smart Grid 2015. [Google Scholar] [CrossRef]
  68. McNamara, P.; McLoone, S. Hierarchical demand response for peak minimization using dantzig-wolfe decomposition. IEEE Trans. Smart Grid 2015, 6, 2807–2815. [Google Scholar] [CrossRef]
  69. Wei, W.; Liu, F.; Mei, S. Energy pricing and dispatch for smart grid retailers under demand response and market price uncertainty. IEEE Trans. Smart Grid 2015, 6, 1364–1374. [Google Scholar] [CrossRef]
  70. Moradzadeh, B.; Tomsovic, K. Two-stage residential energy management considering network operational constraints. IEEE Trans. Smart Grid 2013, 4, 2339–2346. [Google Scholar] [CrossRef]
  71. Tsai, S.-C.; Tseng, Y.-H.; Chang, T.-H. Communication-efficient distributed demand response: A randomized admm approach. IEEE Trans. Smart Grid 2016. [Google Scholar] [CrossRef]
  72. Parvania, M.; Fotuhi-Firuzabad, M. Demand response scheduling by stochastic SCUC. IEEE Trans. Smart Grid 2010, 1, 89–98. [Google Scholar] [CrossRef]
  73. Shad, M.; Momeni, A.; Errouissi, R.; Diduch, C.P.; Kaye, M.E.; Chang, L. Identification and estimation for electric water heaters in direct load control programs. IEEE Trans. Smart Grid 2015. [Google Scholar] [CrossRef]
  74. Braithwait, S. Behavior modification. IEEE Power Energy Mag. 2010, 8, 36–45. [Google Scholar] [CrossRef]
  75. Berger, A.W.; Schweppe, F.C. Real time pricing to assist in load frequency control. IEEE Trans. Power Syst. 1989, 4, 920–926. [Google Scholar] [CrossRef]
  76. Safdarian, A.; Fotuhi-Firuzabad, M.; Lehtonen, M. A distributed algorithm for managing residential demand response in smart grids. IEEE Trans. Ind. Inform. 2014, 10, 2385–2393. [Google Scholar] [CrossRef]
  77. Chang, T.-H.; Alizadeh, M.; Scaglione, A. Real-time power balancing via decentralized coordinated home energy scheduling. IEEE Trans. Smart Grid 2013, 4, 1490–1504. [Google Scholar] [CrossRef]
  78. Alamaniotis, M.; Bargiotas, D.; Bourbakis, N.G.; Tsoukalas, L.H. Genetic optimal regression of relevance vector machines for electricity pricing signal forecasting in smart grids. IEEE Trans. Smart Grid 2015, 6, 2997–3005. [Google Scholar] [CrossRef]
  79. Logenthiran, T.; Srinivasan, D.; Shun, T.Z. Demand side management in smart grid using heuristic optimization. IEEE Trans. Smart Grid 2012, 3, 1244–1252. [Google Scholar] [CrossRef]
  80. Deng, R.; Yang, Z.; Chen, J.; Chow, M.-Y. Load scheduling with price uncertainty and temporally-coupled constraints in smart grids. IEEE Trans. Power Syst. 2014, 29, 2823–2834. [Google Scholar] [CrossRef]
  81. Palomar, D.P.; Chiang, M. A tutorial on decomposition methods for network utility maximization. IEEE J. Sel. Areas Commun. 2006, 24, 1439–1451. [Google Scholar] [CrossRef]
  82. Shafie-khah, M.; Heydarian-Forushani, E.; Osorio, G.J.; Gil, F.A.; Aghaei, J.; Barani, M.; Catalao, J.P. Optimal behavior of electric vehicle parking lots as demand response aggregation agents. IEEE Trans. Smart Grid 2016. [Google Scholar] [CrossRef]
  83. Jiang, B.; Fei, Y. Smart home in smart microgrid: A cost-effective energy ecosystem with intelligent hierarchical agents. IEEE Trans. Smart Grid 2015, 6, 3–13. [Google Scholar] [CrossRef]
  84. Liang, Y.; He, L.; Cao, X.; Shen, Z.-J. Stochastic control for smart grid users with flexible demand. IEEE Trans. Smart Grid 2013, 4, 2296–2308. [Google Scholar] [CrossRef]
  85. Kirschen, D.S.; Strbac, G. Fundamentals of Power System Economic; John Wiley & Sons: West Sussex, UK, 2004. [Google Scholar]
  86. Ardakanian, O.; Keshav, S.; Rosenberg, C. Real-time distributed control for smart electric vehicle chargers: From a static to a dynamic study. IEEE Trans. Smart Grid 2014, 5, 2295–2305. [Google Scholar] [CrossRef]
  87. Zhang, N.; Hu, Z.; Dai, D.; Dang, S.; Yao, M.; Zhou, Y. Unit commitment model in smart grid environment considering carbon emissions trading. IEEE Trans. Smart Grid 2016, 7, 420–427. [Google Scholar] [CrossRef]
  88. Macedo, L.H.; Franco, J.F.; Rider, M.J.; Romero, R. Optimal operation of distribution networks considering energy storage devices. IEEE Trans. Smart Grid 2015, 6, 2825–2836. [Google Scholar] [CrossRef]
  89. Wang, Z.; Wu, W.; Zhang, B. A fully distributed power dispatch method for fast frequency recovery and minimal generation cost in autonomous microgrids. IEEE Trans. Smart Grid 2016, 7, 19–31. [Google Scholar] [CrossRef]
  90. Xiong, P.; Jirutitijaroen, P. A stochastic optimization formulation of unit commitment with reliability constraints. IEEE Trans. Smart Grid 2013, 4, 2200–2208. [Google Scholar] [CrossRef]
  91. Luh, P.B.; Yu, Y.; Zhang, B.; Litvinov, E.; Zheng, T.; Zhao, F.; Zhao, J.; Wang, C. Grid integration of intermittent wind generation: A Markovian approach. IEEE Trans. Smart Grid 2014, 5, 732–741. [Google Scholar] [CrossRef]
  92. Murillo-Sanchez, C.E.; Zimmerman, R.D.; Lindsay Anderson, C.; Thomas, R.J. Secure planning and operations of systems with stochastic sources, energy storage, and active demand. IEEE Trans. Smart Grid 2013, 4, 2220–2229. [Google Scholar] [CrossRef]
  93. Reddy, S.S.; Momoh, J. Realistic and transparent optimum scheduling strategy for hybrid power system. IEEE Trans. Smart Grid 2015, 6, 3114–3124. [Google Scholar] [CrossRef]
  94. Wang, Q.; Wang, J.; Guan, Y. Stochastic unit commitment with uncertain demand response. IEEE Trans. Power Syst. 2013, 28, 562–563. [Google Scholar] [CrossRef]
  95. Tumuluru, V.K.; Huang, Z.; Tsang, D.H. Integrating price responsive demand into the unit commitment problem. IEEE Trans. Smart Grid 2014, 5, 2757–2765. [Google Scholar] [CrossRef]
  96. Mahmoodi, M.; Shamsi, P.; Fahimi, B. Economic dispatch of a hybrid microgrid with distributed energy storage. IEEE Trans. Smart Grid 2015, 6, 2607–2614. [Google Scholar] [CrossRef]
  97. Wang, T.; O'Neill, D.; Kamath, H. Dynamic control and optimization of distributed energy resources in a microgrid. IEEE Trans. Smart Grid 2015, 6, 2884–2894. [Google Scholar] [CrossRef]
  98. Olivares, D.E.; Lara, J.D.; Cañizares, C.A.; Kazerani, M. Stochastic-predictive energy management system for isolated microgrids. IEEE Trans. Smart Grid 2015, 6, 2681–2693. [Google Scholar] [CrossRef]
  99. Bertsimas, D.; Litvinov, E.; Sun, X.A.; Zhao, J.; Zheng, T. Adaptive robust optimization for the security constrained unit commitment problem. IEEE Trans. Power Syst. 2013, 28, 52–63. [Google Scholar] [CrossRef]
  100. Zhao, C.; Wang, J.; Watson, J.-P.; Guan, Y. Multi-stage robust unit commitment considering wind and demand response uncertainties. IEEE Trans. Power Syst. 2013, 28, 2708–2717. [Google Scholar] [CrossRef]
  101. Yu, Y.; Luh, P.B.; Litvinov, E.; Zheng, T.; Zhao, J.; Zhao, F. Grid integration of distributed wind generation: hybrid markovian and interval unit commitment. IEEE Trans. Smart Grid 2015, 6, 3061–3072. [Google Scholar] [CrossRef]
  102. Zhang, N.; Kang, C.; Xia, Q.; Ding, Y.; Huang, Y.; Sun, R.; Huang, J.; Bai, J. A convex model of risk-based unit commitment for day-ahead market clearing considering wind power uncertainty. IEEE Trans. Power Syst. 2015, 30, 1582–1592. [Google Scholar] [CrossRef]
  103. Asensio, M.; Contreras, J. Stochastic unit commitment in isolated systems with renewable penetration under cvar assessment. IEEE Trans. Smart Grid 2016, 7, 1356–1367. [Google Scholar] [CrossRef]
  104. Kumar Nunna, H.; Doolla, S. Energy management in microgrids using demand response and distributed storage—A multiagent approach. IEEE Trans. Power Deliv. 2013, 28, 939–947. [Google Scholar] [CrossRef]
  105. Xiao, L.; Mandayam, N.B.; Poor, H.V. Prospect theoretic analysis of energy exchange among microgrids. IEEE Trans. Smart Grid 2015, 6, 63–72. [Google Scholar] [CrossRef]
  106. Su, W.; Wang, J.; Roh, J. Stochastic energy scheduling in microgrids with intermittent renewable energy resources. IEEE Trans. Smart Grid 2014, 5, 1876–1883. [Google Scholar] [CrossRef]
  107. Yang, Z.; Wu, R.; Yang, J.; Long, K.; You, P. Economical operation of microgrid with various devices via distributed optimization. IEEE Trans. Smart Grid 2016, 7, 857–867. [Google Scholar] [CrossRef]
  108. Han, J.; Khushalani-Solanki, S.; Solanki, J.; Liang, J. Adaptive critic design-based dynamic stochastic optimal control design for a microgrid with multiple renewable resources. IEEE Trans. Smart Grid 2015, 6, 2694–2703. [Google Scholar] [CrossRef]
  109. Chen, Y.-W.; Chang, J.M. EMaaS: Cloud-based energy management service for distributed renewable energy integration. IEEE Trans. Smart Grid 2015, 6, 2816–2824. [Google Scholar] [CrossRef]
  110. Safdarian, A.; Fotuhi-Firuzabad, M.; Lehtonen, M.; Aminifar, F. Optimal electricity procurement in smart grids with autonomous distributed energy resources. IEEE Trans. Smart Grid 2015, 6, 2975–2984. [Google Scholar] [CrossRef]
  111. La, Q.D.; Chan, Y.W.E.; Soong, B.-H. Power management of intelligent buildings facilitated by smart grid: A market approach. IEEE Trans. Smart Grid 2016, 7, 1389–1400. [Google Scholar] [CrossRef]
  112. La, Q.D.; Chan, Y.W.E.; Soong, B.-H. Dynamic market for distributed energy resources in the Smart Grid. In Proceedings of the 2014 IEEE 11th Consumer Communications and Networking Conference (CCNC), Losvegas, NV, USA, 10–13 January 2014.
  113. Nguyen, H.K.; Mohsenian-Rad, H.; Khodaei, A.; Han, Z. Decentralized reactive power compensation using nash bargaining solution. IEEE Trans. Smart Grid 2016. [Google Scholar] [CrossRef]
  114. Rahimi, F.A.; Ipakchi, A. Transactive energy techniques: closing the gap between wholesale and retail markets. Electr. J. 2012, 25, 29–35. [Google Scholar] [CrossRef]
  115. GridWise Transactive Energy Framework (Version 1.0); Pacific Northwest National Laboratory (PNNL): Richland, WA, USA, 2015.
  116. Kok, K.; Widergren, S. A society of devices: Integrating intelligent distributed resources with transactive energy. IEEE Power Energy Mag. 2016, 14, 34–45. [Google Scholar] [CrossRef]
  117. Tang, W.; Jain, R. Dynamic economic dispatch game: The value of storage. IEEE Trans. Smart Grid 2016. [Google Scholar] [CrossRef]
  118. Kwon, S.; Xu, Y.; Gautam, N. Meeting inelastic demand in systems with storage and renewable sources. IEEE Trans. Smart Grid 2016. [Google Scholar] [CrossRef]
  119. Richardson, D.B. Electric vehicles and the electric grid: A review of modeling approaches, Impacts, and renewable energy integration. Renew. Sustain. Energy Rev. 2013, 19, 247–254. [Google Scholar] [CrossRef]
  120. Jorgensen, K. Technologies for electric, hybrid and hydrogen vehicles: Electricity from renewable energy sources in transport. Util. Policy 2008, 16, 72–79. [Google Scholar] [CrossRef]
  121. Pelletier, S.; Jabali, O.; Laporte, G. Battery Electric Vehicles for Goods Distribution: A Survey of Vehicle Technology, Market Penetration, Incentives and Practices. Availabe online: https://www.cirrelt.ca/DocumentsTravail/CIRRELT-2014-43.pdf (accessed on 19 May 2016).
  122. Tie, S.F.; Tan, C.W. A review of energy sources and energy management system in electric vehicles. Renew. Sustain. Energy Rev. 2013, 20, 82–102. [Google Scholar] [CrossRef]
  123. Morrow, K.; Karner, D.; Francfort, J. Plug-in Hybrid Electric Vehicle Charging Infrastructure Review; Battelle Energy Alliance: Idaho Falls, ID, USA, 2008. [Google Scholar]
  124. Neubauer, J.; Brooker, A.; Wood, E. Sensitivity of battery electric vehicle economics to drive patterns, vehicle range, and charge strategies. J. Power Sources 2012, 209, 269–277. [Google Scholar] [CrossRef]
  125. National Houshold Travel Survey. Availabe online: http://nhts.ornl.gov/2009/pub/stt.pdf (accessed on 8 May 2016).
  126. Jabeen, F.; Olaru, D.; Smith, B.; Braunl, T.; Speidel, S. Electric vehicle battery charging behaviour: findings from a driver survey. In Proceedings of the Australasian Transport Research Forum 2013, Brisbane, Australia, 2–4 October 2013.
  127. Xi, X.; Sioshansi, R.; Marano, V. Simulation–optimization model for location of a public electric vehicle charging infrastructure. Transp. Res. Part D Transp. Env. 2013, 22, 60–69. [Google Scholar] [CrossRef]
  128. Plötz, P.; Gnann, T.; Wietschel, M. Total ownership cost projection for the German electric vehicle market with implications for its future power and electricity demand. In Proceedings of the 7th Conference on Energy Economics and Technology Infrastructure for the Energy Transformation, Dresden, Germany, 27 April 2012.
  129. Al-Alawi, B.M.; Bradley, T.H. Total cost of ownership, payback, and consumer preference modeling of plug-in hybrid electric vehicles. Appl. Energy 2013, 103, 488–506. [Google Scholar] [CrossRef]
  130. Dumortier, J.; Siddiki, S.; Carley, S.; Cisney, J.; Krause, R.M.; Lane, B.W.; Rupp, J.A.; Graham, J.D. Effects of providing total cost of ownership information on consumers’ intent to purchase a hybrid or plug-in electric vehicle. Transp. Res. Part A Policy Pract. 2015, 72, 71–86. [Google Scholar] [CrossRef] [Green Version]
  131. Al-Alawi, B.M.; Bradley, T.H. Review of hybrid, plug-in hybrid, and electric vehicle market modeling Studies. Renew. Sustain. Energy Rev. 2013, 21, 190–203. [Google Scholar] [CrossRef]
  132. Rezvani, Z.; Jansson, J.; Bodin, J. Advances in consumer electric vehicle adoption research: A review and research agenda. Transp. Res. Part D Transp. Environ. 2015, 34, 122–136. [Google Scholar] [CrossRef]
  133. Tuttle, D.P.; Baldick, R. The evolution of plug-in electric vehicle-grid interactions. IEEE Trans. Smart Grid 2012, 3, 500–505. [Google Scholar] [CrossRef]
  134. SAE Standard on EV Charging Connector Approved. Availabe online: http://www.sae.org/mags/AEI/7479 (accessed on 8 May 2016).
  135. Pasaoglu, G.; Thiel, C.; Martino, A.; Zubaryeva, A.; Fiorello, D.; Zani, L. Projections for Electric Vehicle Load Profiles in Europe Based on Travel Survey Data; Joint Research Centre of the European Commission: Petten, The Netherlands, 2013. [Google Scholar]
  136. Weiller, C. Plug-in hybrid electric vehicle impacts on hourly electricity demand in the United States. Energy Policy 2011, 39, 3766–3778. [Google Scholar] [CrossRef]
  137. Wu, D.; Aliprantis, D.C.; Gkritza, K. Electric energy and power consumption by light-duty plug-in electric vehicles. IEEE Trans. Power Syst. 2011, 26, 738–746. [Google Scholar] [CrossRef]
  138. Sun, K.; Sarker, M.R.; Ortega-Vazquez, M.A. Statistical characterization of electric vehicle charging in different locations of the grid. In Proceedings of the 2015 IEEE Power & Energy Society General Meeting, Denver, CO, USA, 26–30 July 2015.
  139. Axsen, J.; Bailey, H.J.; Kamiya, G. The Canadian Plug-in Electric Vehicle Survey (CPEVS 2013): Anticipating Purchase, Use, and Grid Interactions in British Columbia; Energy and Materials Research Group, School of Resource and Environmental Management, Simon Fraser University: Burnaby, BC, Canada, 2013. [Google Scholar]
  140. Tudor, C.; Sprung, E.; Nguyen, L.; Tatro, R. Plug-in & hybrid electric vehicle charging impacts: A survey of California’s utility companies. In Proceedings of the 2012 IEEE 13th International Conference on Information Reuse and Integration (IRI), Las Vegas, NV, USA, 8–10 August 2012.
  141. Xiao, H.; Huimei, Y.; Chen, W.; Hongjun, L. A survey of influence of electrics vehicle charging on power grid. In Proceedings of the 2014 9th IEEE Conference on Industrial Electronics and Applications, Hangzhou, China, 9–11 June 2014.
  142. Putrus, G.; Suwanapingkarl, P.; Johnston, D.; Bentley, E.; Narayana, M. Impact of electric vehicles on power distribution networks. In Proceedings of the 2009 IEEE Vehicle Power and Propulsion Conference, Dearborn, MI, USA, 7–10 September 2009.
  143. Gómez, J.C.; Morcos, M.M. Impact of EV battery chargers on the power quality of distribution systems. IEEE Trans. Power Deliv. 2003, 18, 975–981. [Google Scholar] [CrossRef]
  144. Kuss, M.C.; Markel, A.J.; Kramer, W.E. Application of Distribution Transformer Thermal Life Models to Electrified Vehicle Charging Loads Using Monte-carlo Method: Preprint; National Renewable Energy Laboratory: Shenzhen, China, 2011. [Google Scholar]
  145. Hilshey, A.D.; Hines, P.D.; Rezaei, P.; Dowds, J.R. Estimating the impact of electric vehicle smart charging on distribution transformer aging. IEEE Trans. Smart Grid 2013, 4, 905–913. [Google Scholar] [CrossRef]
  146. Liu, R.; Dow, L.; Liu, E. A survey of PEV impacts on electric utilities. In Proceedings of the Innovative Smart Grid Technologies (ISGT), 2011 IEEE PES, Hilton Anaheim, CA, USA, 17–19 January 2011.
  147. Clement-Nyns, K.; Haesen, E.; Driesen, J. The impact of charging plug-in hybrid electric vehicles on a residential distribution grid. IEEE Trans. Power Syst. 2010, 25, 371–380. [Google Scholar] [CrossRef] [Green Version]
  148. Fernandez, L.P.; Román, T.G.S.; Cossent, R.; Domingo, C.M.; Frias, P. Assessment of the impact of plug-in electric vehicles on distribution networks. IEEE Trans. Power Syst. 2011, 26, 206–213. [Google Scholar] [CrossRef]
  149. Davis, B.M.; Bradley, T.H. The efficacy of electric vehicle time-of-use rates in guiding plug-in hybrid electric vehicle charging behavior. IEEE Trans. Smart Grid 2012, 3, 1679–1686. [Google Scholar] [CrossRef]
  150. de Hoog, J.; Alpcan, T.; Brazil, M.; Thomas, D.A.; Mareels, I. A Market Mechanism for Electric Vehicle Charging Under Network Constraints. IEEE Trans. Smart Grid 2016, 7, 827–836. [Google Scholar] [CrossRef]
  151. Kuran, M.S.; Viana, A.C.; Iannone, L.; Kofman, D.; Mermoud, G.; Vasseur, J.P. A Smart Parking Lot Management System for Scheduling the Recharging of Electric Vehicles. IEEE Trans. Smart Grid 2015, 6, 2942–2953. [Google Scholar] [CrossRef]
  152. Dallinger, D.; Wietschel, M. Grid integration of intermittent renewable energy sources using price-responsive plug-in electric vehicles. Renew. Sustain. Energy Rev. 2012, 16, 3370–3382. [Google Scholar] [CrossRef]
  153. Kempton, W.; Letendre, S.E. Electric vehicles as a new power source for electric utilities. Transp. Res. Part D Transp. Environ. 1997, 2, 157–175. [Google Scholar] [CrossRef]
  154. Peterson, S.B.; Whitacre, J.; Apt, J. The economics of using plug-in hybrid electric vehicle battery packs for grid storage. J. Power Sources 2010, 195, 2377–2384. [Google Scholar] [CrossRef]
  155. Lunz, B.; Yan, Z.; Gerschler, J.B.; Sauer, D.U. Influence of plug-in hybrid electric vehicle charging strategies on charging and battery degradation costs. Energy Policy 2012, 46, 511–519. [Google Scholar] [CrossRef]
  156. Bessa, R.J.; Matos, M.A. Economic and technical management of an aggregation agent for electric vehicles: A literature survey. Europ. Trans. Electr. Power 2012, 22, 334–350. [Google Scholar] [CrossRef]
  157. Nafisi, H.; Agah, S.M.M.; Askarian Abyaneh, H.; Abedi, M. Two-stage optimization method for energy loss minimization in microgrid based on smart power management scheme of PHEVs. IEEE Trans. Smart Grid 2016, 7, 1268–1276. [Google Scholar] [CrossRef]
  158. Birnie, D.P. Solar-to-vehicle (S2V) systems for powering commuters of the future. J. Power Sources 2009, 186, 539–542. [Google Scholar] [CrossRef]
  159. Wei, W.; Liu, F.; Mei, S. Charging strategies of EV aggregator under renewable generation and congestion: A normalized nash equilibrium approach. IEEE Trans. Smart Grid 2016, 7, 1630–1641. [Google Scholar] [CrossRef]
  160. Brooks, A.; Thesen, S.H. PG&E and tesla motors: Vehicle to grid demonstration and evaluation program. In Proceedings of the 23rd International Electric Vehicle Symposium and Exposition 2007, Anaheim, CA, USA, 2–5 December 2007.
  161. Kempton, W.; Tomić, J. Vehicle-to-grid power implementation: From stabilizing the grid to supporting large-scale renewable energy. J. Power Sources 2005, 144, 280–294. [Google Scholar] [CrossRef]
  162. Alam, M.; Muttaqi, K.M.; Sutanto, D. Effective utilization of available pev battery capacity for mitigation of solar PV impact and grid support with integrated V2G functionality. IEEE Trans. Smart Grid 2016, 7, 1562–1571. [Google Scholar] [CrossRef]
  163. Kou, P.; Liang, D.; Gao, L.; Gao, F. Stochastic coordination of plug-in electric vehicles and wind turbines in microgrid: A model predictive control approach. IEEE Trans. Smart Grid 2016, 7, 1537–1551. [Google Scholar] [CrossRef]
  164. Shao, C.; Wang, X.; Wang, X.; Du, C.; Dang, C.; Liu, S. Cooperative dispatch of wind generation and electric vehicles with battery storage capacity constraints in SCUC. IEEE Trans. Smart Grid 2014, 5, 2219–2226. [Google Scholar] [CrossRef]
Figure 1. Breakdown of electricity consumption in the US (2015) [43].
Energies 09 00405 g001
Figure 2. Category of DSM schemes based on motivation methods.
Energies 09 00405 g002
Figure 3. Categories of SSM schemes.
Energies 09 00405 g003
Table 1. Major SG implementations in the world.
OwnerLocationsProperties
IIT [17]Campus of Illinois Institute of Technology, Chicago, IL, USAReal-time reconfiguration and optimization of gas turbine.
SCU [18]Campus of Santa Clara University, Santa Clara, CA, USAResearch on solar photovoltaics, fuel cells, and micro-turbines in a SDG.
WVU [19]Etown, West Virginia University, WV, USATestbed under controlled environment for investigating new idea before integration into the larger environment.
CERTS [20,21]Columbus, OH, USA, operated by American Electric PowerTestbed developing a SDG control architecture including fuel cells, solar photovoltaics, diesel generators, a storage system, a fast static switch, and a power factor correcting capacitor bank.
UTA [22,23]University of Texas at Arlington, TX, USATestbed validating of modeling and simulation results in dynamic and transient condition and can operate in either AC or DC and in connected or autonomous mode.
Europe [24]578 projects across EuropeMostly smaller scale projects investigating the practical usage of smart metering.
PNSG [25]Five US states: Idaho, Montana, Oregon, Washington, and WyomingOne of largest SG implementations, which started in 2010 and is still in progress.
CSGC [26]Colorado Smart Grid City, Boulder, CO, USAA pilot project proposing different DSM programs allowing exploration of SG tools in a real-world environment and studying people‘s behavior.
Table 2. List of recent research on DSM.
ReferenceYearDescriptionObjective FunctionSolution methodSpecifications
D1D2D3D4D5
[51]2016Determine dynamic price considering demand (discrete Markov) and price uncertaintyMinimize customers cost and maximize retailers profitImproved Q-learning method--
[66]2015DR strategies considering both social and economic incentivesMaximize profit of each customerPopulation game----
[67]2016DA_RTP using expected regret value (Risk-based optimization, see Section 3.2)Minimize cost and regret valueLinear programing----
[71]2016Distributed DR algorithm using the randomized dual consensus alternating direction methodMinimize total cost of customersLinear program solver of MATLAB--
[68]2015Decentralized hierarchical algorithm for peak minimization of gridMinimize peak demandDantzig–Wolfe decomposition---
[52]2016A customer selection and direct control to reach desire stochastic reductionMaximize probability of reductionStochastic knapsack problem---
[53]2015Peak load reduction using DLC by adjusting the temperature setting instead of on/off controlMinimize maximum load (peak load)Suboptimal heuristic method---
[54]2016Evaluate the possible cost reduction under different flat pricing techniques in SwedenMinimize daily electricity cost of customersMixed integer linear programing-----
[57]2016A modified TOU to reduce the voltage rise problem of rooftop PV panelsMinimize modified cost functionLinear and mixed-integer programing---
[60]2016Determine the optimal demand under uncertainty using a stochastic programming modelMinimize energy bill of customersThe first-order optimality condition---
Table 3. List of recent research in SSM.
ReferenceYearDescriptionObjective FunctionSolution methodSpecifications
S1S2S3S4S5
[66]2015Active and reactive power Economic dispatch in MGMinimize cost of the whole systemReplicator dynamics
(population game)
-----
[96]2015Economic dispatchMinimize cost of the whole systemInteger programing-----
[89]2016A distributed power dispatch on island MGsMinimize generation costEqual incremental rates----
[117]2015Dynamic economic dispatch with an ESS for each generatorMinimize system cost and maximize generator profit Game theory, Nash equilibrium---
[109]2015Energy management system based on a cloud frameworkMaximize benefit of each participantLinear programing---
[110]2015A decentralized DG management to procure the system demand Minimize demand cost and maximize DGs‘ profitLinear programing---
[111,112]2014, 2016Dynamic price for an smart building with RERs, storage, and inelastic loadsMaximize the profit of each buildingCournot oligopoly----
[97]2015Source and demand scheduling in interconnected MG using internal marketMinimize total cost of generation Alternating direction method of multipliers----
[98]2015Two-stage stochastic energy management in isolated SG (UC and OPF)Minimize cost of whole systemMixed-integer linear and nonlinear programing---
[118]2016Stochastic management in interconnected SG (Markov chains) using RTPMinimize cost of energyLyapunov optimization----
Table 4. Category of EV charging strategies with their specifications.
Charging StrategyReferenceSpecification
E1E2E3E4E5
Non-smart ChargingSimple charging------
Delayed charging[149]--
Smart ChargingDirect control[65]----
[106]---
[138]----
[150]----
[151]Only for parking lots
Indirect control[67]---
[152]---

