Article

Optimal Coordinated Management of a Plug-In Electric Vehicle Charging Station under a Flexible Penalty Contract for Voltage Security

1
Power System Research Division, Korea Electrical Engineering & Science Research Institute, Bldg. 130, 1 Gwanak-ro, Gwanak-gu, Seoul 08826, Korea
2
Department of Electrical and Computer Engineering, Seoul National University, 1 Gwanak-ro, Gwanak-gu, Seoul 08826, Korea
3
School of Electrical Engineering, Korea University, 145 Anam-ro, Seongbuk-gu, Seoul 02841, Korea
*
Author to whom correspondence should be addressed.
Energies 2016, 9(7), 538; https://doi.org/10.3390/en9070538
Submission received: 30 March 2016 / Revised: 27 June 2016 / Accepted: 8 July 2016 / Published: 13 July 2016
(This article belongs to the Special Issue Decentralized Management of Energy Streams in Smart Grids)

Abstract

:
The increasing penetration of plug-in electric vehicles (PEVs) may cause a low-voltage problem in the distribution network. In particular, the introduction of charging stations where multiple PEVs are simultaneously charged at the same bus can aggravate the low-voltage problem. Unlike a distribution network operator (DNO) who has the overall responsibility for stable and reliable network operation, a charging station operator (CSO) may schedule PEV charging without consideration for the resulting severe voltage drop. Therefore, there is a need for the DNO to impose a coordination measure to induce the CSO to adjust its charging schedule to help mitigate the voltage problem. Although the current time-of-use (TOU) tariff is an indirect coordination measure that can motivate the CSO to shift its charging demand to off-peak time by imposing a high rate at the peak time, it is limited by its rigidity in that the network voltage condition cannot be flexibly reflected in the tariff. Therefore, a flexible penalty contract (FPC) for voltage security to be used as a direct coordination measure is proposed. In addition, the optimal coordinated management is formulated. Using the Pacific Gas and Electric Company (PG&E) 69-bus test distribution network, the effectiveness of the coordination was verified by comparison with the current TOU tariff.

Graphical Abstract

1. Introduction

Plug-in electric vehicles (PEVs) have been attracting interest as an alternative solution to manage the increasing amount of CO2 emission. Authorities in a number of countries have set ambitious goals for integrating a large number of PEVs [1,2]. However, the charging demands for PEVs are relatively larger than the household loads, and are inherently uncoordinated due to the unpredictable behavior of the consumers. Consequently, the high penetration of PEVs may threaten the stable and reliable operation of the distribution network. Specifically, there can be severe voltage drops, fluctuation problems, and degradation in the system efficiency [3,4,5].
To address these concerns, various PEV charging methods have been suggested from the perspective of a distribution network operator (DNO). In [6], the DNO manages the charging demands of PEVs to minimize the line losses of the distribution network. A similar charging method is suggested to minimize the line losses in [7], but it uses stochastic programming to consider the uncertainty of loads in the optimization problem. In [8], a real-time charging strategy for managing the uncoordinated and uncertain charging demands of PEVs is presented to minimize the total operating cost of the distribution network, including the line losses. In order to minimize the operating costs, the authors of [9] propose a method in which the inputs for optimization are continuously updated, and the optimization results are periodically renewed at each time step to reflect the difference between the forecasted value and the actual inputs. In the literature [6,7,8,9], the DNO directly manages the charging schedules of multiple PEVs considering the network constraints to pursue efficient and reliable operation of the distribution network. However, due to operational complexity and burden from the increasing numbers of PEVs, it seems to be difficult for the DNO to directly manage the charging of multiple PEVs in the distribution network [10,11]. Moreover, various concepts of intermediate entities that are independent of the DNO have been emerging in practice [12,13]. For these reasons, many studies assume that an intermediate entity is delegated to manage PEV charging demands. The intermediate entity does not have any responsibility for the stable and reliable operation of the distribution network, unlike the DNO, but the entity simply aims to maximize its profit with a proper method for managing the PEV charging demand [14,15,16,17]. This conflict of interest can be mitigated by various types of coordination measures. The coordination measure should enable the DNO to inform the intermediate entity of the network status or to motivate the intermediate entity to shift its charging demand to another time. However, methods for coordination between the DNO and the intermediate entity have not been thoroughly investigated in the literature.
This study assumes that the PEV charging station is located at a specific bus in the distribution network and that hundreds of PEVs request to be provided with charging service at the same station. Furthermore, it is assumed that the intermediate entity, the so-called charging station operator (CSO), is delegated to manage the charging demands of PEVs. In this circumstance, the CSO only seeks to profit from providing charging service to the PEVs without considering the stability and reliability of the distribution network. Therefore, the hundreds of PEVs in the charging station can significantly drop the voltage of the following bus in the same feeder as well as the bus where the station is located. For this reason, this study suggests a flexible penalty contract (FPC) as a coordination measure, which is designed to induce the CSO not to compromise the voltage conditions of the distribution network. In this scheme, the DNO notices hourly the recommended charging power that does not cause voltages below the lower limit for the CSO, and imposes a penalty price for exceeding the maximum power as an addition to the current electricity tariff, such as the time-of-use (TOU) rate. Furthermore, a formulation for the optimal coordinated charging management of the CSO under the FPC is proposed in this paper.
The remainder of this paper is structured as follows: Section 2 presents the needs for coordination between the CSO and the DNO and details the coordination under the FPC; Section 3 describes the mathematical formulation for the coordinated management of a PEV charging station under the proposed FPC.; in Section 4, the proposed optimal coordinated management method under the FPC is demonstrated through case studies using simulations with the Pacific Gas and Electricity Company (PG&E) 69-bus distribution network; and concluding remarks are given in Section 5.

2. Flexible Penalty Contract for Voltage Security

2.1. Need for Coordination between the Charging Station Operator and the Distribution Network Operator

In this study, it is assumed that the stakeholders in the PEV charging business are the DNO, the CSO, and a number of PEVs. The DNO generally takes responsibility for stable and reliable operation of the distribution network, and the CSO provides charging services to PEVs at a charging station in a commercial/office building. Unlike PEV charging services for households, the CSO provides a simultaneous charging service at a commercial/industrial building for a number of PEVs. Therefore, the charging service provided to PEVs mostly operates during office hours rather than at night. For this reason, the charging demands at the station may double the current electricity loads at the peak time or when a number of PEVs simultaneously try to charge at the same location. Therefore, this type of charging service can threaten the stability of the distribution network, mostly by causing severe voltage drops in the distribution network. However, the CSO currently has no responsibility for stable network operation, but simply provides charging service via the network as a large-size customer. For this reason, there is little or no motivation for the CSO to shift its charging demands to other time slots without an additional penalty or incentive scheme. Among a number of possible solutions, this study suggests a penalty contract for voltage security.

2.2. Concept of Coordinated Operation with the Flexible Penalty Contract

This study considers an FPC between the CSO and the DNO to supplement the weakness of the TOU tariff. Although the TOU is surely one solution that can induce PEV charging demands to be shifted to off-peak times from peak times, it cannot flexibly cover the voltage problems in the distribution network according to the network status. The FPC can be useful for the DNO to induce the CSO to manage its charging demands by providing information about the network status.
Specifically, under the contract scheme, the DNO calculates the maximum available power P MAX i ( t ) at bus i at the time slot t that ensures all bus voltages remain within the limits using day-ahead forecasted demand data. For simplicity, it is assumed that the charging service is provided in units of hours, and each time slot t is an element of set T, where T = { 0 , 1 , 2 , , 23 } . Additionally, it is assumed that the DNO can notify the day-ahead recommended power consumption signal P R i ( t ) instead of P MAX i ( t ) with the security margin (SM) considering the uncertainty in the charging demands of PEVs and other electricity demands. The relationship between P MAX i ( t ) and P R i ( t ) is:
P R i ( t ) = ( 1 S M ) P MAX i ( t )
where SM can be set according to the DNO’s attitude regarding the risk from uncertainty, and P MAX i ( t ) can vary depending on the hourly network conditions.
Additionally, in the case when the power demand of the charging station exceeds P R i ( t ) , the DNO will impose an additional penalty price β to the CSO for the amount that exceeds P R i ( t ) by the contract. On the contrary, if the power demand does not exceed the noticed P R i ( t ) , the CSO is charged only at the current TOU rate. With the FPC having the described structure, the rigidity of the TOU can be supplemented and the DNO can partly charge the CSO for the cost of upgrading the network.

3. Formulation for Coordinated Management of a Plug-In Electric Vehicle Charging Station under the Flexible Penalty Contract

3.1. Specifying the Flexible Penalty Contract by the Distribution Network Operator

This study proposes the FPC as a coordination scheme for managing the conflicts of interest between the DNO and CSO. Within the FPC scheme, the DNO notifies the CSO of the day-ahead recommended power consumption signal and imposes a penalty price β, if the charging demands at each time slot exceed the recommended value at that time. The day-ahead recommended power consumption signal provides the threshold of the FPC, and it can be considered as a consumption guideline for the CSO to avoid a low-voltage problem in the network. This signal can be calculated by obtaining the decision variable vector PMAX, which can be securely accommodated in the network and it varies according to the day-ahead forecast load data P L i ( t ) , Q L i ( t ) in Equation (5). Since this study does not focus on the day-ahead forecast of demand, it is assumed that P L i ( t ) , Q L i ( t ) are given data. The optimal solution for PMAX can be determined by choosing the best solution among feasible vectors satisfying the constraint Equations (5) and (6). In this study, in terms of voltage security, the criteria for choosing the best solution is designed to maximize the voltage margin (VM) of the most vulnerable bus to the low-voltage problem. In addition, the decision variable vector TP, which means the position of tap on the main transformer, and its corresponding constraint Equations (7) and (8) are considered since the DNO can also adjust the tap position of the main transformer equipped with an on-load tap changer (OLTC) to control voltages of the network. OLTC controls the secondary side voltage magnitude of the substation transformers by adjusting the tap position. Voltage magnitudes are controlled discretely according to tap step, and OLTC can generally adjust the voltage by ±10% in 16 steps, with 17 positions [18,19,20]. Therefore, the optimization problem of the DNO on specifying the FPC can be described with the objective function described in Equation (2) subject to the Equations (5)–(8) as follows:
max P M A X , T P V M min = max P M A X , T P ( min ( | V i ( t ) | V LL ) )
where the decision variable vector PMAX, TP can be represented as:
P M A X = [ P M A X 1 ,     ,    P M A X n ] = [ P MAX 1 ( 0 ) P MAX 1 ( 23 )    P MAX n ( 0 ) P MAX n ( 23 ) ]
T P = [ T P ( 0 ) ,    ,    T P ( 23 ) ] '       where    T P ( t ) { 0 , , 16 }
subject to:
  • Power flow constraints:
    P F l ( t ) + P L i ( t ) + P MAX i ( t ) = 0 ,    for   i = 1 ,    ,    n Q F l ( t ) + Q L i ( t ) = 0 ,   for   i = 1 ,    ,    n
    P F l ( t ) = | V i ( t ) | j | V j ( t ) | [ G i j cos ( δ i ( t ) δ j ( t ) ) + B i j sin ( δ i ( t ) δ j ( t ) ) ] Q F l ( t ) = | V i ( t ) | j | V j ( t ) | [ G i j sin ( δ i ( t ) δ j ( t ) ) B i j cos ( δ i ( t ) δ j ( t ) ) ]
    | V 2 ( t ) |    =    V LL + V UL    V LL N T P    1       × T P ( t )     for    t = 0 ,       , 23
  • Tap operational constraints of the main transformer:
    T | T P ( t ) T P ( t + 1 ) | N T MAX
P F l ( t ) and Q F l ( t ) are the active and reactive power flows on the distribution line l at t, and T P ( t ) is tap position of the main transformer. Voltage magnitude of the secondary side of the transformer is determined by the tap position T P ( t ) , and the relationship between tap position and the voltage is represented in Equation (7) where VUL, VLL are upper and lower voltage limits, and NTP is the number of tap levels. Equation (8) prevents the excessive operation of the tap changer by limiting the total number of tap movements to less than the maximum number of tap movements NTMAX. By including this integer variable and the operational constraints, the optimization problem for the objective function in Equation (2) subject to Equations (5)–(8) can be considered as non-linear integer programming.
Over the 24 h, P R i ( t ) varies depending on hourly demands of P L i ( t ) and Q L i ( t ) , and can be expressed as:
P R i = [ P R i ( 0 ) P R i ( 23 ) ] = ( 1 S M ) arg max P M A X i V M
As mentioned in Section 2, the penalty rate by the proposed FPC is imposed only when P CS i ( t ) exceeds P R i ( t ) , as follows:
β t = { β  if  P CS i ( t ) P R i ( t ) 0  if else
where βt should be set to be larger than the difference between the TOU rate at the peak time and at the part-peak time to be effective as a coordination measure. If not, the demand shift by the TOU overwhelms the effect from βt.

3.2. Optimal Charging Management of the Charging Station Operator under the Flexible Penalty Contract Scheme

The CSO pays the cost of using electricity to provide the charging service at the TOU tariff ρt to the DNO. In addition to the current TOU rate ρt, the CSO should pay the penalty price βt for the excess quantity when P CS i ( t ) exceeds P R i ( t ) under the FPC scheme. The signal P R i ( t ) plays a role as the connector between the DNO and the CSO and is an obtained value from Equation (9) in Section 3.1. On the other side, the CSO generates revenue by providing the charging service to PEVs at its charging station. The charging service fee is set to be a constant value μt because it is not the main concern of this study. As a rational profit-seeking entity, the CSO aims to maximize its daily profit under the FPC scheme. Therefore, the objective function for the optimal charging management of the CSO can be expressed as Equation (11), considering the revenues and costs, subject to the constraints given in Equations (15)–(17):
max ST k , i ( t ) Profit = max ST k , i ( t ) t = 0 23 [ μ t P CS i ( t ) ( ρ t P CS i ( t ) + β t ( P CS i ( t ) P R i ( t ) ) ) ]
where:
P CS i ( t ) = p PEV × N C i ( t )
N C i ( t ) = k = 1 N PEV t S T k , i ( t ) ,   S T k , i ( t ) { 0 , 1 }
N R i ( t ) = P R i ( t ) p PEV ,   x  is the largest integer less than or equal to  x
subject to:
N PEV i ( t ) N SLOT
S o C k , i ( t ) = { S o C INI k , i         for  t = 0 ,    ,    T ARR k , i 1 S o C k , i ( t 1 ) + S T k , i ( t 1 ) × p PEV c a p PEV × Δ t        for  t = T ARR k , i ,    ,    T DEP k , i
S o C REQ k , i S o C k , i ( t ) S o C MAX     for   t = T DEP k , i ,    , 23
On the basis of the assumption that every PEV is provided electricity with the same charging cables, the charging demand of the charging station at t, P CS i ( t ) , can be calculated using Equation (12), where p PEV is the rated power of the charging cable, and N C i ( t ) is the number of PEVs that are being charged at t. N C i ( t ) is expressed in Equation (13) as the sum of charging statuses of the PEVs, S T k , i ( t ) , which is a binary variable. The recommended number of PEVs being charged N R i ( t ) , for the charging station on bus i at time slot t can be represented as Equation (14). Additionally, N C i ( t ) should not exceed the number of slots procured at the charging station described in Equation (15). The state of charge (SoC) of the kth PEV, S o C k , i ( t ) before its arrival should be maintained at the given initial SoC, S o C INI k , i and the relationship between the SoC of the adjacent time slot t and t − 1 can be formulated as Equation (16) where ∆t is a size of a time slot, which is 1 h, and c a p PEV is the capacity of the PEV’s battery. Equation (17) indicates that S o C k , i ( t ) should fulfill the required SoC, S o C REQ k , i before the PEV’s departure and S o C k , i ( t ) must be smaller than the upper limit, S o C MAX .

4. Case Studies

4.1. Simulation Settings

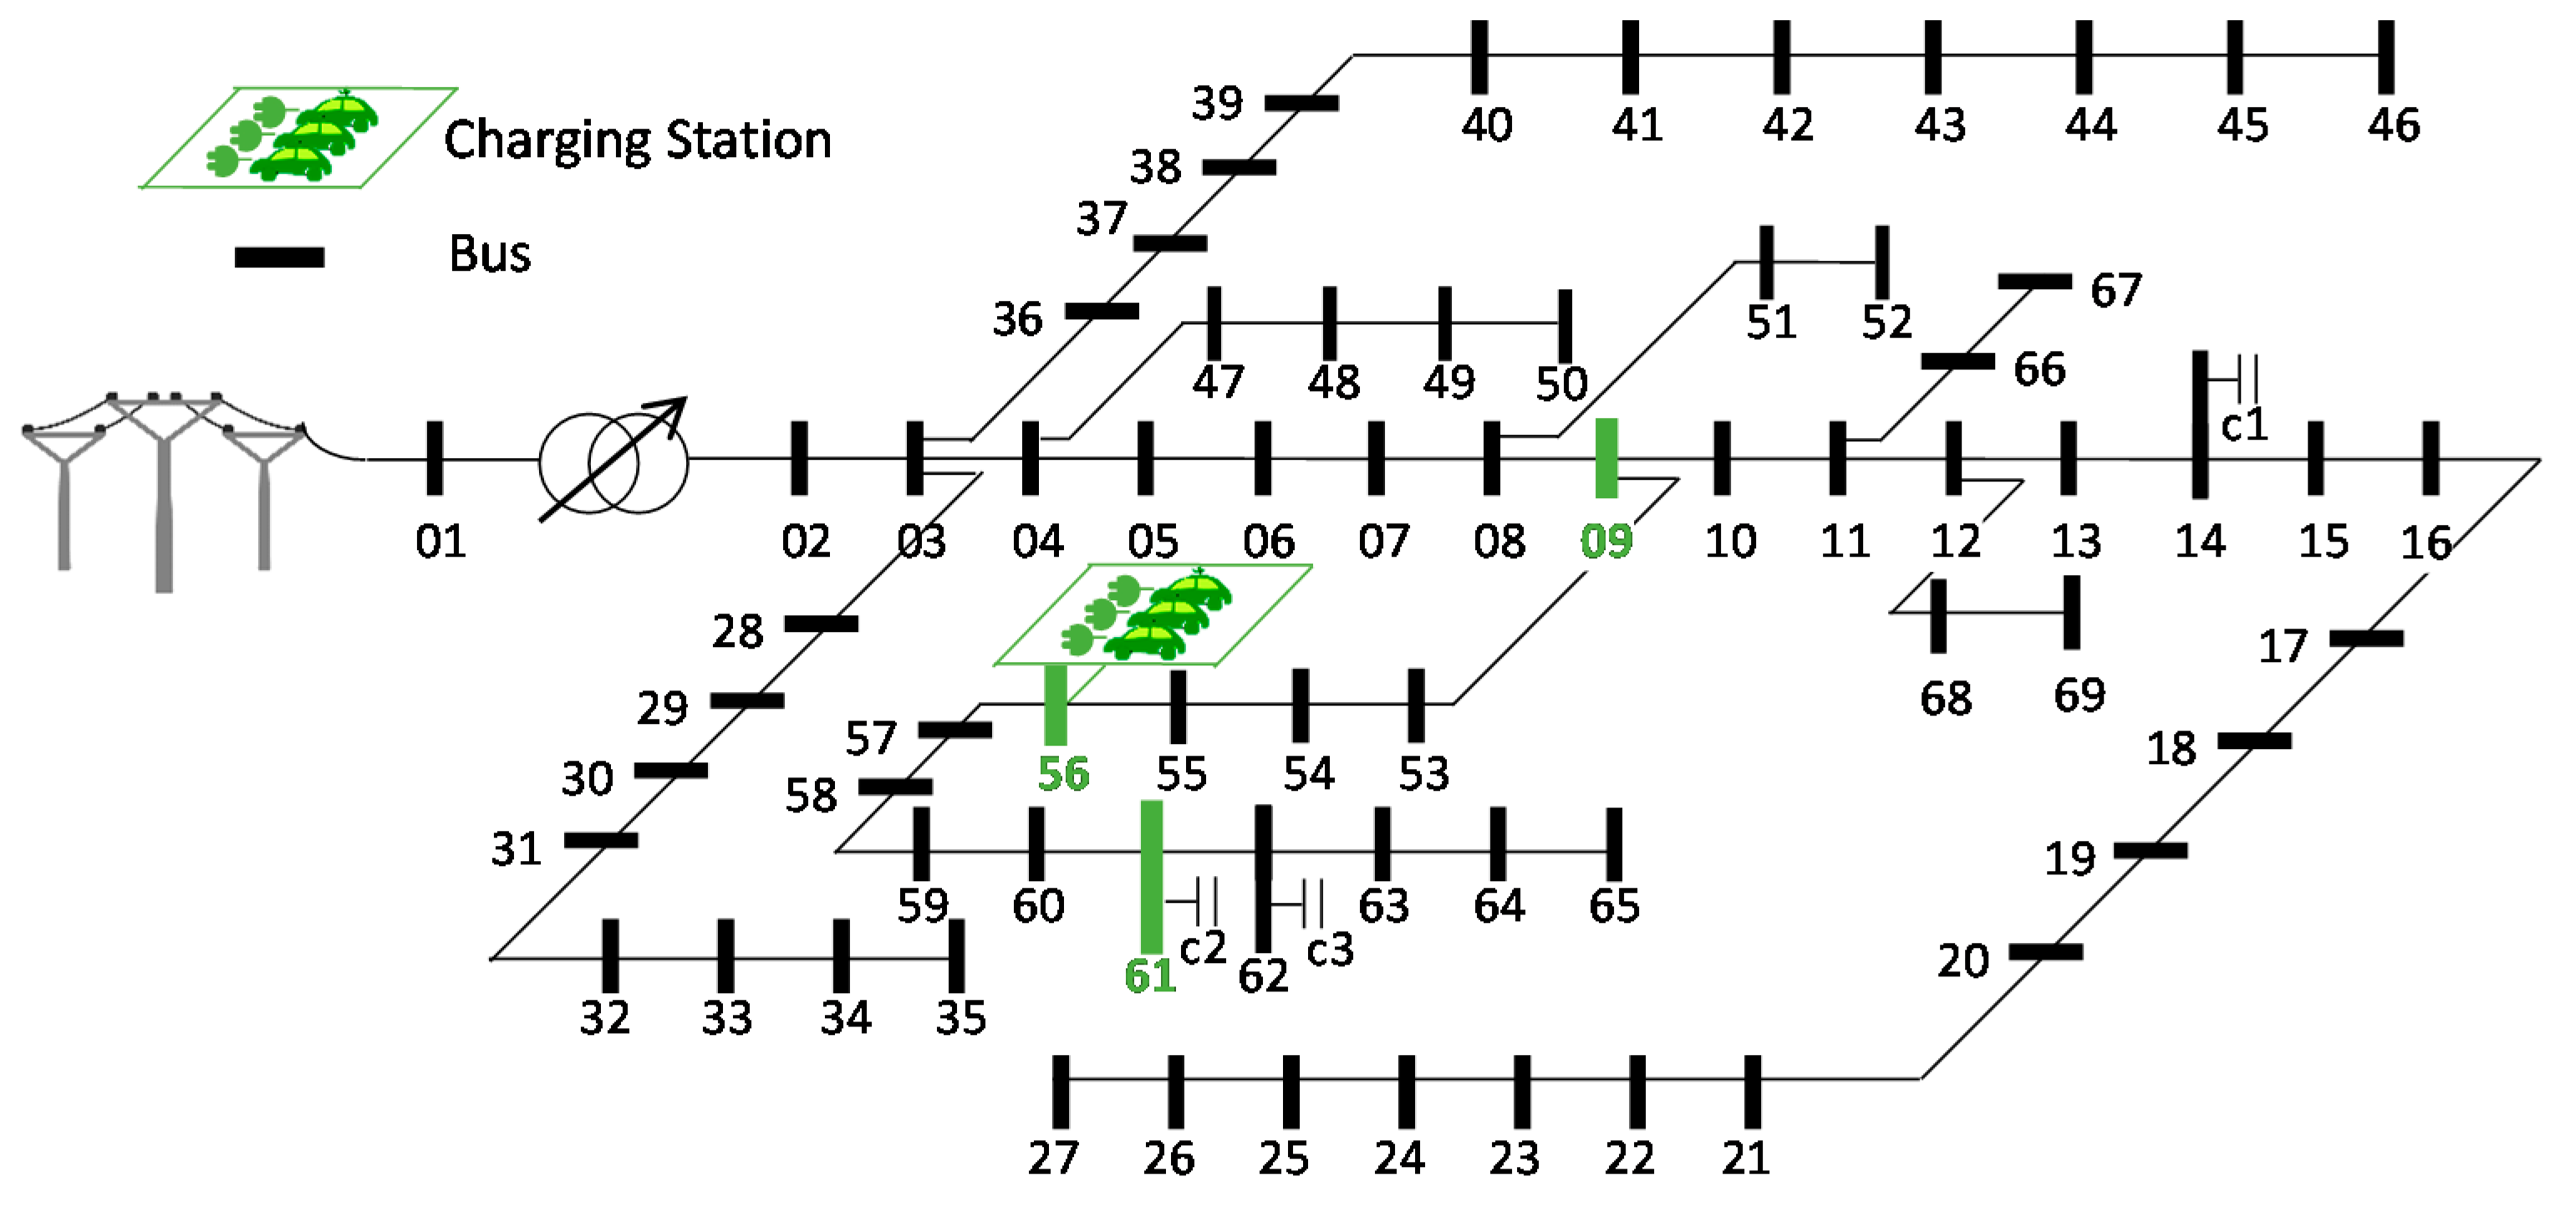
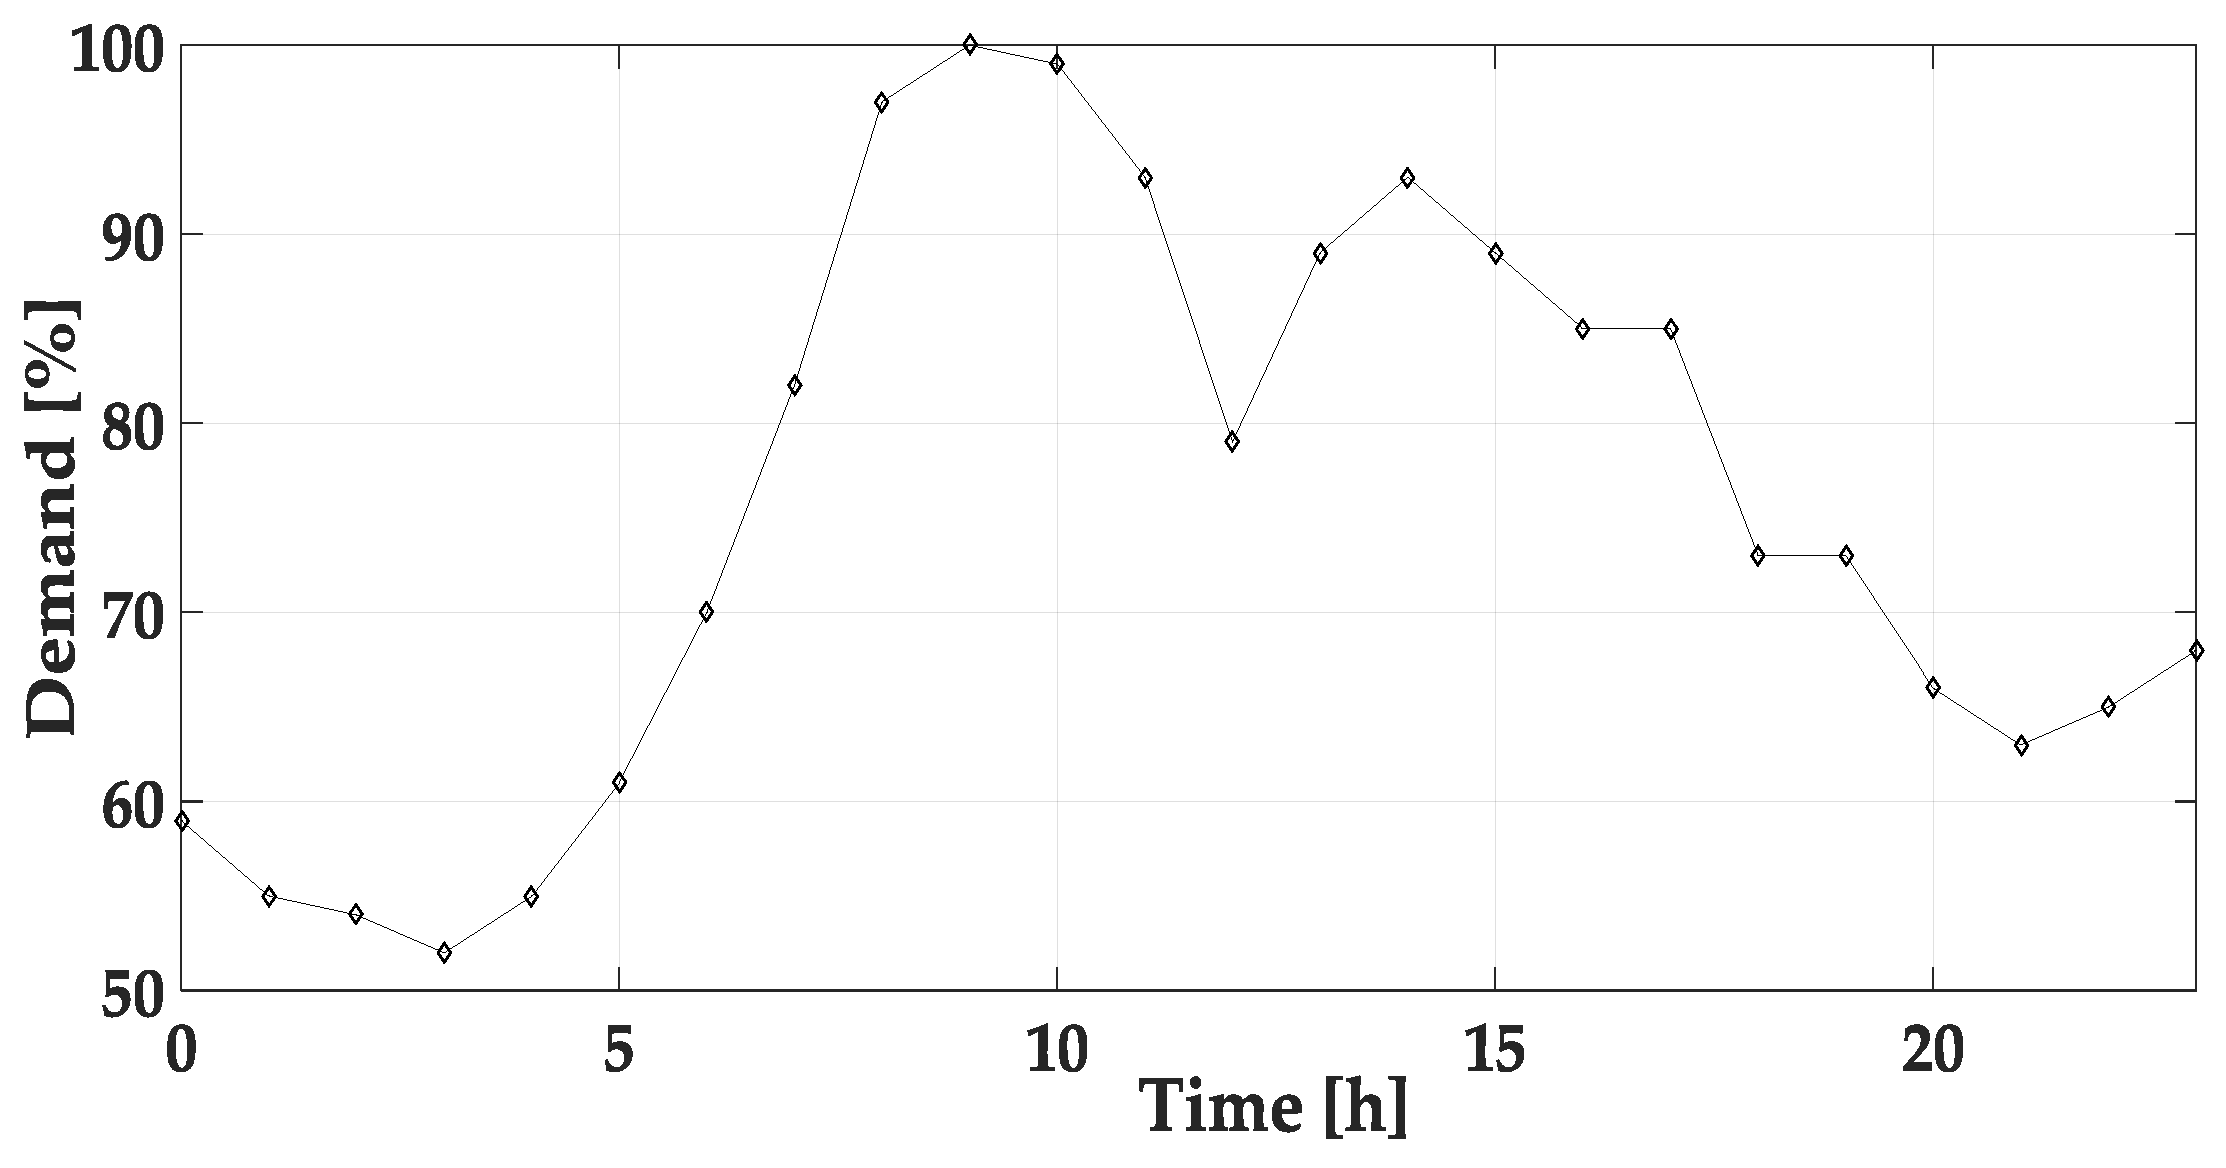
4.1.1. Network Configuration and Data

The proposed optimal coordinated management method under the FPC was demonstrated through simulations with the PG and E 69-bus test distribution network in [21]. The structure of the network is shown in Figure 1. The substation transformer located between buses 1 and 2 is equipped with OLTC, which controls the voltage magnitude of bus 2. The operating range of the OLTC was set to vary from −5% to 5%, in 16 steps, and the interval of tap movement was set to 0.625% [18,19,20]. As shown in Figure 1, three shunt capacitors are located at buses 14, 61, and 62, with capacities of 600 kVAR, 500 kVAR, and 450 kVAR, respectively. The base values of power and voltage were set to 10 MVA and 12.66 kV, respectively.
The peak demand of the network was set to 3791 kW; the forecasted hourly demands (%) in the network are shown in Figure 2 [22]. The active/reactive power demand of each bus is assumed to be distributed according to the data in [21]. It is assumed that the ratio of the forecasted hourly demand is the same for all buses.

4.1.2. Characteristic Data of the Plug-in Electric Vehicles

This simulation considered PEVs with a battery capacity of 21.6 kWh and a charging cable with a charging rate of 3.3 kW. Table A1 in the Appendix summarizes the randomly-generated information for 100 PEVs based on Table 1, including arrival and departure time, initial SoC, and required SoC. All data were generated assuming a normal distribution. The arrival time is the time when a PEV arrives at the charging station, and the departure time is the time when a PEV leaves the charging station. The initial SoC denotes the SoC of a PEV at arrival, and the required SoC indicates the level SoC that a PEV needs to reach until its departure time.

4.1.3. Time-of-use Rates for the Charging Station Operator

In this study, it is assumed that the DNO charges the CSO according to the PG and E EV E-9A TOU pricing scheme, especially for PEVs in the summer season, as summarized in Table 2 [23].

4.1.4. Others

The values of the other simulation parameters are listed in Table 3.
If the penalty price is smaller than the gaps between the TOU rates at each time (off-peak, part-peak, and on-peak), the effect of the penalty price is overwhelmed by the effect of the TOU scheme. In this case, the FPC will not be an effective supplementary scheme for the TOU with respect to the voltage security. Therefore, the penalty price must be greater than the difference between the TOU rates. For the same reason, once the penalty price is greater than the rate gap between the TOU rates, the coordination results of the CSO will almost be the same, regardless of the penalty price value. However, the CSO’s charging service cost will increase proportionally with the penalty price. Hence, the penalty price is determined to be larger than the rate gap ($0.216/kWh) between the on-peak rate ($0.361/kWh) and the part-peak rate ($0.145/kWh).

4.2. Simulation Cases

The simulation cases were configured as listed in Table 4. In order to verify the effectiveness of the proposed FPC, a comparison was conducted among three tariff conditions in each simulation case. Three simulation Cases, A, B, and C, were configured to investigate the effects of different locations of the charging station on the simulation results. In Case B, the charging station was located at bus 61, which is closer to the main substation at bus 1 compared to the location at bus 56 in Case A. In Case C, the charging station was located at bus 9, which is farther from the main substation at bus 1, compared to bus 56 in Case A.
In each simulation case, Condition I is a flat-rate tariff, which means that there is no hour-to-hour rate variation. For Condition I, the DNO has no measure to induce the CSO to shift its charging demand from peak times to other times. Condition II is the PG and E EV-9A TOU tariff. This type of tariff indirectly helps the DNO maintain network stability but cannot flexibly reflect the network status. The authors consider Condition II as a “rigid” tariff condition that is not suitable for an environment with a high penetration of PEVs. Condition III is the proposed scheme, which applies the FPC described in Section 2 and Section 3 on the basis of PG and E EV-9A TOU tariff to motivate the CSO to shift its charging demand at certain times when a voltage problem is expected.

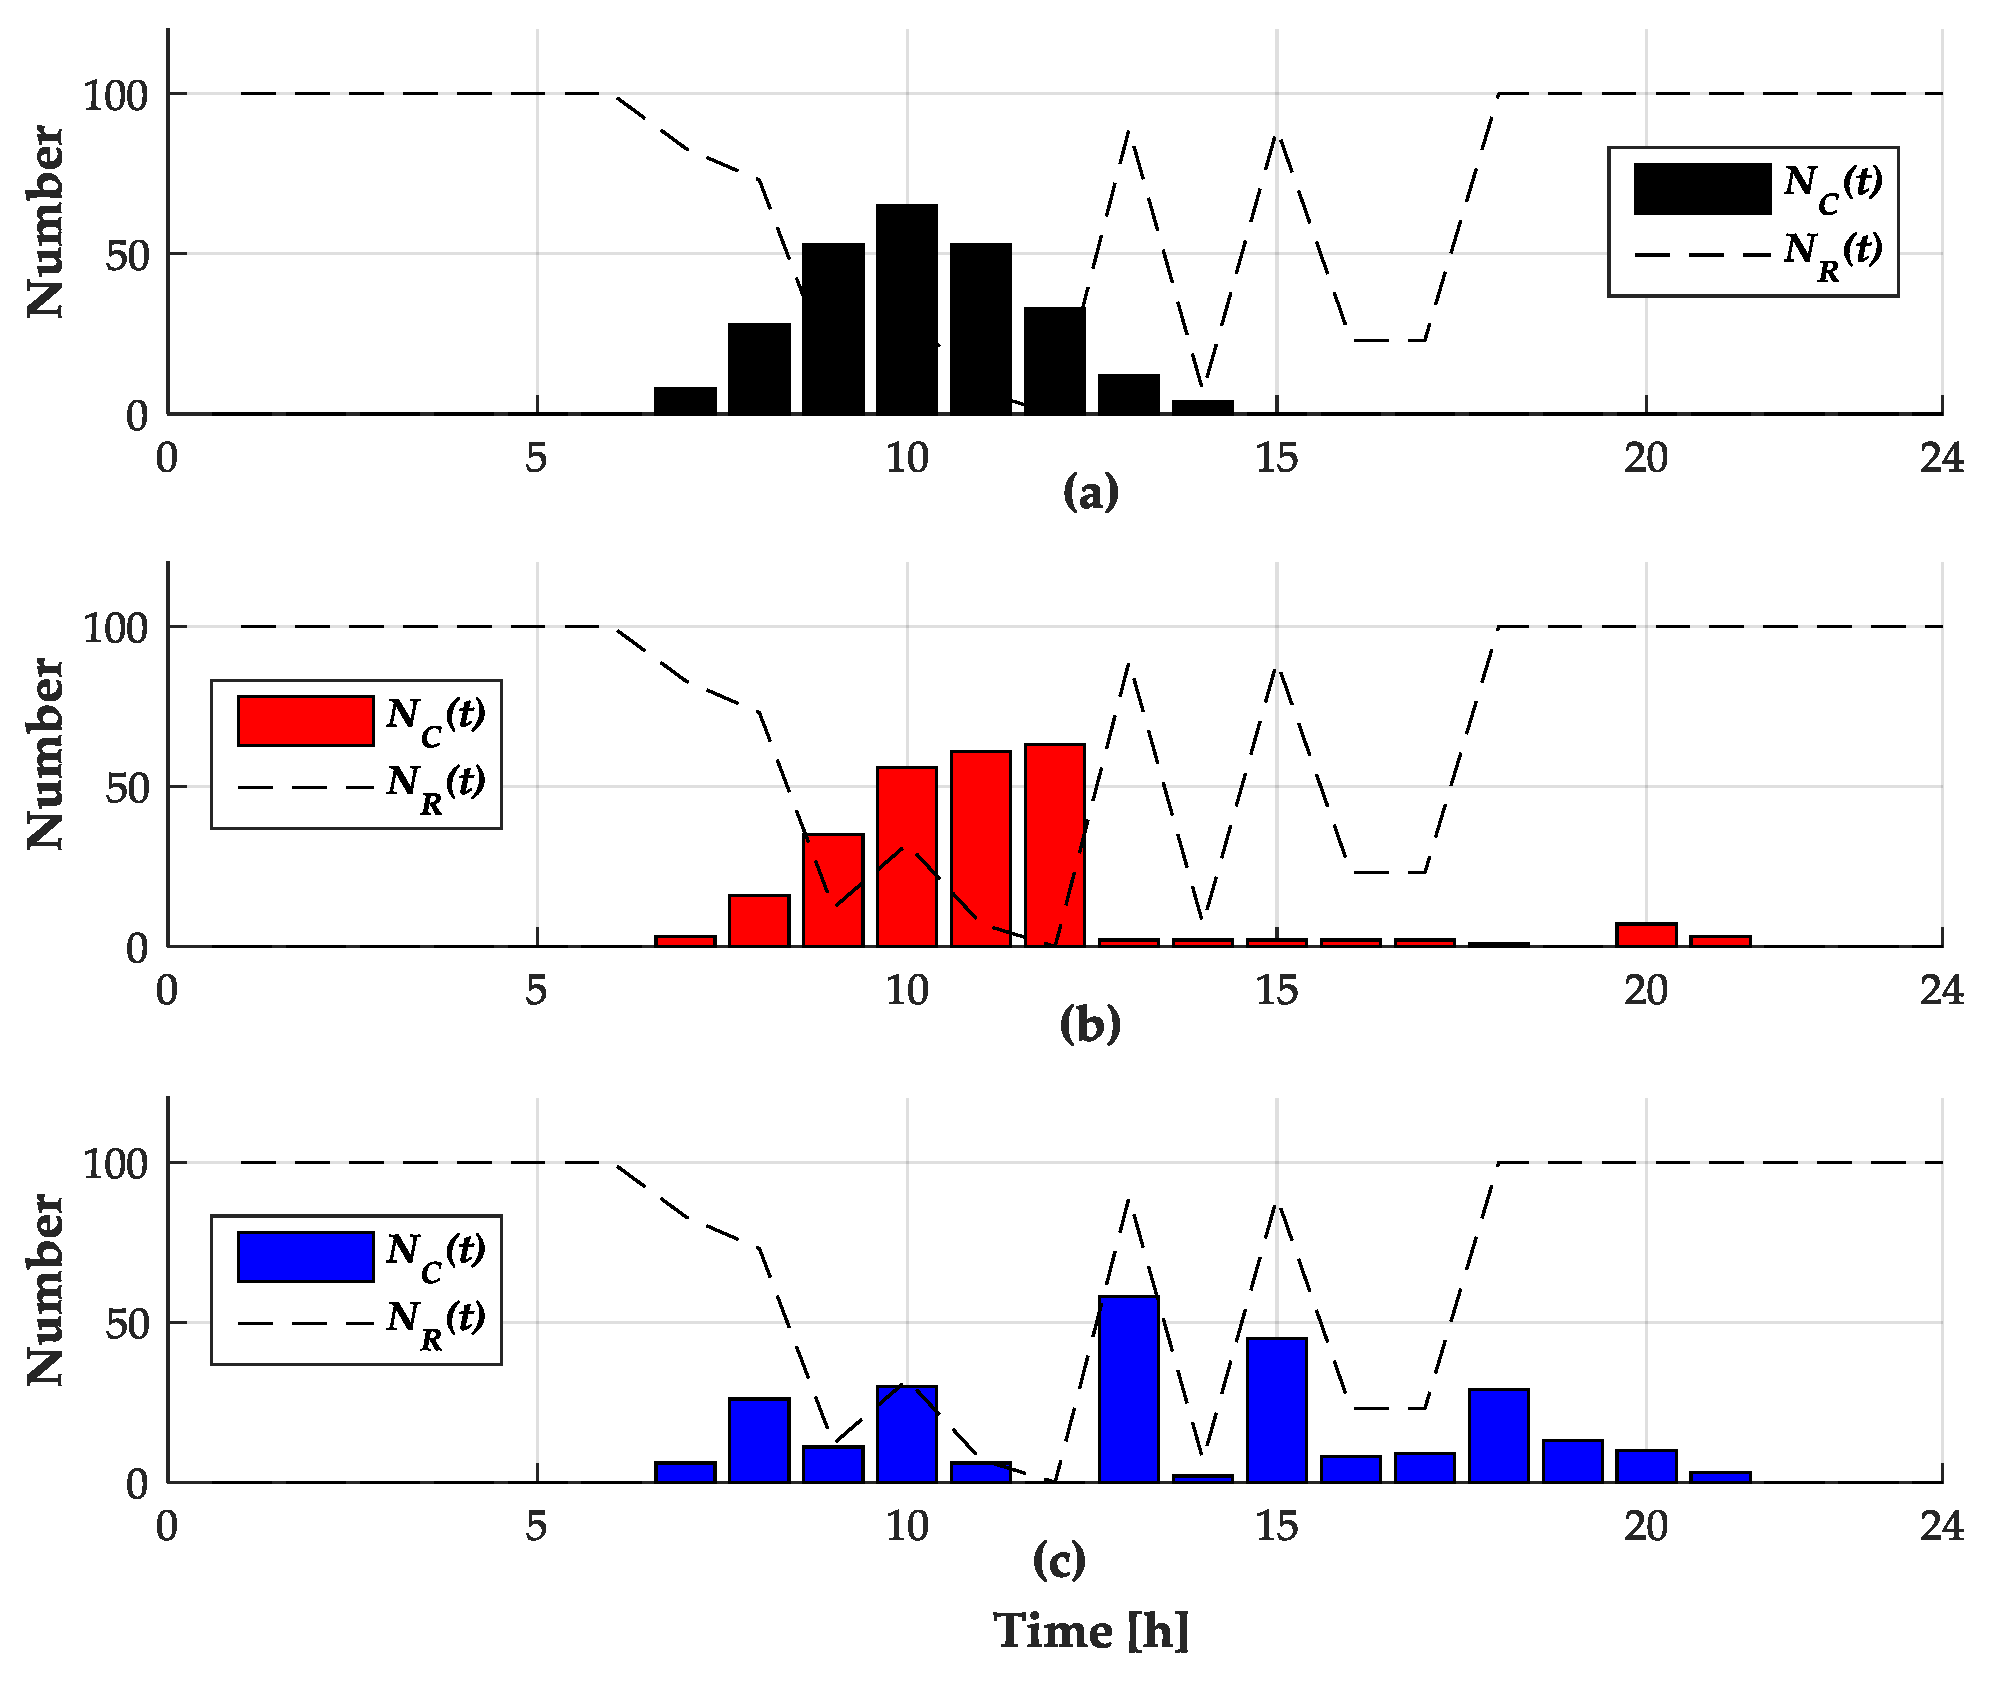
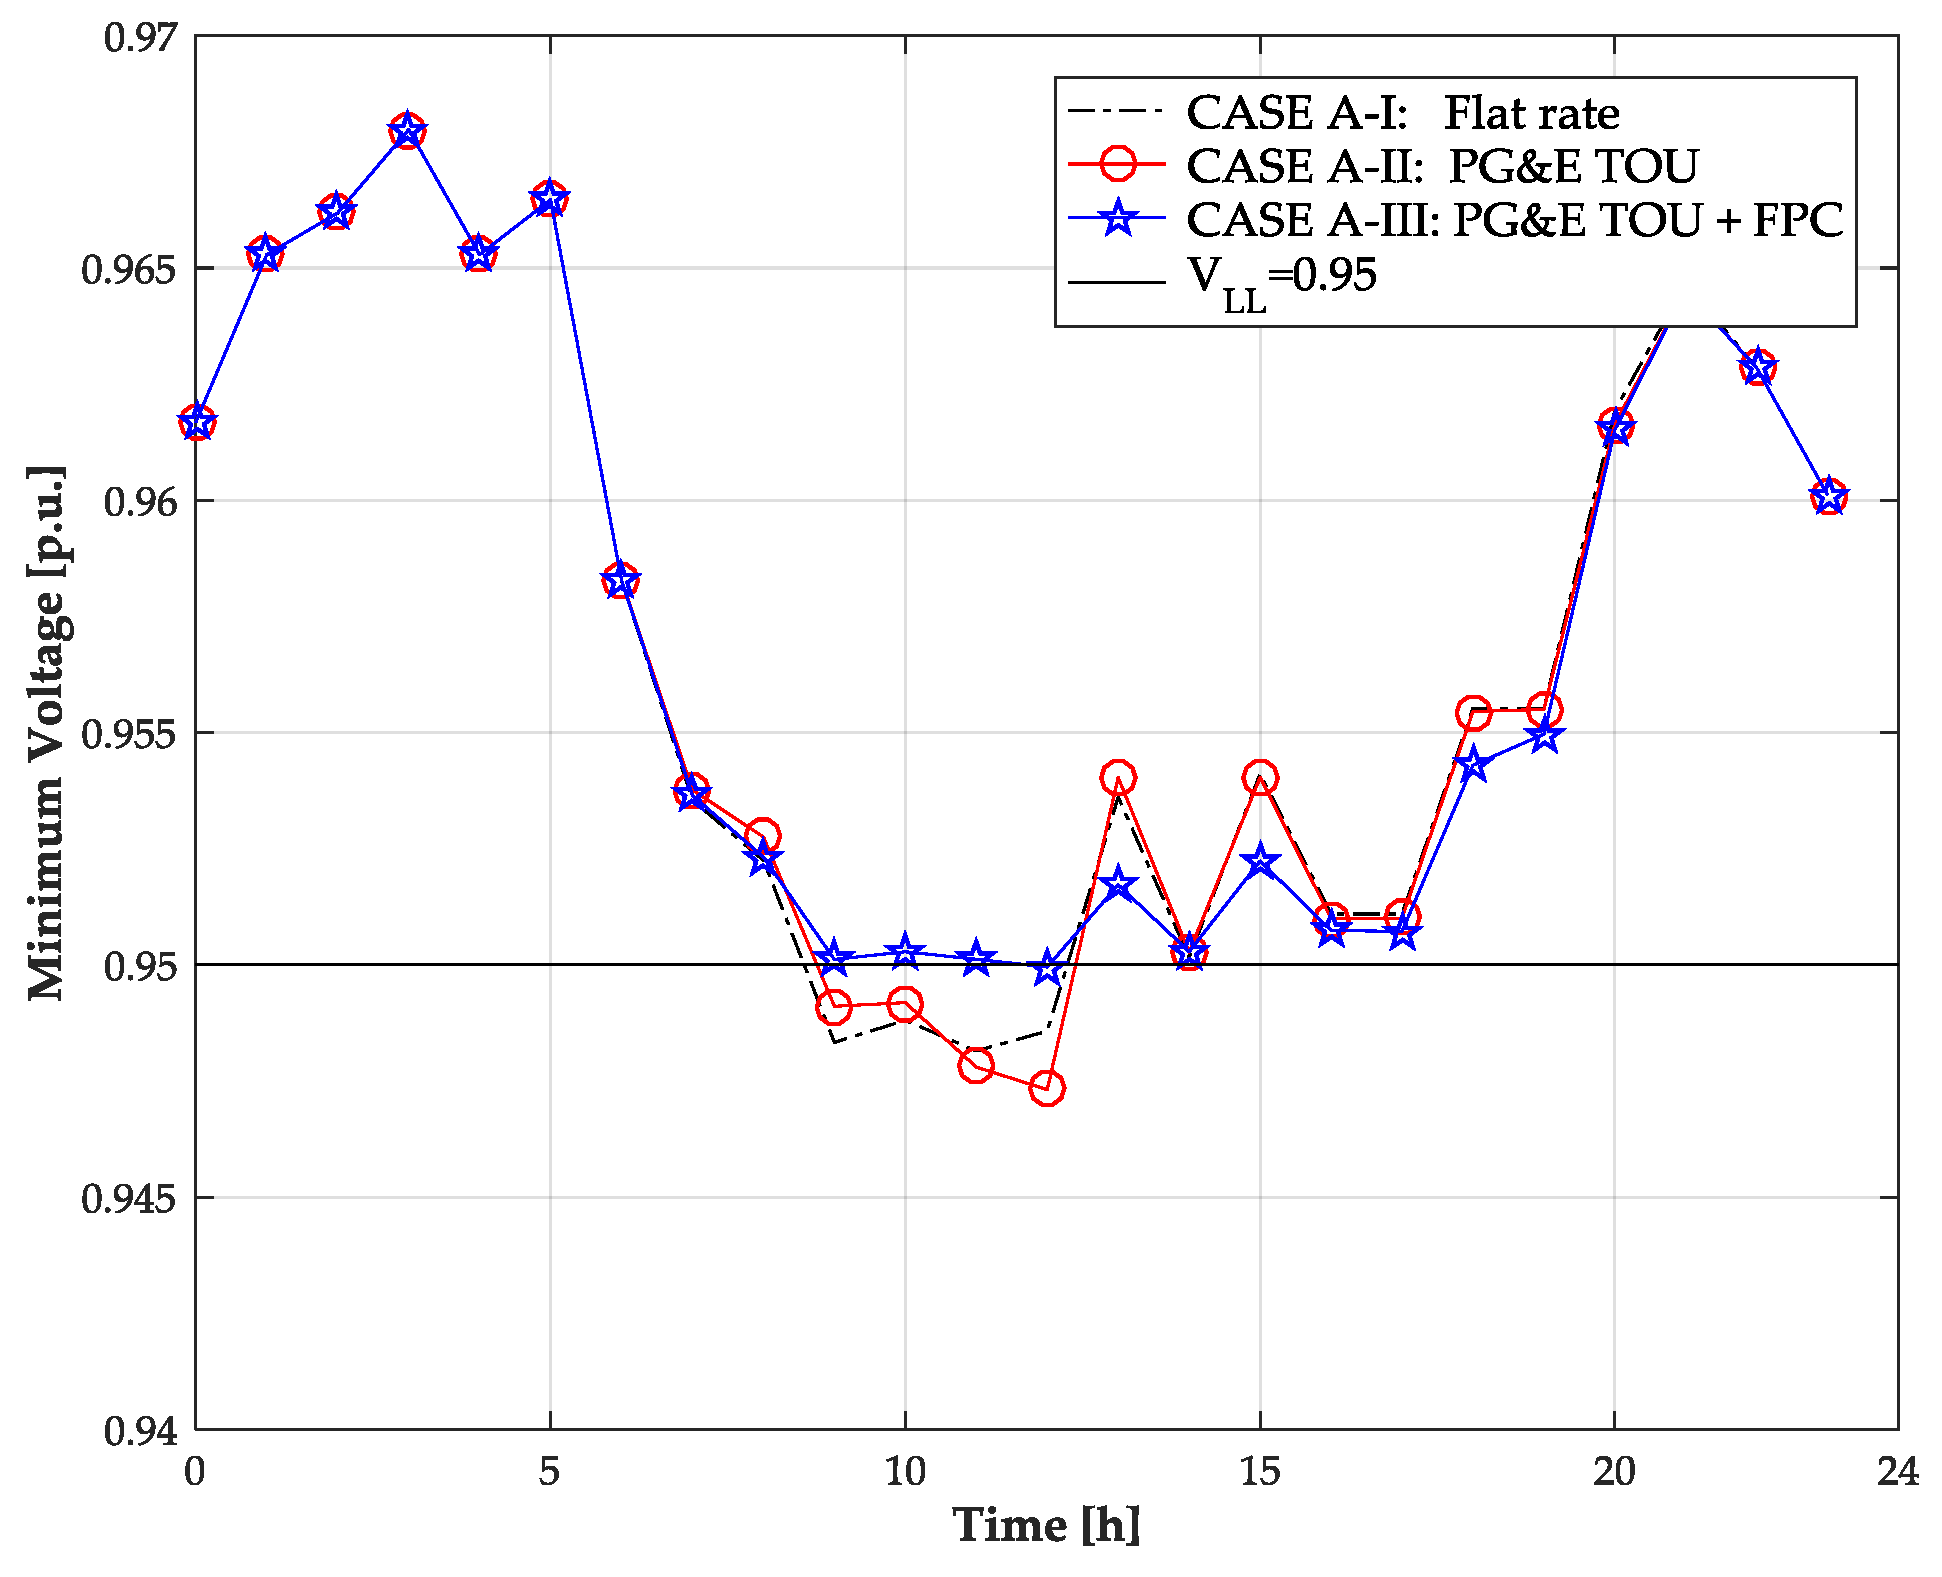
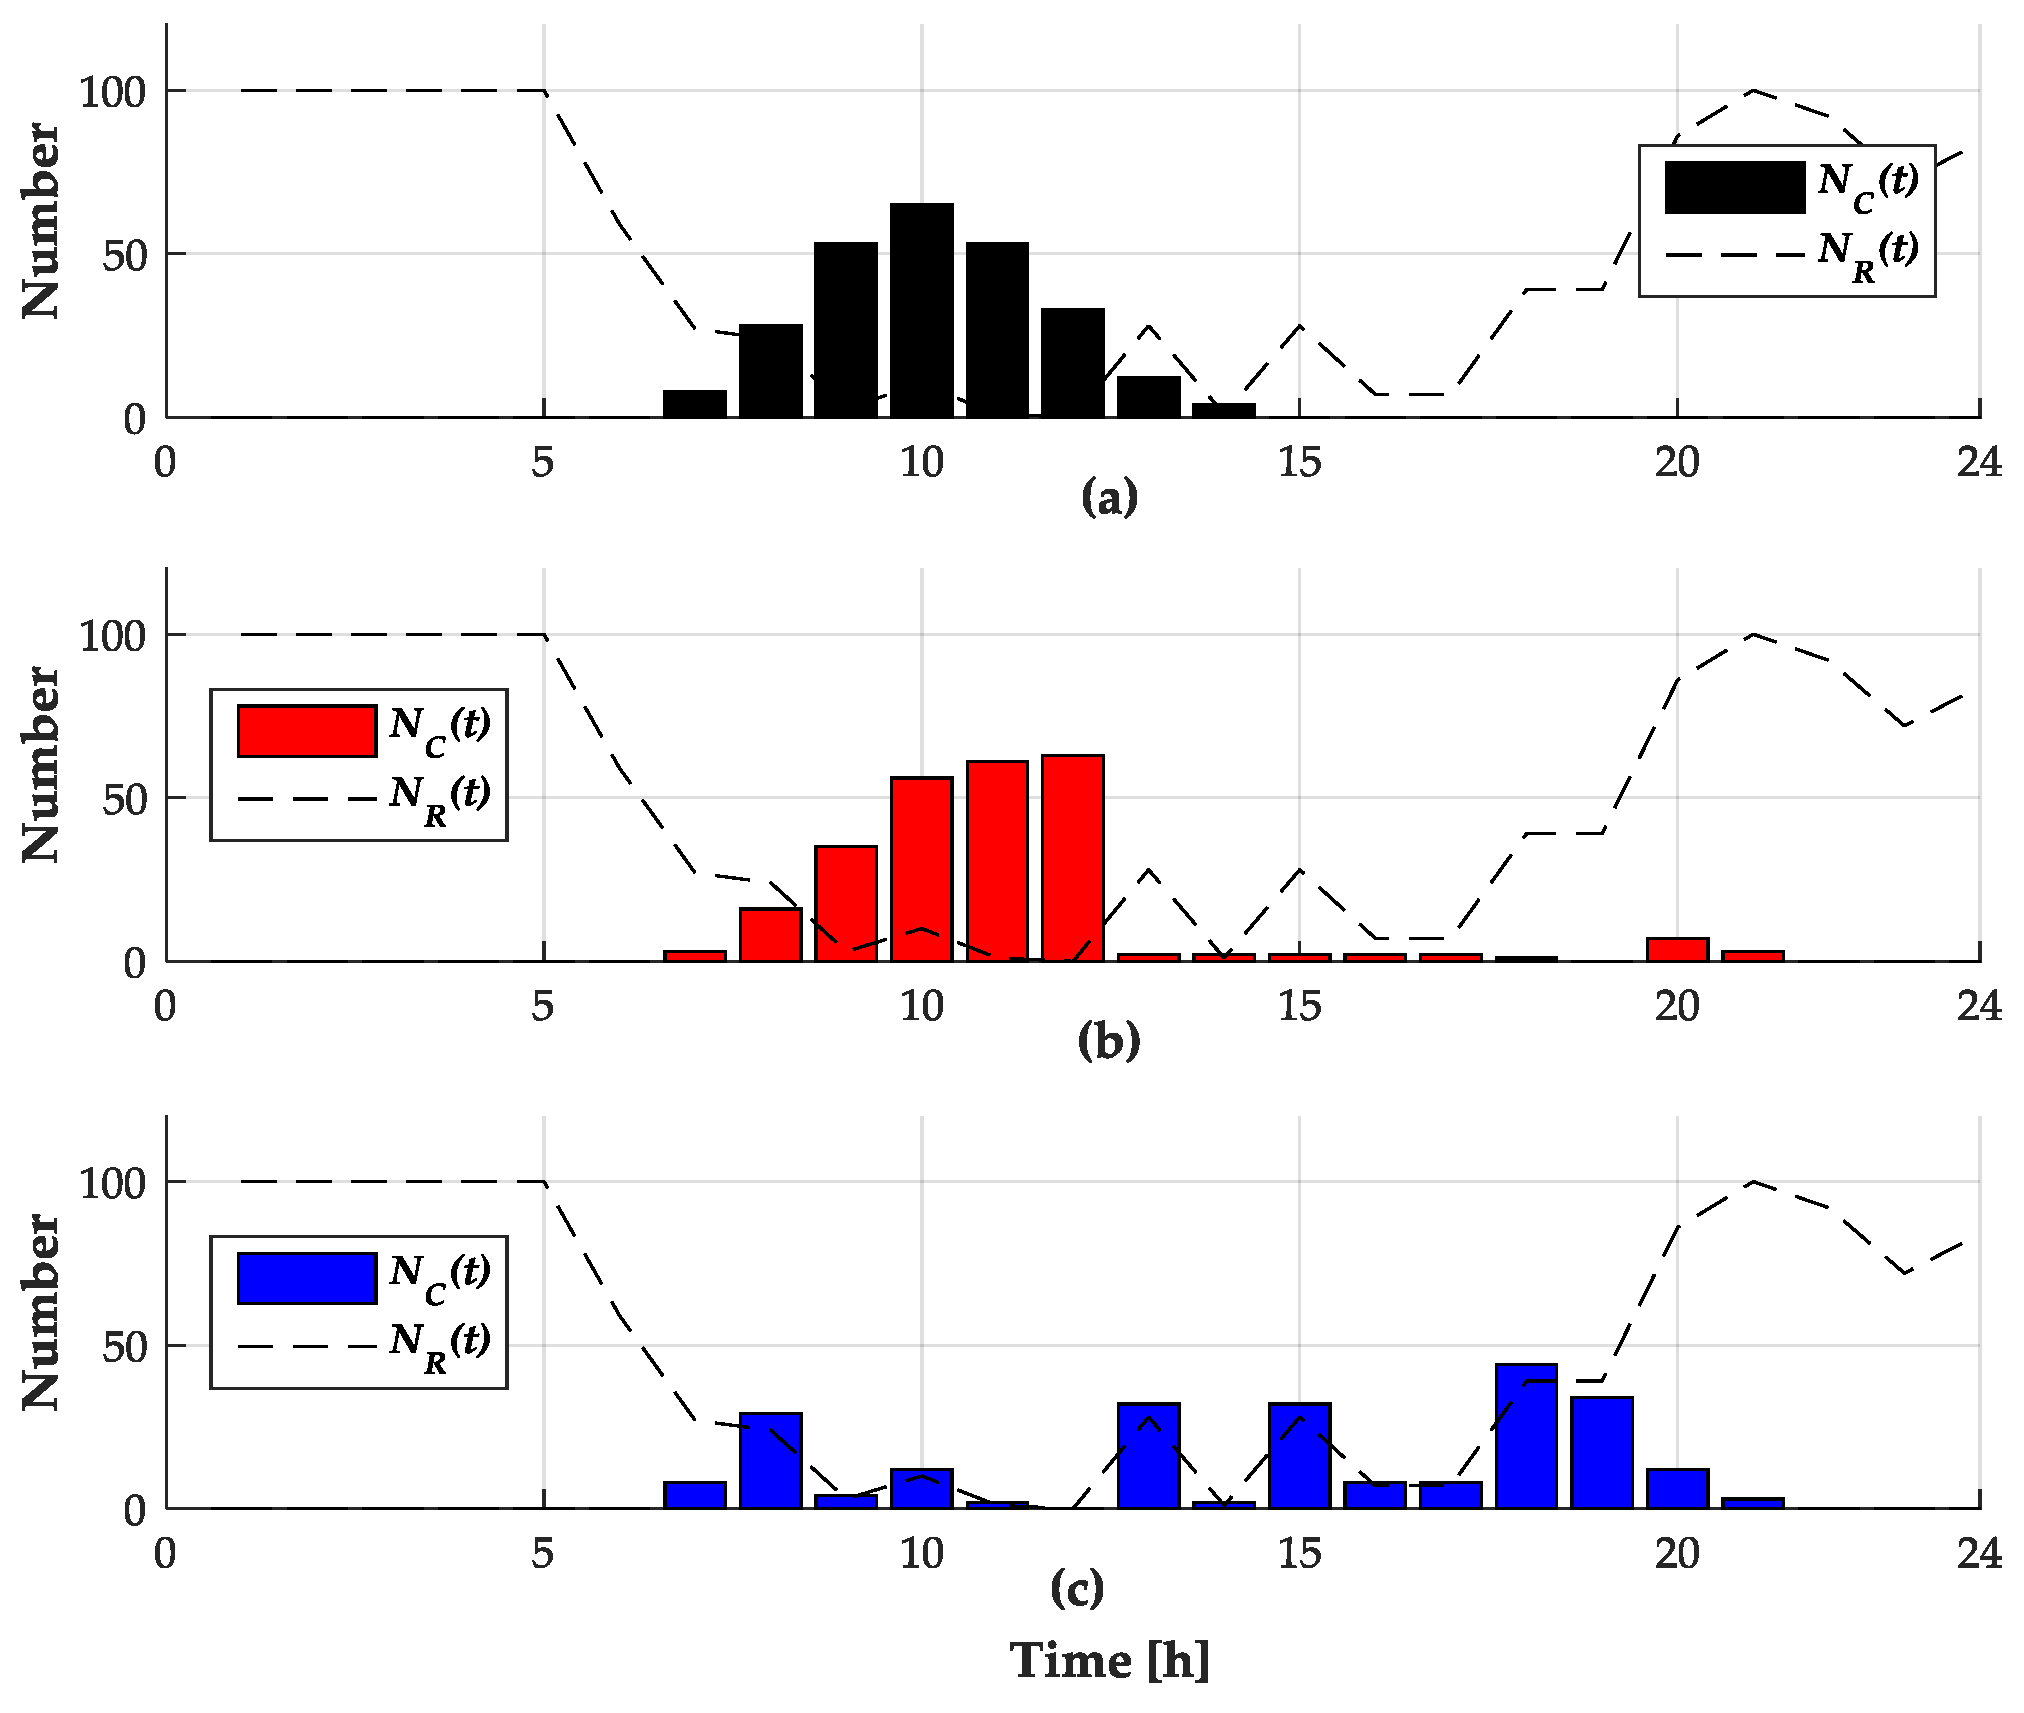
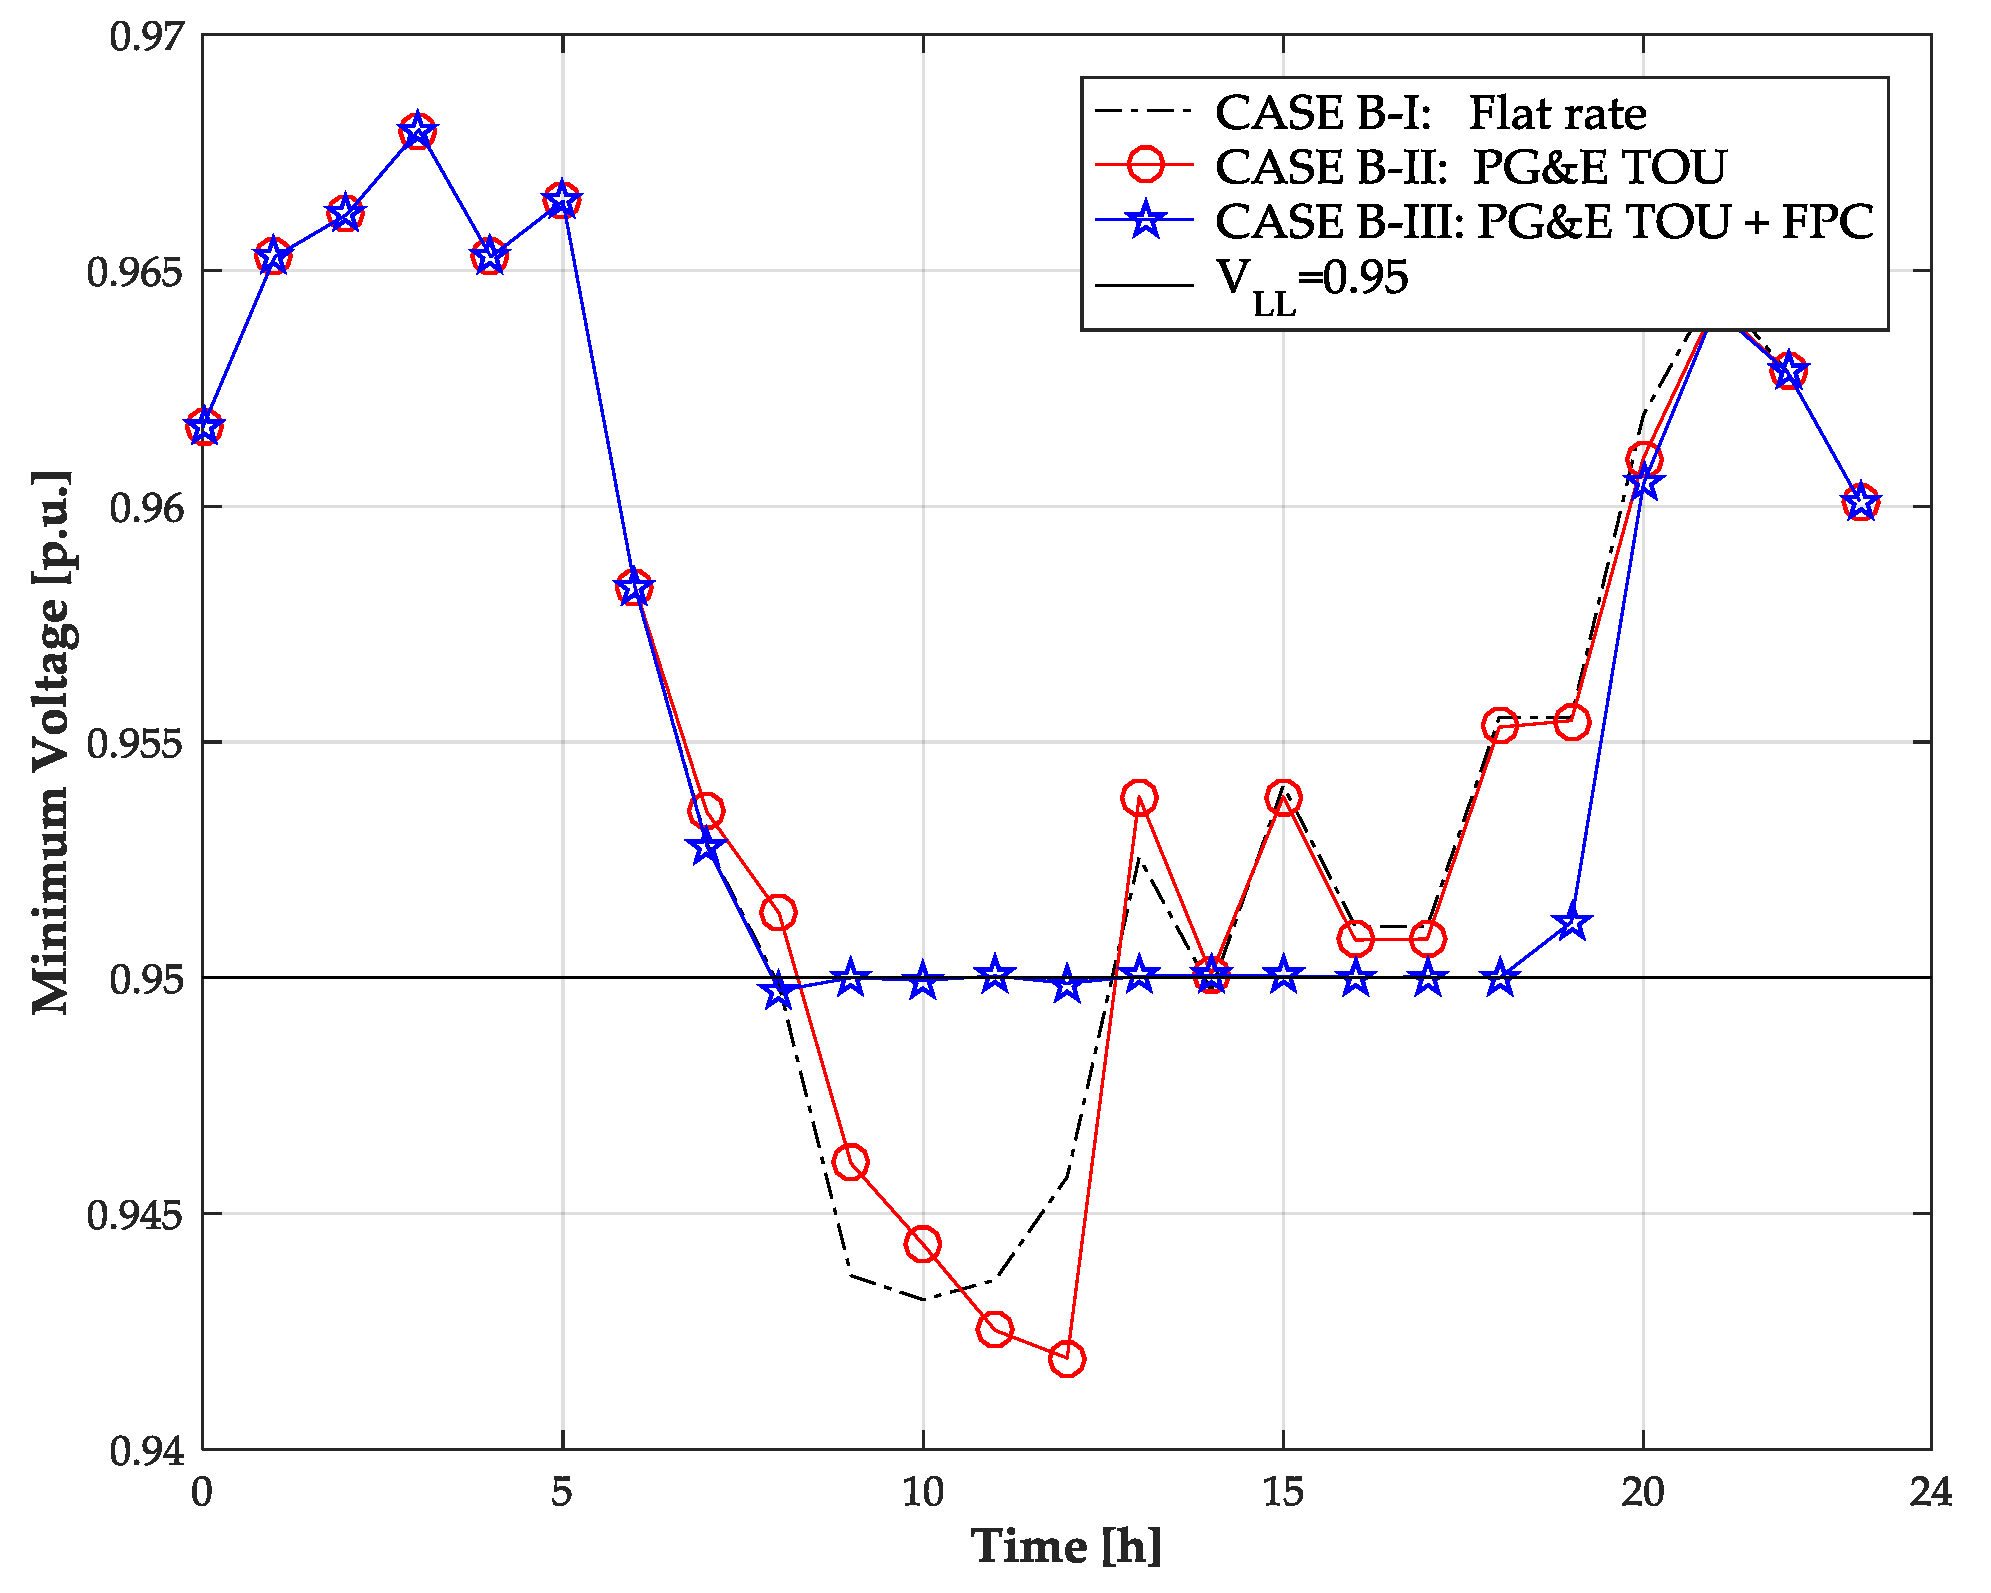
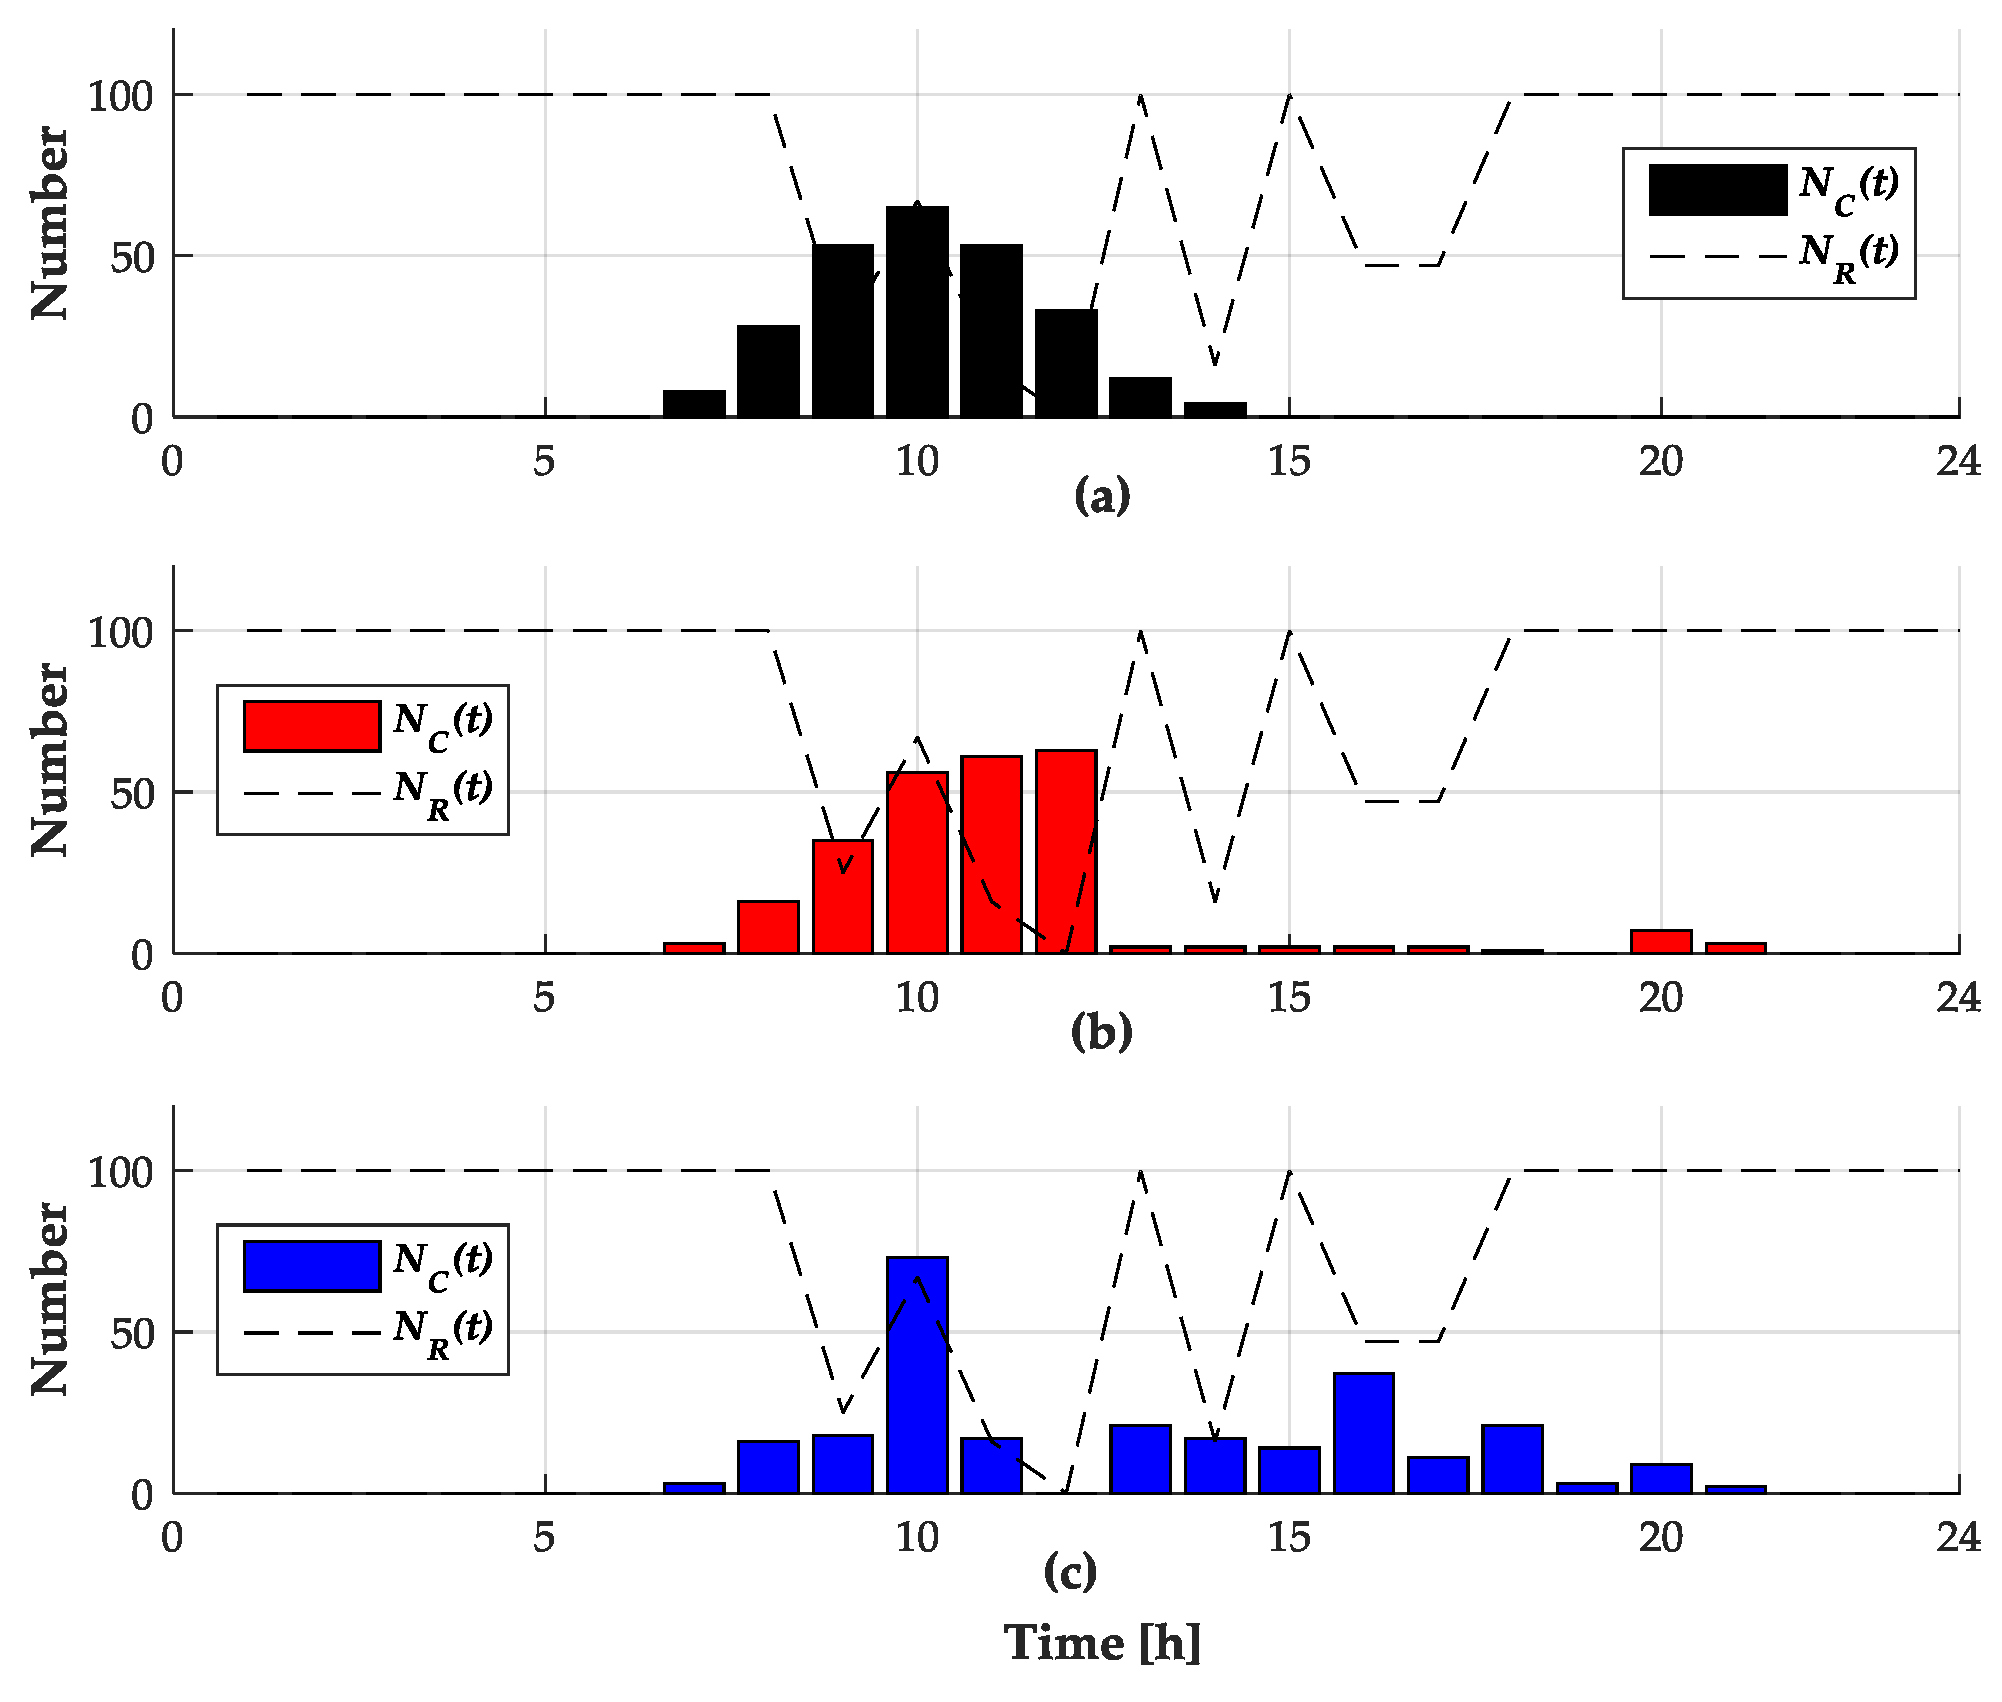
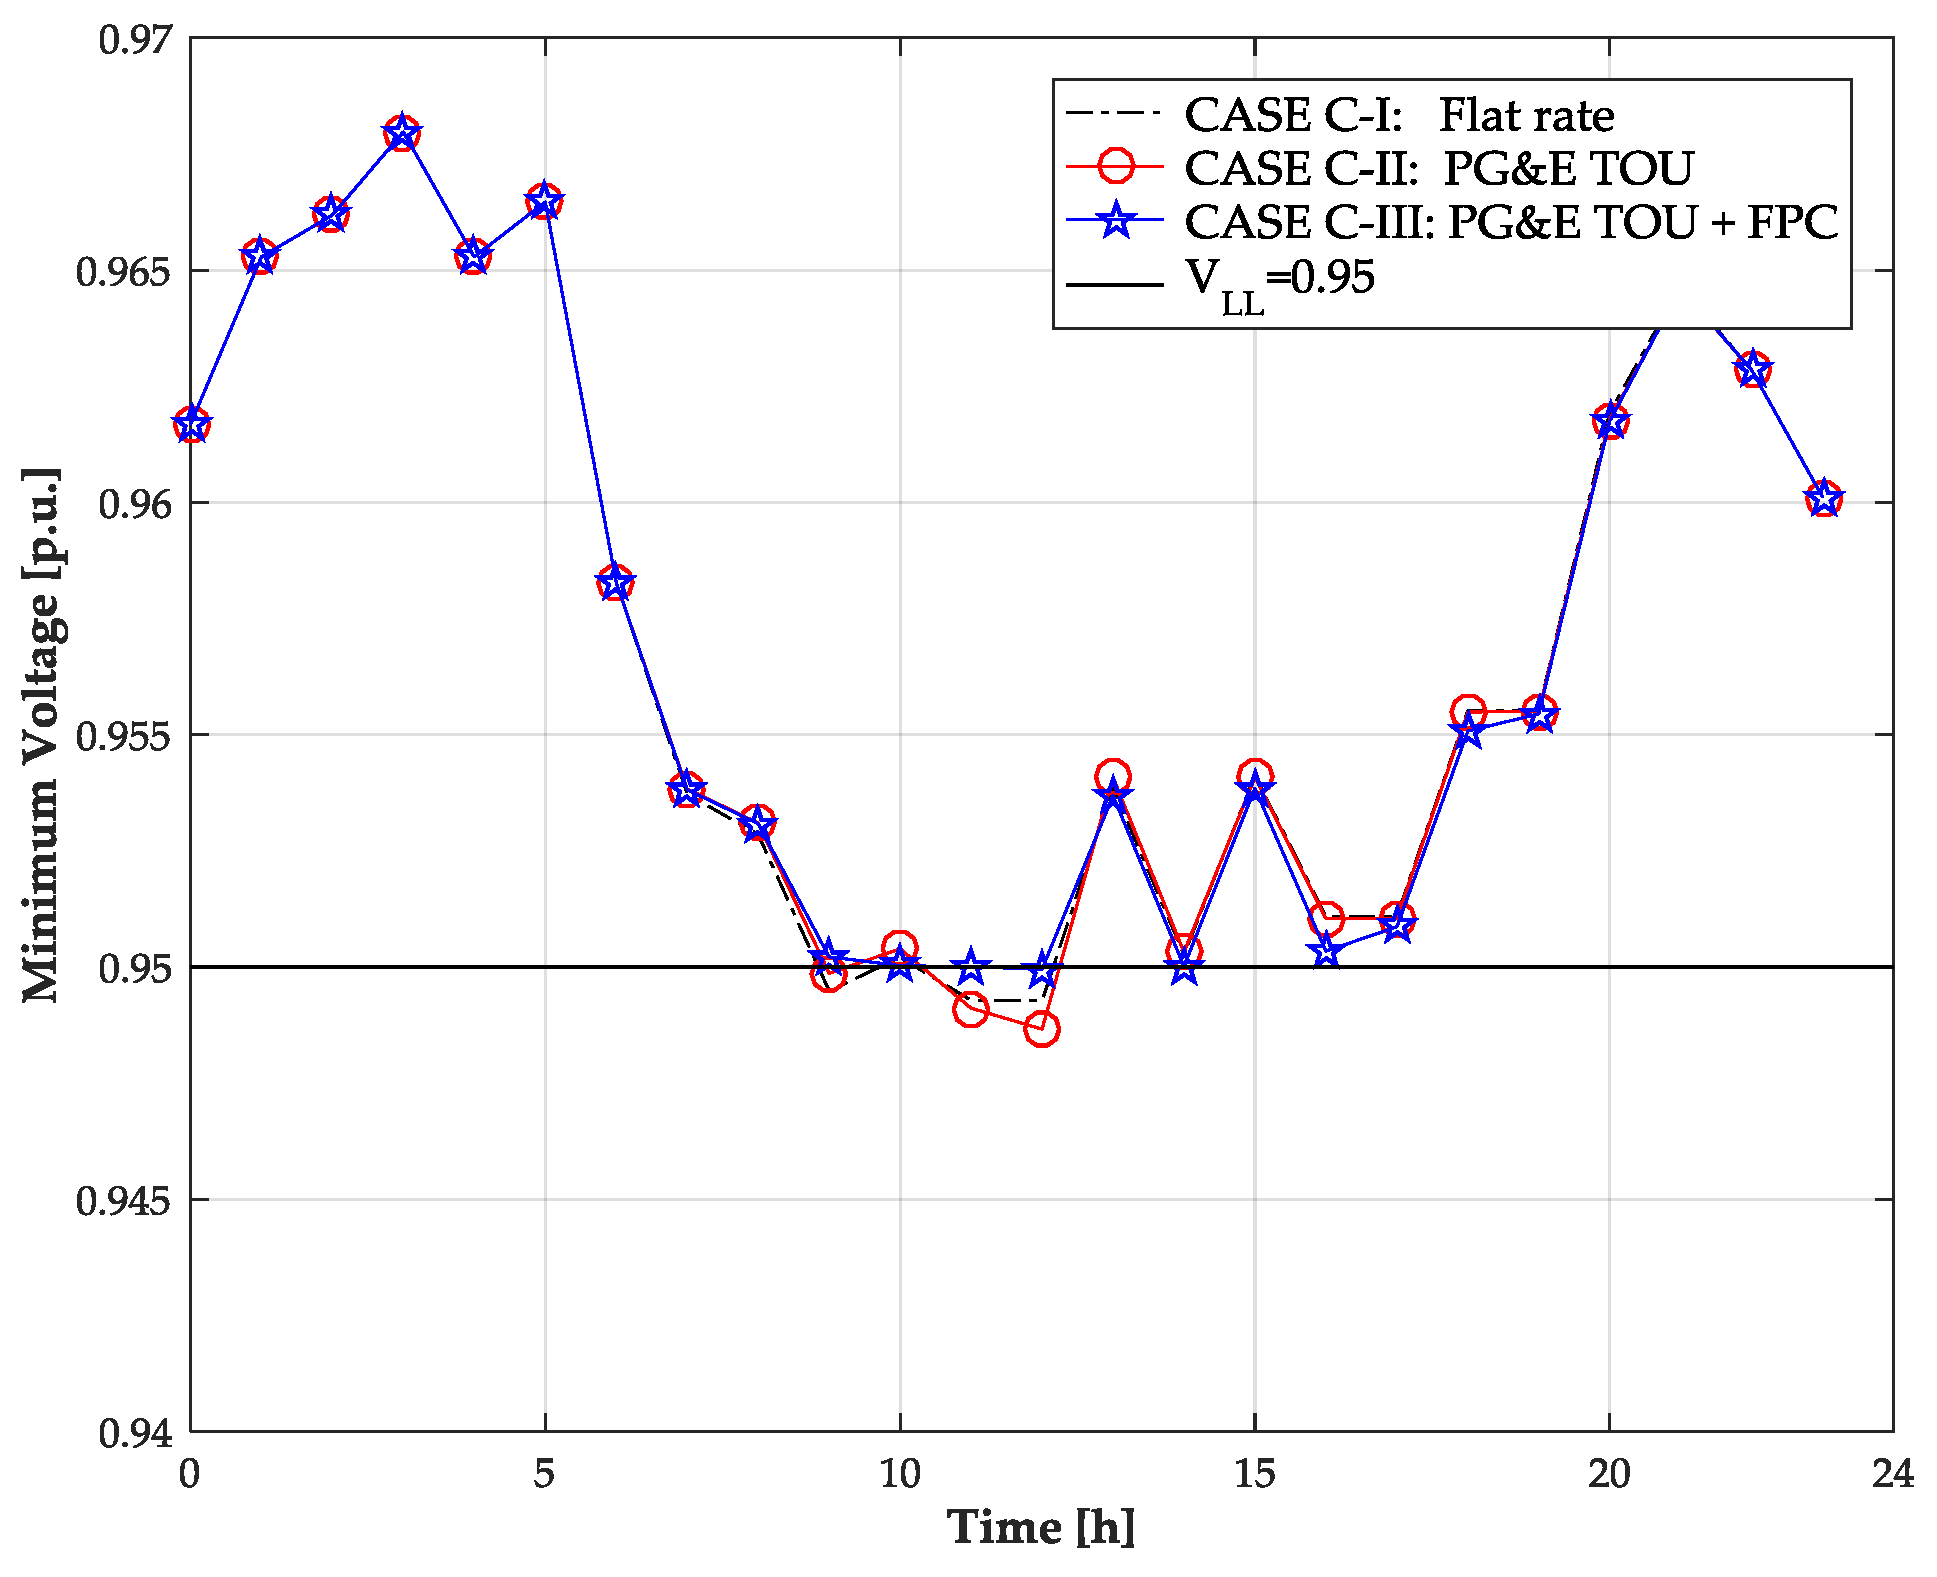
4.3. Simulation Results

The DNO’s optimization problem presented in Section 3.1 is solved using MATLAB’s (The MathWorks, Natick, MA, USA) built-in genetic algorithm solver, and the CSO’s optimization problem presented in Section 3.2 is solved using MATLAB’s built-in fmincon solver. All of the simulations were conducted using a personal computer (PC) with 3.10-GHz Intel® Core i5-4440 central processing unit (CPU), 8 GB of random-access memory (RAM), and 64-bit Windows® 7 operating system. Both optimization routines are time-consuming mixed-integer nonlinear problems. The actual computation times of the simulation cases are listed in Table 5, and it is found that each case takes a few hours. Since the proposed FPC scheme is designed to be conducted a day ahead, the computation times in Table 5 seem to be implementable in practice. It should be noted that more time is consumed in case B than other cases, which means that the problem becomes more difficult as the charging station is located further from the main substation (bus 1).
Under Condition I in Case A (Case A-I), where the flat rate is applied, the CSO is not motivated to adjust its charging schedule because there is no difference in the electricity tariff at each time. Therefore, the CSO only considers the required energy for the PEVs when it determines its charging schedule. The profile of N C i ( t ) for 24 h resulting from Case A-I is shown in Figure 3a. N C i ( t ) is observed to exceed N R i ( t ) in Figure 3a, and the minimum voltage of the distribution network is below the low voltage limit VLL during the same period as shown in Figure 4.
Applying Condition II in Case A (Case A-II), where the PG and E EV-9A TOU tariff is used, the CSO shifts the charging demand from the peak time to other times because the rate at the peak time is higher than the rates of the other times. For this reason, it can be observed that the charging demand at 13 h and 14 h in Case A-I is moved to other time slots before the peak time and after the peak time, as presented in Figure 3b. Additionally, it is observed in Figure 3b that N C i ( t ) violates N R i ( t ) between 9 h and 12 h, because there is no coordination measure for delivering information on the voltage condition of the network to the CSO from the DNO. A noteworthy point is that the minimum voltage in Case A-II, with the TOU rate, is less than the minimum voltage in Case A-I, with the flat rate, as seen in Figure 4. In particular, the minimum voltage in Case A-II occurs at 12 h, unlike in case A-I, which occurs at 11 h. The reason for this result is that the charging demand at 12 h increases by a strategic act of the CSO for avoiding the peak rate of the TOU rate. Furthermore, this result implies that the charging scheduling of the CSO considering the TOU rate can aggravate the voltage condition of the network.
For Condition III in Case A (Case A-III), where the proposed FPC for voltage security is assumed, in addition to the PG and E EV-9A TOU tariff, the CSO evenly deconcentrates the charging demand to other times, as shown in Figure 3c, in order to avoid the potential penalty cost that might be imposed on the excess of N C i ( t ) to N R i ( t ) . Additionally, it is shown that N C i ( t ) for all times do not exceed N R i ( t ) in Figure 3c, and the low voltage problems that occur in Case A-I and Case A-II are mitigated well in Case A-III, as presented in Figure 4.
In Case B, the location of the charging station (bus 61) is set to be farther from the main substation, compared to the location of the charging station (bus 56) in Case A. This means that Case B is configured to observe the changes in the simulation results when the voltage problem becomes more severe than in Case A. As a result of the calculation of N R i ( t ) with the method described in Section 3.1 for Case B, N R i ( t ) for 24 h is represented by the dashed lines in Figure 5. It is clearly observed that the values of N R i ( t ) for Case B are stricter than those for Case A by comparing Figure 3 and Figure 5. In addition, it is observed by comparing Figure 4 and Figure 6 that the voltage problems are more effectively mitigated in Case B than in Case A. However, the minimum voltage values of a few time slots of Case B-III are just below the voltage lower limit VLL, which is a result of the CSO’s excessive charging over N R i ( t ) in order to comply with contract with the PEVs. In other words, even if the proposed FPC improves the voltage security and mitigates the low-voltage problem, there is still a limit of total charging loads depending on the bus location of the charging station and the distribution network condition.
In Case C, the location of the charging station (bus 9) is set to be closer to the main station compared to the location of the charging station (bus 56) in Case A. This means that Case C is configured to analyze the changes in the simulation results if the voltage problem is less serious than that in Case A. Figure 7 shows that the values of N R i ( t ) for 24 h have more generous values in Case C compared to those in Case A. As seen in Figure 8, the mitigation of the voltage problem is not as effective in Case C as in Case A or Case B. Consequently, considering the results of Case B and Case C, it can be said that the proposed FPC becomes more effective as stricter N R i ( t ) conditions are imposed.

5. Conclusions

This study proposes an FPC for voltage security as a coordination measure between the DNO and the CSO, which helps the DNO mitigate the low-voltage problem caused by the existence of a charging station. In this paper, a method for calculating N R i ( t ) , and a formulation for the optimal coordinate management of the CSO under the FPC scheme are proposed. Using the PG and E 69-bus test distribution network, the proposed scheme is verified to be effective as a coordination measure to handle the voltage security. In other words, the FPC can play a role as a measure to pass on the DNO’s cost for maintaining stable operation of the network to the CSO. In addition, the effect of the FPC can be altered according to the location of the charging station. Specifically, it is more effective to use the FPC when a bus is more vulnerable to voltage drops. Although this study does not obtain the optimal penalty price to maximize the social welfare under the FPC scheme, this can be addressed in depth in future work.

Acknowledgments

This work was supported by the National Research Foundation of Korea (NRF) grant funded by the Korea government (MSIP) (2010-0028509).

Author Contributions

Jip Kim and Seung Wan Kim conceived and designed the study. Jip Kim developed the mathematical model, setup the simulation environment, and performed the simulations. Jip Kim drafted the manuscript and Seung Wan Kim thoroughly revised the paper. Young Gyu Jin checked the overall logic of this work. Yong Tae Yoon and Jong-Keun Park provided insightful suggestions for the overall research.

Conflicts of Interest

The authors declare no conflict of interest.

Appendix

Table A1. Randomly generated driving information of 100 PEVs.
PEV No.Arrival TimeDeparture TimeInitial SoCRequired SoCPEV No.Arrival TimeDeparture TimeInitial SoCRequired SoC
18 h19 h11.50%86.03%518 h19 h0%30.16%
27 h16 h23.50%44.80%527 h17 h30.17%41.60%
38 h18 h13.97%73.31%539 h18 h12.79%67.15%
49 h20 h20.78%28.83%549 h19 h52.45%75.25%
510 h19 h19.77%81.72%559 h19 h41.44%44.28%
67 h20 h13.69%57.11%5611 h18 h26.69%61.80%
79 h21 h40.49%87.12%5710 h20 h23.20%70.92%
810 h19 h39.40%96.56%5811 h20 h45.06%49.77%
911 h20 h28.29%62.97%5910 h21 h49.57%68.68%
109 h21 h45.03%100% 6010 h19 h43.85%75.19%
119 h19 h32.76%77.99% 617 h20 h28.46%69.20%
128 h17 h0%21.11%628 h17 h0%65.12%
137 h 19 h22.83%35.12%638 h18 h62.47%73.34%
1410 h18 h33.99%84.81%649 h19 h40.94%100%
159 h20 h12.47%63.23%6510 h18 h36.33%68.04%
169 h18 h38.31%53.11%668 h21 h24.68%69.87%
178 h20 h60.31%82.91%6710 h20 h27.36%80.18%
1810 h20 h35.15%84.78%6810 h22 h38.47%88.46%
199 h19 h56.05%100%699 h21 h27.50%51.11%
2011 h19 h65.23%68.60%7010 h20 h58.25%76.01%
219 h18 h0%35.12%719 h19 h21.51%56.08%
228 h17 h21.82%68.92%727 h19 h49.27%67.89%
238 h18 h3.08%51.90%737 h18 h11.85%69.44%
2410 h18 h39.09%53.12%748 h20 h61.92%92.01%
259 h19 h30.32%39.89%759 h19 h2.21%60.14%
2610 h19 h29.78%73.76%769 h17 h16.65%50.10%
2710 h17 h43.47%100%7710 h20 h28.42%98.67%
289 h20 h35.27%82.97%7812 h22 h11.29%60.32%
2911 h19 h17.95%80.20%799 h21 h35.87%77.78%
3010 h19 h30.22%75.05%809 h20 h36.73%67.11%
318 h17 h6.48%63.96%818 h16 h21.39%69.12%
327 h19 h29.69%64.34%829 h19 h16.99%43.41%
338 h19 h25.79%49.77%838 h19 h10.08%66.41%
348 h21 h14.50%61.91%8411 h19 h46.78%100%
3510 h18 h17.27%57.98%859 h19 h15.64%80.69%
369 h19 h39.27%45.40%8610 h19 h20.6%78.89%
3710 h22 h35.65%81.29%8712 h22 h48.81%97.62%
388 h21 h30.29%98.98%889 h19 h42.32%79.15%
3910 h18 h25.70%100%899 h19 h10.07%74.85%
409 h18 h43.91%91.42%909 h19 h36.32%56.52%
418 h18 h0%57.38%919 h17 h51.72%66.58%
428 h17 h15.10%76.83%928 h18 h0%21.53%
439 h18 h28.90%57.49%938 h19 h42.49%68.76%
449 h18 h41.51%100%949 h19 h39.99%88.64%
457 h19 h33.64%79.77%958 h19 h10.24%78.05%
468 h20 h35.79%76.77%969 h20 h43.21%59.13%
4710 h20 h37.25%74.16%9710 h19 h68.65%100%
4810 h20 h50.73%97.30%989 h20 h30.10%100%
4911 h20 h28.65%62.93%9910 h20 h60.78%85.95%
5010 h18 h58.46%78.43%10010 h20 h40.48%80.89%

Nomenclature

Abbreviations 

PEV
Plug-in electric vehicle
DNO
Distribution network operator
CSO
Charging station operator
TOU
Time-of-use
FPC
Flexible penalty contract
OLTC
On-load tap changer

Indices 

i
Index of each bus in the distribution network
t
Index of each time slot
k
Index of each PEV
l
Index of each distribution line

Variables 

P MAX i ( t )
Maximum available charging power on bus i the at time slot t
P R i ( t )
Recommended charging power on bus i at the time slot t
T P ( t )
Tap position of the main transformer at the time slot t
V i ( t )
Voltage on bus i at the time slot t
P F l ( t ) , Q F l ( t )
Active/reactive power flow on distribution line l at the time slot t
P L i ( t ) , Q L i ( t )
Day-ahead forecasted active/reactive power demand on bus i at the time slot t
P CS i ( t )
Charging demand in the charging station on bus i at the time slot t
δ i ( t )
Phase angle on bus i at the time slot t
N C i ( t )
Number of PEVs being charged on bus i at the time slot t
N R i ( t )
Recommended number of PEVs to be charged on bus i at the time slot t
S T k , i ( t )
Charging status of the kth PEV on bus i at the time slot t
S o C k , i ( t )
State-of-charge of the kth PEV on bus i at the time slot t

Parameters 

n
Total number of buses in distribution network
SM
Security margin in the calculation of P R i ( t ) (%)
βt
Penalty price of the FPC at the time slot t
ρt
TOU rate at the time slot t
μt
Charging service fee at the time slot t
VUL/VLL
Upper/Lower voltage limit
Gij, Bij
Conductance/susceptance of the distribution line between the i th and jth buses
NTMAX
Maximum number of tap movements for 24 h
N PEV t
Number of PEVs at the charging station at the time slot t
p PEV
Rated power of the charging cable
c a p PEV
Capacity of each PEV
t
Size of each time slot
S o C INI k , i , S o C REQ k , i
Initial/required values of the state-of-charge for the kth PEV on bus i
S o C MAX
Maximum value of state-of-charge for PEV
T ARR k , i , T DEP k , i
Arrival/departure times of the kth PEV on bus i

References

  1. Navigant Research. Electric Vehicle Market Forecasts: Global Forecasts for Light Duty Hybrid, Plug-In Hybrid, and Battery Electric Vehicle Sales and Vehicles in Use: 2015–2024. Available online: https://www.navigantresearch.com/research/electric-vehicle-market-forecasts (accessed on 24 March 2016).
  2. International Energy Agency. Global EV Outlook: Understanding the Electric Vehicle Landscape to 2020. Available online: https://www.iea.org/publications/freepublications/publication/GlobalEVOutlook_2013.pdf (accessed on 24 March 2016).
  3. Putrus, G.A.; Suwanapinkarl, P.; Johnston, D.; Bentley, E.C.; Narayana, M. Impact of electric vehicles on power distribution networks. In Proceedings of the Vehicle Power and Propulsion Conference, Dearborn, MI, USA, 7–10 September 2009.
  4. Dow, L.; Marshall, M.; Xu, L.; Aguero, J.M.; Willis, H.L. A novel approach for evaluating the impact of electric vehicles on the power distribution system. In Proceedings of the Power and Energy Society General Meeting, Minneapolis, MN, USA, 20–25 July 2010.
  5. Fernandez, L.P.; Roman, T.G.S.; Cossent, R.; Domingo, C.M.; Frias, P. Assessment of the impact of plug-in electric vehicles on distribution networks. IEEE Trans. Power Syst. 2011, 26, 206–213. [Google Scholar] [CrossRef]
  6. Sortomme, E.; Hindi, M.M.; MacPherson, S.D.J.; Venkata, S.S. Coordinated charging of plug-in hybrid electric vehicles to minimize distribution system losses. IEEE Trans. Smart Grid 2011, 2, 198–205. [Google Scholar] [CrossRef]
  7. Clement-Nyns, K.; Haesen, E.; Driesen, J. The impact of charging plug-in hybrid electric vehicles on a residential distribution grid. IEEE Trans. Power Syst. 2010, 25, 371–380. [Google Scholar] [CrossRef] [Green Version]
  8. Deilami, S.; Masoum, A.S.; Moses, P.S.; Masoum, M.A.S. Real-time coordination of plug-in electric vehicle charging in smart grids to minimize power losses and improve voltage profile. IEEE Trans. Smart Grid 2011, 2, 456–467. [Google Scholar] [CrossRef]
  9. O’Connel, A.; Flynn, D.; Keane, A. Rolling multi-period optimization to control electric vehicle charging in distribution networks. IEEE Trans. Power Syst. 2014, 29, 340–348. [Google Scholar] [CrossRef]
  10. Ma, Z.; Callaway, D.S.; Hiskens, I.A. Decentralized charging control of large populations of plug-in electric vehicles. IEEE Trans. Contr. Syst. Technol. 2013, 21, 67–78. [Google Scholar] [CrossRef]
  11. Kim, S.W.; Jin, Y.G.; Song, Y.H.; Yoon, Y.T. A priority index method for efficient charging of PEVs in a charging station with constrained power consumption. J. Electr. Eng. Technol. 2016, 11, 709–717. [Google Scholar]
  12. NRG EVgo. Charging Solutions for Business. Available online: https://www.nrgevgo.com/ev-charging-business (accessed on 24 March 2016).
  13. ABB. Electric Vehicle Charging Infrastructure. Available online: http://new.abb.com/ev-charging (accessed on 24 March 2016).
  14. Bessa, R.J.; Matos, M.A. Economic and technical management of an aggregation agent for electric vehicles: A literature survey. Int. Trans. Electr. Energy Syst. 2012, 22, 334–350. [Google Scholar] [CrossRef]
  15. Kristoffersen, T.K.; Capion, K.; Meiborn, P. Optimal charging of electric drive vehicles in a market environment. Appl. Energy 2011, 88, 1940–1948. [Google Scholar] [CrossRef]
  16. Sortomme, E.; El-Sharkawi, M. Optimal charging strategies for unidirectional vehicle-to-grid. IEEE Trans. Power Syst. 2011, 26, 1283–1293. [Google Scholar] [CrossRef]
  17. Ortega-Vazquez, M.A.; Bouffard, F.; Silva, V. Electric vehicle aggregator/system operator coordination for charging scheduling and services procurement. IEEE Trans. Power Syst. 2013, 28, 1806–1815. [Google Scholar] [CrossRef]
  18. Moursi, M.S.E.; Zeineldin, H.H.; Kirtley, J.L.; Alobeidli, K. A Dynamic master/slave reactive power-management scheme for smart grids with distributed generation. IEEE Trans. Power Deliv. 2014, 29, 1157–1167. [Google Scholar] [CrossRef]
  19. Choi, J.H.; Moon, S.I. The dead band control of LTC transformer at distribution substation. IEEE Trans. Power Syst. 2009, 24, 319–326. [Google Scholar] [CrossRef]
  20. Viawan, F.A.; Karlsson, D. Combined local and remote voltage and reactive power control in the presence of induction machine distributed generation. IEEE Trans. Power Syst. 2007, 22, 2003–2012. [Google Scholar] [CrossRef]
  21. Venkatesh, B.; Ranjan, R. Fuzzy EP algorithm and dynamic data structure for optimal capacitor allocation in radial distribution systems. IEE Proc. Gener. Transm. Distrib. 2006, 153, 80–88. [Google Scholar] [CrossRef]
  22. California Independent System Operator (ISO). Open Access Same-Time Information System. Available online: http://oasis.caiso.com/mrioasis/logon.do?tiny=X_JAPA (accessed on 24 March 2016).
  23. Pacific Gas and Electric Company (PG&E). Electric Schedule E-9. Available online: http://www.pge.com/tariffs/tm2/pdf/ELEC_SCHEDS_E-9.pdf (accessed on 24 March 2016).
Figure 1. PG and E 69-bus test distribution network [21].
Energies 09 00538 g001
Figure 2. Forecasted hourly demand (%) over 24 h [22].
Energies 09 00538 g002
Figure 3. N C i ( t ) for (a) Case A-I; (b) Case A-II; and (c) Case A-III, with N R i ( t ) (dashed line) for each hours.
Energies 09 00538 g003
Figure 4. Minimum voltage of the test distribution network for Case A over 24 h.
Energies 09 00538 g004
Figure 5. N C i ( t ) for (a) Case B-I; (b) Case B-II; and (c) Case B-III, with N R i ( t ) (dashed line) for each hour.
Energies 09 00538 g005
Figure 6. Minimum voltage of the test distribution network for Case B over 24 h.
Energies 09 00538 g006
Figure 7. N C i ( t ) for (a) Case C-I; (b) Case C-II; and (c) Case C-III, with N R i ( t ) (dashed line) for each hour.
Energies 09 00538 g007
Figure 8. The minimum voltage of the test distribution network for Case C over 24 h.
Energies 09 00538 g008
Table 1. Basic data for generating the information of 100 plug-in electric vehicles (PEVs). SoC: state of charge.
InformationArrival TimeDeparture TimeInitial SoCRequired SoC
Average Value9:0019:0030%70%
Standard Deviation1 h1 h20%20%
Table 2. Summer PG and E time-of-use (TOU) rates ($/kWh) [23].
TimeRatesTime
On-peak0.36113:00–20:00
Part-peak0.14506:00–13:00
20:00–23:00
Off-peak0.09200:00–06:00
23:00–24:00
Table 3. Other parameters.
ParameterAcronymValue
Security marginSM10%
Maximum SoC for a PEVSoCMAX100%
Upper voltage limit of the networkVUL1.05 p.u.
Lower voltage limit of the networkVLL0.95 p.u.
Number of charging slots at the charging stationNSLOT100
Number of PEVs assumed for the simulationNPEV100
Number of Tap levelsNTP17
Penalty price for the FPCβ$0.24/kWh
Table 4. Simulation cases.
Simulation CasesConditionTariffCharging Station Location
Case AIFlat rateBus 56
IIPG&E EV-9A TOU
IIIPG&E EV-9A TOU + FPC
Case BIFlat rateBus 61
IIPG&E EV-9A TOU
IIIPG&E EV-9A TOU + FPC
Case CIFlat rateBus 9
IIPG&E EV-9A TOU
IIIPG&E EV-9A TOU + FPC
Table 5. Computation times of the simulation cases (s). DNO: distribution network operator; and CSO: charging station operator.
Simulaiton CasesDNO‘s OptimizationCSO’s Optimization
I. Flat RateII. PG andE EV-9A TOUIII. PG andE EV-9A TOU + FPC
Case A (Bus 56)28216512259
Case B (Bus 61)39718418689
Case C (Bus 9)27818351366

