Article

Hydrothermal Conversion of Neutral Sulfite Semi-Chemical Red Liquor into Hydrochar

1
School of Engineering, University of Guelph, 50 Stone Road East, Guelph, ON N1G 2W1, Canada
2
School of Applied Chemical and Environmental Sciences, Sheridan Institute of Technology, 7899 McLaughlin Road, Brampton, ON L6Y 5H9, Canada
*
Author to whom correspondence should be addressed.
Energies 2016, 9(6), 435; https://doi.org/10.3390/en9060435
Submission received: 27 March 2016 / Revised: 25 May 2016 / Accepted: 30 May 2016 / Published: 3 June 2016
(This article belongs to the Special Issue Organic Waste/Resources to Energy and Value added Product)

Abstract

:
Hydrochar was produced from neutral sulfite semi-chemical (NSSC) red liquor as a possible bio-based solid fuel for use in power generation facilities. Hydrothermal conversion (HTC) experiments were conducted using a fixed liquor-to-water volume ratio of 1:8 and reaction time of 3 h. Solutions were processed using different chemical additives, pH and temperature conditions to determine the optimum conditions required for producing a high energy content solid fuel. The hydrochar samples produced were analyzed by ultimate, thermogravimetric (TGA) and Fourier transform infrared spectroscopy (FTIR) analyses to determine physicochemical properties that are important for utilization as a fuel. The residual process liquids were also analyzed to better understand the effect of HTC process conditions on their properties. It was determined that the optimum conditions for producing a solid fuel was at a reaction temperature of 250 °C, in the presence of acetic acid at pH 3. The maximum energy content (HHV) of the hydrochar produced from red liquor at this condition was 29.87 MJ/kg, and its ash content was 1.12 wt.%. This result reflects the effect of increasing reaction temperature on the physicochemical characteristics of the hydrochar. The increase of HTC temperature significantly reduces the ash content of the hydrochar, leads to a significant increase in the carbon content of the hydrochar, and a reduction in both the oxygen and hydrogen content. These effects suggests an increase in the degree of condensation of the hydrochar products, and consequently the formation of a high energy content material. Based on TGA and FTIR analyses, hydrochars prepared at high HTC temperature showed lower adsorbed moisture, hemicellulose and cellulose contents, with enrichment in content of higher temperature volatiles, such as lignin.

1. Introduction

The changing climate and the increasing demand for clean energy are drivers in the exploration of reliable, low cost, sustainable and environmentally friendly routes to produce fuel materials that can be commercialized. The world’s total energy consumption is expected to increase by 26 percent by the year 2040 from its recent 2014 consumption of 557 quadrillion BTUs per year, after accounting for energy savings through improved efficiency [1]. Technological solutions provide a platform for the development of energy generation, and therefore require advancement. In 2014, world energy supply, by source and in decreasing order of contribution, originated from: oil 33.6%, coal 26.6%, natural gas 21.5%, biomass and waste 9.5%, nuclear 4.7%, hydro 2.3% and other renewables (solar, wind, geothermal, etc.) 1.8% [1]. As can be seen, oil, coal and natural gas are the most used energy fuels, but their use must be curbed—in order to resolve the escalating issues of global warming and the need for low-carbon fuels, it is essential to increase the adoption of renewable resources.
Biomass has recently reemerged as a key piece in the world’s energy mix. Biomass is a renewable energy source derived from living organic matter such as wood, wood waste and agricultural residues. It is predicted that it will account for over 70% of the total renewable energy supply by 2030 [2]. In the past, biomass was primarily used as a fuel source by direct combustion, resulting in low energy recovery and emission of gases harmful to the environment, such as sulfur dioxide and carbon monoxide. This largely discouraged its use, thus the amount of energy obtained from biomass to generate electricity has been minor in recent years. However, due to the carbon neutrality of biomass, using biomass as a substitute to fossil fuels in existing facilities can significantly reduce the carbon dioxide emissions. In addition, it would drastically reduce the large capital costs of constructing new “green” power facilities or modifying the existing power production network, thus serving as an adequate solution to the growing concern of fossil fuel dependence.
The replacement of fossil fuels, notably coal, by biomass in power generating facilities, however, is complicated by several undesirable issues. Biomass possesses some ineffective physical and chemical properties that limit its use as an energy source, such as its low higher heating value (HHV), low bulk density, and the high alkaline metal content in its ash [3]. Current power generating facilities are designed for the handling and storage of coal, therefore, due to the significant difference in physical and chemical properties between coal and biomass, handling and storage of biomass remains a big challenge [4].
Other issues related to biomass are its elemental and chemical composition, which includes both inorganic elements and organic compounds. In comparison to coal, biomass contains higher oxygen content and thus is extremely volatile during combustion. Longer combustion chambers are hence required to accommodate the larger gaseous fuel volume that undergoes oxidation [4]. In addition to the oxygen content, the physical and chemical properties of biomass can be a limiting factor to keep up with the energy demand on a daily basis. Due to the varying heat production output of biomass upon combustion, control of the output rate of power facilities can be challenging. Furthermore, the presence of high alkaline metal content in biomass discourages its use as a fuel source in certain power facilities, unless it undergoes further treatment before use. Alkaline metals such as potassium, sodium, phosphorus, calcium and manganese react with the sulfur present to form metal sulfates, which significantly affect the heat transfer rates of combustor heat transfer surfaces [5]. Therefore, careful consideration of additives is critical when using biomass with high alkaline metal content to manage the ash and reduce operational expenses.
While biofuels produced from re-growing resources has become an attractive alternative to fossil fuels, less attention has been paid towards utilizing residual feedstock, especially bio-waste such as corn cubs, or chemical waste such as black and red liquors from the pulp and paper industry. These untapped “treasures” can be chemically converted to more useful, reliable materials for various applications. Interest in biochar has risen dramatically in recent years due to its high-quality fuel characteristics. Compared to raw biomass feedstock, biochar contains a higher carbon content and HHV, and can significantly lower the emissions of greenhouse gases [6]. Biochar uses have been examined in various applications, including carbon sequestration and soil amendment [7].
There are various thermochemical conversion processing routes, notably pyrolysis, gasification and hydrothermal conversion (HTC), already used in industry today to convert raw biomass into higher energy density chars [8]. The main objective of the thermochemical conversion process is the densification of biomass in terms of energy content (MJ/kg). This is achievable by increasing the carbon content and decreasing the oxygen content. Pyrolysis and gasification are considered well-developed technologies, whereas, HTC is a new technology with great potential. Although the HTC process is more costly due to the complex process equipment required, it may be the suitable technology when the initial moisture level is high, since drying/evaporation is not required. A literature review on HTC treatment of biomass has been conducted by Libra et al. [9]. The biochar produced by the HTC process is called “hydrochar”. Hydrochar possesses higher quality characteristics than biochar in terms of lower ash content, and higher carbon content and HHV [10].
Recently, several experiments were conducted on the HTC of raw biomass, cellulose and kraft black liquor [6,11,12,13,14]. Some of the research conducted on black liquor has focused on the combustion kinetics and thermal behavior [15,16,17]. Black liquor has also been used as a solvent in the hydrothermal liquefaction of biomass [18]. Black liquor is considered as an attractive energy source compared to other feedstock resources: it is a waste product which requires no additional land for growing, and its intrinsic water content could be an excellent fit for HTC treatment. To date, little research has focused on the HTC of neutral sulfite semi-chemical (NSSC) red liquor (also known as brown liquor or sulfite liquor), especially to characterize the hydrochar properties and the interactions that occur during the hydrothermal carbonization process. Therefore, the goal of this study is to analyze the suitability of the hydrochar produced from the NSSC red liquor as a possible bio-based solid fuel for use in power generation facilities. Ethanol and acetic acid were utilized as additives to, respectively, aid in the lignin precipitation/separation during HTC, and to reduce the ash content of the hydrochar.

2. Materials and Methods

2.1. Hydrothermal Conversion Experiment

HTC experiments were conducted with NSSC red liquor and deionized water in a batch 1 L 4520 Parr bench top reactor (Parr Instrument Company, Moline, IL, USA). The red liquor was obtained from the Norampac Trenton mill in Trenton (ON, Canada), a plant that produces corrugating medium from hardwood and recycled pulp. A liquor-to-water volume ratio of 1:8 was used to ensure enough water was added to the reactor for a complete, uniform mixing of the liquor. Approximately 75 mL of NSSC red liquor and 600 mL of deionized water were added to the reactor. Four samples were hydrothermally converted and analyzed in the study:
  • Sample 1—75 mL of NSSC red liquor with 600 mL of deionized water at pH 6.75.
  • Sample 2—75 mL of NSSC red liquor with 600 mL of deionized water and 65 mL of glacial (17 M) acetic acid at pH 4.
  • Sample 3—75 mL of NSSC red liquor with 600 mL of deionized water, 75 mL of glacial (17 M) acetic acid and 125 mL ethanol at pH 4.
  • Sample 4—75 mL of NSSC red liquor with 600 mL of deionized water and 120 mL glacial (17 M) acetic acid at pH 3.
The pH of the NSSC red liquor and water mixture was found to be 6.75. In the case of samples 2 and 4, acetic acid was added to adjust the pH to 4 and 3, respectively, prior to the reaction. As for sample 3, 125 mL of ethanol was first added to the mixture (red liquor and water), prior to acetic acid, to enhance lignin separation. The addition of ethanol temporarily raised the pH of the mixture to 7.10, before 75 mL of acetic acid was added to the mixture to lower the pH to 4 prior to the HTC reaction. The mixtures were stirred for 5 min at 3500 rpm before the reactor was sealed and then purged with nitrogen to create an inert environment inside the reactor. The reactor was then heated to the desired temperature (±3 °C) using an 800 W cylindrical heater at a heating rate of 3 °C/min. The HTC reactions were performed at reaction temperatures of 190 °C, 220 °C and 250 °C, while keeping the reaction residence time constant at 3 h and the pressure at saturated conditions. The reaction pressures at 190 °C, 220 °C and 250 °C were 1.1 MPa, 2.4 MPa and 4.1 MPa, respectively. Once the reaction was completed, cooling water was introduced to cool down the reactor gradually at a cooling rate of 4 °C/min until it reached room temperature. In addition, there was a minor reduction in the pH of samples 2, 3 and 4 to 3.96, 3.97 and 2.97, respectively. The gaseous phase was released into a fume hood through the gas outlet valve and the liquid product was released from the liquid discharge valve at the bottom of the reactor assembly for further analysis. The solid hydrochar product was then collected from the inside of the reactor, left to be dried overnight in an oven at 105 °C, and the dry mass was measured.

2.2. Ultimate Analysis

The ultimate analysis test was performed using 2.0 ± 0.5 mg of dried solid sample in a Flash 2000 Elemental Analyzer (Thermo Fisher Scientific, Waltham, MA, USA). The carbon, hydrogen, nitrogen and sulfur contents of each sample was measured using the elemental analyzer and the oxygen content was calculated by subtracting the sum of the carbon hydrogen, nitrogen, sulfur and ash content from one hundred percent. In general, the carbon content of biomass is typically in the range of 35% to 58% (dry basis) [19]. An increase in the amount of carbon and hydrogen content leads to an increase in the HHV. The samples were burnt in a pure oxygen atmosphere. In order to achieve accurate results, the solid samples were ground to allow for a more homogenous distribution.

2.3. Thermal Analysis

Thermal analysis was conducted for hydrochar characterization to determine moisture, volatile/combustible matter, and ash contents. Moisture content relates to the amount of water present in the fuel as a percent of the fuel’s total mass, and is considered one of the most important characteristics of biomass. Low moisture content is favorable because it results in a higher heating value due to the less energy requirement to convert the moisture into steam during combustion. The moisture in the biomass exists as water adsorbed on the walls of the biomass particles and free water within the biomass [20]. Whereas volatile matter is the part of biomass expelled to gas during the pyrolysis of biomass, combustible matter content is the remaining portion of biomass that is expelled upon oxidation.
Due to the small amounts of solid hydrochar produced from the HTC reactions, instead of traditional proximate analysis, thermal analysis was done using thermogravimetric analysis (TGA) [15,16,17]. It was performed using a DSC-TGA SDT Q600 unit (TA Instruments, New Castle, DE, USA). Thermal analysis parameters were obtained from the weight loss of the hydrochar samples at various temperature ranges (Figure 1a).
Differential scanning calorimetry (DSC) data was collected with the Q600 for the raw red liquor. An ash test was also carried out using the ASTM E1755 standard to validate the TGA method. Here, 0.5 to 1.0 g of dried sample was placed in a muffle furnace with air at 575 °C ± 15 °C for at least 4 h. As for the TGA methodology, the analysis was performed using approximately 8 to 10 mg of oven dried sample at a heating rate of 15 °C/min at temperatures from ~20 °C to 950 °C. The sample was placed in an alumina crucible, which is a cylindrical container with an internal diameter of 5 mm and a height of 4 mm. The temperature was first raised to 105 °C using nitrogen gas (100 mL/min, in order to eliminate heat and mass transfer limitations [21]) and held isothermally for 2–3 min for the weight to stabilize and drive off any post-drying adsorbed moisture. The temperature was then ramped to 900 °C and held isothermally for 2–3 min, followed by further temperature ramping to 950 °C. At 900 °C, the atmosphere was switched to air at a flow rate of 100 mL/min to create a combustion environment to eliminate any remaining combustible matter. The major weight loss occurs in the temperature range of 120 °C to 650 °C, due to the break-down of organic compounds releasing mainly carbon dioxide, carbon monoxide and methane. Once the sample was completely combusted, the final residue was considered as ash.

2.4. Calorimetry

Calorimetry was used to measure the higher heating value (HHV), which is the amount of heat liberated through combustion of fuel. The HHV of dried solid samples were analyzed using IKA-C200 bomb calorimeter (IKA Works, Wilmington, NC, USA). An amount of 1.0 ± 0.5 g of dried solid sample was placed in a ceramic crucible and fitted in a steel decomposition vessel. In order to achieve accurate results, the solid samples were ground and sieved to <1 mm to allow for a more homogenous distribution. The vessel was then securely tightened by pressurizing to 30 bar using oxygen, and placed inside the calorimeter filled with water at room temperature. The change in water temperature before and after the ignition of the sample (via a cotton thread placed in the sample and connected to an ignition wire) was used to calculate the HHV of the sample.

2.5. Fourier Transform Infrared Spectroscopy (FTIR)

A PerkinElmer Spectrum Two instrument (PerkinElmer, Waltham, MA, USA) was used to obtain the infrared spectra of the samples, recorded from 4000 to 400 cm−1 with a resolution of 2 cm−1 in transmission mode. This analysis allowed identification of functional groups in the solid samples. Dried solid samples, 0.1 g in mass, were pressed into disks using a manual hydraulic press (Specac Limited, Orpington, UK) at a force of 100 N. In addition, liquid samples were also analyzed by filling the crucible with no applied force. The residual liquid by-product from the HTC reactions were analyzed to characterize dissolved compounds.

2.6. Inorganic Metal Analysis

The biggest challenge biomass faces as an alternative fuel source is the presence of alkaline metals. The trace amounts of non-combustible inorganic elements in hydrochar are responsible for the formation of ash. The amount of ash generated depends on the temperature and solvent used in the hydrothermal process. To determine the effect of the hydrothermal treatment on the fate of alkaline metals, process liquid by-product samples were analyzed for inorganic elemental concentration. The testing of the liquid samples was performed using an ICS-5000 ion chromatograph (Thermo Scientific, Waltham, MA, USA). The inorganic elements detected in the analysis were calcium, magnesium, manganese, potassium, phosphorus and sodium.

3. Results

3.1. Hydrochar

3.1.1. Ultimate Analysis

Table 1 shows the ultimate analysis performed on the hydrochar samples prepared at different HTC reaction temperatures and using the following reaction media:
Sample 1—Red liquor with water only at pH 6.75.
Sample 2—Red liquor, water and acetic acid at pH 4.
Sample 3—Red liquor, water, ethanol and acetic acid at pH 4.
Sample 4—Red liquor, water and acetic acid at pH 3.
As the results show, the carbon content of dry raw red liquor was only 29 wt.%, and was enhanced after hydrothermal conversion with the additions of water, acetic acid and ethanol. The carbon content of the hydrochar products was in the 54–74 wt.% range. Sample 4 recorded the highest carbon content among the samples at each carbonization temperature. It should be noted that for a carbonization temperature of 250 °C, the percentage of carbon fixed in the hydrochar was in the 65–74 wt.% range, sample 4 being the highest with 73.6 wt.%, which is closely comparable to that of a reference bituminous coal. Moreover, the oxygen content of the hydrochar samples decreased with increasing reaction temperature to reach a minimum of 18.5 wt.%, which is still higher than that recorded for coal at 11.4 wt.%. The hydrogen content varied only slightly with reaction severity in the range of 6 wt.%, comparable to that of coal. On the other hand, it was observed that an increase in the HTC reaction temperature, i.e., from 220 °C to 250 °C, causes a decrease in the O/C and H/C atomic ratios, suggesting an increase in the degree of condensation of the hydrochar products. Moreover, the analysis of the samples indicated that no sulfur was present, which is a requirement of high quality coal.

3.1.2. Thermal, Gravimetric and Calorimetric Analyses

Thermal analysis of the samples was also performed using TGA, and mass yield and HHV were also determined; the results are presented in Table 2.
The mass yields of the hydrochars, defined as the fraction of the initial red liquor dry weight that was recovered after hydrothermal conversion, were in the 45%–75% range, and significantly decreased as the reaction temperature increased. The maximum yield of 75% was obtained by sample 1 at 190 °C. In addition, the increase of reaction temperature significantly affects the color and physical appearance of the solid hydrochar; the appearance of the hydrochar was more coal-like black at 250 °C.
As for the energy content, the HHV of raw red liquor was only 12.5 MJ/kg, while with the reaction in water, acetic acid and ethanol, together with increasing temperature, the HHV increased drastically. The HHV of the solid hydrochar, with the addition of water only, yielded an average of 25 MJ/kg for all samples, which is almost double the HHV value of the raw red liquor. At 190 °C, the HHV is favored in a strongly acidic environment, reflected in sample 4 that had the highest HHV recorded of 26.2 MJ/kg. There was further increase of HHV for all samples at 220 °C, with an average of 28.2 MJ/kg. The highest HHV of 30 MJ/kg was achieved by samples 2, 3 and 4 at 250 °C. This result is comparable to the HHV of coal at 32 MJ/kg, which confirms the benefit of acetic acid in the HTC of red liquor to produce a high-quality fuel.
Ash content represents one of the biggest challenges for utilization of high energy content biomass-derived hydrochar for power generation due to the operational difficulties it causes. The ash contents of the reference bituminous coal and raw red liquor were 7.80 wt.% and 10.39 wt.%, respectively. As seen in Table 2, the ash yield of each sample is significantly reduced as the reaction temperature increased. Sample 4 recorded the lowest ash content at every reaction temperature tested. The lowest ash content recorded was 1.1 wt.% obtained by sample 4 at 250 °C.
TGA was used to provide in-depth understanding of the combustion characteristics of the red liquor and its constituents. The analysis was carried out under inert atmosphere using nitrogen gas, followed by a short exposure to a combustion environment using air. The different weight loss regimes and their rates as a function of temperature are evidence that the decomposition of red liquor occurs in stages due to its inherent chemical properties. In general, biomass has high amounts of moisture and low-temperature volatile matter, and low amounts of fixed carbon, which results in low combustion efficiency. The moisture contents of the reference bituminous coal and raw red liquor were 0.48 wt.% and 6.39 wt.%, respectively.
The main decomposition of carbonaceous content of red liquor occurred in the temperature range of 120 °C–650 °C, shown in Figure 1a and as the Raw RL curves in Figure 2. The weight loss occurring at approximately 800 °C–900 °C is attributable to the decomposition of sodium carbonate salt [22,23]; sodium content of red liquor is high as sodium sulfite is used in the neutral sulfite pulping process. This weight loss is accompanied by a strong endothermic peak detected by DSC, as shown in Figure 1b, which is characteristic of the thermal decomposition of inorganic salts.
Figure 2a shows the TGA profile of hydrochar samples prepared at 190 °C. Samples 1 and 2 also showed considerable moisture-attributed weight losses in the range of 7–10 wt.% (Table 2). On the other hand, samples 3 and 4 showed reduced moisture losses of 2–4 wt.%. As the TGA temperature increases, the weight loss of the hydrochar samples can be divided into three stages. During the first stage, the temperatures that promote maximum volatilization rate were in the range of 120 to 320 °C. During this stage, most samples experienced at least 50 wt.% weight loss. In this temperature range, raw red liquor lost 35 wt.% of its initial weight. However, higher weight loss was observed for samples 2 and 3 at around 75 wt.%. In the second stage, from 320 to 500 °C, another major weight loss was observed for all samples. Approximately 18 wt.% weight loss was observed for raw red liquor. Sample 3 only experienced 5 wt.% weight loss. The largest weight loss observed for sample 4 was roughly 40 wt.%. In the third stage, above 500 °C, remaining lignin was the most difficult to decompose compound, and therefore slow decomposition and minor weight loss was observed for all samples.
By increasing HTC temperature to 220 °C (Figure 2b), the hydrochar profiles shifted towards higher temperatures, especially in the second and third decomposition stages. The weight loss due to moisture was reduced significantly, especially for samples 2, 3 and 4 with just over 2 wt.% weight losses up to 120 °C. At HTC temperature of 220 °C, the weight losses of the hydrochar samples in the first decomposition stage (120–320 °C) were reduced to around 15–35 wt.%. Samples 3 and 4 lost around 85 wt.% of their initial weights by the end of the second decomposition stage (320–500 °C). Lastly, an average of 10% weight loss of the hydrochar samples was observed in the third decomposition stage (500–950 °C).
At an HTC temperature of 250 °C (Figure 2c), minor weight loss of the hydrochar samples was observed in the first decomposition stage. All samples, except for sample 1, demonstrated similar TGA profiles, with major weight losses occurring in the second decomposition stage, extending into the early part of the third decomposition stage. Unlike the other samples, the TGA profile of sample 1 did not change as much compared to its profiles in at previous reaction temperatures, indicating poor performance of water only as a reaction medium. For samples 2, 3 and 4, about 90 wt.% weight loss was observed between 320 °C and 550 °C. Later in the third decomposition stage, negligible weight loss was recorded for these samples, which is suggestive of fully volatilized hydrochar with small ash residue.

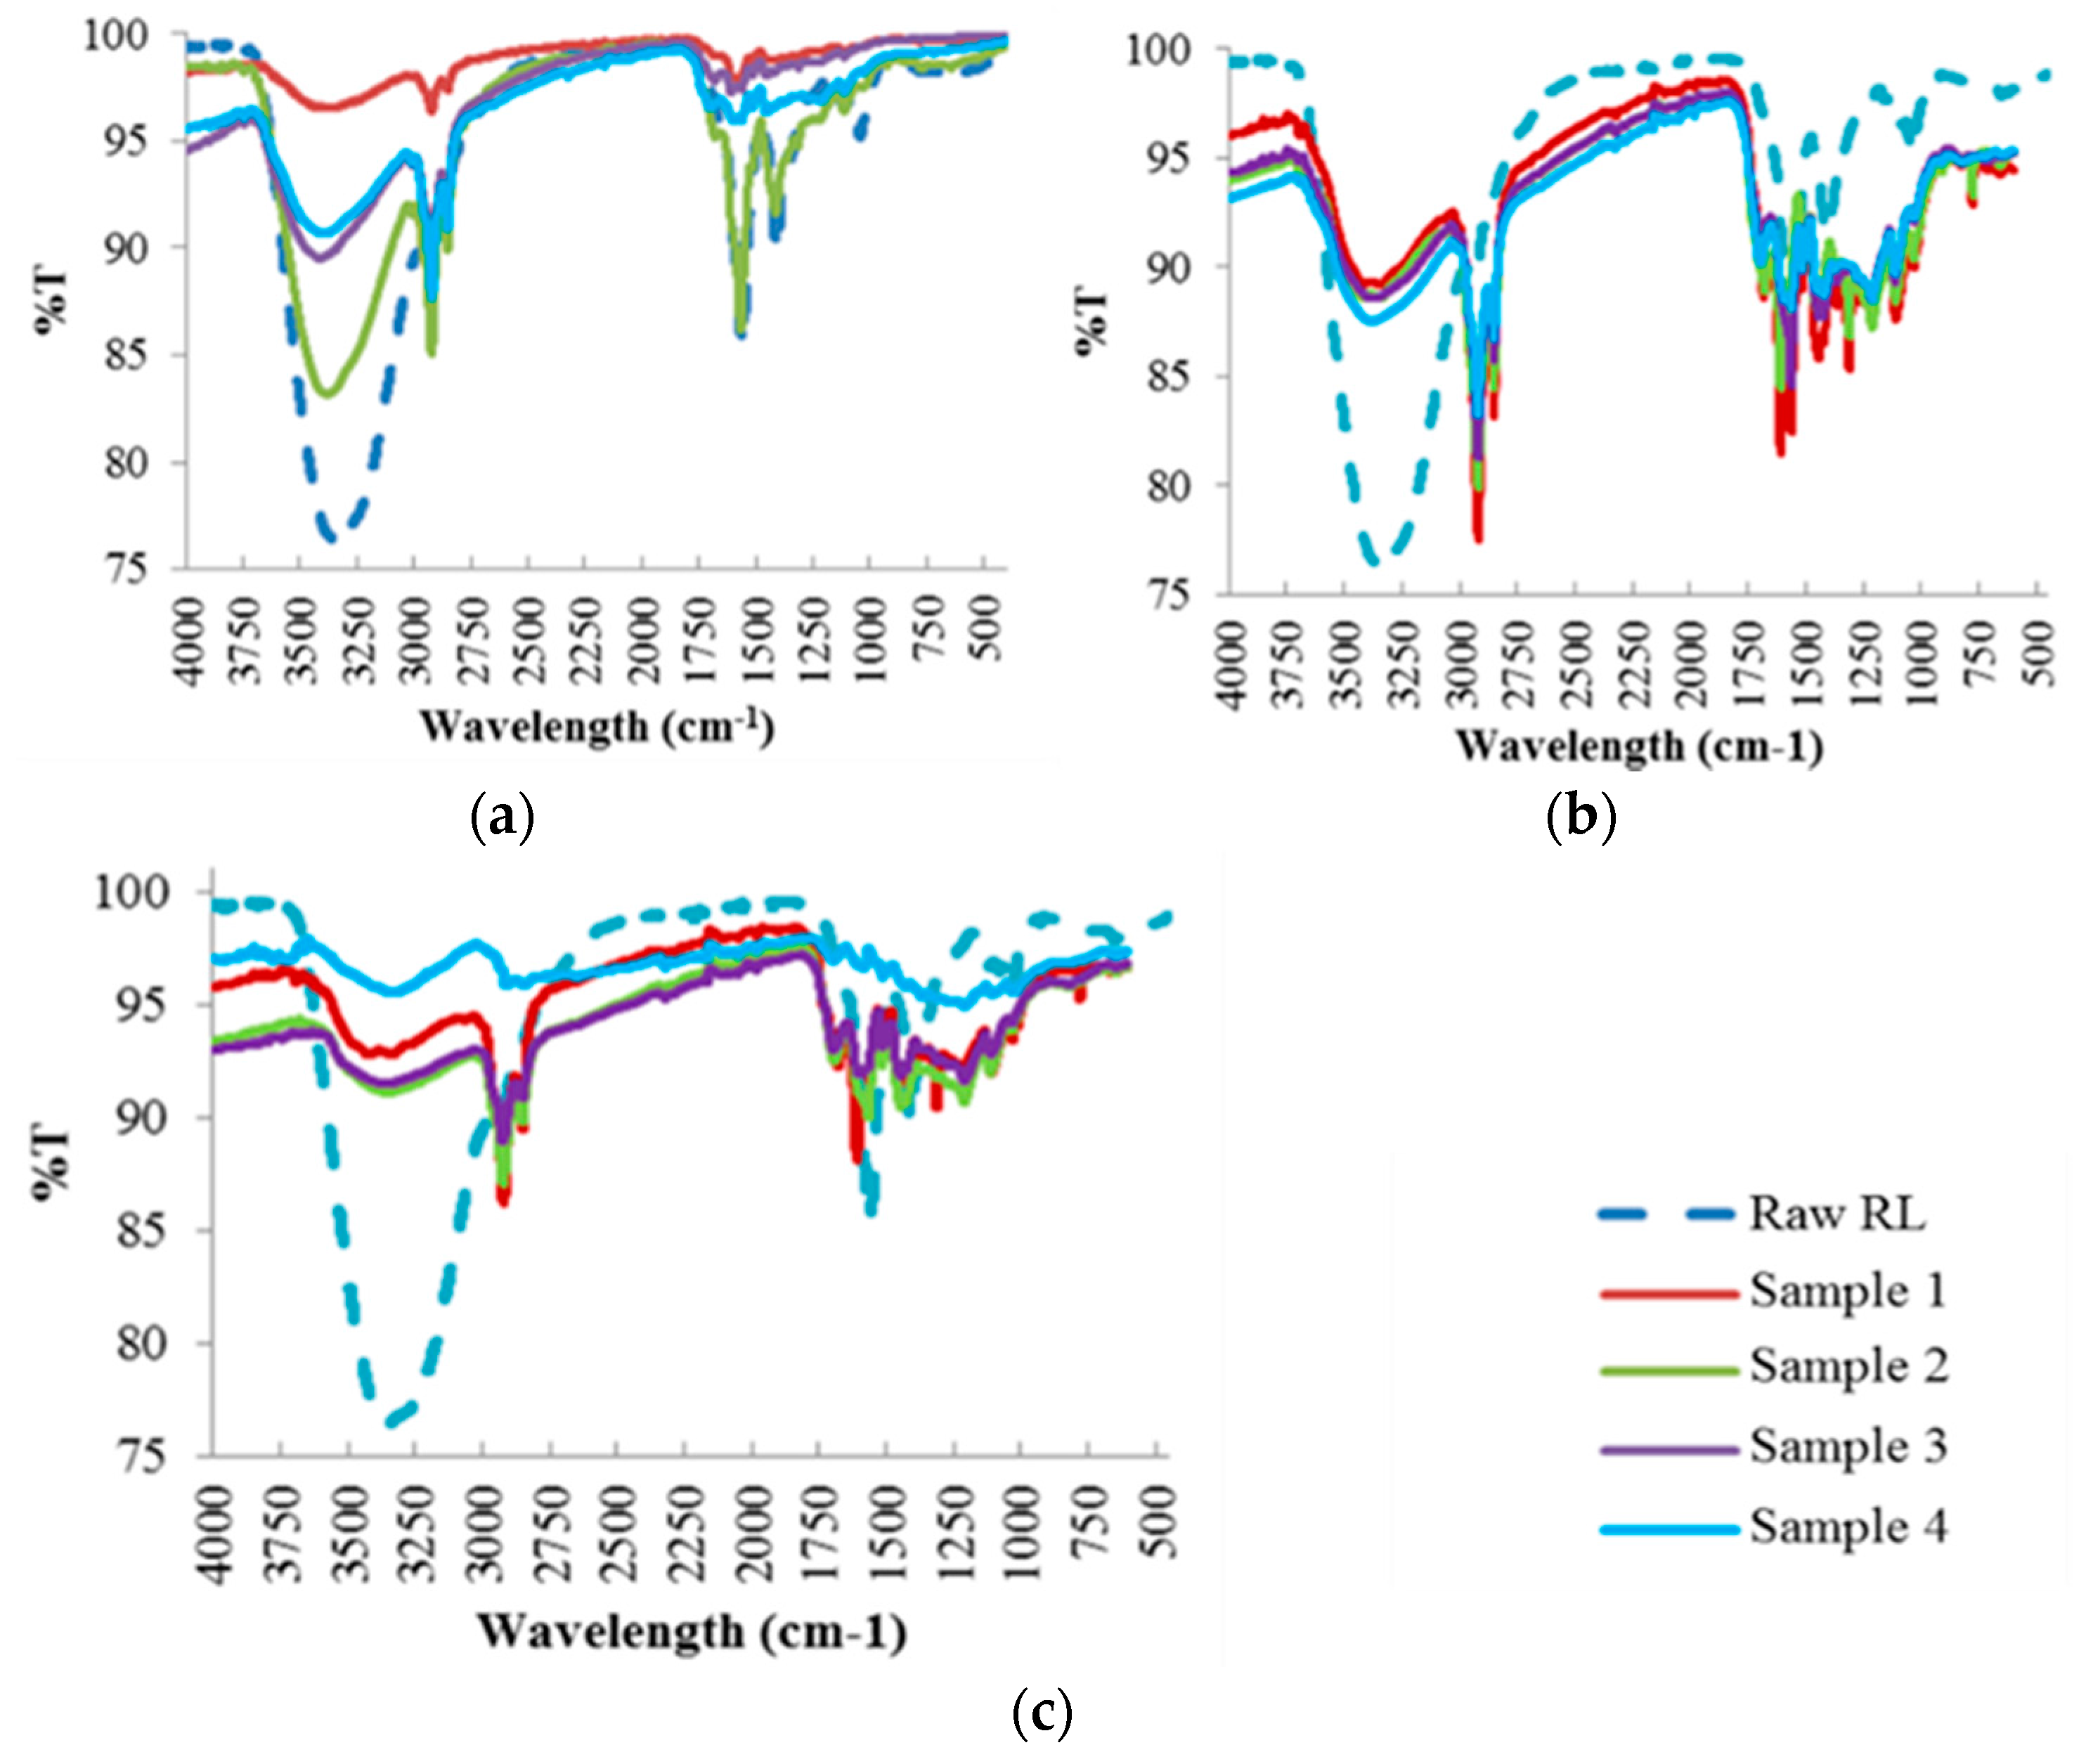
3.1.3. Fourier Transform Infrared Spectroscopy (FTIR)

The chemical transformations that occur when raw red liquor is converted into carbonaceous products at different HTC reaction temperatures were examined by FTIR (Figure 3). The analysis of the FTIR results is further discussed in Section 4.1.3.

3.2. Process Liquid (Residual By-Product)

3.2.1. Fourier Transform Infrared Spectroscopy (FTIR)

Like the hydrochar samples, FTIR analysis (Figure 4) was also conducted to investigate the compounds found in the residual process liquid, based on the chemical bonds represented by the absorption peaks at each wavelength. Further analysis of these results is discussed in Section 4.2.1.

3.2.2. Inorganic Metal Analysis

Figure 5 shows the effect of HTC on the inorganic metal composition of the residual process liquid samples. The high concentration of inorganic elements, notably calcium (Ca), potassium (K) and sodium (Na), in the residual process liquid samples collected after HTC at 250 °C suggests that the removal yield of these inorganic elements from the hydrochar samples is highest at that temperature. The majority of the inorganic impurities such as calcium, sodium, magnesium (Mg) and potassium are present in the hemicellulose fraction of the liquor [24]. Thus, the removal of the hemicellulose into the liquid phase during the HTC process explains the demineralization phenomena of the hydrochar samples. The concentration of sodium for samples 1 and 2 at 190 °C was above the detection limit (>100 mg/L), whereas for samples 3 and 4, the concentration was also high, in the 60–80 mg/L range. As the reaction temperature is increased to 220 °C, the loss of sodium from the hydrochar samples, especially samples 3 and 4, is evident. As a result, the concentration of sodium for all samples prepared at 220 °C and 250 °C was above the detection limit (>100 mg/L). In addition, the concentration of calcium in the residual liquid is seen to increase with reaction temperature, especially for samples 1 and 2. The concentrations of calcium for liquid samples 3 and 4 were in the region of 15–20 mg/L, with insignificant changes observed for different processing temperatures. In the case of potassium, the concentrations in the residual process liquid were considerably lower compared to calcium and sodium. Similarly to calcium and sodium, temperature increase had a direct effect in the concentration increase of potassium. It should be noted that the concentration of potassium was highest for sample 1 and lowest for sample 4 at each reaction temperature. Furthermore, the concentrations of magnesium, manganese (Mn) and phosphorus (P) in the residual process liquids were also measured; however, these concentrations were significantly lower than the aforementioned elements.

4. Discussion

4.1. Hydrochar

4.1.1. Ultimate Analysis

The HTC process involves dehydration, condensation, and decarboxylation reactions, resulting in a loss of hydrogen and oxygen atoms. As the HTC reaction temperature increases, the carbon content of the hydrochar samples significantly increases, along with reduction in both oxygen and hydrogen contents, suggesting an increase in degree of condensation of the hydrochar products, and consistent with the formation of a well-condensed material. Out of these changes, oxygen loss is of the greatest importance and is most desirable, because it directly affects the energy content. In addition, higher carbon content is favorable to allow the production of valuable carbonaceous products. As seen in Table 1, the hydrogen content varied only slightly with reaction severity. Moreover, the majority of the samples have low nitrogen content of less than 0.80 wt.%. This is favorable since the combustion capability of nitrogen of being converted to nitrogen oxides (NOx) during combustion causes air pollution concerns; an insignificant amount of nitrogen converts to ash. Moreover, the analysis of the samples indicates that no sulfur is present, which is required for high quality coal. The sulfur content of biomass generates sulfur dioxide (SO2), which forms sulfates that may condense in the boilers causing fouling or accumulate in the ashes. The obtained results suggest that the hydrothermal carbonization of red liquor is an effective way to increase the carbon content present in the biomass, and the resulting hydrochar demonstrates similar composition to coal.
The increase in reaction temperature decreases the O/C and H/C atomic ratio as observed in the Van Krevelen diagram (Figure 6). The Van Krevelen diagram is a classical method to demonstrate changes in atomic C, H, and O compositions [9]. In this figure, typical ranges for biomass, peat, lignite and coal are indicated. The starting red liquor feedstock is shown in the upper right corner of the diagram, within the typical biomass region. The figure illustrates that with higher HTC process severity, the resulting sample 4 hydrochar becomes increasingly similar to coal. It can be seen that the removal of oxygen and hydrogen from the biomass results in the increase in carbon content and shifts the hydrochar from the biomass region towards the coal regions. At a reaction temperature of 190 °C, the hydrochar possesses H/C and O/C ratios similar to peat, while at 250 °C or higher, the hydrochar is similar to that of low-grade coal.

4.1.2. Thermal, Gravimetric and Calorimetric Analyses

As shown in Table 2, there was a decrease in mass yield with increasing temperature. This phenomena indicates that high solubilisation of components occurred during the reaction and increased cracking of the hydrothermal red liquor products to form gas-phase and/or liquid-phase by-products [19]. The highest HHV of 30 MJ/kg recorded among the hydrochar samples was due to the addition of acetic acid, which has been suggested to cause degradation of cellulose in biomass to increase the percentage of lignin, and therefore increases the overall HHV [25]. In addition, the increase in HHV was due to the formation of 5-hydroxymethylfurfural (5-HMF) in the liquid phase (more discussion on this in Section 4.2). This result indicates the great potential of using acetic acid in the HTC processing of red liquor to produce a high-quality fuel.
The formation of ash and the high inorganic metallic content present in them remains one of the biggest challenges for biomass combustion and for producing high energy-content hydrochar. Inorganic metallic content such as arsenic, mercury, lead are toxic and carcinogenic, therefore they can cause serious negative health impacts on humans and increased environmental risks. Moreover, inorganics cause fouling and slagging in the boilers, which can significantly affect combustion and the thermal efficiency of a system. For the obtained hydrochar samples, significant reduction in the ash yield was observed with increase of reaction temperature. The significant reduction in the ash yield is directly associated to the removal of inorganic metals from the hydrochar to the residual process liquid by-product. Sample 4, prepared with acetic acid at pH of 3, recorded the lowest ash content at each reaction temperature. The lowest ash content recorded was 1.1 wt.% at 250 °C HTC temperature.
In the TGA analysis, the drop in weight exhibited by the samples up to 120 °C was due to the adsorbed moisture content present in them (samples were dried at 105 °C prior to TGA analysis). There are two methods in which water is adsorbed in the biomass; non-bonded (cell wall) and bonded (hydrogen-bonded to the hydroxyl groups of cell wall). As structural changes of the biomass take place during the HTC process, non-bonded moisture increases, whereas bonded moisture decreases. Unlike cellulose and lignin, hemicellulose exhibits high water adsorption capacity. Therefore, removal of hemicellulose from the hydrochar during HTC lowers its tendency to adsorb water and makes it a hydrophobic product [26]. The loss of moisture content is associated with the loss of interlayer water from the red liquor, loss of hemicellulose and the evaporation of volatile organic materials such as dimethyl sulfide [27].
As the TGA heating temperature increased, the weight loss of the hydrochar samples can be divided into three stages: below 320 °C, between 320 °C to 500 °C, and above 500 °C. During the first decomposition stage, most samples hydrothermally treated at 190 °C experienced at least 50 wt.% weight loss, which can been attributed to hemicellulose degradation and decomposition of some organic matters, such as small molecular weight organic acids, and oligosaccharides [27]. Higher weight loss was observed for samples 2 and 3, which indicates that small amounts of acetic acid and ethanol had enhanced the hemicellulose content in the hydrochar and its complete degradation to form sugars such as xylene.
In the second decomposition stage, from 320 °C to 500 °C, another major weight loss occurs for all samples hydrothermally treated at 190 °C, which can be associated with the decomposition of cellulose and larger molecular weight organic acids. Approximately 18 wt.% weight loss was observed for raw red liquor in this stage, which indicates lower cellulose content than hemicellulose. Sample 3 only experienced 5 wt.% weight loss, indicating very low cellulose content compared to its hemicellulose content. The largest weight loss observed was by sample 4, which suggests high cellulose content that leads to its decomposition to form organic acids and hydronium ions from the acetic acid added to act as the catalysts for reaction [11].
In the third decomposition stage, above 500 °C, lignin, which was the most difficult to decompose compound, decomposes slowly, but minor weight loss for all samples was observed, suggesting small quantities of lignin compared to other biomass compounds. Moreover, decomposition some inorganic salts occur at these temperatures. The remaining residue left uncombusted above 900 °C, when the atmosphere was switched to air, is considered as the ash content.
The increase of HTC temperature to 220 °C shifts the hydrochar profiles towards higher decomposition temperatures, primarily in the second and third stages. The highest weight loss demonstrated by the hydrochars was in the second stage, associated with the degradation of cellulose and larger molecular weight organic acids [11]. Sample 3 and 4 lost around 85 wt.% of their initial weight at the end of the second stage. Likewise, the samples hydrothermally reacted at 250 °C showed major weight losses only in the last two decomposition stages, except for sample 1, which indicates that lignin makes up a dominant fraction of the hydrochars. The lack of evolution in the TGA profile of sample 1 demonstrates that water alone is not a suitable medium for hydrothermal treatment of red liquor. The most evolved profile was that of sample 4, which indicates the benefit of acetic acid and the higher degree of pH adjustment (to 3) in producing a fuel that exhibits high temperature volatilization.

4.1.3. Fourier Transform Infrared Spectroscopy (FTIR)

The FTIR analysis results were analyzed using Table 3 [28,29,30,31], which demonstrates the functional groups assigned to every band wavelength present in the hydrochar samples. For raw red liquor, large water content attributed to –OH stretching band in the region of 3200–3500 cm−1 was observed. The presence of aromatic rings is also evidenced by the band at 1620 cm−1, attributed to C=C vibrations and to the bands in the 750–850 cm−1 region, assigned to aromatic C–H out-of-plane bending vibrations. An aromatic skeletal vibration combined with C–H in plane deformation was also observed in the band at 1420 cm−1. In addition, the presence of cellulose and hemicellulose was observed by the band at 1050 cm−1 assigned to C–O stretching in hydroxyl, ester or ether.
Similarly to raw red liquor, the hydrochar samples at 190 °C had a significant band in the 3200–3500 cm−1 region attributed to water content (–OH stretching band) but with varying band intensity. The greatest absorption intensity for all hydrochars, particularly samples 2, 3 and 4, was observed in the region of 2800–3000 cm−1 which corresponds to the stretching vibrations of aliphatic C–H. This finding suggests that the hydrochars possess aliphatic structures. Samples 3 and 4 had significant absorption intensity in the 1650–1720 cm−1 region that is attributable to O–H and C=O vibrations corresponding to carbonyl, ester or carboxyl functions. The presence of aromatic rings is also evidenced by the band at 1620 cm−1, attributed to C=C vibrations, with higher absorption intensity for sample 2. Aromatic C=C stretching from aromatic ring of lignin in the 1450–1550 cm−1 band region was evident for samples 3 and 4. Moreover, the presence of cellulose and hemicellulose, particularly for samples 2 and 4, was observed by the band at 1050 cm−1 assigned to C–O stretching in hydroxyl, ester or ether.
As can be seen, with increasing reaction temperatures i.e., 220 °C and 250 °C, the band regions that represent the oxygen groups at 3200–3500 cm−1 (attributed to the –OH stretching in hydroxyl groups), 1710 cm−1 (C=O vibrations corresponding to carbonyl, ester or carboxyl) and 1050–1450 cm−1 (C–O stretching in hydroxyl, ester or ether) decrease in intensity. Moreover, the intensity of the band strength at 1740 cm−1, represented by the C=O stretching of unconjugated ketone and carbonyls in hemicellulose, becomes weaker with increasing reaction temperature. This finding agrees with the TGA profiles of the hydrochars (Figure 2) that suggest a decrease in weight loss of the hydrochars in the first stage when the reaction temperature is increased. Both findings imply that a large fraction of hemicellulose is removed from the hydrochar into the liquid by-product. The peak band at 1620 cm−1, attributed to the presence of aromatic rings, decreases with increasing reaction temperature, especially for samples 2 and 3, and is not detected at 250 °C. This implies that the moisture is unable to form hydrogen bonds due to the breakdown of the structure during high reaction temperatures. The intensity of the band region 1050–1450 cm−1, affiliated to the C–O and C–C stretching in cellulose and hemicellulose, becomes weaker with increasing reaction temperature, resulting in the removal of large fractions of cellulose and hemicellulose from the hydrochars. On the other hand, the intensity of the lignin band at 1501 cm−1 increases with increasing reaction temperature, and significantly so for samples 2, 3 and 4. This suggests that hydrothermal carbonization managed to enhance the lignin composition of the hydrochar and the removal of hemicellulose.

4.2. Process Liquid (Residual By-Product)

It has been reported that the liquid by-product of the HTC process contains organic and phenolic acids such as acetic acid, formic acid and levulinic acid, and 5-hydroxymethylfurfural (5-HMF) formed by the degradation of biomass polymers primarily hemicellulose and cellulose [32,33]. The HHV of 5-HMF is approximately 22 MJ/kg, which is notably higher than hemicellulose and cellulose, and close to that of lignin with 23.3–26.6 MJ/kg [34]. During the HTC process, small pores are formed in the hydrochar which enables the 5-HMF to precipitate on them, further enhancing the energy densification of hydrochars [34]. Moreover, acetic acid addition can influence the formation of 5-HMF in the liquid by-product [35]. The generation of 5-HMF in the residual process liquid strongly depends on operating conditions such as reaction time, temperature and amount of acid used in the process. Generally, adequate amounts of acetic acid can increase of the overall HHV if the 5-HMF is deposited in the porous hydrochar structure [36]. However, excess amount of acetic acid can convert 5-HMF to levulinic and formic acids. Both HMF and levulinic acids serve as important key building blocks in the manufacture of high-value chemicals and materials. They were also listed in the “Top 12 value added chemicals from biomass” by the US Department of Energy [37]. The identification, characterization and recovery of these high quality intermediate compounds provide a potential platform for the chemical manufacturing industry [32].

4.2.1. Fourier Transform Infrared Spectroscopy (FTIR)

For raw red liquor, a large water content evidenced by the –OH stretching band in the region of 3200–3500 cm−1 was observed. The presence of aromatic rings is also evidenced by the band at 1620 cm−1, attributed to C=C vibrations and to the bands in the 750–850 cm−1 region, assigned to aromatic C–H out-of-plane bending vibrations. An aromatic skeletal vibration combined with C–H in plane deformation was also observed in the band at 1420 cm−1. In addition, the presence of cellulose and hemicellulose was observed by the band at 1050 cm−1 assigned to C–O stretching in hydroxyl, ester or ether.
Similarly to red liquor, significant water content was observed for all residual process liquid samples from the hydrothermal treatment at 190 °C, except for liquid sample 1, but with varying intensity in the region of 3200–3500 cm−1 attributed to –OH stretching band. Unlike the hydrochar samples, no band signals were observed in the 2800–3000 cm−1 band region which corresponds to the stretching vibrations of aliphatic C–H, therefore the liquid samples do not contain aliphatic structures. The presence of aromatic rings was evident for liquid samples 2, 3 and 4 represented by the band at 1620 cm−1, attributed to C=C vibrations. There was no cellulose and lignin present in the residual process liquid samples due to the absence of band signals in the 1050–1100 cm−1 and 1450–1550 cm−1 band regions, assigned to aromatic C=C stretching of lignin ring and C–O stretching in hydroxyl and ester, respectively.
As can be seen with increasing reaction temperature, i.e., 220 °C and 250 °C, the water content in the residual process liquid is still substantial, with the increase in band intensity in the 3200–3500 cm−1 band region, attributed to –OH stretching. The peak band at 1620 cm−1, attributed to the presence of aromatic rings, increases with increasing reaction temperature, which suggest the breakdown of the structure during the HTC process at higher temperature as illustrated in the FTIR of the hydrochar samples. In addition, the intensity of the band region 1200–1450 cm−1, affiliated to the C–O and C–C stretching in cellulose and hemicellulose, becomes stronger with increasing reaction temperature, which indicates the removal of large fractions of cellulose and hemicellulose from the hydrochar samples into the residual liquid samples. Unlike the hydrochar samples, no band signals assigned to aromatic C=C stretching of lignin were observed at 1501 cm−1, which indicates that the HTC process did not manage to decompose/degrade lignin and it still had strong presence in the hydrochar samples.

4.2.2. Inorganic Metal Analysis

The inorganic elemental composition in biomass varies according to the type of biomass and process operating conditions. The inorganic elements analyzed for were calcium, magnesium, manganese, potassium, phosphorus and sodium. These inorganic impurities, if present in the hydrochar, are left as residue in the form of ash during combustion. In addition, they exist in their oxide form in ash and exhibit undesirable negative effects such as corrosion and fouling [38]. The inorganic elements in lignocellulosic biomass are generally held in hemicellulose and soluble extractives [22]. Hence, the removal of hemicellulose can reduce the inorganic elemental composition in the hydrochars. This effect is observed in both the TGA and FTIR results of the hydrochar samples (Figure 2 and Figure 3) for samples prepared at high HTC reaction temperatures, where complete conversion of hemicellulose occurred. Figure 5 shows that these inorganic elements were leached into the liquid by-product.
Under HTC process conditions, the degradation and depolymerisation of hemicellulose and cellulose improves the hydrochar porosity. It has been noted that such enhanced porous structure may allow the leaching of alkaline inorganic elements that were previously held in the cross-linked matrix of biomass [34]. To reduce the concentration of inorganic elements further, acetic acid and ethanol were used to help solubilize and leach out these inorganic elements from the hydrochar samples [25].

5. Conclusions

Based on the results of this study, it can be stated that, under well optimized conditions, it is possible to produce a fuel from NSSC red liquor that can potentially be used in at least partial substitution of coal in power generation facilities. The following are the main findings of this study:
  • The carbon content of the hydrochar increased with an increase in reaction temperature, with the maximum value (73.6 wt.%) achieved at 250 °C, reaction time of 3 h, using acetic acid at pH 3 as an additive.
  • The conditions that maximized carbon content also maximized HHV (29.87 MJ/kg), and minimized ash content (1.12 wt.%).
  • Among the HTC operational parameters varied, the reaction temperature had the most dominant effect on the hydrochar properties. Addition of acetic acid, and the resulting reaction medium pH reduction, had the next most significant effect.
  • The liquid by-product is the sink for undesired inorganic elements and degraded organics.

Acknowledgments

We acknowledge the support to the research provided by the laboratory staff of the University of Guelph and at the Sheridan Institute of Technology.

Author Contributions

Ramy Gamgoum, Animesh Dutta and Yi Wai Chiang designed the experiments; Ramy Gamgoum performed the experiments; Ramy Gamgoum, Rafael M. Santos and Yi Wai Chiang analyzed the data; Rafael M. Santos contributed materials, equipment and analysis tools; all authors co-wrote the manuscript.

Conflicts of Interest

The authors declare no conflict of interest.

Abbreviations

The following abbreviations are used in this manuscript:
FCFixed Carbon
FTIRFourier Transform Infrared Spectroscopy
HHVHigher Heating Value
HMFHydroxymethylfurfural
HTCHydrothermal Conversion
NSSCNeutral Sulfite Semi-Chemical
RLRed Liquor
TGAThermogravimetric Analysis
VMVolatile Matter

References

  1. The Outlook for Energy: A View to 2040. Available online: http://cdn.exxonmobil.com/~/media/global/files/outlook-for-energy/2016/2016-outlook-for-energy.pdf (accessed on 17 April 2016).
  2. IEA World Energy Outlook 2014. Available online: http://www.iea.org/textbase/npsum/weo2014sum.pdf (accessed on 25 January 2016).
  3. Demirbas, A. Estimating of structural composition of wood and non-wood biomass samples. Energy Sources 2005, 27, 761–767. [Google Scholar] [CrossRef]
  4. Kappejan, J.; Van Loo, S. Biomass fuel properties and basic principles of biomass combustion. In The Handbook of Biomass Combustion and Co-Firing, 2nd ed.; Earthscan: London, UK, 2008; Volume 1, pp. 7–34. [Google Scholar]
  5. Saddawi, A.; Williams, J.M.; Le Coeur, C. Commodity fuels from biomass through pretreatment and torrefaction: Effects of mineral content on torrefied fuel characteristics and quality. Energy Fuels 2011, 26, 6466–6474. [Google Scholar] [CrossRef]
  6. Kang, S.; Li, X.; Fan, J.; Chang, J. Solid fuel production by hydrothermal carbonization of black liquor. Bioresour. Technol. 2012, 110, 715–718. [Google Scholar] [CrossRef] [PubMed]
  7. Vaccari, F.P.; Baronti, S.; Lugato, E.; Genesio, L.; Castaldo, S.; Fornasier, F.; Miglietta, F. Biochar as a strategy to sequester carbon and increase yield in durum wheat. Eur. J. Agron. 2011, 34, 231–235. [Google Scholar] [CrossRef]
  8. Meyer, S.; Glaser, B.; Quicker, P. Technical, economical, and climate-related aspects of biochar production technologies: A literature review. Environ. Sci. Technol. 2011, 45, 9473–9475. [Google Scholar] [CrossRef] [PubMed]
  9. Libra, J.A.; Ro, K.S.; Kammann, C.; Funke, A.; Berge, N.D.; Neubauer, Y.; Titirici, M.-M.; Fühner, C.; Bens, O.; Kern, J.; et al. Hydrothermal carbonization of biomass residuals: A comparative review of the chemistry, processes and applications of wet and dry pyrolysis. Biofuels 2011, 2, 89–124. [Google Scholar] [CrossRef]
  10. Fuertes, A.B.; Arbestain, M.C.; Sevilla, M.; Macia-Agullo, J.A.; Fiol, S.; Lopez, R.; Smermik, R.J.; Aitkenhead, W.P.; Arce, F.; Macias, F. Chemical and structural properties of carbonaceous products obtained by pyrolysis and hydrothermal carbonization of corn stover. Aust. J. Soil Res. 2010, 48, 618–620. [Google Scholar] [CrossRef]
  11. Sevilla, M.; Fuertes, A.B. The production of carbon materials by hydrothermal carbonization of cellulose. Elsevier 2009, 47, 2281–2289. [Google Scholar] [CrossRef]
  12. Xiao, L.-P.; Zheng, J.-S.; Xu, F.; Sun, R.-C. Hydrothermal carbonization of lignocellulosic biomass. Bioresour. Technol. 2012, 118, 619–623. [Google Scholar] [CrossRef] [PubMed]
  13. Hoekman, S.K.; Broch, A.; Robbins, C. Hydrothermal Carbonization (HTC) of Lignocellulosic Biomass. Energy Fuels 2011, 25, 1802–1810. [Google Scholar] [CrossRef]
  14. Garrote, G.; Dominguez, H.; Parajo, J.C. Hydrothermal processing of lignocellulosic materials. Holz Roh-Werkstoff 1999, 57, 191–202. [Google Scholar] [CrossRef]
  15. Zhao, Y.; Bie, R.; Lu, J.; Xiu, T. Kinetic study of NSSC black liquor combustion using different kinetic models. Energy Sources 2010, 32, 962–969. [Google Scholar] [CrossRef]
  16. Nassar, M. Thermal behavior of bagasse Kraft black liquor. Energy Sources 2003, 25, 837–844. [Google Scholar] [CrossRef]
  17. Alen, R.; Rytkonen, S.; McKeough, P. Thermogravimetric behavior of black liquors and their organic constituents. Bioresour. Technol. 1995, 31, 1–13. [Google Scholar] [CrossRef]
  18. Kosinkova, J.; Ramirez, J.A.; Nguyen, J.; Ristovski, Z.; Brown, R.; Lin, C.S.K.; Rainey, T.J.R. Hydrothermal liquefaction of bagasse using ethanol and black liquor as solvents. Biofuels Bioprod. Bioref. 2015, 9, 630–638. [Google Scholar] [CrossRef]
  19. Vassilev, S.V.; Baxter, D.; Andersen, L.K.; Vassileva, C.G. An overview of the chemical composition of biomass. Fuel 2010, 89, 913–933. [Google Scholar] [CrossRef]
  20. Mullen, C.A.; Boateng, A.A. Chemical composition of bio-oils produced by fast pyrolysis of two energy crops. Energy Fuels 2008, 22, 2104–2109. [Google Scholar] [CrossRef]
  21. Belgiomo, G.; DeFeo, G.; Della Rocca, C.; Napoli, R. Energy from gasification of solid wastes. Waste Manag. 2006, 23, 1–15. [Google Scholar] [CrossRef]
  22. Simanjuntak, W.; Sembiring, S.; Zakaria, W.A.; Pandiangan, K.D. The Use of Carbon Dioxide Released from Coconut Shell Combustion to Produce Na2CO3. Makara J. Sci. 2014, 18. [Google Scholar] [CrossRef]
  23. Siriwardane, R.V.; Poston, J.A., Jr.; Robinson, C.; Simonyi, T. Effect of additives on decomposition of sodium carbonate: Precombustion CO2 capture sorbent regeneration. Energy Fuels 2011, 25, 1284–1293. [Google Scholar] [CrossRef]
  24. Miles, T.R.; Miles, T.R., Jr.; Baxter, L.L.; Bryers, R.W.; Jenkins, B.M.; Oden, L.L. Boiler deposits from firing biomass fuels. Biomass Bioenergy 1996, 10, 125–138. [Google Scholar] [CrossRef]
  25. Lynam, J.G.; Coronella, C.J.; Yan, C.J.; Reza, M.T.; Vasquez, V.R. Acetic acid and lithium chloride effects on hydrothermal carbonization of lignocellulosic biomass. Bioresour. Technol. 2011, 102, 6192–6199. [Google Scholar] [CrossRef] [PubMed]
  26. Acharjee, T.C.; Coronella, C.J.; Vasquez, V.R. Effect of thermal pretreatment on equilibrium moisture content of lignocellulosic biomass. Bioreseour. Technol. 2011, 102, 4849–4854. [Google Scholar] [CrossRef] [PubMed]
  27. Perry, R.H. Energy Resources, Conversation, and Utilization. In Chemical Engineering Handbook, 6th ed.; McGraw Hill: New York, NY, USA, 1984; Volume 1, pp. 3-21, 3-22, 3-38. [Google Scholar]
  28. Cetinkol, O.P.; Dibble, D.C.; Cheng, G.; Kent, M.S.; Knierium, B.; Auer, M.; Wemmer, D.E.; Pelton, J.G.; Melnichenko, Y.B.; Ralph, J.; et al. Understanding the impact of ionic liquid pretreatment on eucalyptus. Biofuels 2010, 1, 33–46. [Google Scholar] [CrossRef]
  29. Kobayashi, N.; Okada, N.; Hirakawa, A.; Sato, T.; Kobayashi, J.; Hatano, S.; Itaya, Y.; Mori, S. Characteristics of solid residues obtained from hot-compressed-water treatment of woody biomass. Ind. Eng. Chem. Res. 2009, 48, 373–379. [Google Scholar] [CrossRef]
  30. Kumar, R.; Mago, G.; Balan, V.; Wyman, C.E. Physical and chemical characterizations of corn stover and poplar solids resulting from leading pretreatment technologies. Bioresour. Technol. 2009, 100, 3948–3962. [Google Scholar] [CrossRef] [PubMed]
  31. Wang, B.; Wang, X.J.; Feng, H. Deconstructing recalcitrant Misanthus with alkaline peroxide and electrolyzed water. Bioresour. Technol. 2010, 101, 752–760. [Google Scholar] [CrossRef] [PubMed]
  32. Gullon, P.; Romani, A.; Vila, C.; Garrote, G.; Parajo, J.C. Potential of hydrothermal treatments in lignocellulose biorefineries. Biofuels Biprod. Biorefinin. 2012, 6, 219–232. [Google Scholar] [CrossRef]
  33. Kabyemela, B.M.; Adschiri, T.; Malaluan, R.M.; Arai, K. Glucose and Fructose Decomposition in Subcritical and Supercritical Water: Detailed Reaction Pathway, Mechanisms, and Kinetics. Ind. Eng. Chem. Res. 1999, 38, 2888–2895. [Google Scholar] [CrossRef]
  34. Reza, M.T.; Lynam, J.G.; Uddin, M.H.; Coronella, C.J. Hydrothermal carbonization: Fate of inorganics. Biomass Bioenergy 2013, 49, 86–94. [Google Scholar] [CrossRef]
  35. De Souza, R.L.; Yu, H.; Rataboul, F.; Essayem, N. 5-Hydroxymethylfurfural (5-HMF) Production from Hexoses: Limits of Heterogeneous Catalysis in Hydrothermal Conditions and Potential of Concentrated Aqueous Organic Acids as Reactive Solvent System. Challenges 2012, 3, 212–232. [Google Scholar] [CrossRef]
  36. Asghari, F.S.; Yoshida, H. Acid-Catalyzed Production of 5-Hydroxymethyl Furfural from D-Fructose in Subcritical Water. Ind. Eng. Chem. Res. 2006, 45, 2163–2173. [Google Scholar] [CrossRef]
  37. Werpy, T.; Peterson, G. Top Value Added Chemicals from Biomass. In U.S. Department of Energy, Energy Efficiency and Renewable Energy, 2004, Volume 1, 1–76; 2004. Available online: http://www.nrel.gov/docs/fy04osti/35523.pdf (accessed on 1 February 2016). [Google Scholar]
  38. Baxter, L.L.; Miles, T.R.; Miles, T.R., Jr.; Jenkins, B.M.; Milne, T.; Dayton, D.; Bryers, R.W.; Oden, L.L. The behavior of inorganic material in biomass-fired power boilers: Field and laboratory experiences. Fuel Processing Technol. 1998, 54, 47–78. [Google Scholar] [CrossRef]
Figure 1. Thermal Analyses of Raw Dried Red Liquor using TGA (a) and DSC (b).
Energies 09 00435 g001
Figure 2. TGA Profiles of the Hydrochar Samples at Different Reaction Temperatures: (a) 190 °C; (b) 220 °C; (c) 250 °C.
Energies 09 00435 g002
Figure 3. FTIR Spectra of the Hydrochar Samples at Different Reaction Temperatures: (a) 190 °C; (b) 220 °C; (c) 250 °C.
Energies 09 00435 g003
Figure 4. FTIR Spectra of the Process Liquid Residual Samples at Different Reaction Temperatures: (a) 190 °C; (b) 220 °C; (c) 250 °C.
Energies 09 00435 g004aEnergies 09 00435 g004b
Figure 5. Effect of HTC on the Inorganic Composition of the Process Liquid Samples at Different Reaction Temperatures: (a) 190 °C; (b) 220 °C; (c) 250 °C. * Upper detection limit for sodium was 100 mg/L.
Energies 09 00435 g005
Figure 6. Atomic O/C-H/C Ratios of Raw Red Liquor and HTC Sample 4 Hydrochars (adapted from Trif-Tordai and Ionel via Wikimedia Commons [CC BY-SA 3.0]).
Energies 09 00435 g006
Table 1. Ultimate Analysis of the Hydrochar Samples (wt.% d.b.).
Temperature (°C)SampleNitrogenCarbonHydrogenSulfurOxygen
Bituminous Coal1.66 ± 0.0076.54 ± 0.025.13 ± 0.000.83 ± 0.0011.36 ± 0.02
Raw Red Liquor0.40 ± 0.1528.95 ± 0.256.02 ± 0.010.00 ± 0.0054.24 ± 0.41
19010.70 ± 0.0154.23 ± 0.066.02 ± 0.150.00 ± 0.0023.77 ± 0.20
20.70 ± 0.0160.38 ± 0.076.02 ± 0.020.00 ± 0.0027.00 ± 0.21
30.74 ± 0.0264.34 ± 0.056.02 ± 0.010.00 ± 0.0024.00 ± 0.19
40.78 ± 0.0165.04 ± 0.086.03 ± 0.030.00 ± 0.0026.84 ± 0.18
22010.61 ± 0.0362.31 ± 0.066.46 ± 0.010.00 ± 0.0025.73 ± 0.21
20.61 ± 0.0265.43 ± 0.076.58 ± 0.020.00 ± 0.0025.42 ± 0.19
30.61 ± 0.0265.25 ± 0.066.37 ± 0.020.00 ± 0.0023.32 ± 0.20
40.61 ± 0.0165.40 ± 0.056.24 ± 0.010.00 ± 0.0023.20 ± 0.22
25010.55 ± 0.0164.75 ± 0.046.33 ± 0.010.00 ± 0.0021.52 ± 0.17
20.76 ± 0.0272.20 ± 0.046.30 ± 0.020.00 ± 0.0018.09 ± 0.21
30.78 ± 0.0271.46 ± 0.056.24 ± 0.010.00 ± 0.0018.86 ± 0.18
40.72 ± 0.0173.62 ± 0.036.02 ± 0.020.00 ± 0.0018.52 ± 0.20
Table 2. Thermal Analysis, Yield and Energy Characterization of the Hydrochar Samples.
Temperature (°C)SampleHHV, MJ/kg (d.b.)Mass Yield (wt.% d.b.)Moisture (wt.%)Ash Content (wt.% d.b.)Volatile Matter/Combustibles (wt.% d.b.)
Bituminous Coal32.32 ± 0.73-0.48 ± 0.027.80 ± 0.0592.21 ± 0.16
Raw Red Liquor12.48 ± 0.61-6.39 ± 2.1110.39 ± 0.8183.22 ± 1.93
190124.39 ± 0.7072.31 ± 1.319.81 ± 1.5315.28 ± 0.7584.52 ± 1.82
225.16 ± 0.7168.42 ± 1.237.20 ± 1.405.90 ± 0.5994.10 ± 1.79
325.96 ± 0.7867.93 ± 1.502.74 ± 1.324.90 ± 0.6295.10 ± 1.78
426.23 ± 0.7567.11 ± 0.944.43 ± 1.451.31 ± 0.6598.69 ± 1.80
220127.97 ± 0.7061.32 ± 1.112.82 ± 1.504.89 ± 0.6195.06 ± 1.72
228.54 ± 0.7358.46 ± 1.222.10 ± 1.394.55 ± 0.7298.04 ± 1.70
328.24 ± 0.7255.73 ± 1.413.14 ± 1.524.45 ± 0.6895.55 ± 1.75
428.25 ± 0.6853.15 ± 0.952.55 ± 1.481.96 ± 0.5895.45 ± 1.69
250127.75 ± 0.7150.17 ± 1.362.18 ± 1.516.85 ± 0.5593.15 ± 1.83
229.86 ± 0.7348.34 ± 1.241.05 ± 1.522.65 ± 0.6297.35 ± 1.88
329.87 ± 0.7047.78 ± 1.501.10 ± 1.552.66 ± 0.6497.34 ± 1.90
429.87 ± 0.7245.91 ± 1.121.50 ± 1.371.12 ± 0.5998.88 ± 1.87
Table 3. Assignments of Absorption Bands in FTIR Spectrum of the Hydrochar Samples [28,29,30,31].
Wavelength Number (cm−1)Assignments
3418O–H stretching
2924C–H stretching of –CH2 and −CH3
1740C=O stretching of unconjugated ketone, carbonyls, and ester groups; C=O in xylan acetates (hemicelluloses)
1643Absorbed O–H and conjugated C–O
1605Aromatic skeletal vibrations plus C=O stretch
1501Aromatic C=C stretching from aromatic ring of lignin
1460Aromatic C–H deformations; asymmetric in –CH3 and –CH2
1427Aromatic skeletal vibrations combined with C–H in plane deformation
1374Aliphatic C–H deformation vibrations in cellulose and hemicellulose
1328Phenolic O–H
1239C–O stretching out of lignin and xylan
1157C–O–C vibrations at β-glucosidic linkages in cellulose and hemicellulose
1124C–O, C–C stretching or C–OH bending in cellulose and hemicellulose
1049C–O stretching in cellulose and hemicellulose
896C–O–C stretching at β-glucosidic linkages in cellulose and hemicellulose
800Aromatic C–H out-of-plane bending

