
Environmental and Economic Performance of an Li-Ion Battery Pack: A Multiregional Input-Output Approach

 , ,
, , 
Abstract
:
1. Introduction
2. Goal, Scope and Methodology
Multiregional Input–Output Analysis
- The Organisation for Economic Co-operation and Development (OECD) Input–Output Tables comprise 48 countries and cover 37 sectors. The reference year varies from 2002 to 2006 depending on the country [20].
- Eora is a multi-regional Input–Output database, working in native classification of individual countries, which consists of 187 countries and offers data for 25 sectors. This database covers the period 1970–2011 [21].
- EXIOBASE is a global, detailed Multi-Regional Environmentally Extended Supply and Use/Input–Output (MR EE SUT/IOT) database. It comprises 43 countries, five Rest of the World (RoW) regions (and is 10% of the global GDP), and it uses a resolution at 200 products and 163 industries, based on year 2007 [22].
- World Input–Output Database (WIOD) provides time-series of world input–output tables for 40 countries worldwide and a model for the rest-of-the-world, with 35 sectors. It covers a period from 1995 to 2011 [23].
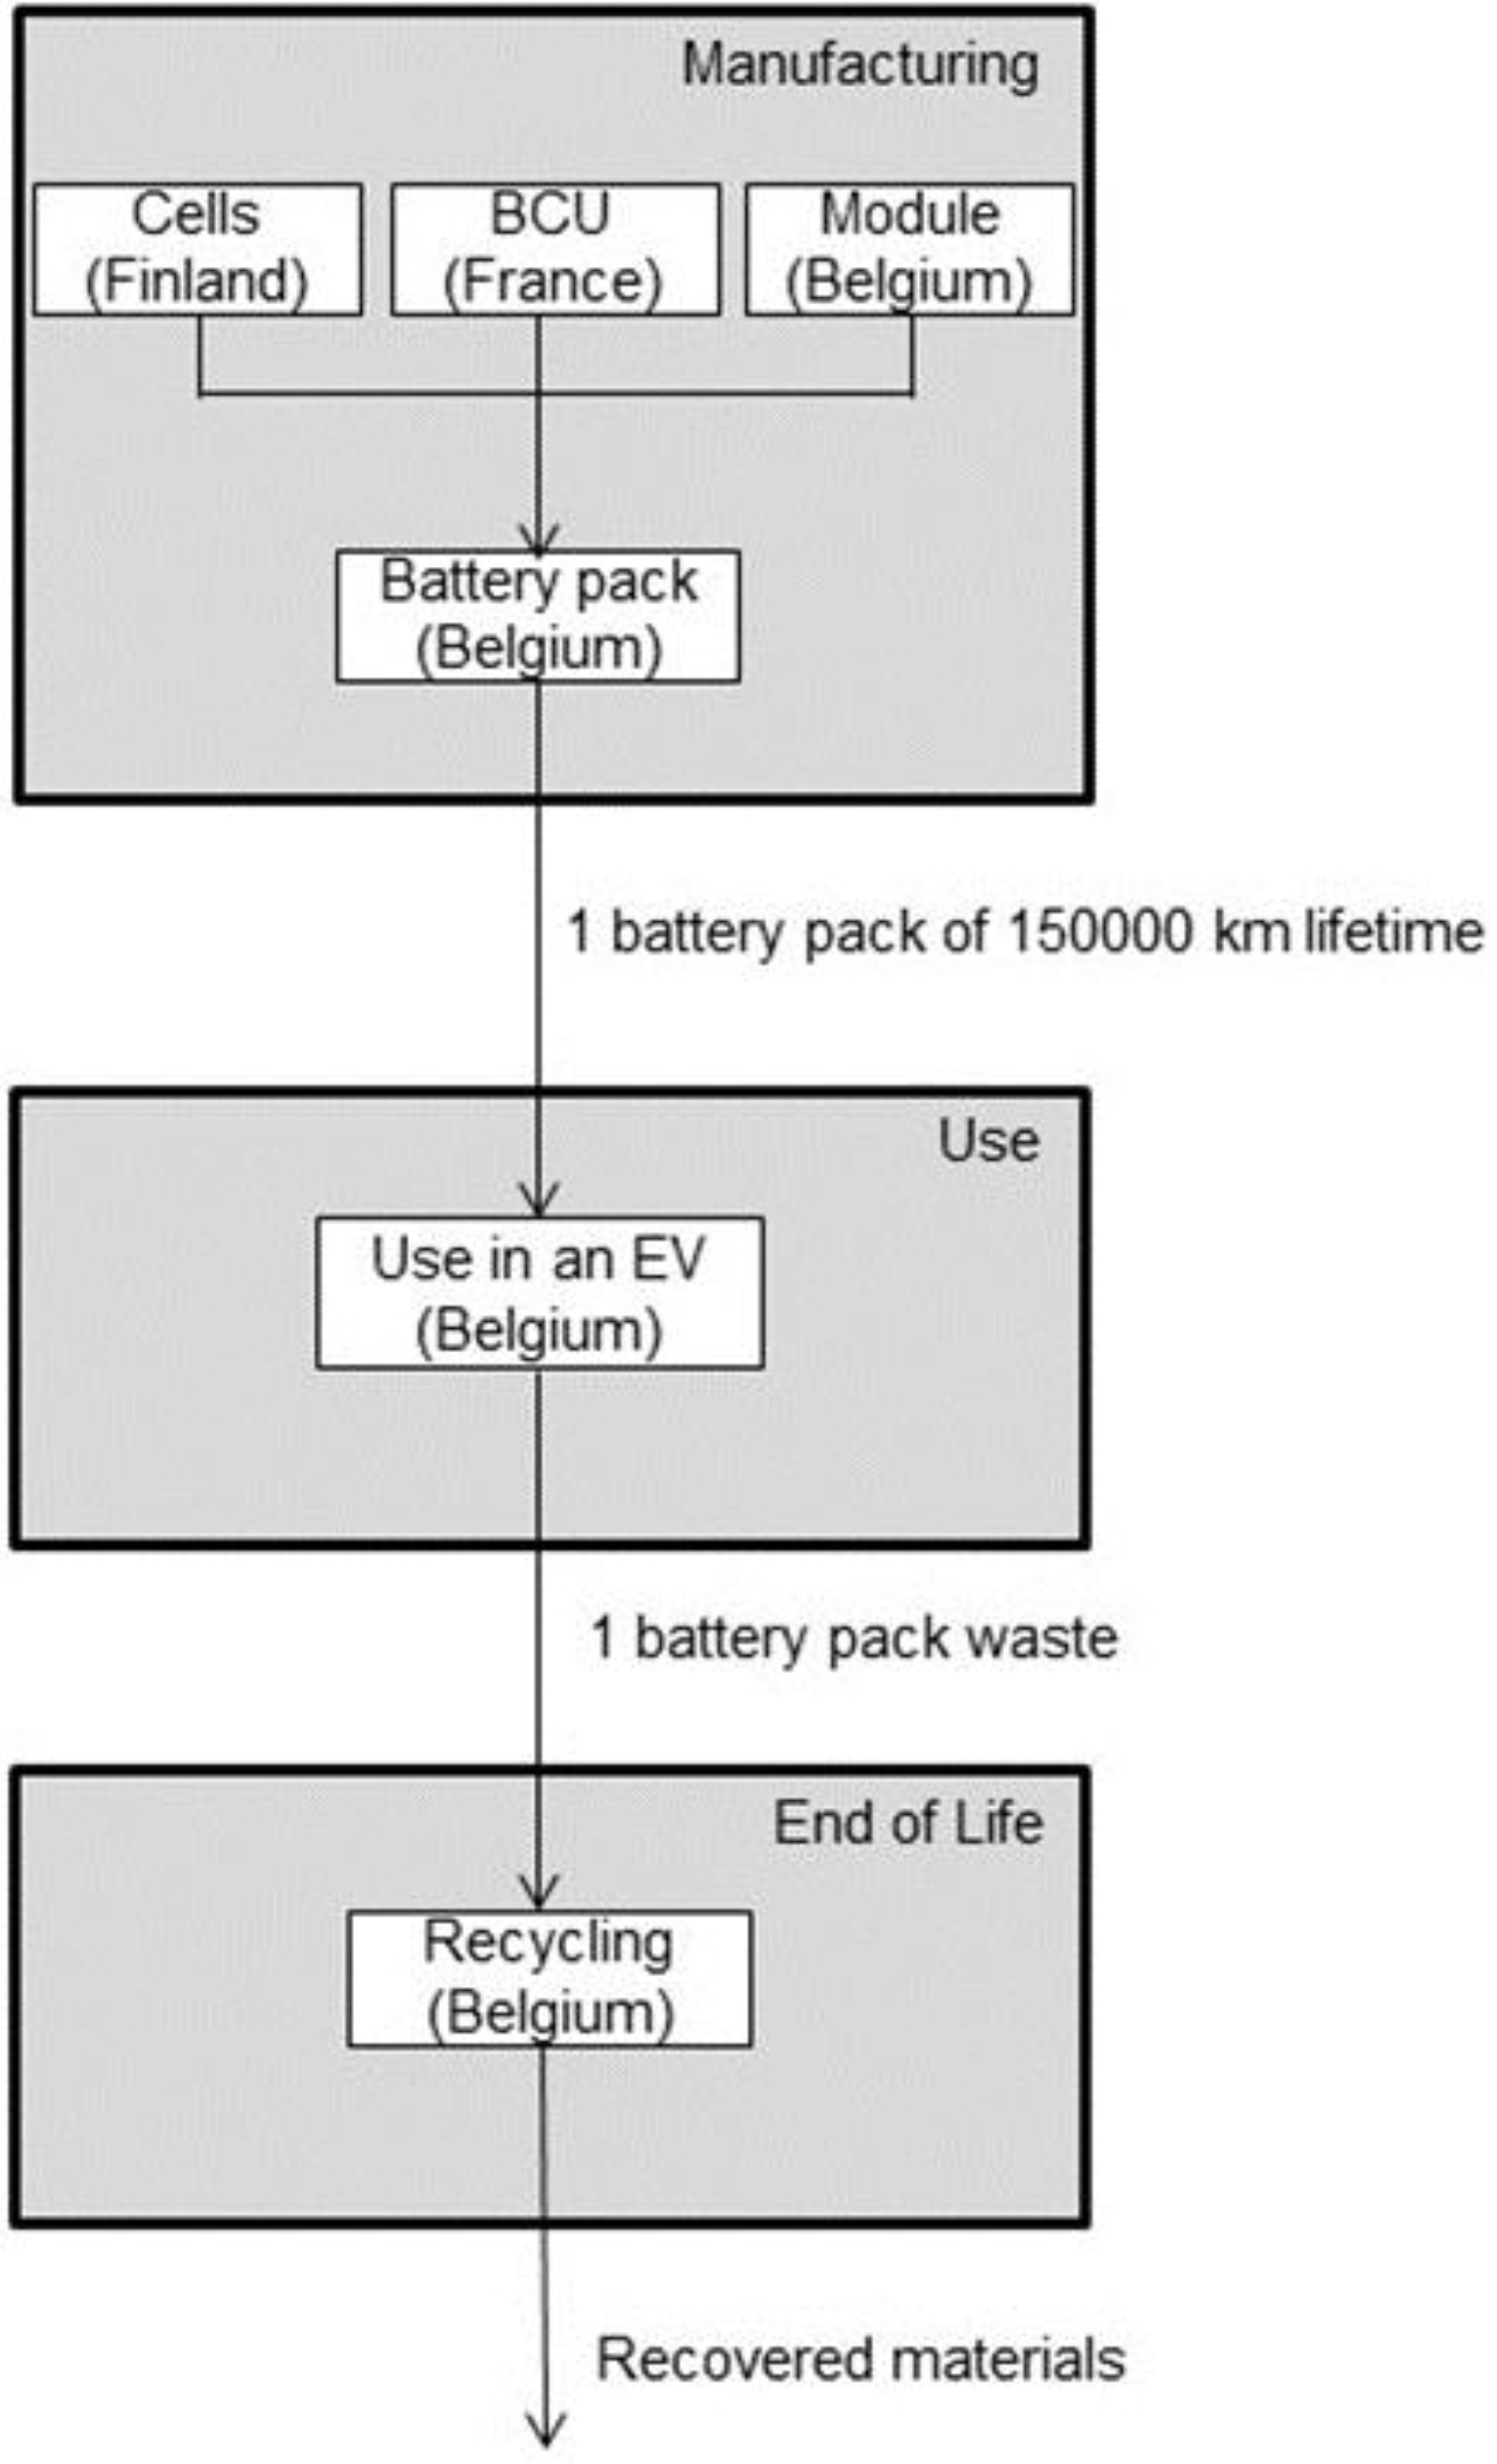
3. Life Cycle Inventory Analysis
3.1. Hybrid Energy Storage System
3.2. Use
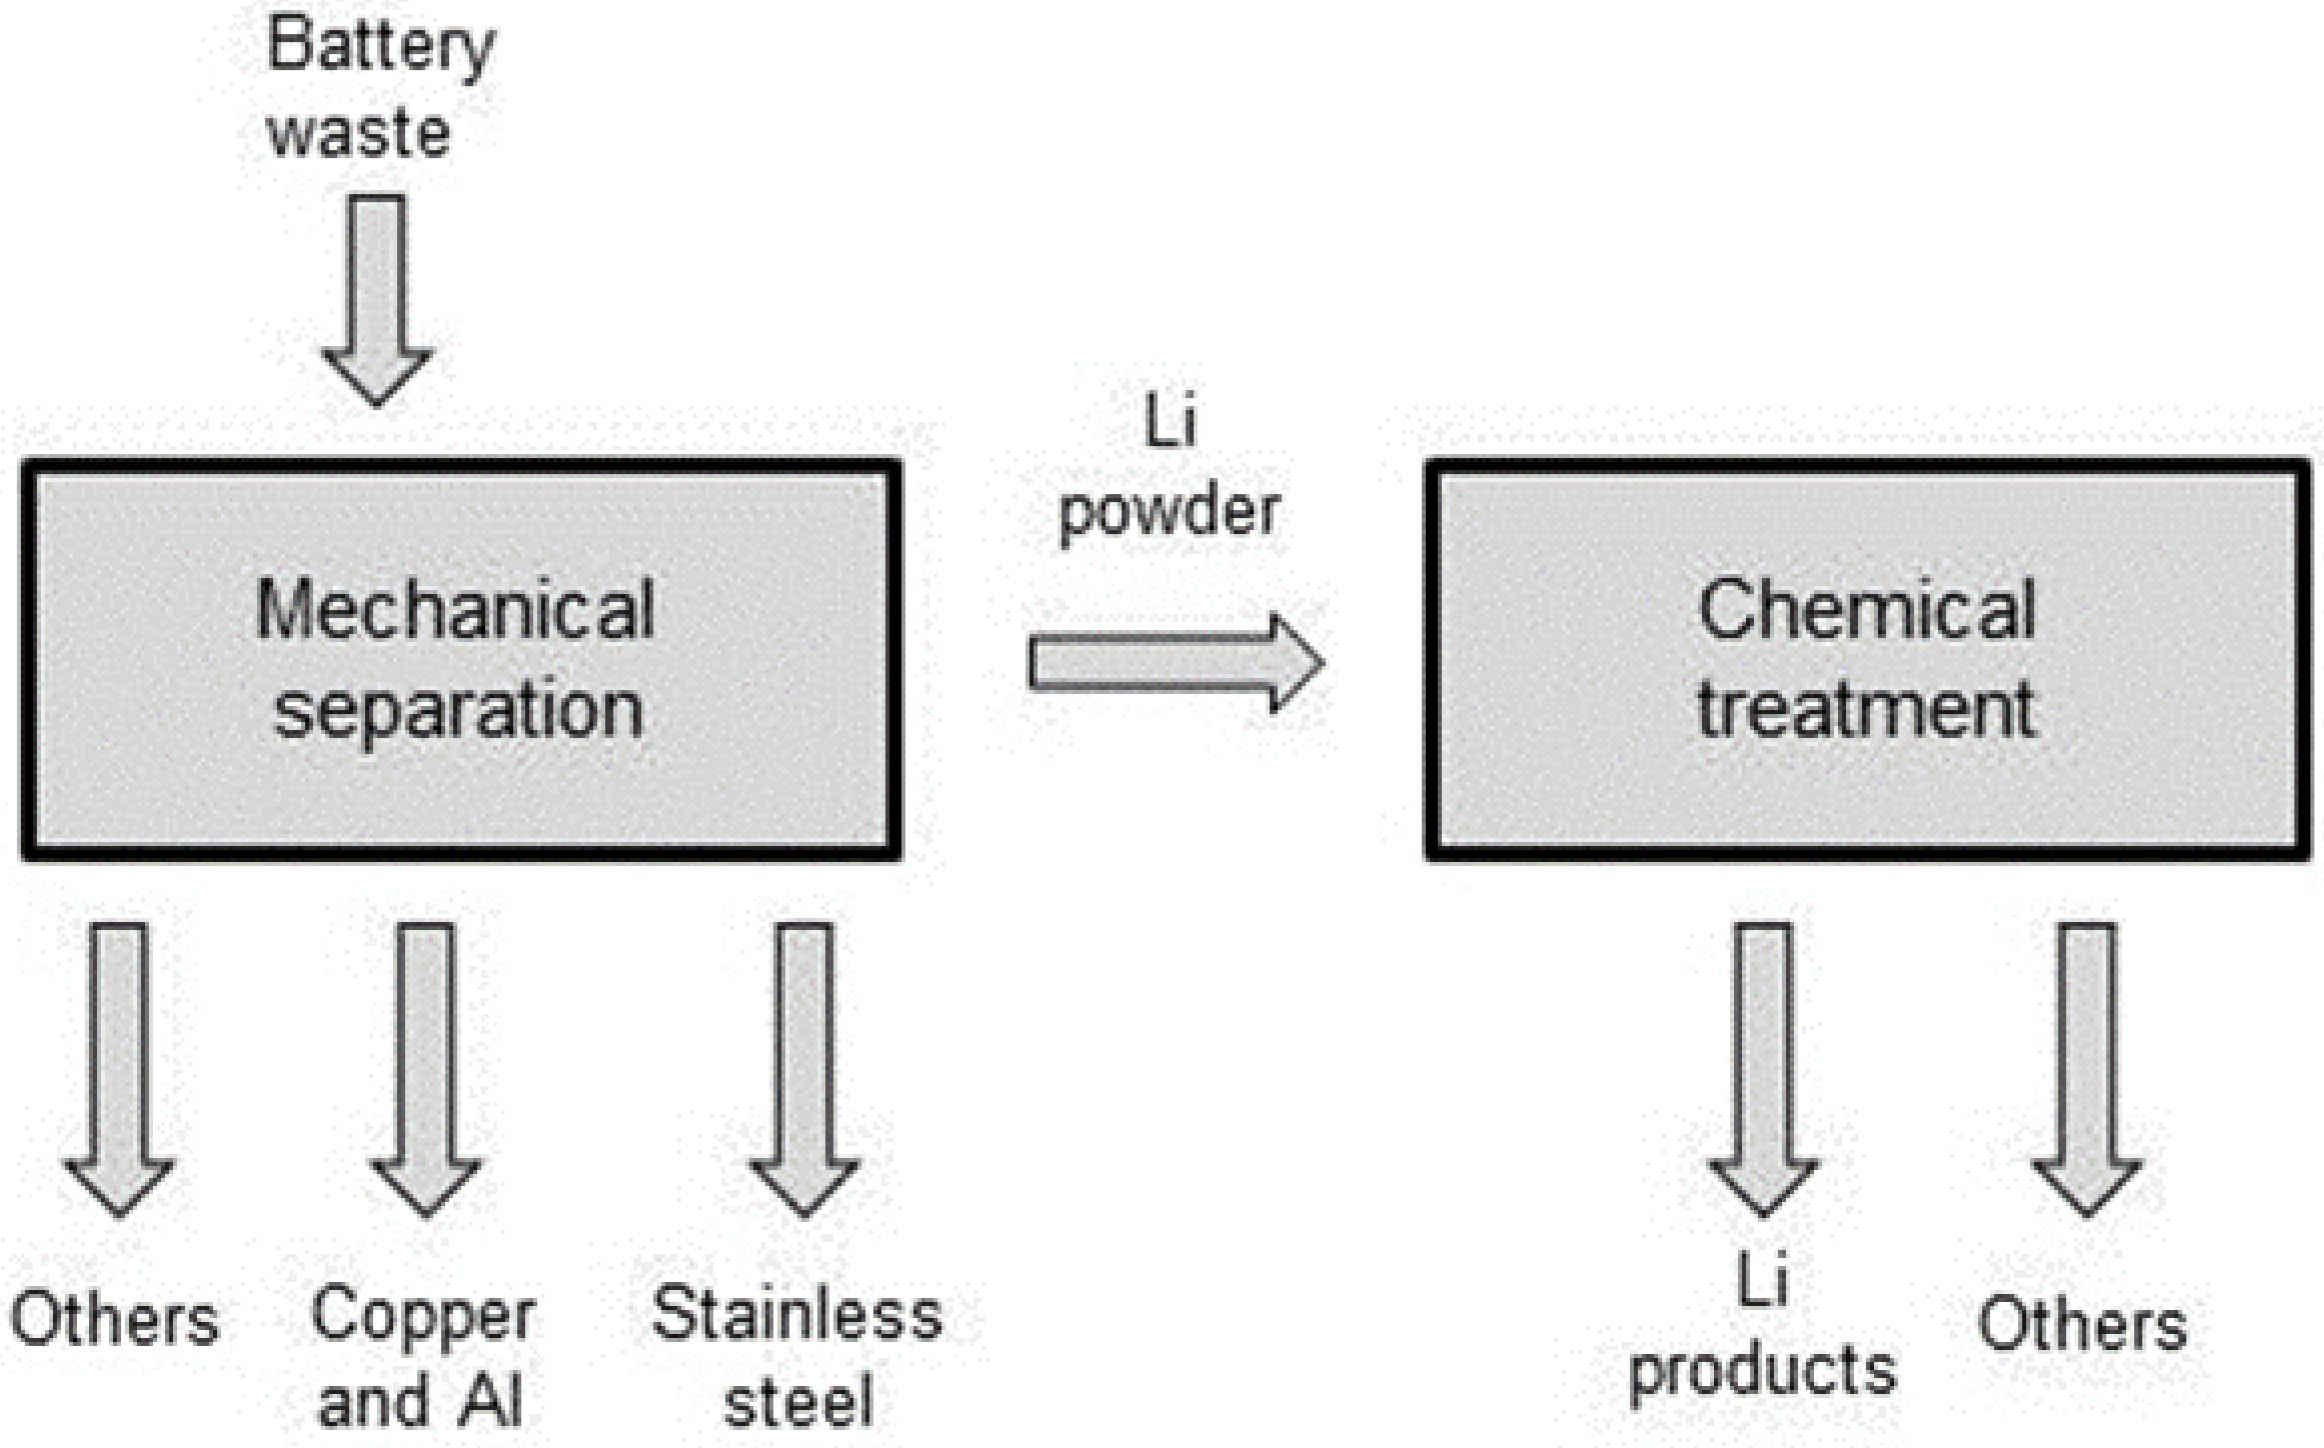
3.3. End-of-Life
3.4. Economic Performance of the System
4. Results and Discussion
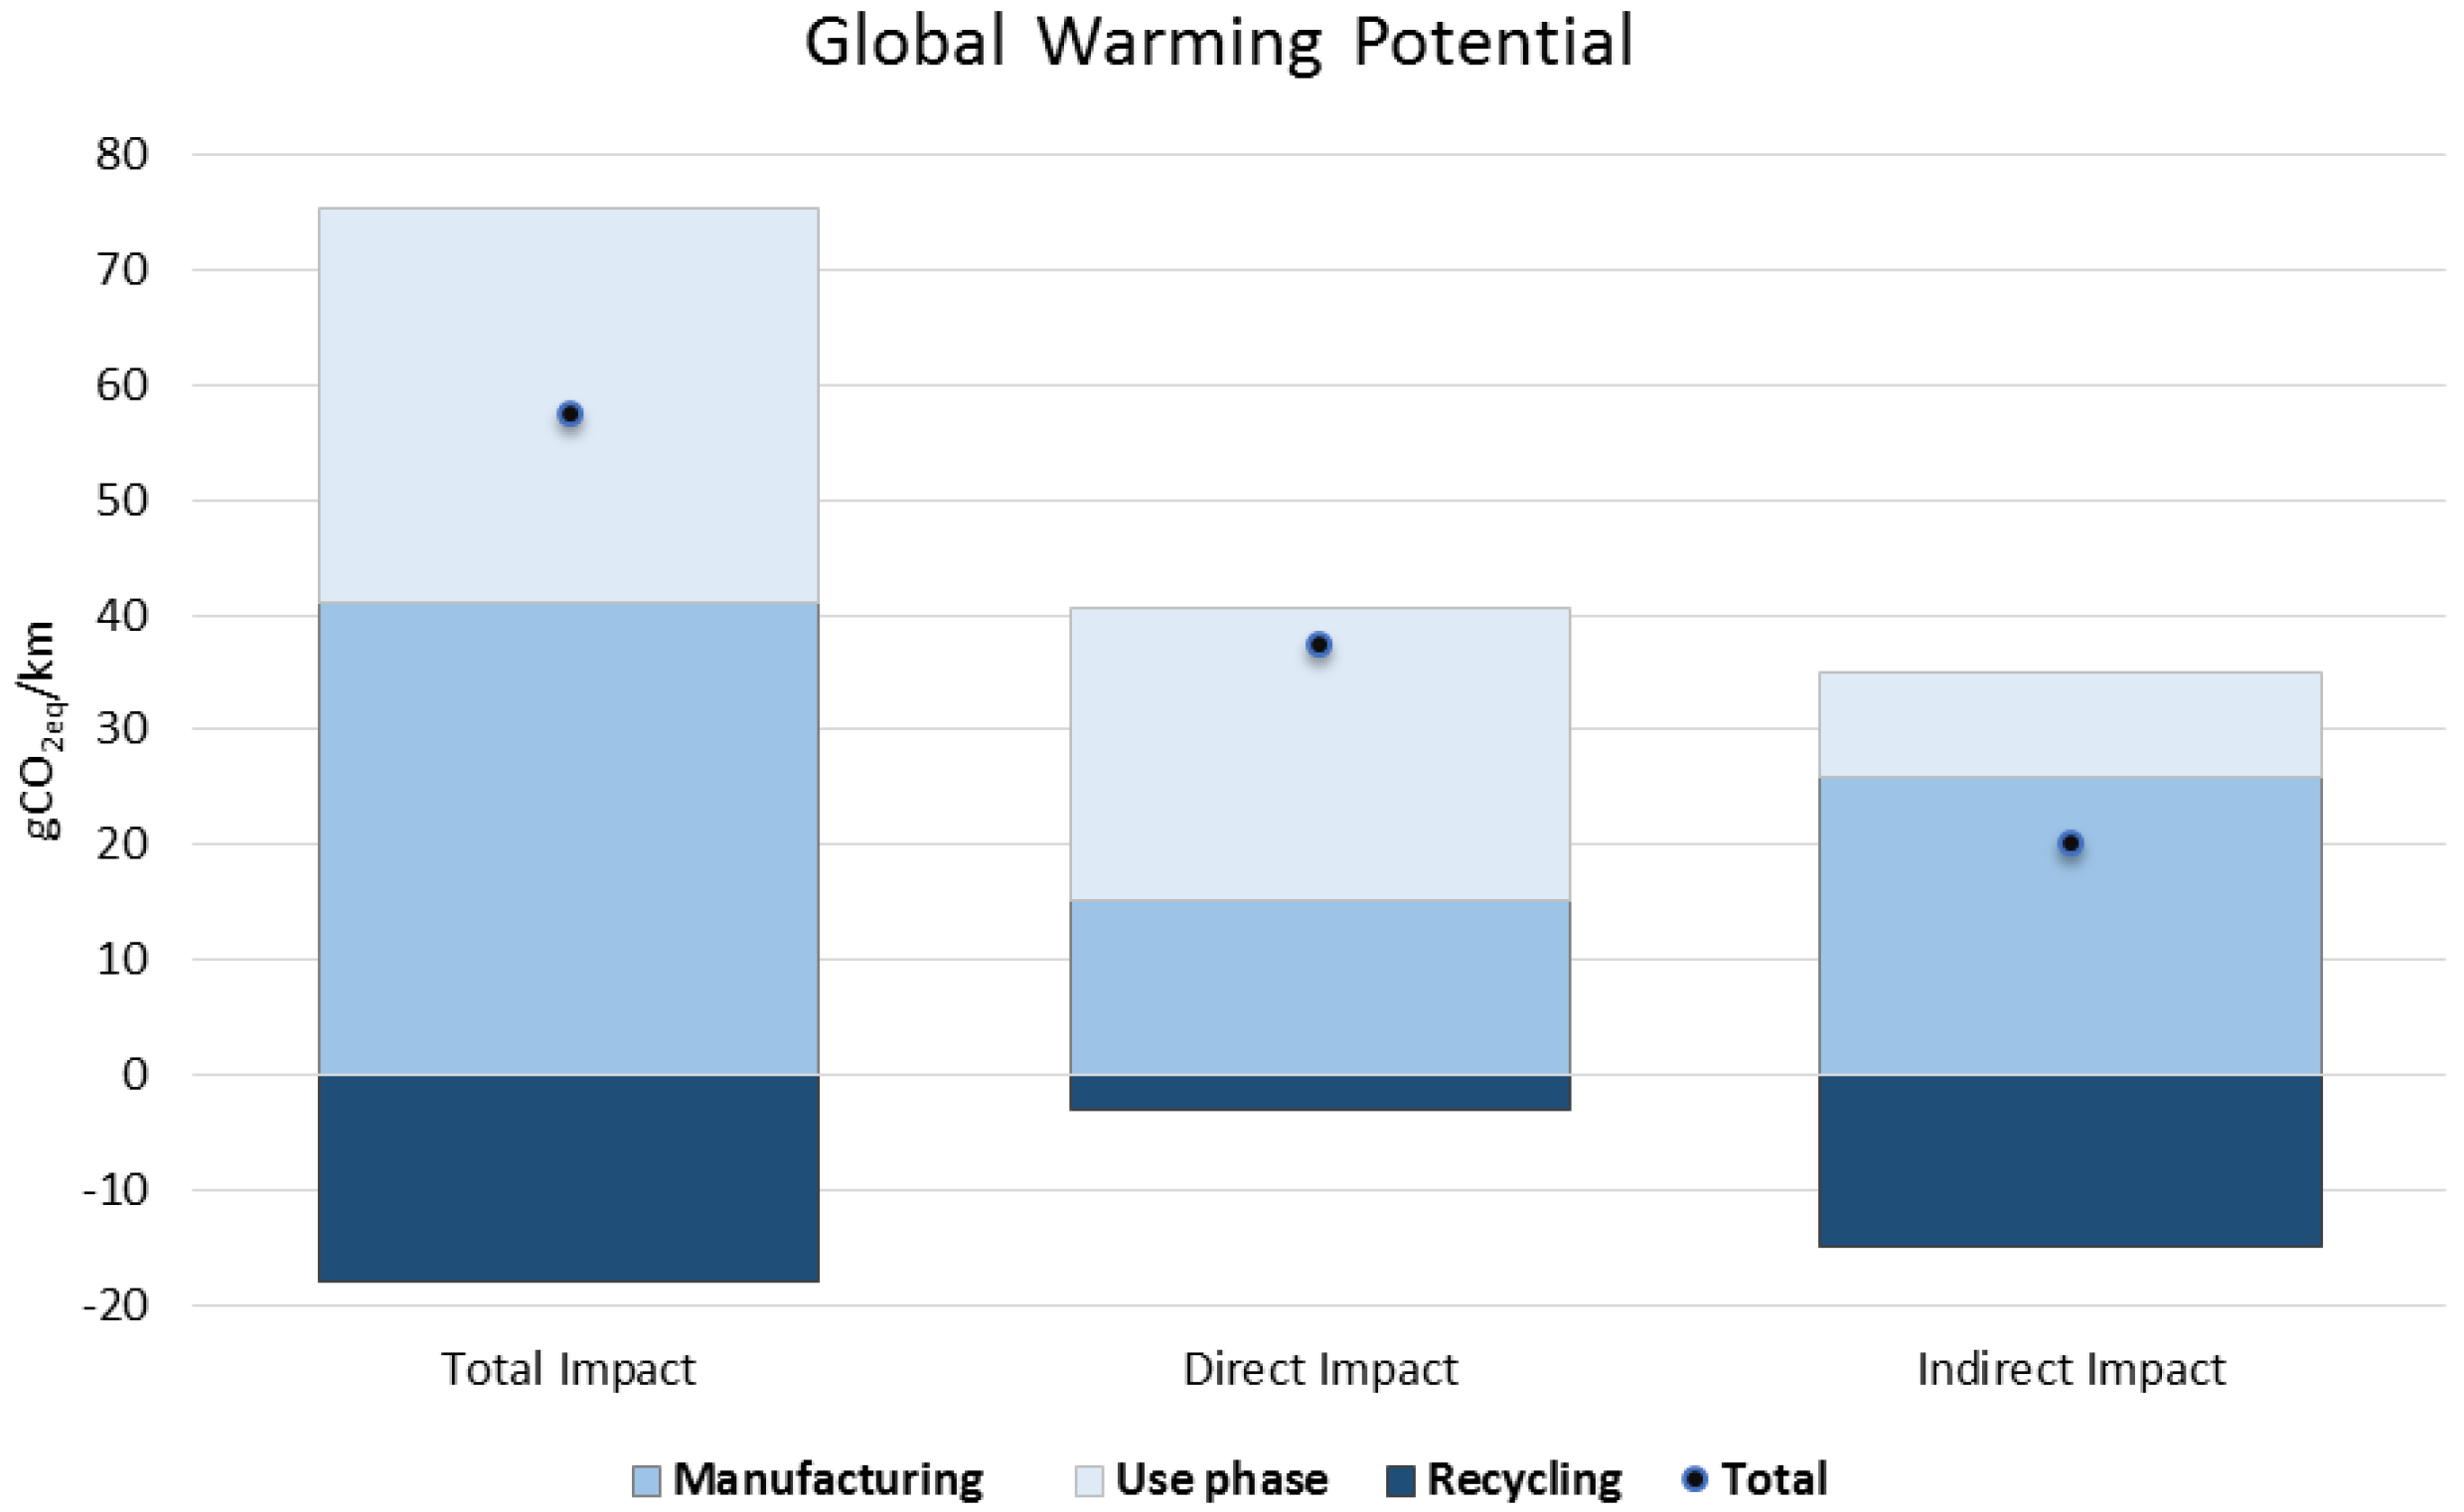
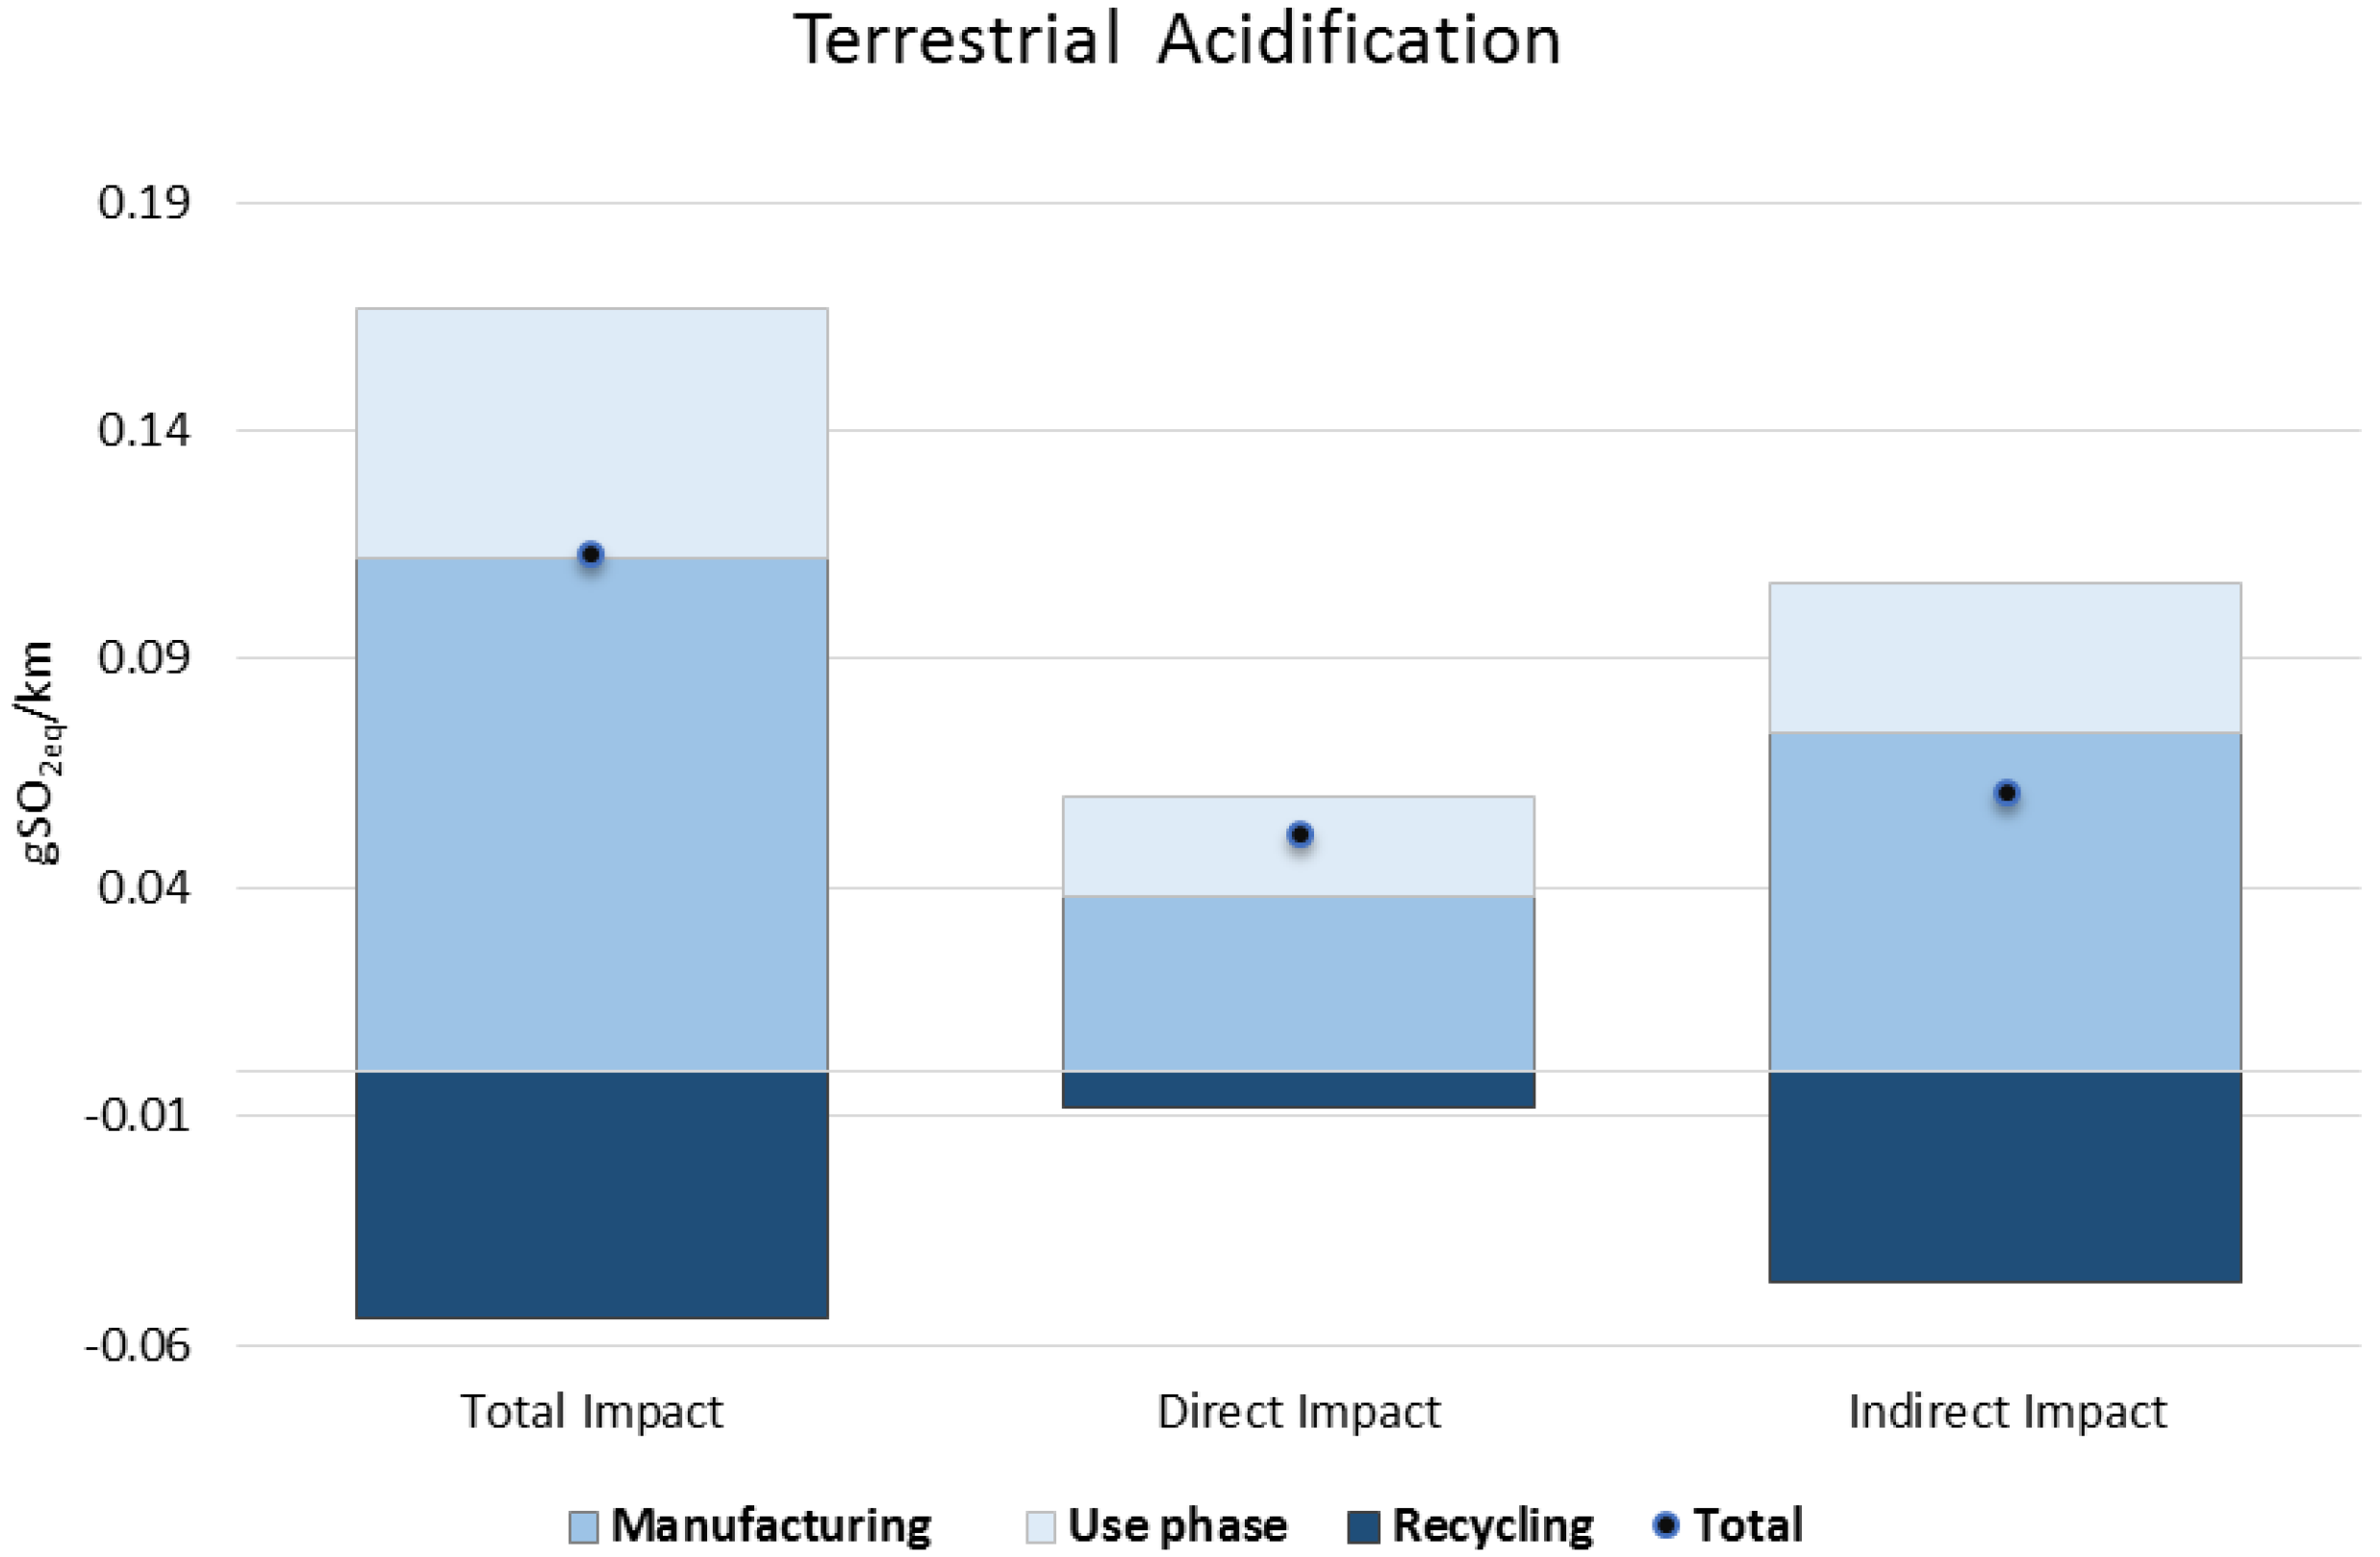
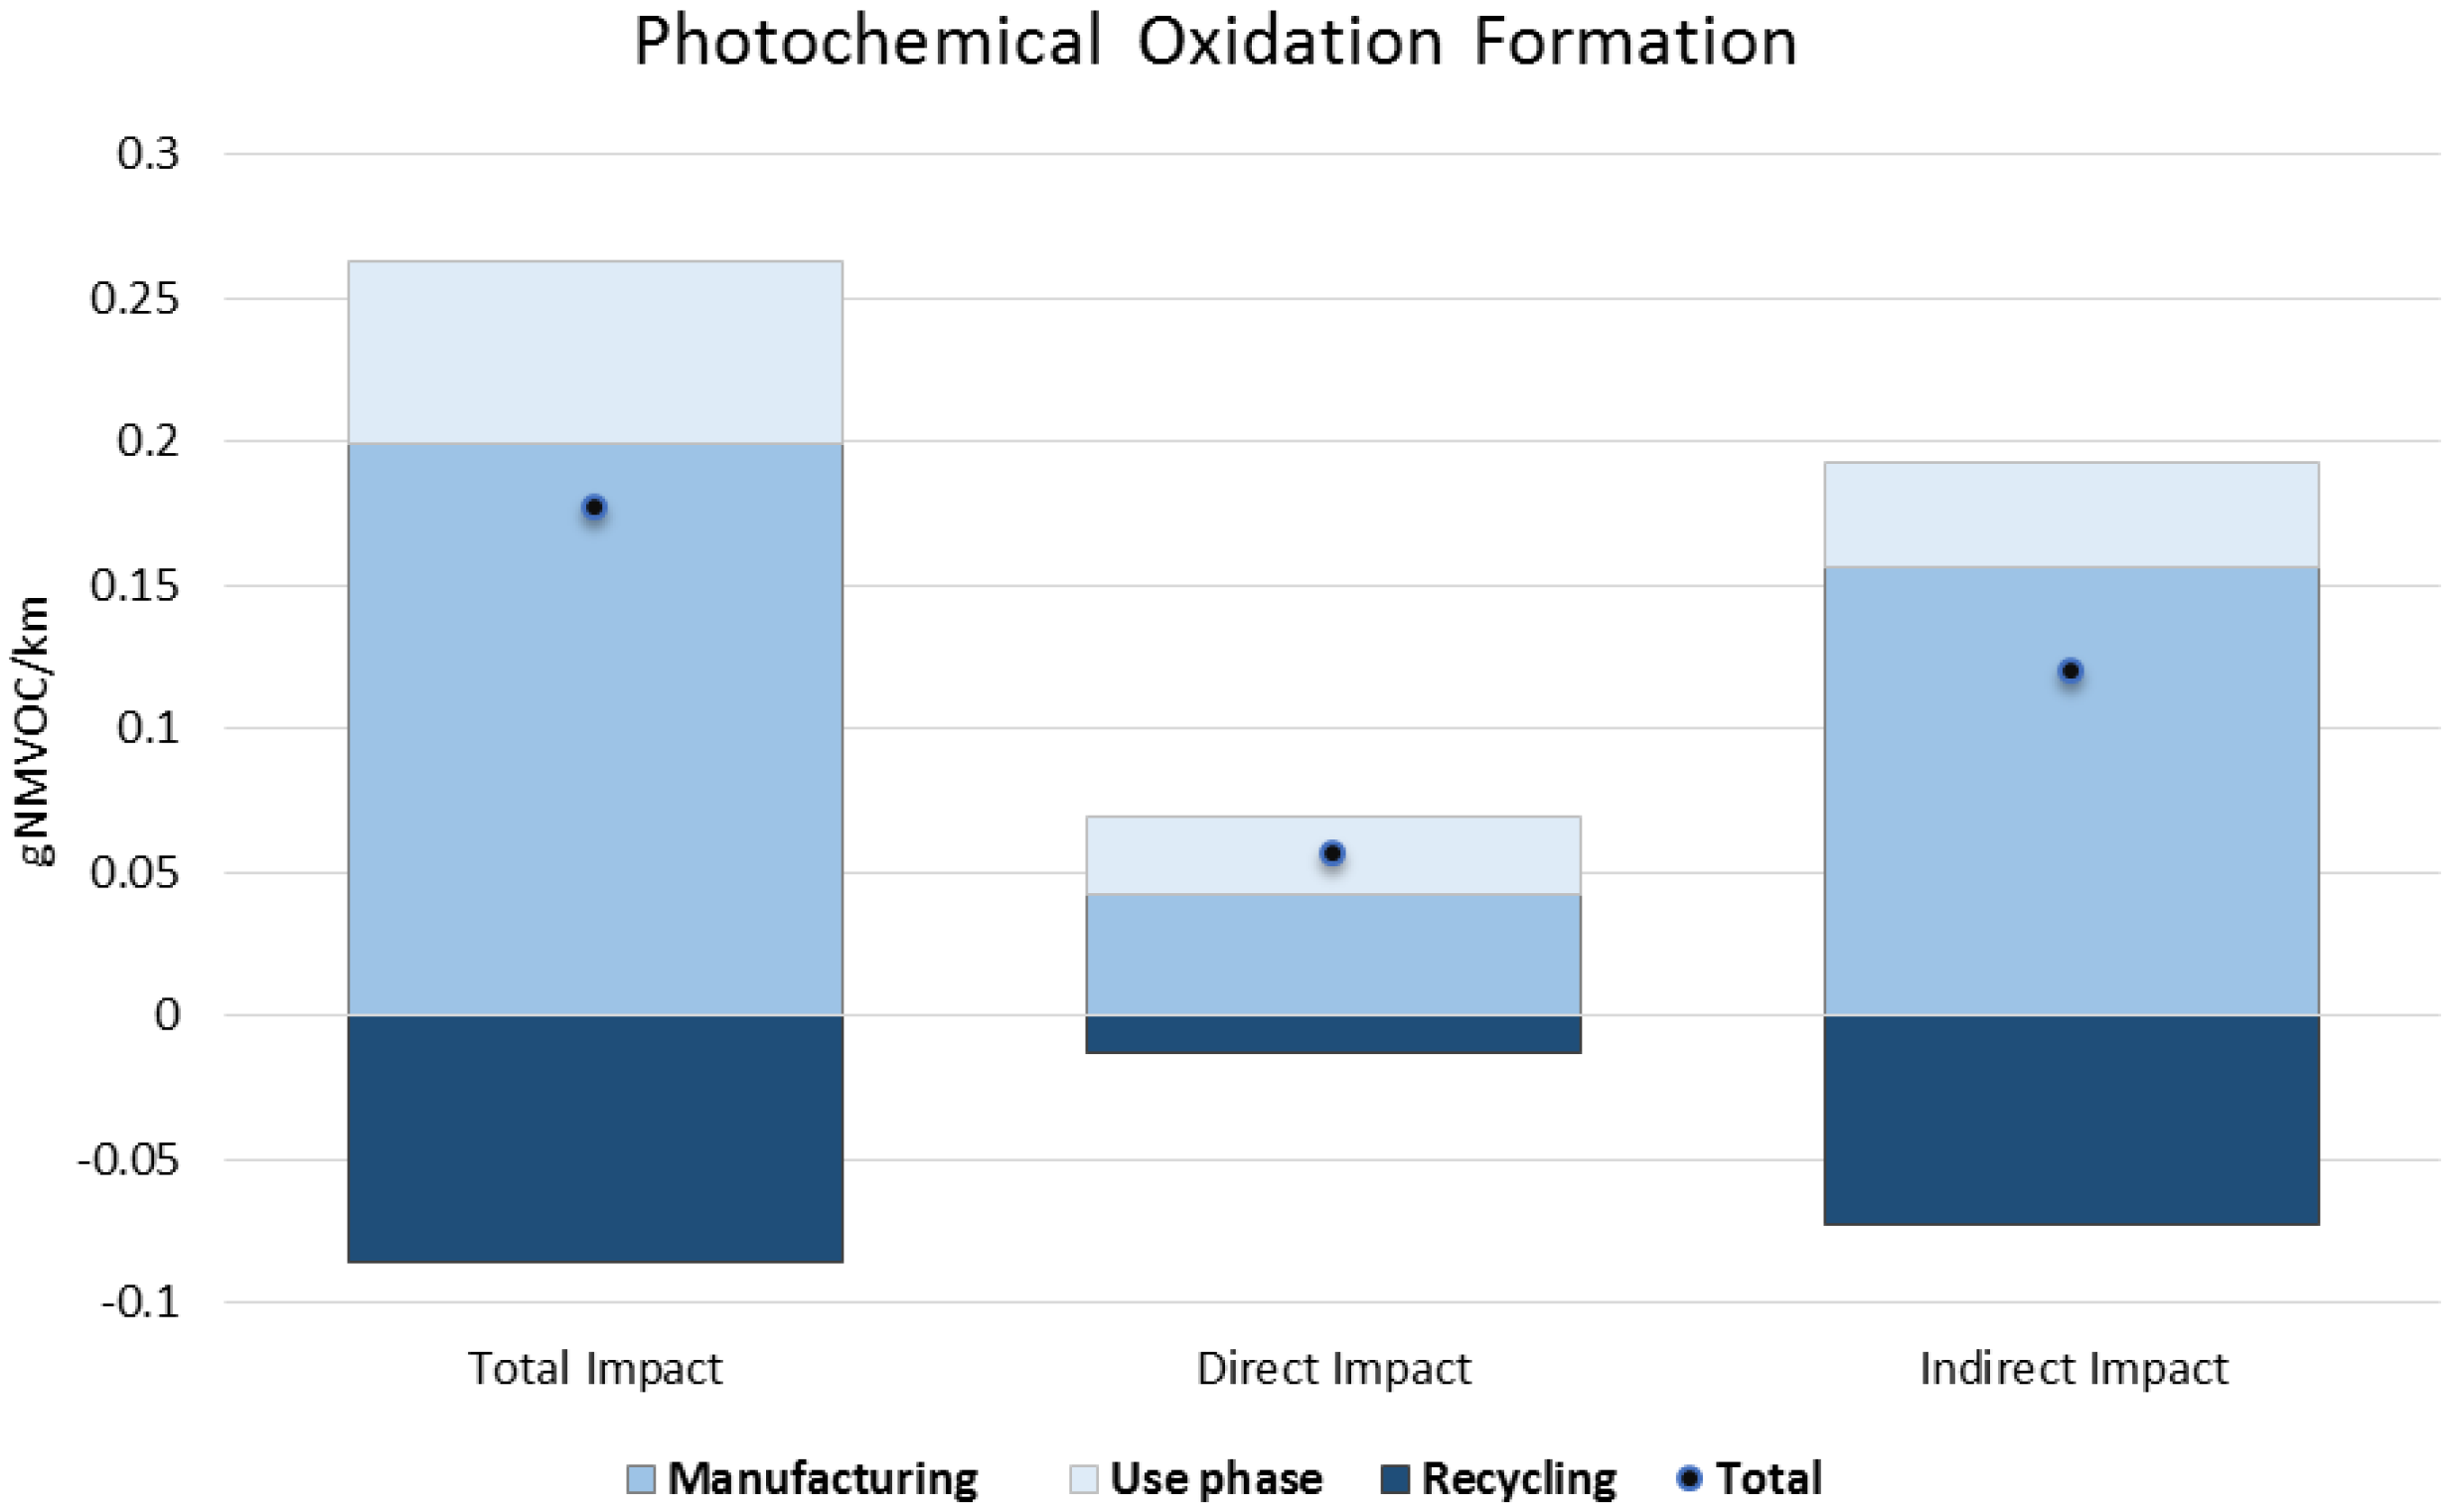
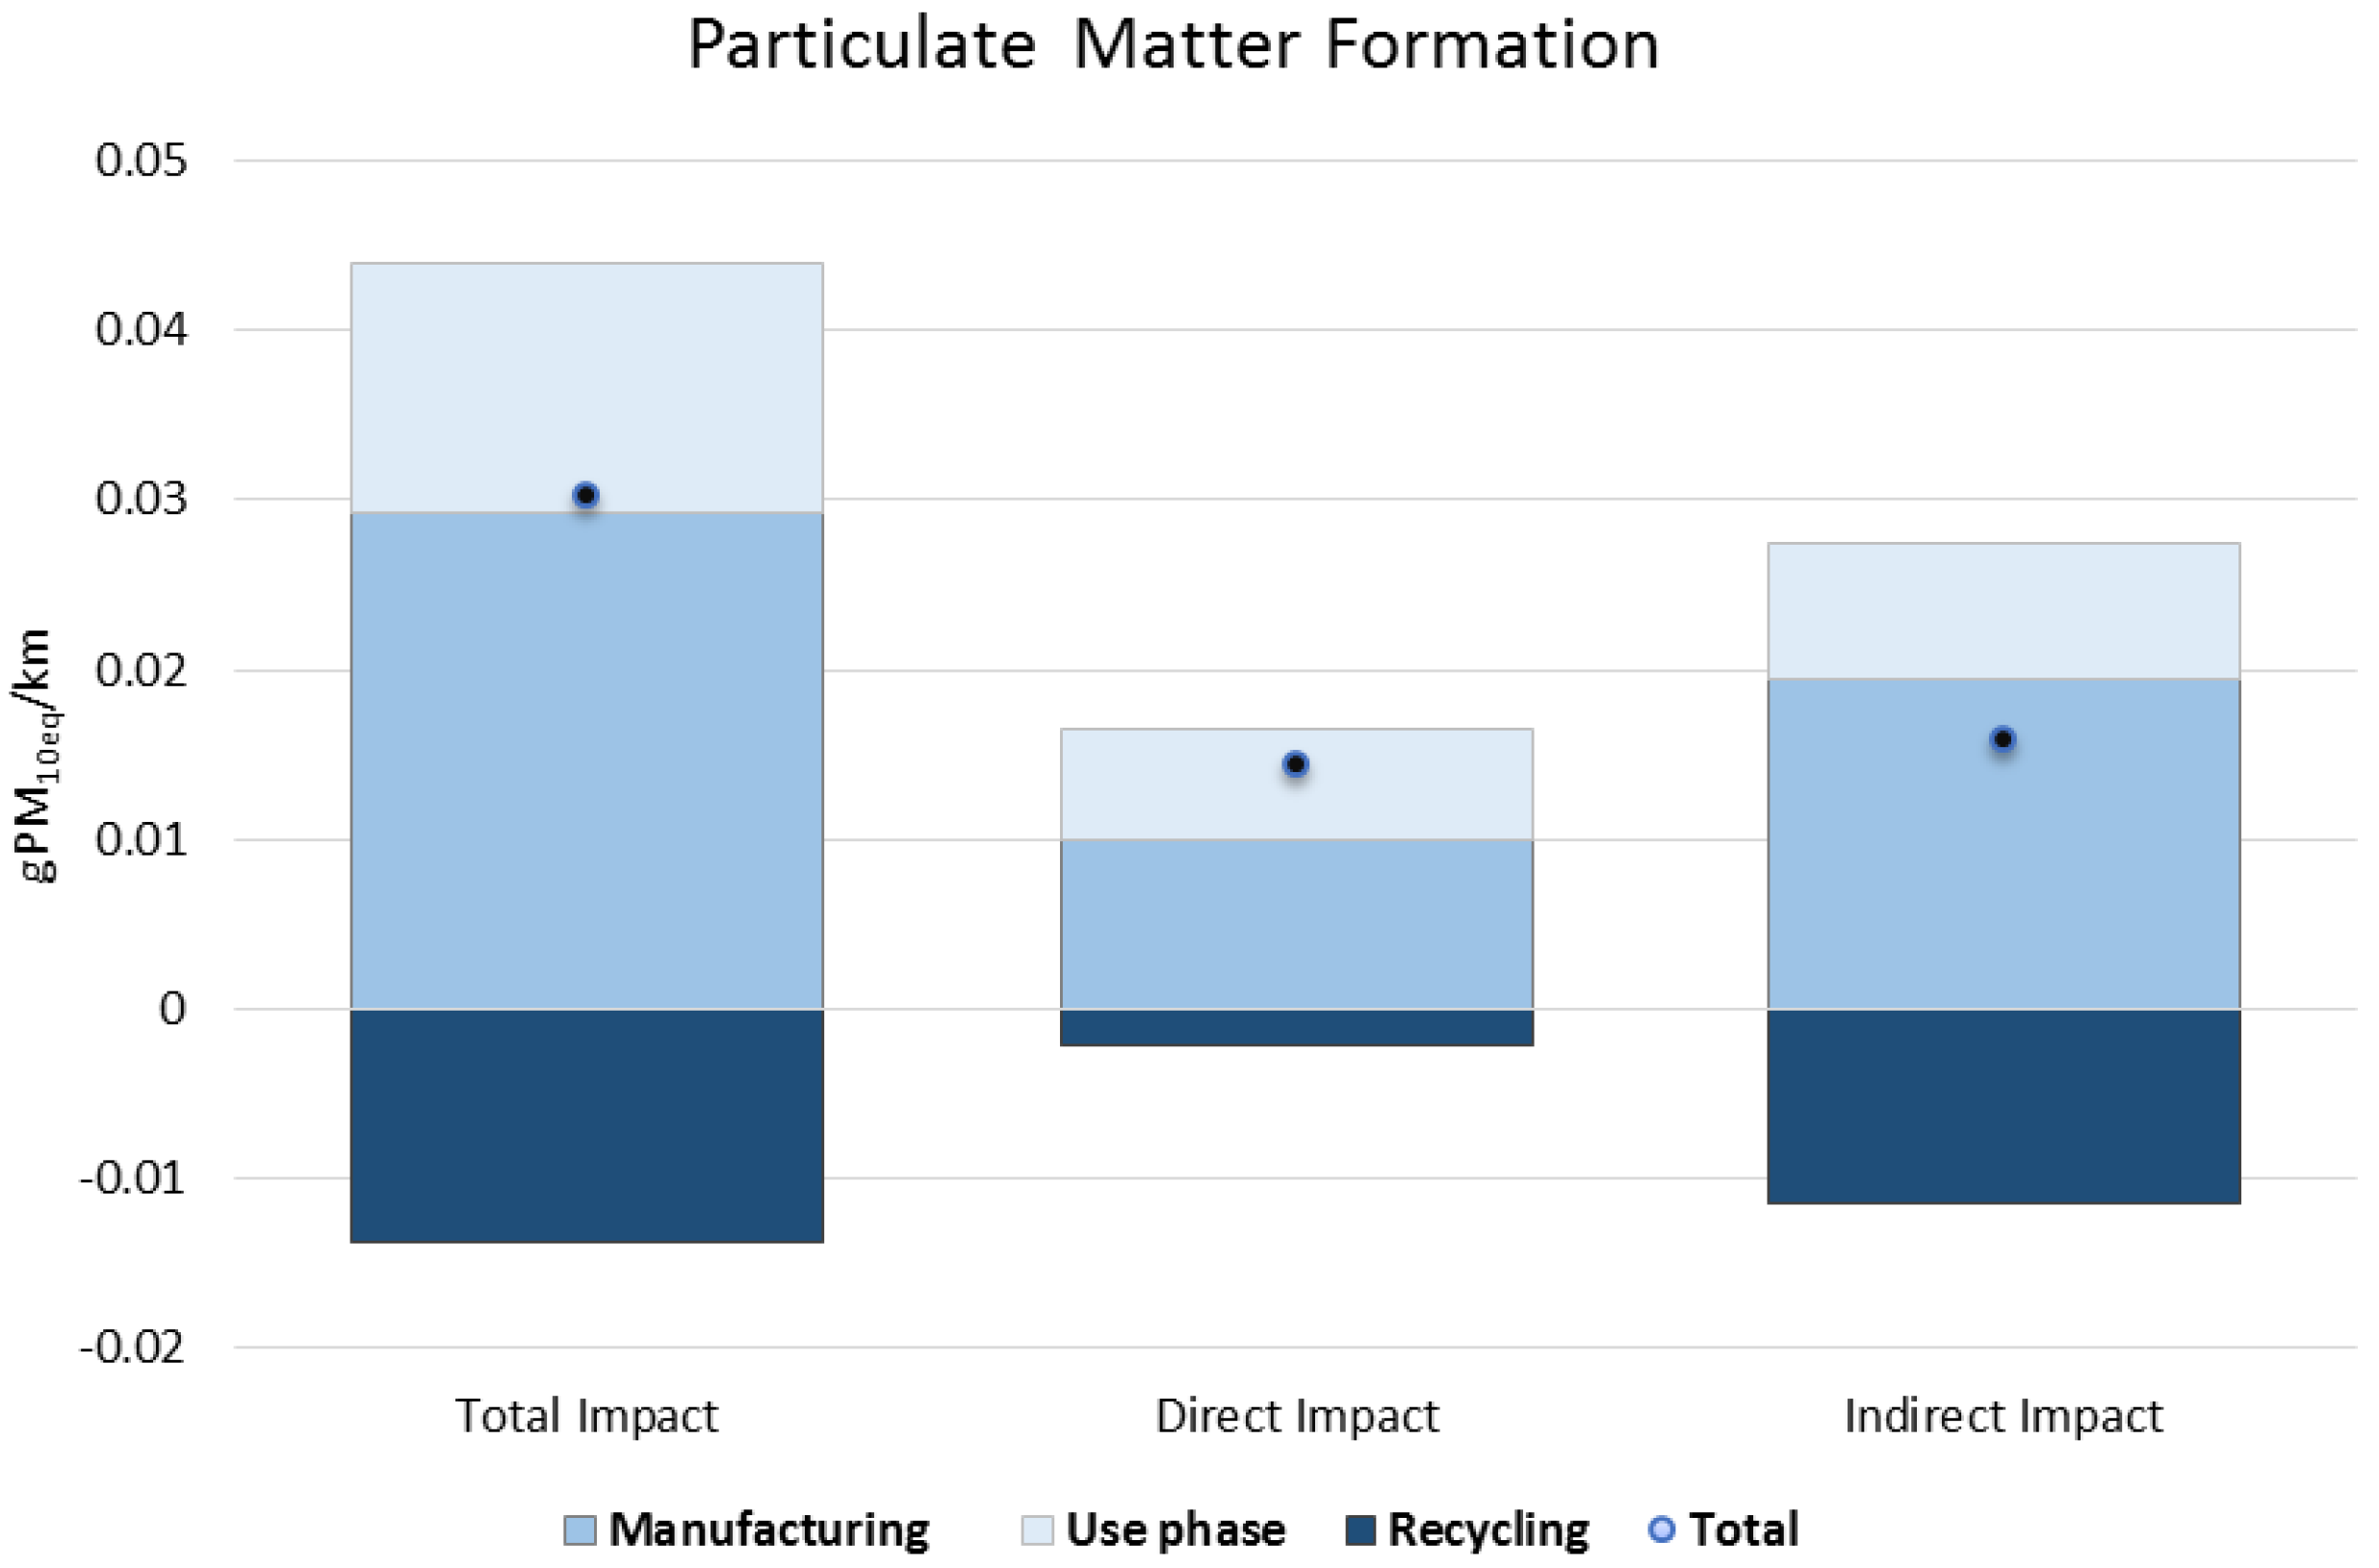
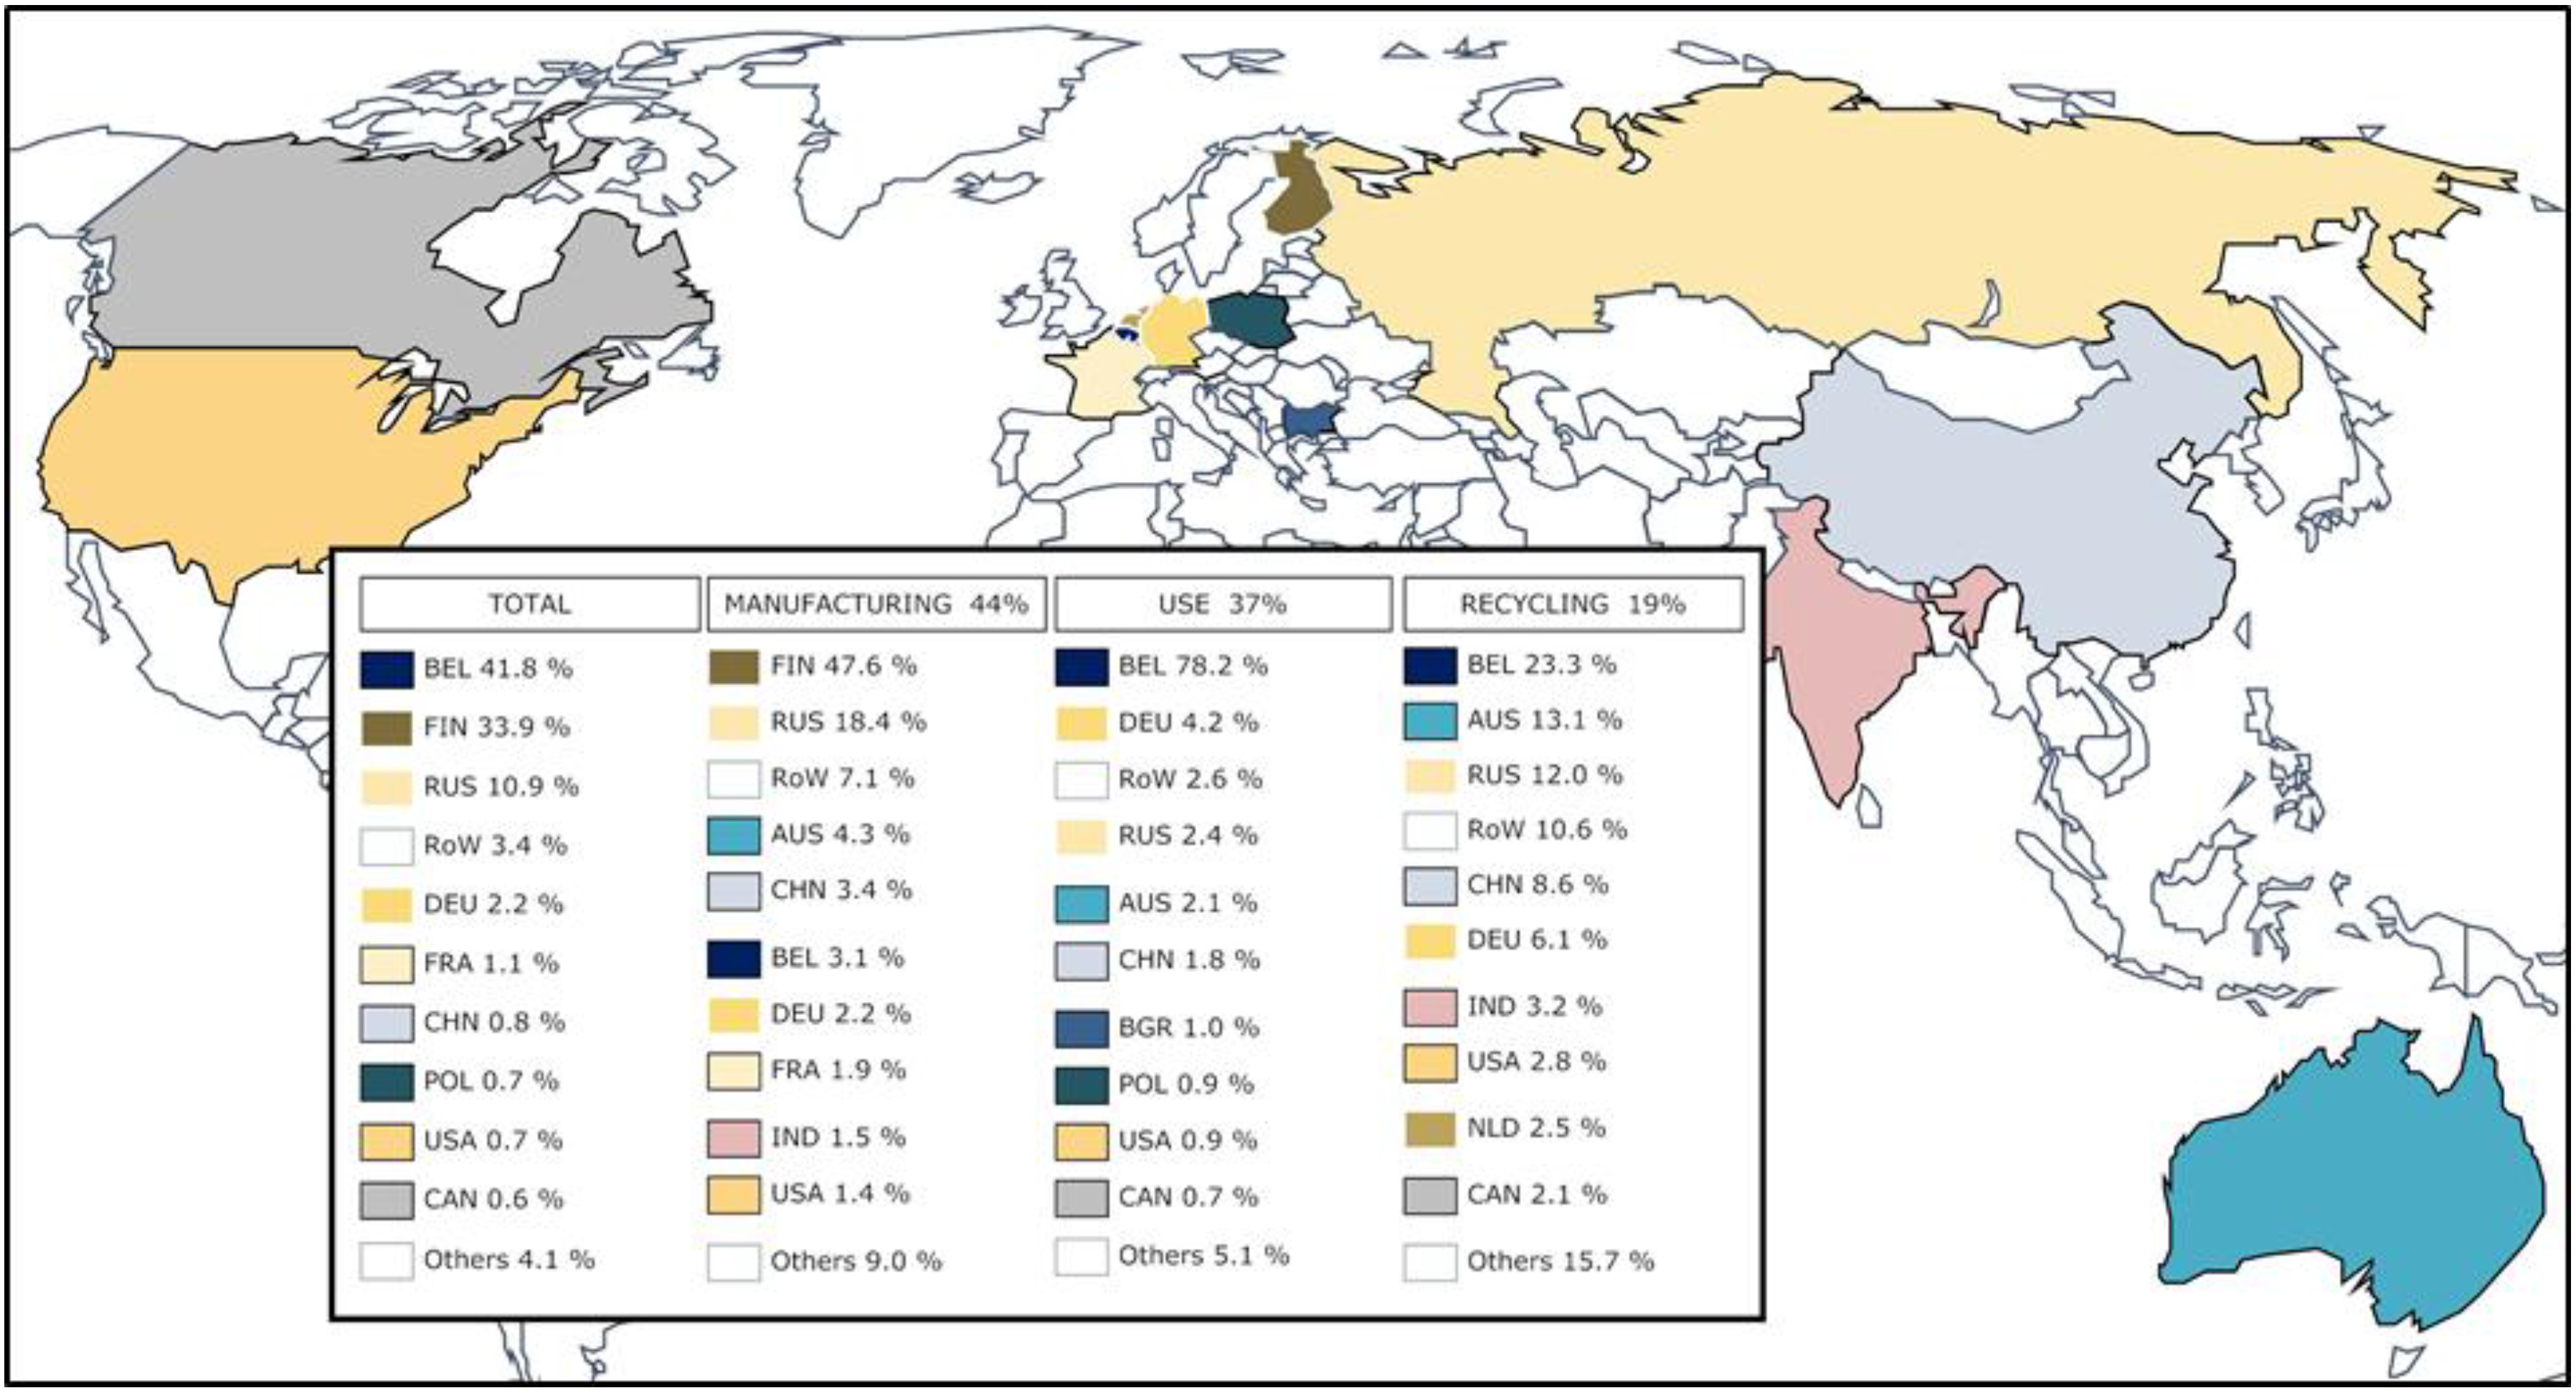
4.1. Environmental Life Cycle Impact Assessment
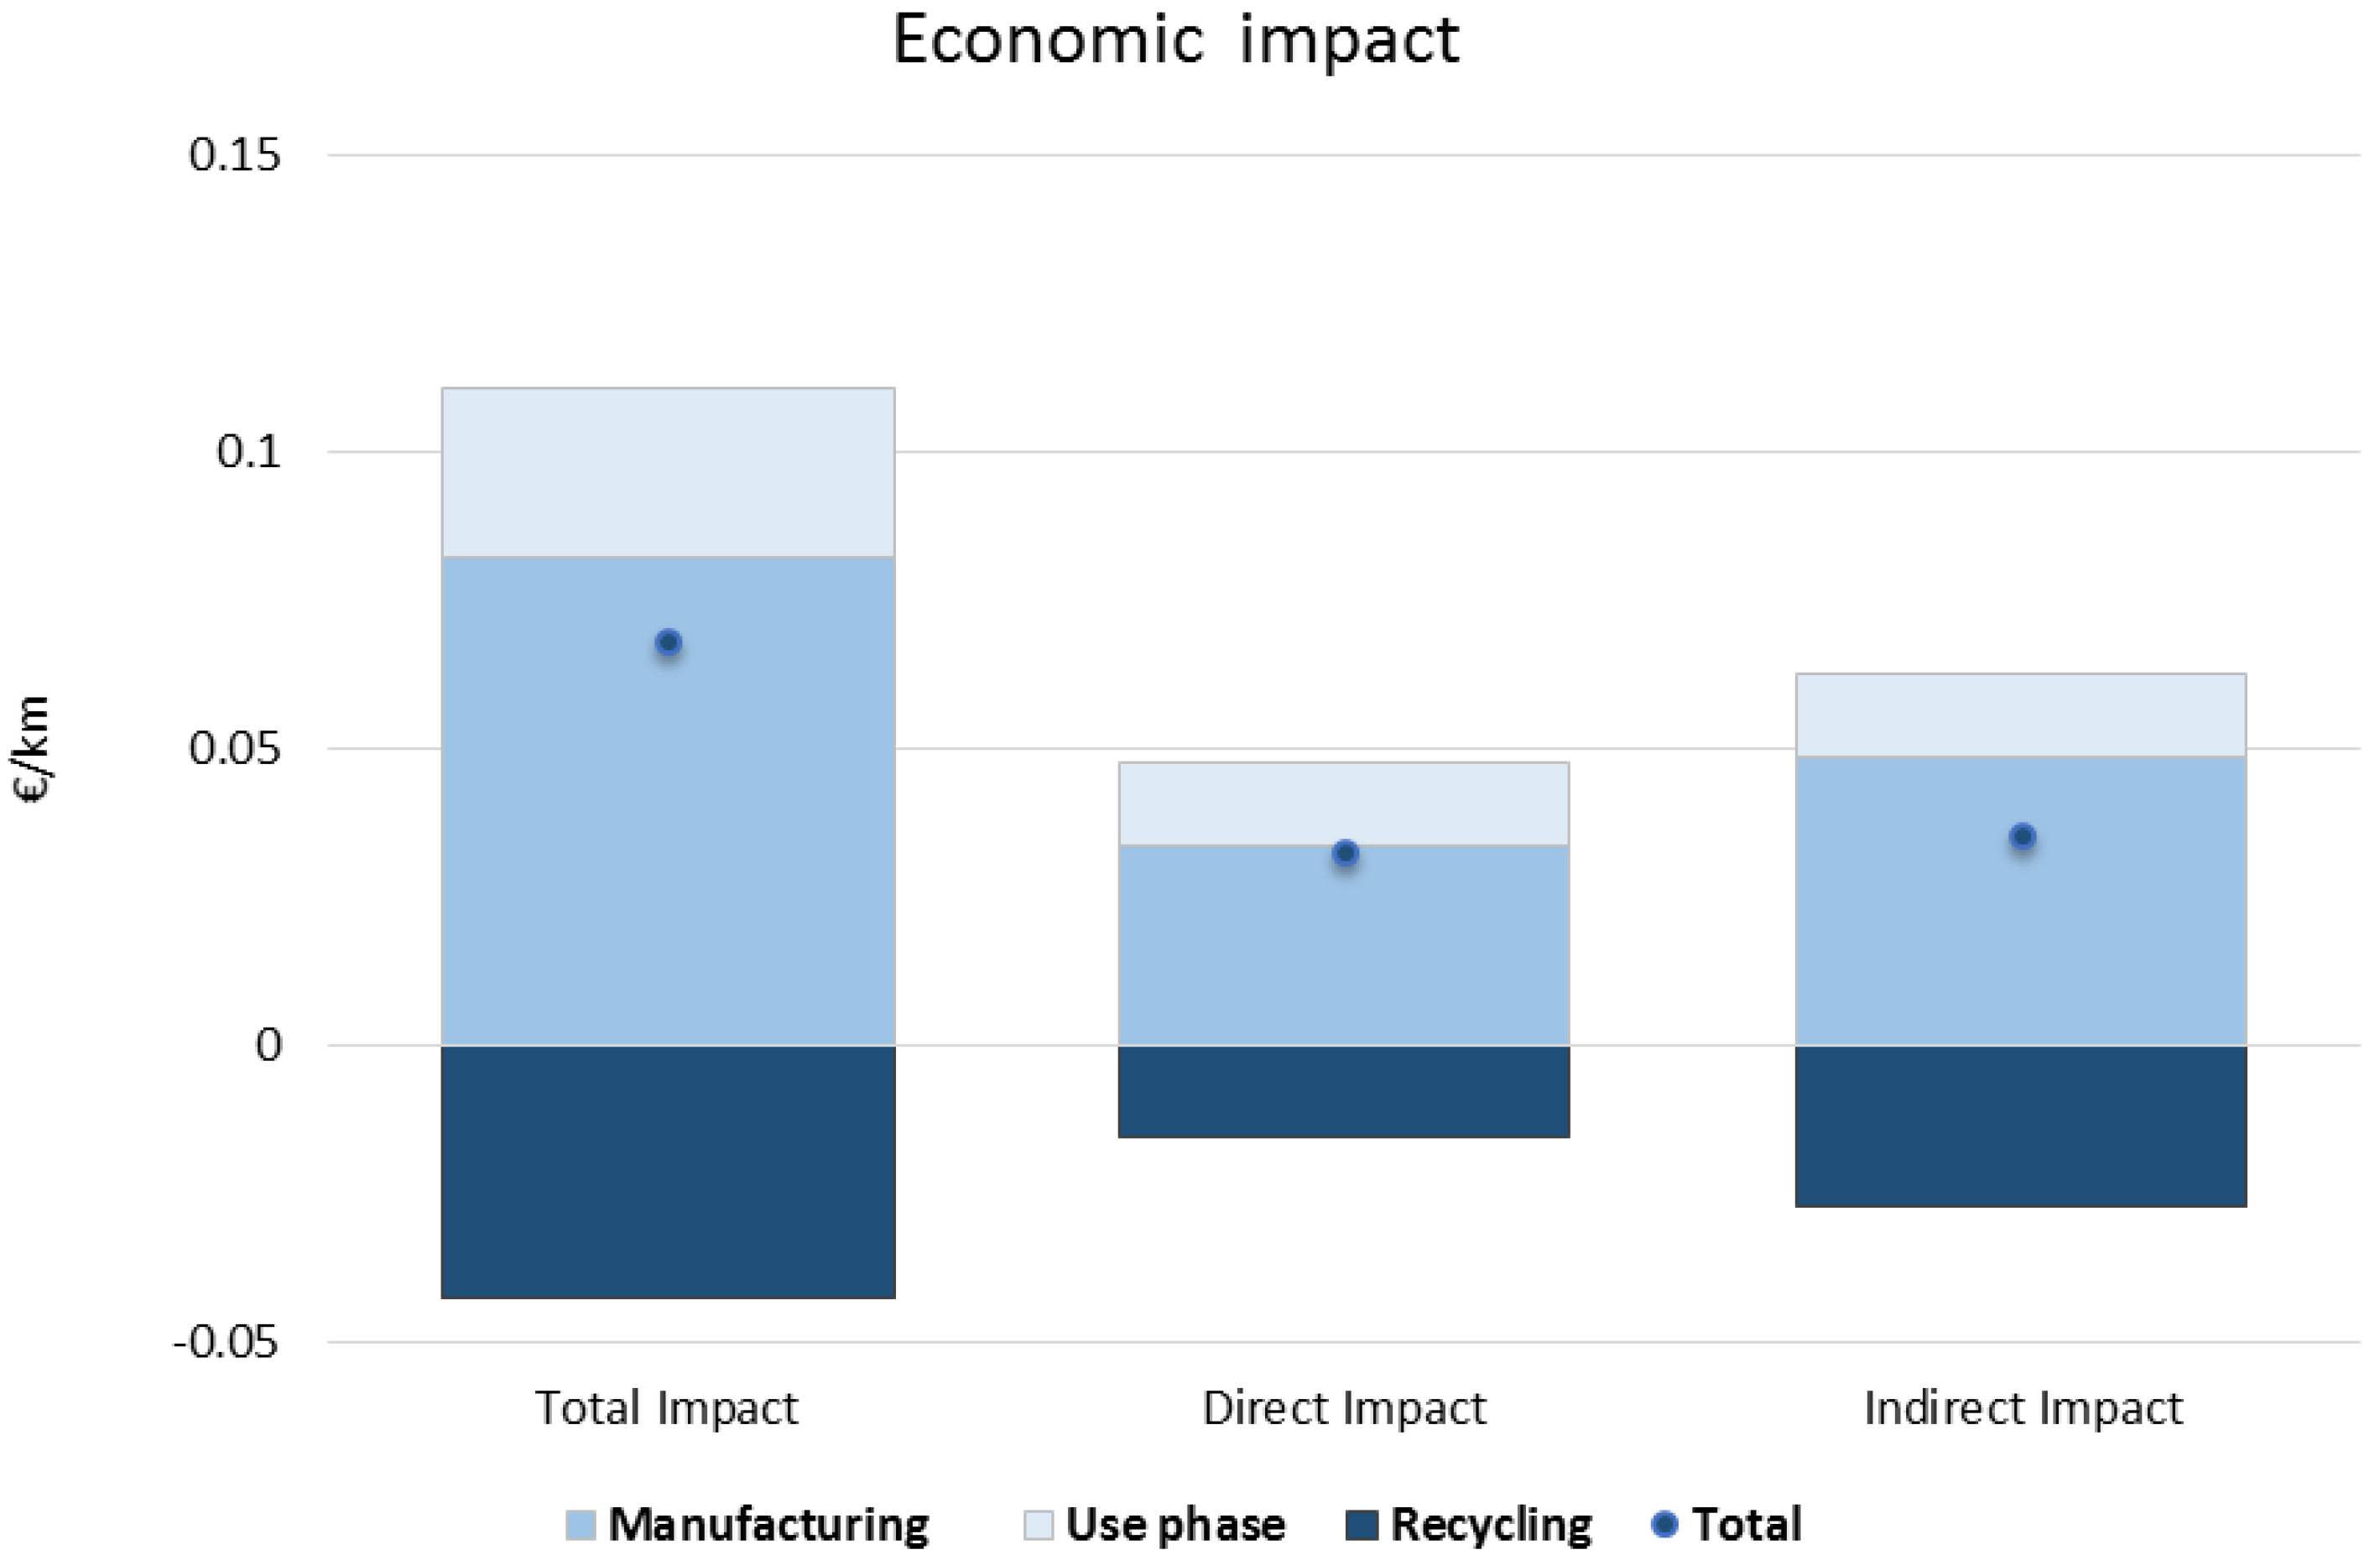
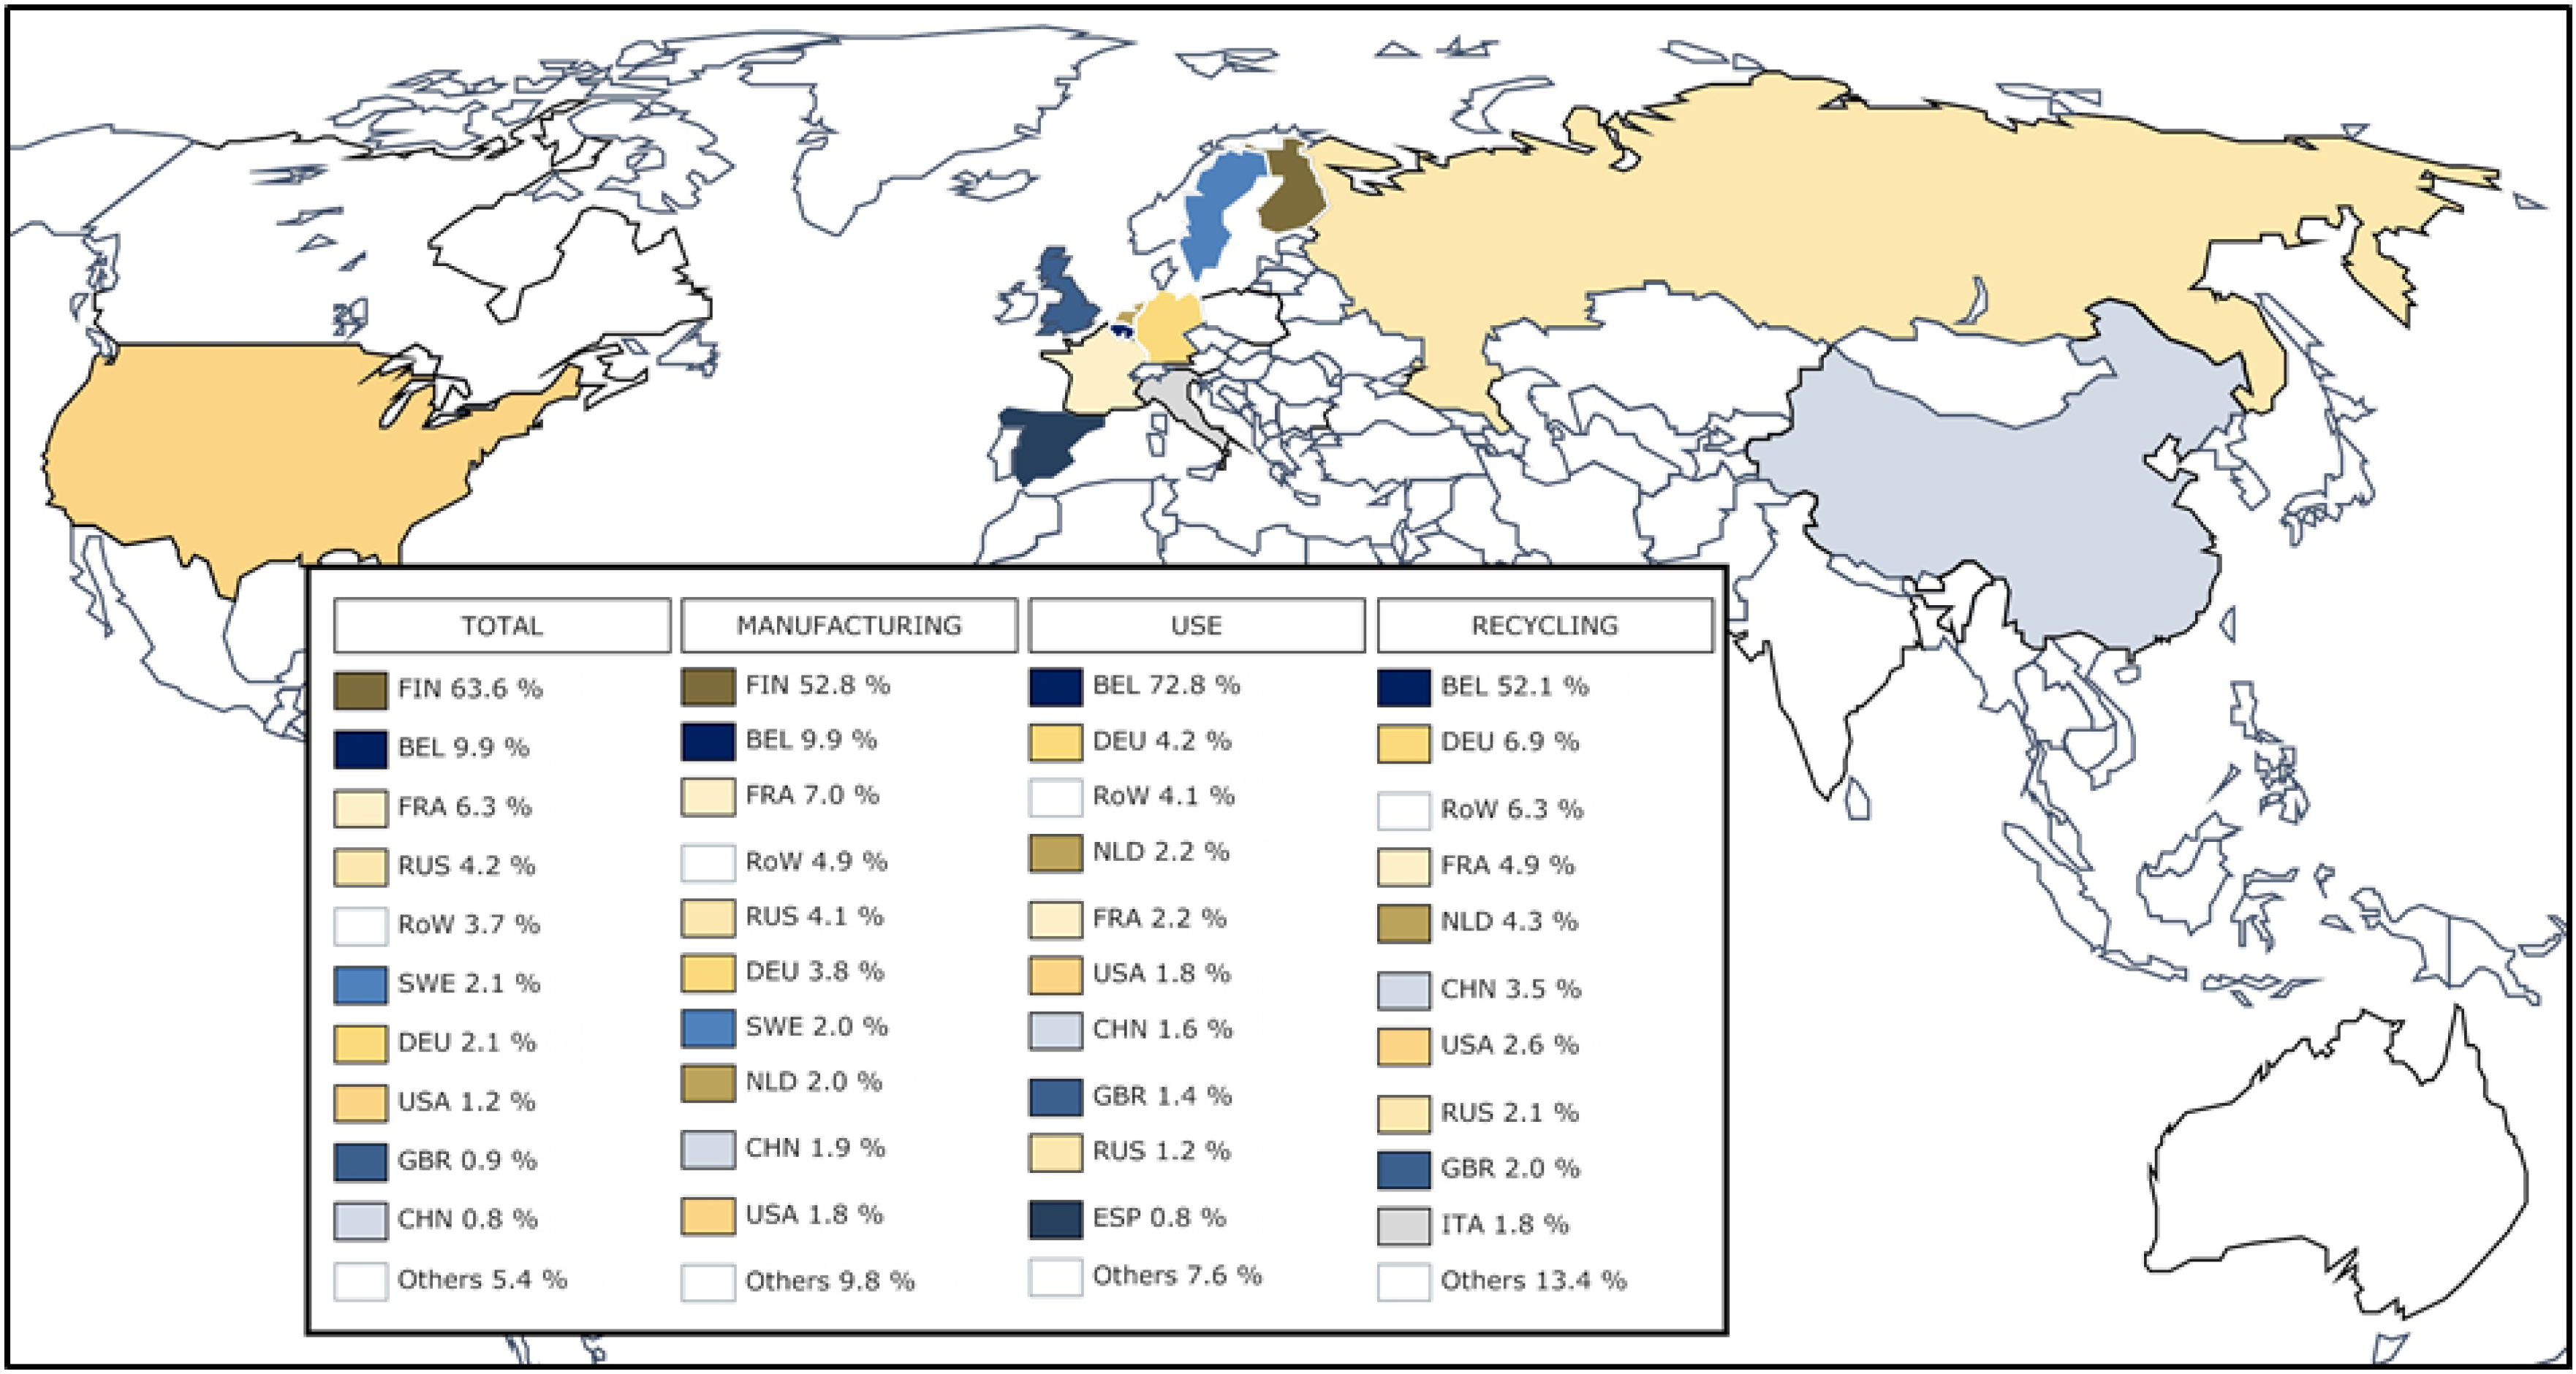
4.2. Economic Effects
5. Conclusions
Supplementary Materials
Acknowledgments
Author Contributions
Conflicts of Interest
Abbreviations
| BCU | Battery Control Unit |
| BEL | Belgium |
| ED | Direct Impacts |
| EEIO | Environmental Extended Input-Output |
| EoL | End-of-Life |
| ESS | Energy Storage System |
| EVs | Electric Vehicles |
| FIN | Finland |
| FU | Functional Unit |
| GHG | Greenhouse Gas |
| GWP | Global Warming Potential |
| HE | High Energy |
| HP | High Power |
| ID | Indirect Impacts |
| IO | Input–Output |
| IOTs | Input–Output Tables |
| LCA | Life Cycle Assessment |
| LCOE | Levelised Cost of Producing Electricity |
| LFP | Lithium Iron Phosphate |
| MRIO | Multiregional Input-Output |
| NEDC | New European Driving Cycle |
| OECD | Organisation for Economic Co-operation and Development |
| PMF | Particulate Matter Formation |
| POF | Photochemical Oxidation Formation |
| RoW | Rest of the World |
| RUS | Russia |
| SUTs | Supply and Use Tables |
| TA | Terrestrial Acidification |
| WIOD | World Input–Output Database |
References
- Bradley, M.J. Electric Vehicle Grid Integration in the US, Europe and China; Technical Reprot, International Council on Clean Transportation: Washington, DC, USA, 2013. [Google Scholar]
- Al-Alawi, B.M.; Bradley, T.H. Review of hybrid, plug-in hybrid, and electric vehicle market modeling Studies. Renew. Sustain. Energy Rev. 2013, 21, 190–203. [Google Scholar] [CrossRef]
- Messagie, M.; Boureima, F.-S.; Coosemans, T.; Macharis, C.; Mierlo, J. A range-based vehicle life cycle assessment incorporating variability in the environmental assessment of different vehicle technologies and fuels. Energies 2014, 7, 1467–1482. [Google Scholar] [CrossRef]
- Omar, N.; Daowd, M.; van den Bossche, P.; Hegazy, O.; Smekens, J.; Coosemans, T.; van Mierlo, J. Rechargeable energy storage systems for plug-in hybrid electric vehicles-assessment of electrical characteristics. Energies 2012, 8, 2952–2988. [Google Scholar] [CrossRef]
- Katrašnik, T. Analytical method to evaluate fuel consumption of hybrid electric vehicles at balanced energy content of the electric storage devices. Appl. Energy 2010, 87, 3330–3339. [Google Scholar] [CrossRef]
- Trovão, J.P.; Pereirinha, P.G.; Jorge, H.M.; Antunes, C.H. A multi-level energy management system for multi-source electric vehicles—An integrated rule-based meta-heuristic approach. Appl. Energy 2013, 105, 304–318. [Google Scholar] [CrossRef]
- Hung, Y.-H.; Wu, C.-H. An integrated optimization approach for a hybrid energy system in electric vehicles. Appl. Energy 2012, 98, 479–490. [Google Scholar] [CrossRef]
- He, H.; Xiong, R.; Zhao, K.; Liu, Z. Energy management strategy research on a hybrid power system by hardware-in-loop experiments. Appl. Energy 2013, 112, 1311–1317. [Google Scholar] [CrossRef]
- Hu, X.; Murgovski, N.; Johannesson, L.M.; Egardt, B. Comparison of three electrochemical energy buffers applied to a hybrid bus powertrain with simultaneous optimal sizing and energy management. IEEE Trans. Intell. Transp. Syst. 2014, 15, 1–13. [Google Scholar] [CrossRef]
- Capasso, C.; Veneri, O. Experimental analysis on the performance of lithium based batteries for road full electric and hybrid vehicles. Appl. Energy 2014, 136, 921–930. [Google Scholar] [CrossRef]
- Sanfélix, J.; Messagie, M.; Omar, N.; Van Mierlo, J.; Hennige, V. Environmental performance of advanced hybrid energy storage systems for electric vehicle applications. Appl. Energy 2015, 137, 925–930. [Google Scholar] [CrossRef]
- Dietzenbacher, E.; Los, B.; Stehrer, R.; Timmer, M.; de Vries, G. The construction of world input-output tables in the wiod project. Econ. Syst. Res. 2013, 25, 71–98. [Google Scholar] [CrossRef]
- Miller, R.E.; Blair, P.D. Input-Output Analysis: Foundations and Extensions; Cambridge University Press: New York, NY, USA, 2009. [Google Scholar]
- Leontief, W.W. Quantitative input and output relations in the economic systems of the United States. Rev. Econ. Stat. 1936, 18, 105–125. [Google Scholar] [CrossRef]
- Hendrickson, C.; Horvath, A.; Joshi, S.; Lave, L. Economic input–output models for environmental life-cycle assessment. Environ. Sci. Technol. 1998, 32, 184a–191a. [Google Scholar] [CrossRef]
- Environmental Management—Life Cycle Assessment—Principles and Frameworks. ISO 14040:2006. International Organization for Standardization (ISO): Geneva, Switzerland.
- Cobas-flores, E.; Hendrickson, C.T.; Lave, L.B.; Mcmichael, F.C. Life Cycle Analysis of Batteries Using Economic Input-Output Analysis. In Proceedings of the IEEE International Symposium on Electronics and the Environment, Dallas, TX, USA, 6–8 May 1996; pp. 130–134.
- Messagie, M.; Lebeau, K.; Coosemans, T.; Macharis, C.; van Mierlo, J. Environmental and financial evaluation of passenger vehicle technologies in Belgium. Sustainability 2013, 5, 5020–5033. [Google Scholar] [CrossRef]
- Environmental Management—Life Cycle Assessment—Requirements and Guidelines. ISO 14044:2006. International Organization for Standardization (ISO): Geneva, Switzerland.
- OECD Input-Output Tables. Available online: www.oecd.org/sti/inputoutput (accessed on 6 October 2015).
- Lenzen, M.; Moran, D.; Kanemoto, K.; Geschke, A. Building Eora: A Global Multi-Region Input-Output Database At High Country and Sector Resolution. Econ. Syst. Res. 2013, 25, 20–49. [Google Scholar] [CrossRef]
- Wood, R.; Stadler, K.; Bulavskaya, T.; Lutter, S.; Giljum, S.; de Koning, A.; Kuenen, J.; Schütz, H.; Acosta-Fernández, J.; Usubiaga, A.; et al. Global Sustainability Accounting—Developing EXIOBASE for Multi-Regional Footprint Analysis. Sustainability 2014, 7, 138–163. [Google Scholar] [CrossRef] [Green Version]
- Timmer, M.P.; Dietzenbacher, E.; Los, B.; Stehrer, R.; de Vries, G.J. An illustrated user guide to the world input-output database: The case of global automotive production. Rev. Int. Econ. 2015, 23, 575–605. [Google Scholar] [CrossRef]
- Caldés, N.; Varela, M.; Santamaría, M.; Sáez, R. Economic impact of solar thermal electricity deployment in Spain. Energy Policy 2009, 37, 1628–1636. [Google Scholar] [CrossRef]
- Goedkoop, M.; Heijungs, R.; Huijbregts, M.; De Schryver, A.; Struijs, J.; van Zelm, R. A Life Cycle Impact Assessment Method Which Comprises Harmonised Category Indicators at the Midpoint and the Endpoint Level. Available online: http://www.leidenuniv.nl/cml/ssp/publications/recipe_characterisation.pdf (accessed on 6 October 2015).
- Pekin, E.; Macharis, C. The Euro terminal model: An analysis of intermodal rail freight transport in Europe. In Proceedings of the 13th World Conference on Transport Research, Rio de Janeiro, Brazil, 15–18 July 2013; pp. 1–17.
- Alberici, B.S.; Boeve, S.; Van Breevoort, P.; Deng, Y.; Förster, S. Subsidies and Costs of EU Energy; European Commission: Brussels, Belgium, 2014. [Google Scholar]
- Sanfelix, J. Multiregional Input-Output Life Cycle Analysis of a Battery Pack for Electric Vehicle Applications; Mobility, Logistics and Automotive Technology Research Centre: Brussels, Belgium, 2016. [Google Scholar]
- Nykvist, B.; Nilsson, M. Rapidly falling costs of battery packs for electric vehicles. Nat. Clim. Chang. 2015, 5, 329–332. [Google Scholar] [CrossRef]
- Notter, D.A.; Gauch, M.; Widmer, R.; Wäger, P.; Stamp, A.; Zah, R.; Althaus, H.-J. Contribution of Li-ion batteries to the environmental impact of electric vehicles. Environ. Sci. Technol. 2010, 44, 6550–6556. [Google Scholar] [CrossRef] [PubMed]
- Majeau-Bettez, G.; Hawkins, T.R.; Strømman, A.H. Life cycle environmental assessment of lithium-ion and nickel metal hydride batteries for plug-in hybrid and battery electric vehicles. Environ. Sci. Technol. 2011, 45, 4548–4554. [Google Scholar] [CrossRef] [PubMed]
- Wiedmann, T.O.; Suh, S.; Feng, K.; Lenzen, M.; Acquaye, A.; Scott, K.; Barrett, J.R. Application of hybrid life cycle approaches to emerging energy technologies—The case of wind power in the UK. Environ. Sci. Technol. 2011, 45, 5900–5907. [Google Scholar] [CrossRef] [PubMed]
- Ramoni, M.O.; Zhang, H.-C. End-of-life (EOL) issues and options for electric vehicle batteries. Clean Technol. Environ. Policy 2013, 15, 881–891. [Google Scholar] [CrossRef]
- DG Research and Innovation—European Commission. Green Cars Initiative. Available online: http://ec.europa.eu/research/transport/road/green_cars/index_en.htm (accessed on 14 September 2015).


| Impact Category | Country and Percentage Contribution | ||
|---|---|---|---|
| Terrestrial Acidification | BEL 44.91% | FIN 14.85% | RoW 9.88% |
| Photochemical Oxidation Formation | FIN 31.02% | RoW 27.72% | RUS 17.94% |
| Particulate Matter Formation | FIN 43.90% | BEL 17.61% | RUS 8.89% |
| Economic Activity Sector | % |
|---|---|
| Electricity, Gas and Water Supply | 30.34 |
| Chemicals and Chemical Products | 21.28 |
| Mining and Quarrying | 11.19 |
| Renting of Machinery and Equipment and Other Business Activities | 7.87 |
| Rubber and Plastics | 4.13 |
| Electrical and Optical Equipment | 3.69 |
| Coke, Refined Petroleum and Nuclear Fuel | 3.30 |
| Inland Transport | 2.86 |
| Wholesale Trade and Commission Trade, Except of Motor Vehicles and Motorcycles | 2.45 |
| Construction | 1.97 |
| Financial Intermediation | 1.68 |
© 2016 by the authors; licensee MDPI, Basel, Switzerland. This article is an open access article distributed under the terms and conditions of the Creative Commons Attribution (CC-BY) license (http://creativecommons.org/licenses/by/4.0/).
Share and Cite
Sanfélix, J.; De la Rúa, C.; Schmidt, J.H.; Messagie, M.; Van Mierlo, J. Environmental and Economic Performance of an Li-Ion Battery Pack: A Multiregional Input-Output Approach. Energies 2016, 9, 584. https://doi.org/10.3390/en9080584
Sanfélix J, De la Rúa C, Schmidt JH, Messagie M, Van Mierlo J. Environmental and Economic Performance of an Li-Ion Battery Pack: A Multiregional Input-Output Approach. Energies. 2016; 9(8):584. https://doi.org/10.3390/en9080584
Chicago/Turabian StyleSanfélix, Javier, Cristina De la Rúa, Jannick Hoejrup Schmidt, Maarten Messagie, and Joeri Van Mierlo. 2016. "Environmental and Economic Performance of an Li-Ion Battery Pack: A Multiregional Input-Output Approach" Energies 9, no. 8: 584. https://doi.org/10.3390/en9080584