1. Introduction
As the relation between the soil oscillation velocity and basic parameters affecting its magnitude, being: the amount of explosive, the distance from the blast site, characteristics of the rock material, and the type of blasting, the equation of M.A. Sadovskii, where the oscillation velocity v is given in the form of the function, is most frequently used:
where
R represents reduced distance, meaning the distance from the blast site to the monitoring point
r, reduced to the used explosive amount
Q.
K and
n parameters conditioned by soil characteristics and blasting conditions, thereby
v is the decreasing convex function of the variable
R.
By applying the law of rock mass oscillation while blasting, the determination of the soil oscillation velocity is enabled for each blast operation in advance; thus, blasting is, as regards seismic effect, under control, and that gives an opportunity to plan the magnitude of shock waves for each future blast operation [
1]. In this way adverse blasting effects are reduced. Adverse effects of blasting imply, in addition to the seismic ones, those of air blast waves, fly rock, etc. Thus, production efficiency is increased and, at the same time, construction and mining facilities, as well as the environment in the vicinity of the blast site, are protected.
2. Soil Oscillation Law
To establish the correlation between the oscillation velocity and three basic parameters affecting its size, the explosive quantity, properties of rock material, and the distance, several mathematical models have been developed. One of the most frequently used models is the equation of Sadovskii defining the law on velocity alteration of soil oscillation depending on the distance, the explosive quantity, and the mode of blasting [
2]. The law defined in this way offers the possibility to determine the seismic effect of blasting towards a facility or a settlement, whereby the connection, between the velocity of soil oscillation and consequences that can affect facilities, is used. The equation of M.A. Sadovskii is given in the form:
where we have:
v—velocity of soil oscillation (m/s);
K—coefficient conditioned by soil characteristics, as well as blasting conditions, where the explosive amount is given by way of the volume. K is being determined by terrain surveying;
n—exponent, conditioned by soil properties and mining conditions and determined by field measurements as well;
r—distance from the blast site to the monitoring point (m);
Q—amount of explosive (kg); and
R—reduced distance, expressed as .
2.1. Derivation of Equation of Rock Mass Oscillation Law
2.1.1. Derivation of Equation of Rock Mass Oscillation—First Mode
The equation of Sadovskii has been derived from the condition that if the radius of charge and the distance from the blast site to the monitoring point increase in the same, or approximately the same ratio, the soil oscillation velocity remains the same [
3], i.e.:
where:
v—velocity of soil oscillation (cm/s);
Kv—coefficient conditioned by soil characteristics, as well as blasting conditions, where the explosive amount is given through radius of the explosive charge. Kv is being determined by terrain surveying;
r—distance from the blast site to the monitoring point (m);
r0—radius of the explosive charge; and
n—exponent, conditioned by soil properties and mining conditions and determined by field measurements as well.
The radius of the explosive charge
r0 and the amount of explosive
Q are related by the equation:
By replacing the value
r0 from the Equation (4) into Equation (3), we obtain:
where as:
where:
Thus, we have obtained the oscillation law of rock mass, i.e., the equation of Sadovskii.
2.1.2. Derivation of Equation of Rock Mass Oscillation—Second Mode
Here we give one more mode to derive the equation for the rock mass oscillation. If, by blasting in the specific environment, the relative increase in the oscillation velocity of the rock mass and the relative increase of the reduced distance are monitored, then it can be seen that their relations at various levels have approximately the same value [
4], which will be marked
−n, meaning that:
Thereby it can be considered that:
Equation (8) can be written in the form:
, where by integration is obtained:
C—represents constant of integration.
Equation (9) can be written in the form:
If in the previous equation C is replaced by K, C = K, then we get the rock mass oscillation equation given by M.A. Sadovskii.
The equation of Sadovskii is commonly shown in the form:
There is a reduced amount of explosive
Qred:
2.2. Models of Determination of Soil Oscillation Law Parameters
There are two parameters, K and n, in Equation (1) which should be determined for the specific work environment and by particular blasting conditions.
2.2.1. Model 1—Determining the Parameters by Applying the Least Square Method
The least square method is mainly used to obtain the parameters
K and
n representing a common model [
5,
6].
2.2.2. Model 2—Determining the Parameters by Applying the Quotient of the Relative Growth of Oscillation Velocities and Reduced Distances
Beginning with the rock mass oscillation law from Equation (1), which is derived in a different way (
Section 2.1.2), whereby the parameter
K, occurring as a constant of integration [
7], can be determined from conditions (initial condition) that, for
R =
R1, is
v =
v1.
Parameters
K and
n will be determined by using experimental data of pairs (
Ri, vi),
i = 1, 2, ...,
N, provided that the curve of the oscillation velocity of rock mass passes through the point
M1(
R1,
v1). In that case from (1) for
R =
R1 and
v =
v1 we obtain:
By replacing values for
K from Equation (13) into Equation (1) we obtain the equation:
From Equation (14), for
R =
R1 there is obtained
v =
v1 for any
n, in our case
n > 0. For
R = Ri,
i = 2, 3, ...,
N, from Equation (14), we can take that:
, i = 2, 3, ...,
N, from there the relation is obtained:
From Equation (15), we can determine parameter
n. By the logarithm operation of Equation (15) we obtain:
Replacing the value for the parameter n in Equation (14), found in this way, we obtain the relation for the oscillation velocity of rock mass in the monitored environment . Thus, to determine the parameter n, all experimental data were taken into account.
2.2.3. Model 3—Determining the Parameters between Parameters K and n is Determined by Applying the Trapezoidal Formula for Finding the Value of Definite Integral
In this model we will use the trapezoidal formula [
8] to find the approximate value of the definite integral of the observed function.
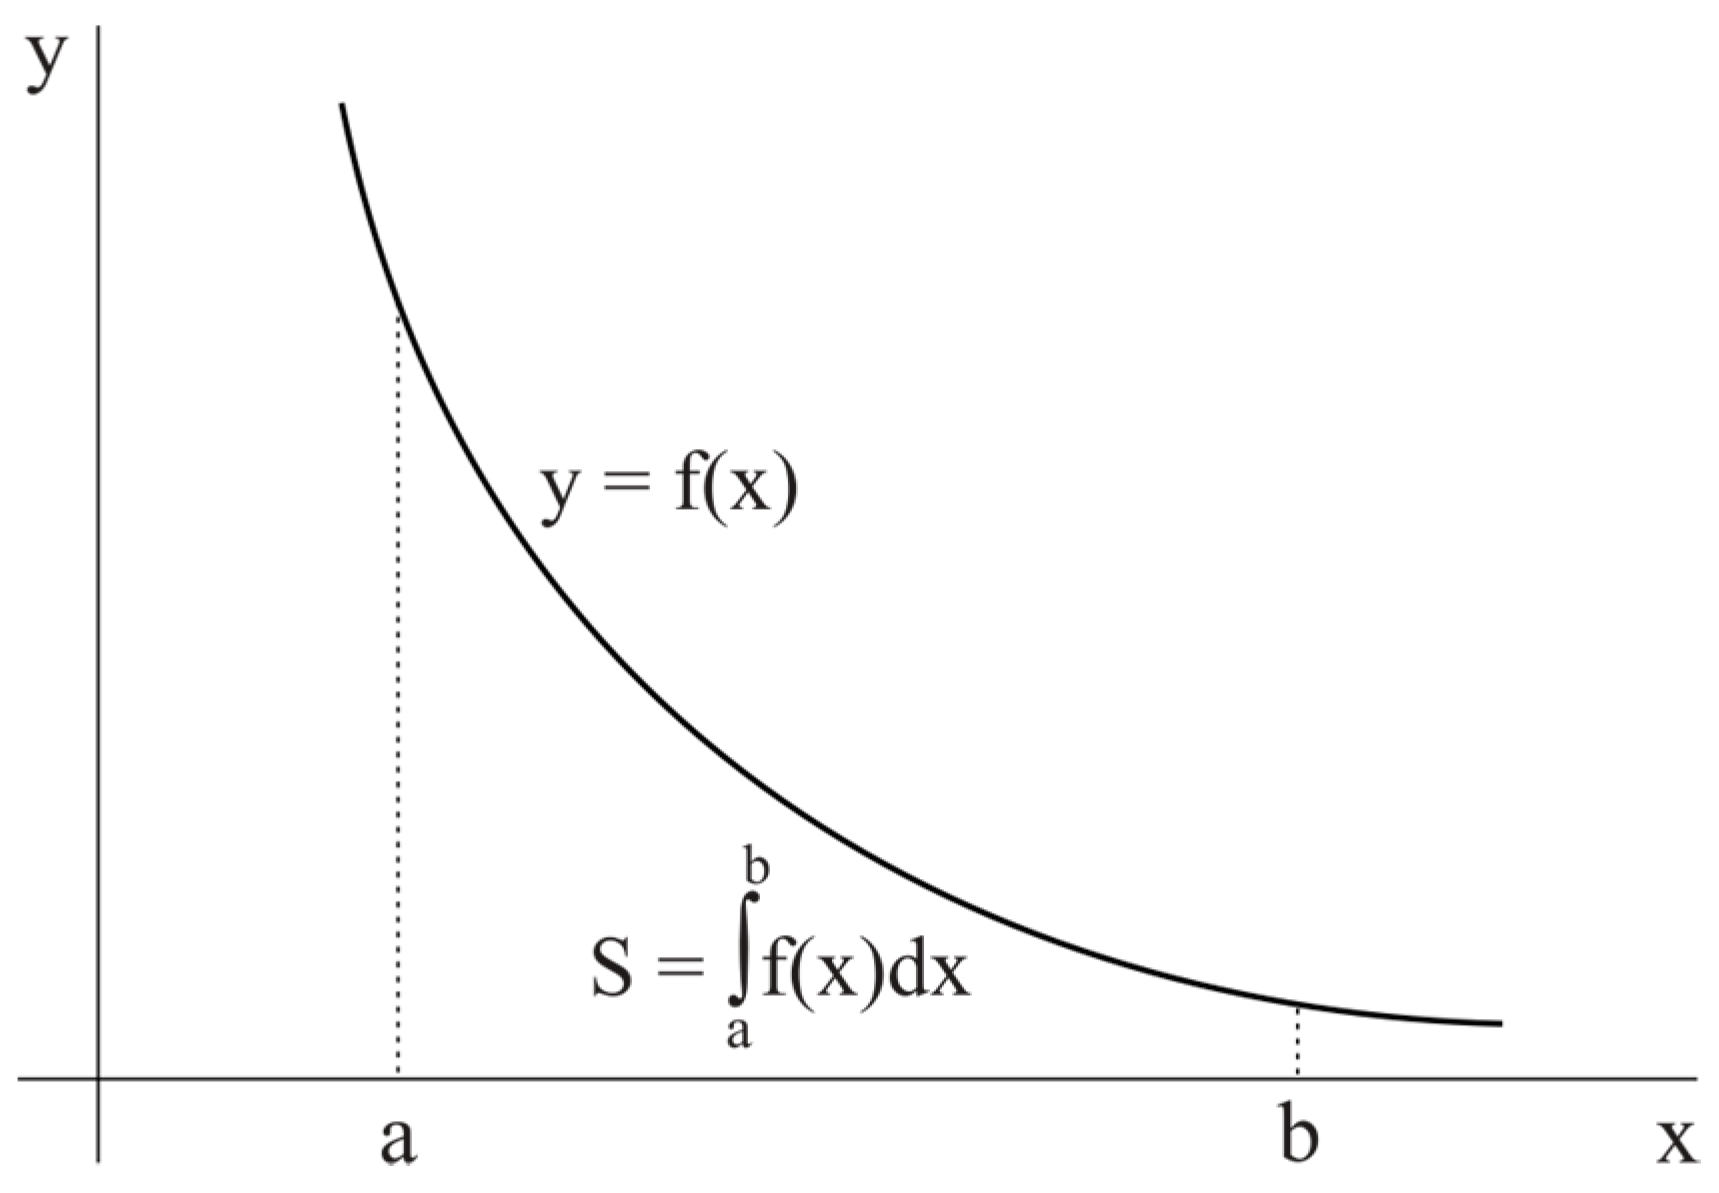
Surface
S confined by continuous curve
y =
f(
x),
x-axis, and vertical lines
x = a and
x = b, if
f(
x) ≥
0 for
a ≤ x ≤ b (
Figure 1), as the definite integral of the function
f(
x), obtains the following:
When carrying out blasting operations, we register (measure) at suitable measuring points the values of oscillation velocities of the rock mass v
i for corresponding values of reduced distances
Ri (
i = 1, 2, ...,
N). If we connect points (
Ri, vi), (
i = 1, 2, ...,
N) with straight lines, then we will obtain a polygonal line (
Figure 2). The surface confined by this polygonal line,
R-axis, and the lines
R = R1 and
R = RN, we mark as
ST. In this way, we obtained
N-1 of the trapezoid. The sum of their surfaces is:
where:
If:
then, for
ST, the following value is obtained:
If points
Ri are not equally spaced, namely if:
then the value of
ST is obtained according to formula:
If we presume that certain values of registered oscillation velocities of the rock mass
vi represent the approximate value of the function
, then we can presume that:
From Equation (23) we find that:
By substituting
K from Equation (23) into Equation (1) we obtain the formula:
For
n = 1, Equation (25) is reduced to:
Taking different values from Equation (25) for parameter n, the appropriate formulas are obtained.
Previous investigations have shown that the value of parameter n generally ranges in an interval from 1–3, so that in Equation (25) we may take that n = 1.5.
3. Defining Statistical Criteria
For the above mentioned models 1, 2, and 3, based on experimental data, we have obtained equations which make possible the determination of the oscillation velocities of the rock mass
v depending on the reduced distance
R. In order to assess the degree of connection between
v and
R, we have used the curved line dependency index
ρ [
9].
The evaluation of the relationship degree of two variables [
5] to values of the curved line dependency index
ρ is given in the following survey:
0.0 < ρ < 0.2—none or highly poor correlation;
0.2 < ρ < 0.4—poor correlation;
0.4 < ρ < 0.7—significant correlation; and
0.7 < ρ < 1.0—strong or highly strong correlation.
As a convenience measure of the obtained functional relationship for the given experimental data, the criterion “3S” was also used [
10]. This criterion uses squares of differences between the obtained experimental data and the calculated ones for oscillation velocities of
v. If those differences are one after another
ε1,
ε2, ...
εN, then it is:
According to this criterion, for the evaluation of convenience of the obtained functional correlation, the following relations are valid:
if |εmax| ≥ 3S, the obtained functional correlation is rejected as unfavorable; and
if |εmax| < 3S, the functional correlation is accepted as a good one.
4. Methodology of Research
The practical part of this study includes:
experimental investigations performed in the Veliki Krivelj Open Pit in the Bor District, and
investigation carried out during mass mining in the Kovilovača Open Pit near Despotovac.
4.1. Experimental Investigation in the VelikiKrivelj Open Pit
4.1.1. General Characteristics of the Work Environment in the Veliki Krivelj Open Pit
In the Veliki Krivelj Open Pit we performed experimental investigations on copper ore [
7]. The basic physical and mechanical properties of the rock mass were determined on samples in the laboratory. By examining the physical and mechanical properties of the work environment, the following values were obtained:
compressive strength, σp = 31 MPa;
bending strength, σs = 5.1 MPa;
tensile strength, σI = 3.4 MPa;
cohesion, C = 7.5 MPa;
strength coefficient, f = 3;
volume density, γ = 24 kN/m3;
angle of internal friction, ϕ = 52°;
porosity, p = 3.5%;
velocity of longitudinal waves, cp = 2400.00 m/s;
velocity of transverse waves, cs = 1400.00 m/s.
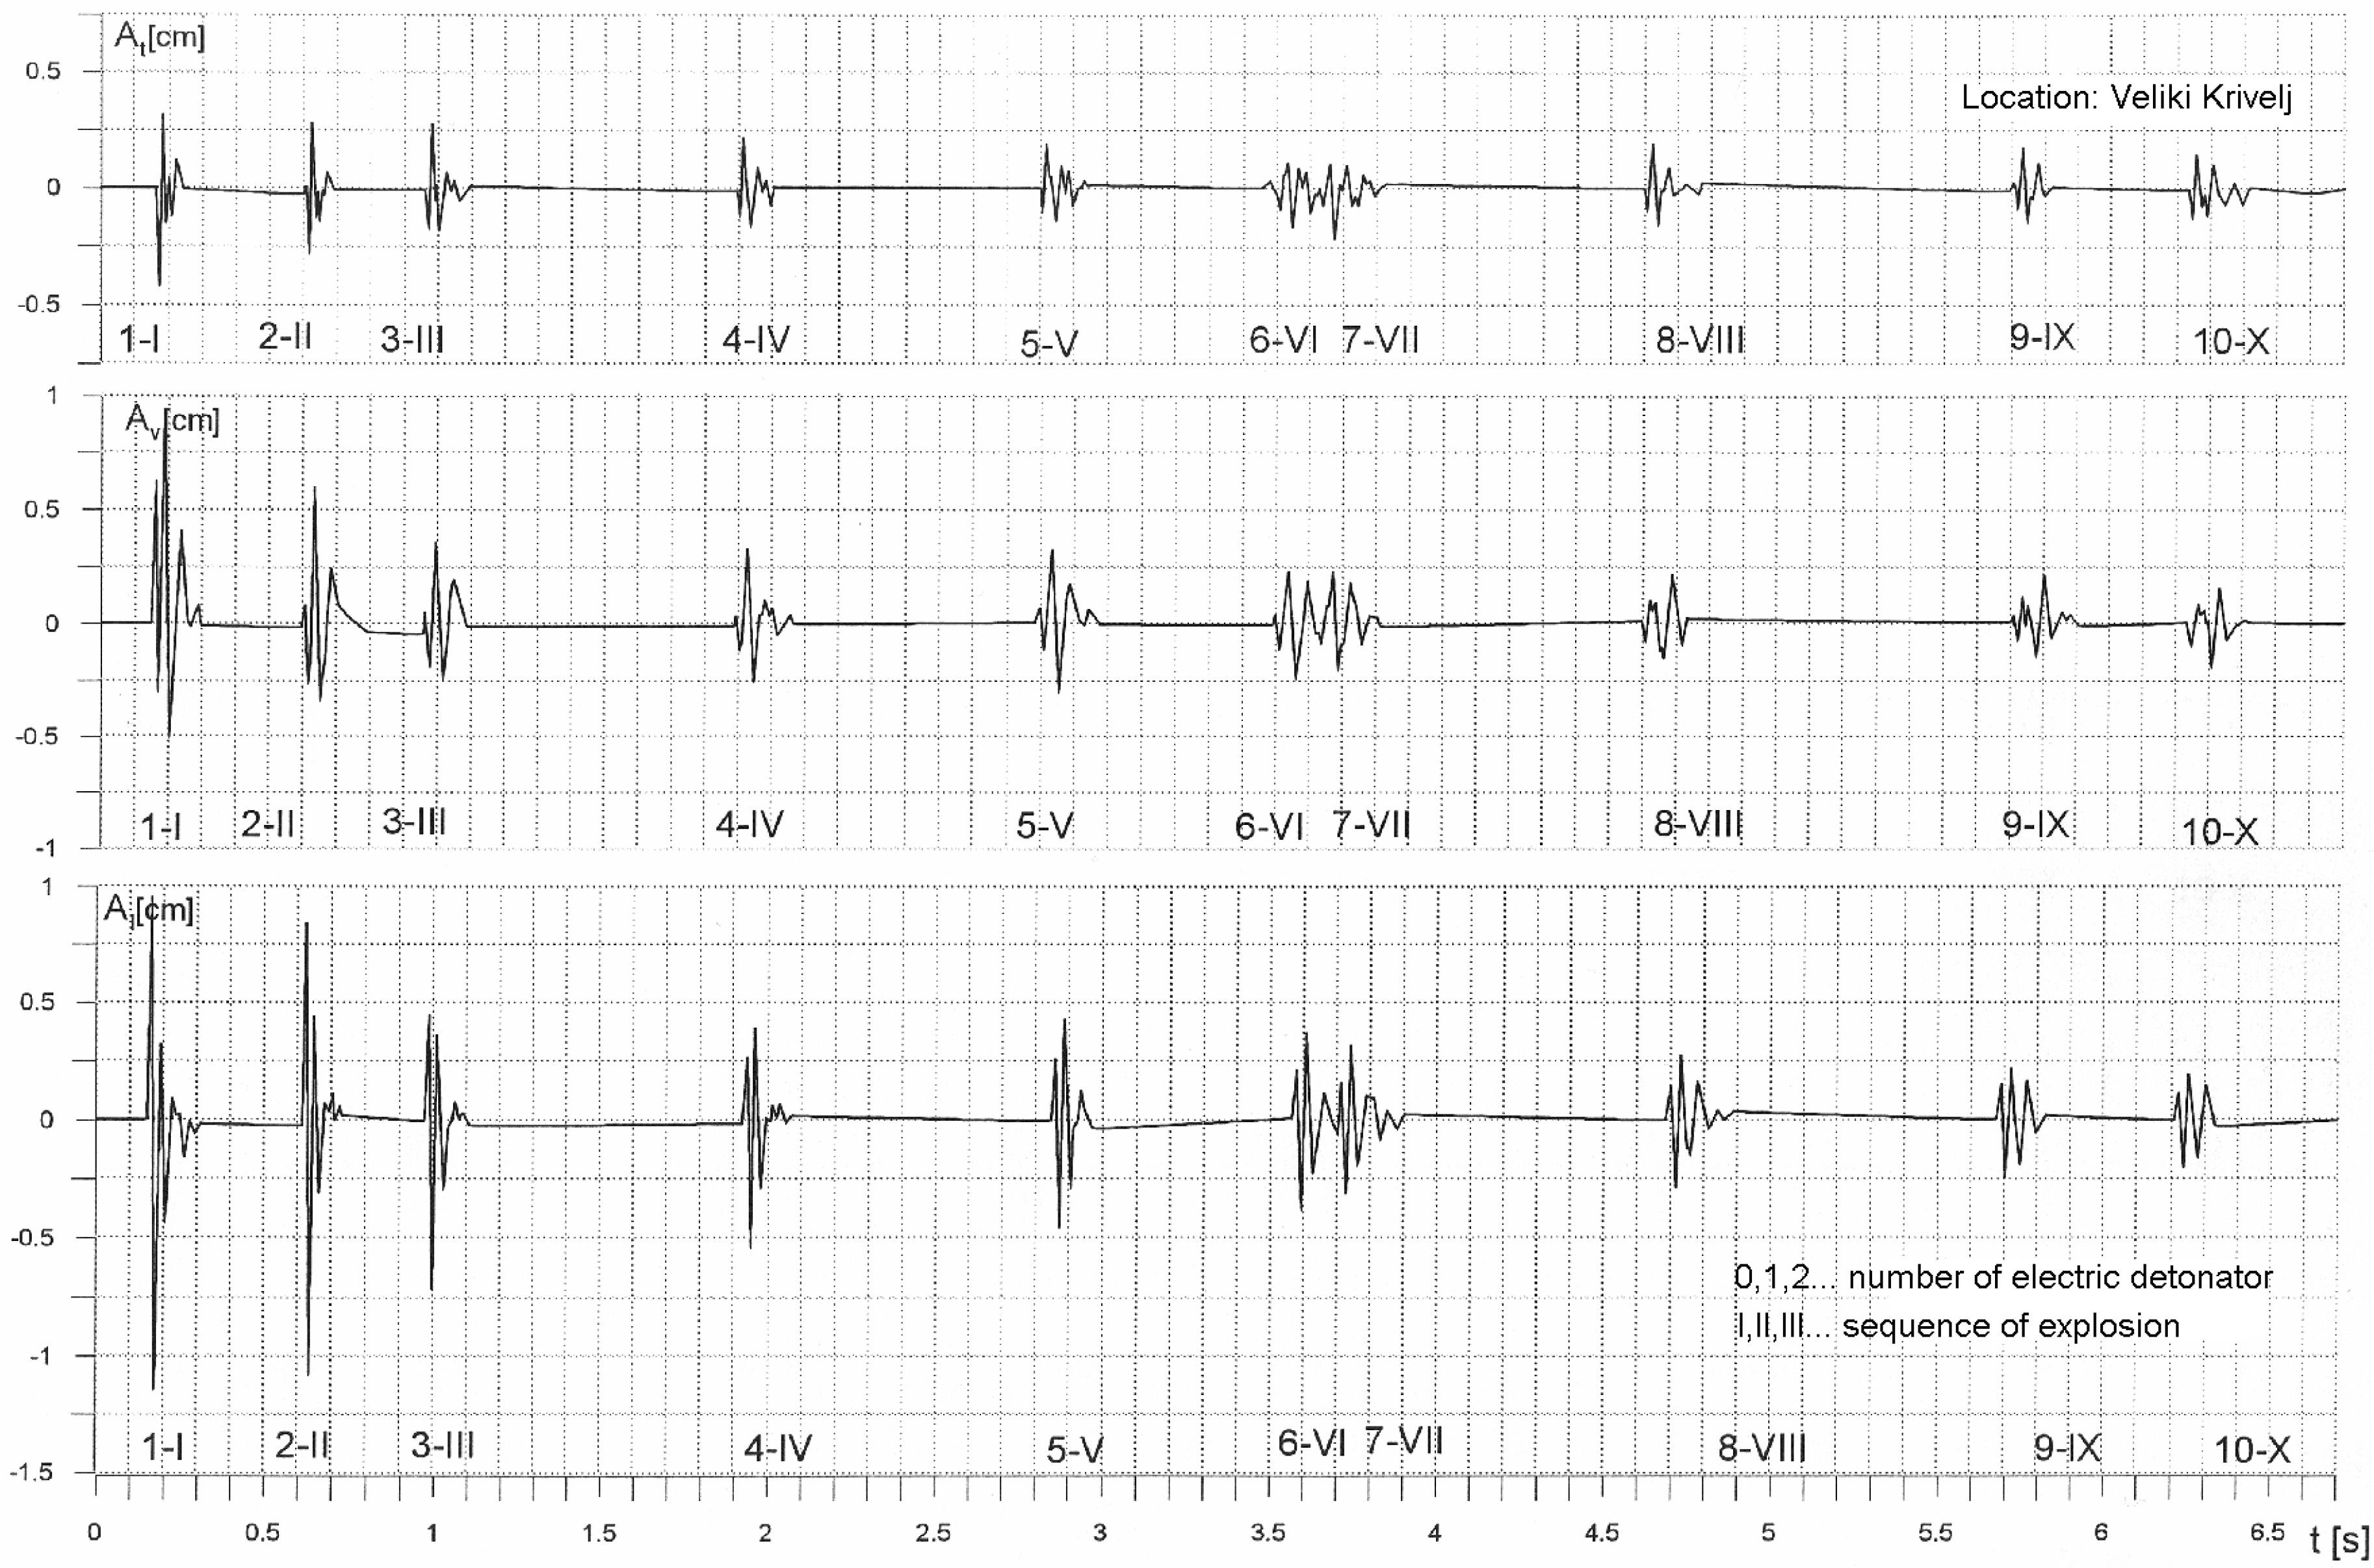
4.1.2. Method of Blasting in the Veliki Krivelj Open Pit
The measurements of shocks resulting from blasting in the Veliki Krivelj Open Pit were performed during blasting using half-second electric detonators. The delay time of initiation between boreholes was 0.5 s, which led to ten explosions and appropriate soil oscillation velocities.
The explosive used was powdered ammonium nitrate for general purposes (Amoneks-I, manufactured by Trayal Corporation AD, Kruševac, Serbia). The holes were arranged in a single line while one cartridge of explosive was placed in each hole. The diameter of the explosive cartridge was 28 mm, with a cartridge length of 0.15 m, and a cartridge weight of 0.1 kg. An electric capacitor was used for initiation of the explosive.
During experimental investigations performed in the Veliki Krivelj Open Pit, the following blasting parameters were specified:
depth of borehole: 0.5 m;
weight of explosive charge per borehole: 0.10 kg;
number of boreholes: 10;
distance between boreholes: 1.0 m;
distance between measuring point and the first borehole: 5.0 m; and
delay time between initiation of boreholes: 0.5 s.
Figure 3 shows a record of the soil oscillation velocity for blasting in the Veliki Krivelj Open Pit.
4.1.3. Calculation for Parameters of the Soil Oscillation Law in the Veliki Krivelj Open Pit
The values of distance from the blasting point to the point of observation
r, quantity of explosive
Q, calculated values of reduced distances
R, registered values of soil oscillation velocities by components
vt,
vv, and
vl, and the resulting soil oscillation velocities
vrez for a total of ten explosions, are given in
Table 1.
On the basis of the data given in
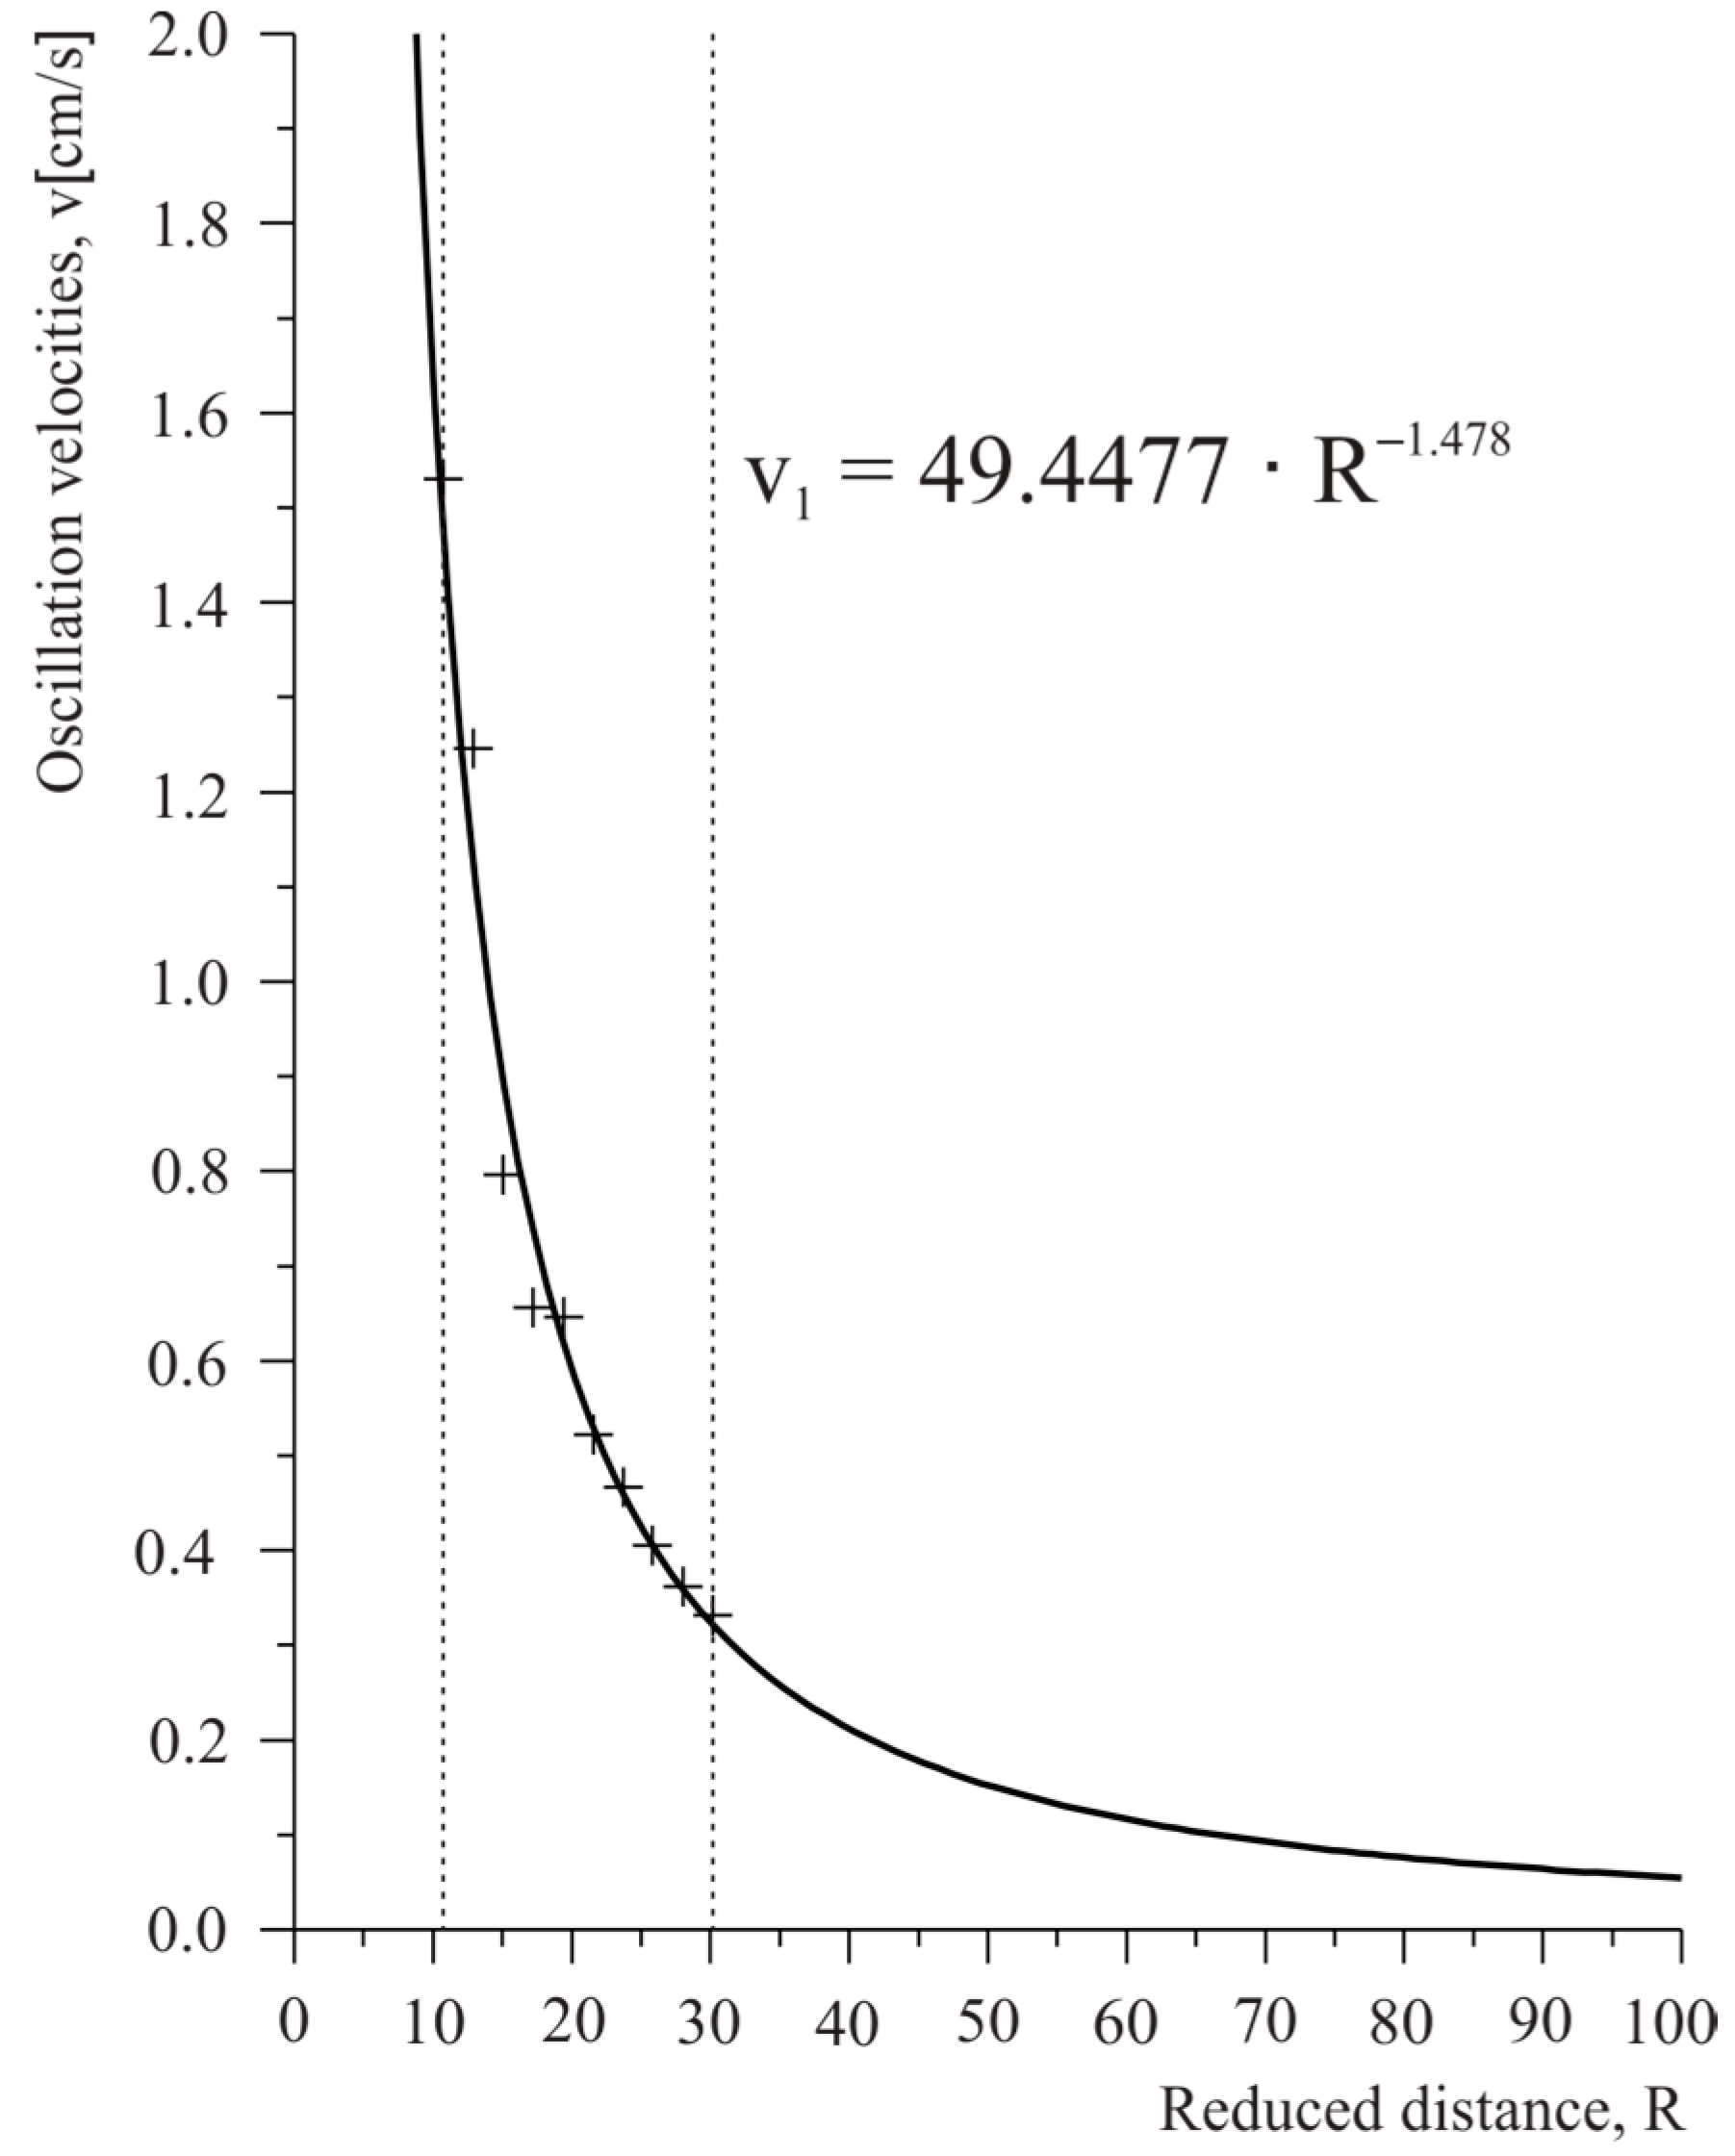
Table 1, the soil oscillation law is calculated by Equation (1)—by the models 1, 2, and 3. The calculation of the curve was carried out for values of reduced distances from
R = 10.7722 to
R = 30.1621. Thus, curve parameters were calculated enabling us to determine the equation of soil oscillation in the form of:
A graphic survey of the soil oscillation law is shown in
Figure 4.
By using experimental data given in
Table 1, where:
according to the Equation (20) we obtain:
In this case for
n = 1.5, according to Equation (25) we obtained the equation of the soil oscillation velocity law in the following form:
On the basis of the obtained equations of soil oscillation (28)–(30), it is possible to calculate values of soil oscillation velocities for corresponding reduced distances for models 1, 2 and 3.
The survey of reduced distances
R, recorded oscillation velocities
vr, calculated oscillation velocities
vi1,
vi2, and
vi3, as well as the difference between the recorded and calculated soil oscillation velocities for models 1, 2, and 3, are presented in
Table 2.
Based on the data in
Table 2, a statistical analysis was carried out and the following values were obtained:
For model 1:
The curved line dependency index
ρ1 between the reduced distance
R and soil oscillation velocity
v is:
The maximum difference between the recorded and calculated oscillation velocities of the soil, (
εmax) =
max |εi|, amounts:
εmax1 = 0.1204, S1 = 0.0592, 3S1 = 0.1776.
As εmax1 < 3S1, the supposed functional relationship is accepted as a good one.
For model 2:
ρ2 = 0.9893 (there is a strong correlation between R and v, given in Equation (29)).
εmax2 = 0.1147, S2 = 0.0550, 3S2 = 0.1650.
εmax2 < 3S2 (the supposed functional relationship is accepted as a good one).
For model 3:
ρ3 = 0.9887 (there is a strong correlation between R and v, given in Equation (30)).
εmax3 = 0.1089, S3 = 0.0566, 3S3 = 0.1698.
εmax3 < 3S3 (supposed functional relationship is accepted as a good one).
4.2. Investigation during Mass Mining in the Kovilovača Open Pit
In order to check the results of experimental investigations, we have also carried out investigations during mass mining, carried out for the purpose of exploitation of mineral deposits. Measurements were carried out in the Kovilovača Open Pit near Despotovac.
4.2.1. General Characteristics of the Kovilovača Open Pit
Kovilovača limestone deposits have an exceptionally simple geological structure. Limestone deposits of this area are massive or layered with layer thickness ranging from 0.20–0.80 m, the direction of propagation is NE–SW and a slope of about 42° towards the southwest. These rocks, in engineering geological terms, belong to a group of associated rocks, which are cracked and karstified [
11]. During previous investigation and exploitation works, no significant burst deformations, which would significantly influence the process of exploration and exploitation, were noted in the deposit. Only after blasting do blocks of rock of 0.50 m
3 occur, which could be attributed to the effect of small faults and karstified cracks in the deposit.
By examination of physical and mechanical properties of the working environment, the following values are obtained:
angle of internal friction: φ = 31°35′
cohesion: C = 138.33 kPa
volume weight: γ = 26.26 kN/m3
compressive strength: σp = 80.808 MPa
tensile strength: σz = 7.59 MPa
velocity of longitudinal elastic waves: cp = 6661.00 m/s
velocity of transverse elastic waves: cs = 2852.67 m/s
dynamic elasticity modulus: Edin = 62.46 GPa
dynamic Poisson’s ratio: μdin = 0.39 GPa
4.2.2. Method of Blasting in the Kovilovača Open Pit
Measurements of seismic shocks at Kovilovača Open Pit were performed during blasting, conducted for the purpose of deposit exploitation. Two blasting operations were performed.
Balkanit 60/1500, detonex 65/1500 and ANFO 70/1500 were used as explosives. Activation of explosives in the borehole was performed using nonel detonators with retardations of 500 ms in the borehole, while the retardation between boreholes on the surface was 25 ms and 42 ms. Activation of the nonel tube was performed using an electric detonator.
Basic data related to the number of boreholes
Nb, the overall explosive amount
Quk, the maximal explosive amount by deceleration interval
Qi, overall borehole depth
Luk, and average stemming length
Lpč, are presented in
Table 3.
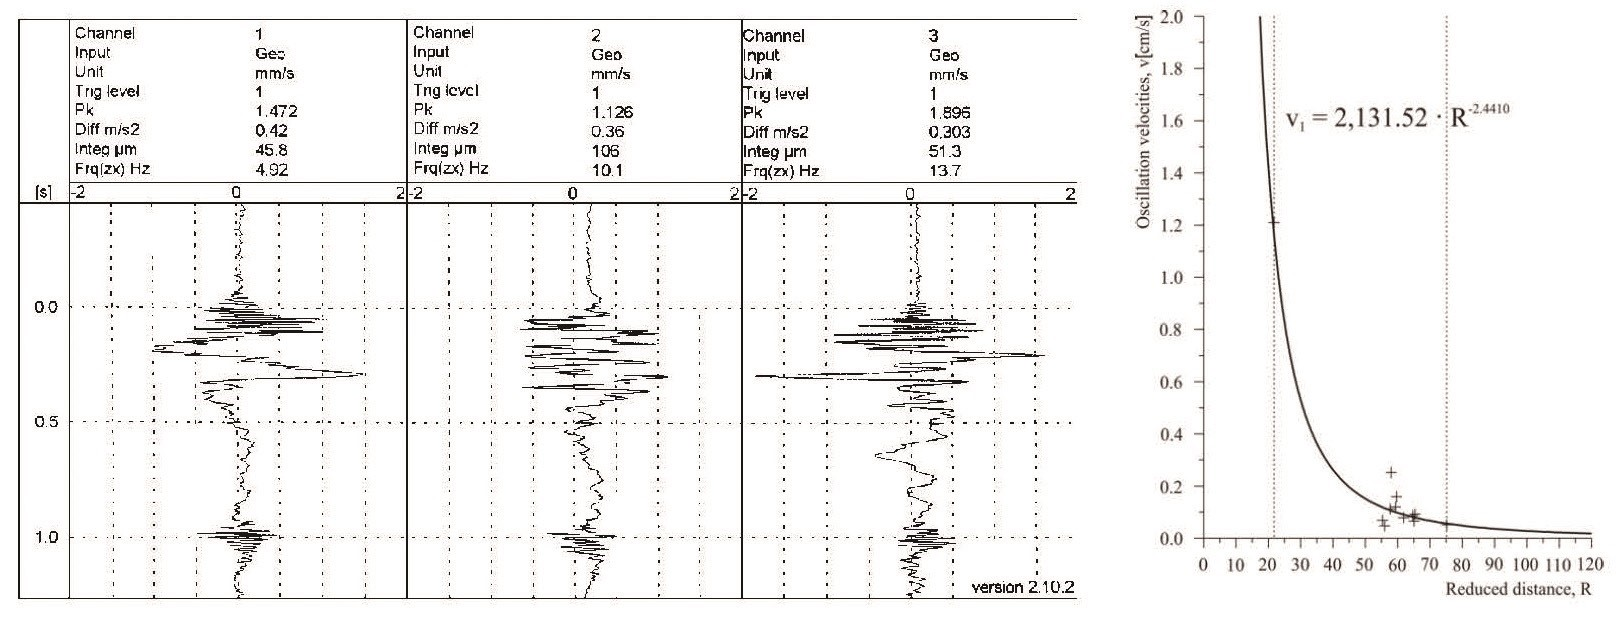
The record of soil oscillation velocity for blasting number II—measuring point 3 is shown in
Figure 5.
4.2.3. Calculation of Soil Oscillation Law Parameters in the Kovilovača Open Pit
Values of distances from blast sites to monitoring points
r, the amount of explosive
Q, calculated values of reduced distances
R, recorded values of soil oscillation velocities by components
vt, v
v, and
vl, and the resulting oscillation velocities
vrez for blasting from I to II of a total of ten measuring points MM are given in
Table 4.
On the basis of data given in
Table 4, the soil oscillation law is calculated by Equation (1)—by the models 1, 2, and 3. The calculation of the curve was carried out for values of reduced distances from
R = 21.8117 to
R = 75.2014. Thus, the curve parameters were calculated enabling us to determine the equation of soil oscillation in the form of:
Graphic survey of soil oscillation law is shown in
Figure 6.
Model 3
By using experimental data given in
Table 4, where:
and where:
Calculating according to Equation (22), then for
n = 1.5, according to Equation (25) we obtain the equation of soil oscillation velocity law in the following form:
On the basis of the obtained equations of soil oscillation Equations (31)–(33), it is possible to calculate values of soil oscillation velocities for corresponding reduced distances for models 1, 2, and 3.
The survey of reduced distances
R, recorded oscillation velocities
vr, calculated oscillation velocities
vi1,
vi2, and
vi3, as well as the difference between recorded and calculated soil oscillation velocities for models 1, 2, and 3 is presented in
Table 5.
Based on the data in
Table 5, a statistical analysis was carried out and the following values were obtained:
For model 1
The curved line dependency index
ρ1 between the reduced distance
R and soil oscillation velocity
v is:
The maximum difference between the recorded and calculated oscillation velocities of the soil
(εmax) = max|εi|, amounts:
εmax1 = 0.1458, S1 = 0.0552, 3S1 = 0.1656.
εmax1< 3S1, the (the supposed functional relationship is accepted as a good one).
For model 2:
ρ2 = 0.9852 (there is a strong correlation between R and v, given in Equation (32)).
εmax2 = 0.1541, S2 = 0.0535, 3S2 = 0.1606.
εmax2 < 3S2 (the supposed functional relationship is accepted as a good one).
For model 3:
ρ3 = 0.8768 (there is a strong correlation between R and v, given in Equation (33)).
εmax3 = 0.2300, S3 = 0.1503, 3S3 = 0.4509.
εmax3 < 3S3 (the supposed functional relationship is accepted as a good one).
5. Conclusions
To establish the relationship between the oscillation velocity of the rock mass and basic parameters affecting its magnitude, being the amount of explosive, the distance from the blast site, characteristics of the rock mass and the type of blasting, is the equation of M. A. Sadovskii that is used most commonly.
In the paper, the law of Sadovskii is also derived in another way by using the quotient of the relationship between the relative increase in oscillation velocities of the rock mass and the relative increase of reduced distances. It turned out that this quotient has approximately the similar value for any values whatsoever of reduced distance and corresponding velocity of rock mass oscillation. Thereby, in a marginal case, a differential equation, whose general integral overlaps with the law of Sadovskii, is obtained. In this case, for the parameter K as the integration constant, we may take values determined by the starting conditions, and that has been done in model 2.
The relation between parameters K and n has been obtained in this study. This relation made it possible to find the value of the second parameter for the given determined value of one parameter. In practice it is simpler to determine the value of the parameter K in advance for an adopted value of the parameter n in the interval from 1–3, as has been applied in model 3.
Thus, parameters n and K in Sadovskii’s law have been determined by three modes—models in the specific work environment. Their corresponding functions have been obtained presenting oscillation velocities of the rock mass depending on a reduced distance. The calculated corresponding indexes of the curved line correlation point out that there is a rather strong curved line relationship between a reduced distance and the oscillation velocity of the rock mass expressed in the obtained functions.
Comparing values of the recorded oscillation velocities of the rock mass with the corresponding calculated ones, it can be seen that they are approximately the same. On the basis of the obtained values of the curved line dependency, we can conclude that all three models can be successfully used for calculating the oscillation velocity of the rock mass.
Acknowledgments
This paper resulted from the Project No. 33025 and 33029 financed by the Ministry of Education of the Republic of Serbia realized by the University of Belgrade, Faculty of Mining and Geology.
Author Contributions
Suzana Lutovac and Branko Gluščević performed the modelling, optimization and analysis of results. The paper was written by Suzana Lutovac with the support of Rade Tokalić and revised by Čedomir Beljić. Field measurement was performed by Dragan Medenica and Suzana Lutovac.
Conflicts of Interest
The authors declare no conflict of interest.
References
- Savić, M. Blasting at of the Open Pits; Monograph, RTB Bor; Cooper Institute Bor, Indok Center: Bor, Serbia, 2000; pp. 317–319. [Google Scholar]
- Trajković, S.; Slimak, Š.; Lutovac, S. Technique of Blasting and Shock Waves; Faculty of Mining and Geology: Belgrade, Serbia, 2005; p. 199. [Google Scholar]
- Medvedev, S.V. Seismic of Mountainous Explosions; Nedra Publisher: Moscow, Russia, 1964; pp. 42–43. [Google Scholar]
- Lutovac, S.; Gligorić, Z.; Beljić, Č.; Ravilić, M. Derivation the soil oscillation law and determination of its parameters. Min. Metall. Eng. Bor 2014, 3, 41–51. [Google Scholar] [CrossRef]
- Simeunović, D. Mathematics; Faculty of Mining and Geology, Mining Department: Belgrade, Serbia, 1985; pp. 101–103. [Google Scholar]
- Lutovac, S.; Trajković, S.; Katona, O.; Savić, L.J.; Leković, B. Parameter determination of soil oscillation in limestone. Tech. Technol. Educ. Manag. (DRUNPP Sarajevo) 2013, 7, 376–383. [Google Scholar]
- Lutovac, S. Model for Determining the Parameters of the Law of Oscillation of the Rock Mass in Blasting. Ph.D. Thesis, Faculty of Mining and Geology, University of Belgrade, Belgrade, Serbia, 2010; pp. 37–38, 48–55. [Google Scholar]
- Kudryavtsev, V.A.; Demidovich, B.P. A Brief Course of Higher Mathematics, 2nd ed.; Mir Publishers: Moscow, Russia, 1984; pp. 293–295. [Google Scholar]
- Petrović, Ž. Business Statistics, Megatrend; University of Applied Sciences: Belgrade, Serbia; Faculty for Management: Zaječar, Serbia, 2004; p. 182. [Google Scholar]
- Vukadinović, S. Elementsof Probability and Mathematical Statistics; Technique for Copying Bureau of Construction: Belgrade, Serbia, 1970; pp. 329–331. [Google Scholar]
- Trajković, S.; Tokalić, R.; Lutovac, S. Study of Seismic Impacts on Adjacent Building due to Blasting Operations at Kovilovača Open Pit; Faculty of Mining and Geology: Belgrade, Serbia, 2004; pp. 2–43. [Google Scholar]
© 2016 by the authors; licensee MDPI, Basel, Switzerland. This article is an open access article distributed under the terms and conditions of the Creative Commons Attribution (CC-BY) license (http://creativecommons.org/licenses/by/4.0/).


