
A Flow Rate Control Approach on Off-Design Analysis of an Organic Rankine Cycle System

Department of Mechanical Engineering, Ming Chi University of Technology, New Taipei City 24301, Taiwan
Energies 2016, 9(9), 759; https://doi.org/10.3390/en9090759
Submission received: 12 August 2016
/
Revised: 6 September 2016
/
Accepted: 18 September 2016
/
Published: 20 September 2016
(This article belongs to the Special Issue Waste Heat Recovery)
Abstract
:This study explored effects of off-design heat source temperature (TW,in) or flow rate (mW) on heat transfer characteristics and performance of an organic Rankine cycle system by controlling the flow rate of working fluid R245fa (i.e., the operation flow rate of R245fa was controlled to ensure that R245fa reached saturation liquid and vapor states at the outlets of the preheater and evaporator, respectively). The results showed that the operation flow rate of R245fa increased with TW,in or mW; higher TW,in or mW yielded better heat transfer performance of the designed preheater and required higher heat capacity of the evaporator; heat transfer characteristics of preheater and evaporator differed for off-design TW,in and mW; and net power output increased with TW,in or mW. The results further indicated that the control strategy should be different for various off-design conditions. Regarding maximum net power output, the flow rate control approach is optimal when TW,in or mW exceeds the design point, but the pressure control approach is better when TW,in or mW is lower than the design point.
1. Introduction
An organic Rankine cycle (ORC) is identical to a steam Rankine cycle, except it employs organic fluids with low boiling point as working fluids to generate power from low-temperature heat sources [1]. An ORC is one of the most economical and efficient methods for converting low-grade thermal energy, such as waste heat recovery or geothermal, solar thermal, biomass, and ocean thermal energy, into electricity. However, commercial ORC units were typically designed for nominal operating points or heat source temperature; consequently, the system performances of these ORC units suffered under off-design conditions [1,2]. Manente et al. [3] proposed an off-design model of an ORC system for identifying optimal control strategies. They reported that the optimal maximum pressure of the ORC system approaches critical levels during both subcritical and supercritical cycles, but the optimal operation strategies for these cycles significantly differ.
Bamgbopa and Uzgoren [4] proposed a transient modeling approach for an ORC system operating under various heat input conditions. They investigated the transient mode of ORC system operation and reported that heat exchangers (i.e., evaporator and condenser) are key system components because ORC systems are based on heat-to-power conversion processes. Hu et al. [5] used different control strategies to examine the ORC system performance under different temperature and mass flow rate of the geothermal fluid. The heat transfer rate of the evaporator and the efficiency of the turbine were reported under off-design conditions. However, the heat transfer coefficients of the heat exchangers were not examined. Their analytical results showed that, for the lower flow rate of the heat source fluid, the constant pressure operation with variable inlet guide vanes yielded higher net power output than the sliding pressure operation. In addition, the potential increase in the net power output for the constant and sliding pressure operations were 4.7% and 10%, respectively, at the given temperature and variable flow rate of the heat source fluid.
Fu et al. [6,7] adopted the pressure control approach, which entails using a new preheater (and evaporator) operating pressure to meet vital requirements at off-design heat source temperatures (TW,in) and flow rates (mW), to study off-design operations. They determined that a higher TW,in or mW resulted in higher preheater performance and lower requirement for the evaporator’s heat capacity. In addition, increasing TW,in or mW considerably improved the system power output and thermal efficiency. On the basis of previous studies [6,7], this work uses a different control approach under off-design conditions to analytically examine the effect of off-design heat source temperature or flow rate on the heat transfer characteristics (particularly in the preheater and evaporator) and system performance of a 250-kW ORC system by using the flow rate control approach.
2. System Description and Methodology
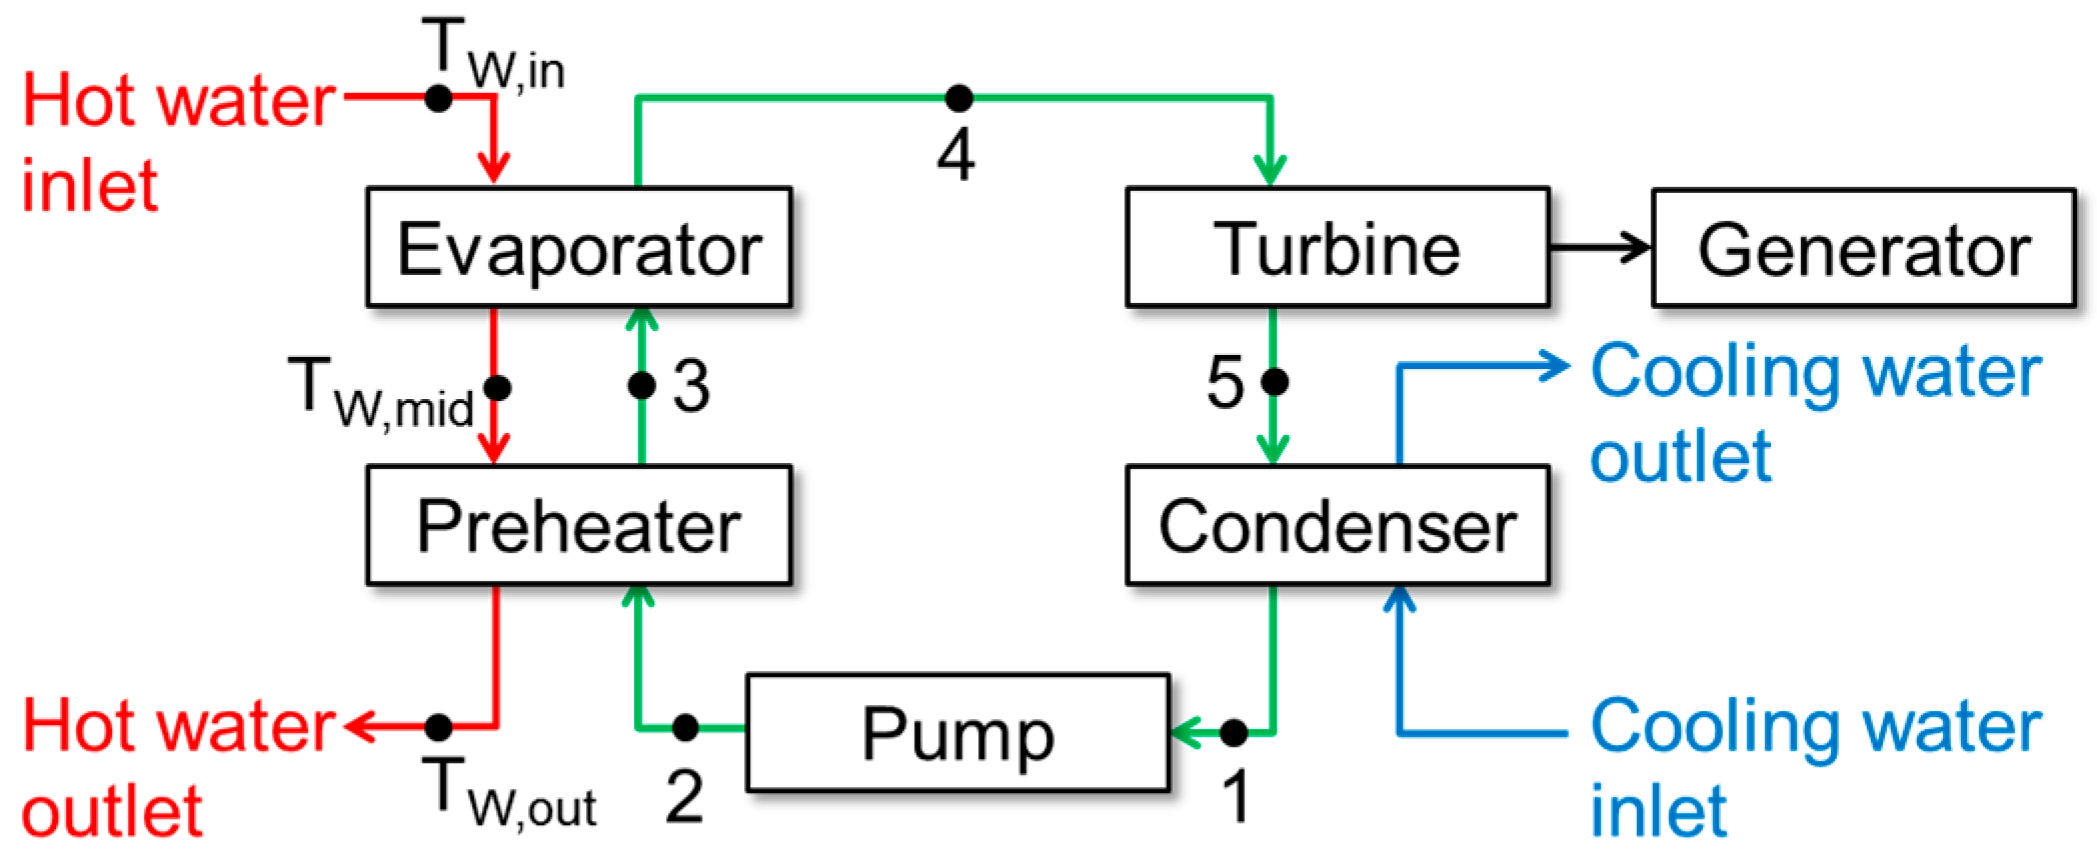
Figure 1 depicts the studied ORC system, indicating that it comprises pump, preheater, evaporator, turbine, generator, condenser, hot water (serviced as a heat source), and cooling water circulation systems. The working fluid was refrigerant R245fa, one of the most suitable fluids for ORC applications [8]. R245fa flows on the shell side of the heat exchangers, while hot and cooling water flows on the tube side. The detailed design and construction of this 250-kW ORC system was described in our previous study [9]. Under design conditions, the net power output is 243 kW, and system thermal efficiency is 9.5%. The system thermal efficiency was kept constant by maintaining the operating pressures of the preheater/evaporator and condenser constant. In the present analysis, the TW,in and mW values ranged from 123.6 °C to 153.7 °C and from 9.39 to 27.39 kg/s, respectively.
Mathematical models for each component and system performance as well as the assumptions for the analysis have been described in previous studies [6,7]. For the present study, the operating flow rate of R245fa was controlled to ensure reaching saturation liquid and vapor states of R245fa at the outlets of the preheater and evaporator, respectively, under off-design heat source conditions. The heat transfer function of the designed preheater was calculated using the classical effectiveness–NTU method [10]. The Bell-Delaware method [11] and Gnielinski correlation [12] were employed to calculate the heat transfer coefficients of the shell and tube sides, respectively, of the shell-and-tube preheater. In addition, for the flooded and shell-and-tube type evaporators, the heat transfer coefficient of the tube side was also calculated using the Gnielinski correlation and that of the shell side was estimated using the classical Gorenflo correlation [13]. The detailed equations for the evaluation of the evaporator performance are as follows:
where hR is the shell-side heat transfer coefficient; hW is the tube-side heat transfer coefficient; href = 3641 for R245fa, suggested by Chen [14]; qref” = 20,000 W/m2; Pr is the reduced pressure; Ra is the surface roughness (Ra = 0.4 µm for the unknown surface); Ra0 = 0.4 µm; Qeva is the evaporator heat transfer rate; A is the total heat transfer area; U is the overall heat transfer coefficient; d0 is the outer diameter of the tube; di is the inner diameter of the tube; k is the thermal conductivity of the tube; and ΔTlm is the logarithmic mean temperature difference. In this study, the tube in the evaporator was designed by setting d0 = 1.765 cm and di = 1.639 cm.
The present ORC system employed the water-cooling-type condenser, of which the need of the cooling water can be easily provided by the factories. In practice, the present system was designed for the application of the waste heat recovery from the process-condensed water (i.e., high-temperature water) in a chemical process plant. In the present analysis, we assume the cooling capacity of the cooling source system can always meet the requirement of the ORC system by changing the flow rate of the cooling system; therefore, the characteristics of the condenser is not a critical issue.
3. Results and Discussion
3.1. Operating Flow Rate and Temperature Distribution
Figure 2 shows the analytical results of the present system as functions of TW,in and mW. Figure 2 demonstrates that the operation flow rate of R245fa (mR) increased from 8.69 to 16.82 kg/s (or from 7.86 to 17.28 kg/s) as TW,in (or mW) increased from 123.6 to 153.7 °C (or from 9.39 to 27.39 kg/s). As the temperature or the flow rate of the heat source fluid increased, one might expect the large amount of the thermal energy available, resulting in the increase of mR. In addition, the increase rate of mR maintained a constant value with increasing TW,in, but a gradual decrease with increasing mW, as depicted in Figure 2. The temperatures of the heat source, i.e., hot water, at different locations are also presented in Figure 2. The midpoint temperature (TW,mid) of the heat source increased linearly from 105.7 to 119.5 °C (or from 107.5 to 114.0 °C) as TW,in (or mW) increased. The increase rate of TW,mid for increasing TW,in was larger than that of increasing mW.
Figure 2a further demonstrates that the outlet temperature (TW,out) of the heat source increased slightly from 93.8 to 96.7 °C for the examined range of TW,in, indicating that the thermal energy of the heat source effectively transferred to the working fluid, while TW,in increased by 30.1 °C. However, TW,out increased from 90.0 to 100.8 °C for the examined range of mW, as shown in Figure 2b. In previous studies [6,7], TW,out increased rapidly from 85.1 to 112.3 °C (or from 72.9 to 110.9 °C) for the same range of TW,in (or mW) but under the pressure control approach, indicating that temperature distributions differed under different control strategies and off-design conditions. These results also indicate that increasing trends of TW,mid and TW,out for off-design temperature and flow rate significantly differed in the present study. Moreover, for waste heat recovery application, the heat source outlet temperature is generally limited to a certain value for environmental protection. Thus, the present results of off-design temperature were more appropriate than those for off-design flow rate.
3.2. Pinch Point and Logarithmic Mean Temperature Differences
The pinch point temperature differences (ΔTpin), i.e., minimum temperature difference between hot and cold streams of the heat exchanger system, as functions of TW,in and mW, are presented in Figure 3. In the present ORC system, the pinch point was located at the middle point between the preheater and evaporator, i.e., ΔTpin = TR,3 − TW,mid. Figure 3 demonstrates that for the studied range of TW,in (or mW), ΔTpin increased linearly from 5.7 to 19.5 °C (or from 7.5 to 14.0 °C). Wang et al. [15] suggested an optimal ΔTpin in the evaporator of <15 °C when the heat source temperature ranged from 100 to 220 °C in an ORC system. Moreover, Wang et al. [16] indicated that the suitable range of ΔTpin was 6–20 °C for engineering applications. Based on these arguments, ΔTpin values of the current heat exchanger system, except for the cases where TW,in > 147.1 °C, were appropriate for the performance of the ORC system. Additionally, to effectively lower ΔTpin values for the cases of TW,in > 147.1 °C, evaporation temperature is increased, as suggested by Li et al. [17]. This result demonstrated that, in a subcritical ORC system with the pinch point located between preheater and evaporator, the optimal evaporation temperature with maximum net power output is approximately 120 °C when the heat source temperature is approximately 150 °C.
The logarithmic mean temperature differences (ΔTlm) of the preheater and evaporator are also presented in Figure 3. It is clear that ΔTlm,pre was greater than ΔTlm,eva for both off-design cases. This is because the boiling phenomenon was processed with the constant temperature at a given pressure. In addition, ΔTlm,eva increased more rapidly than ΔTlm,pre with increasing TW,in (as shown in Figure 3a), which resulted in smaller differences in ΔTlm,eva and ΔTlm,pre as TW,in increased. On the contrary, ΔTlm,eva increased more slowly than ΔTlm,pre with increasing mW (as shown in Figure 3a), which resulted in greater differences in ΔTlm,eva and ΔTlm,pre as mW increased. These results demonstrated that, in the present ORC system, ΔTlm of the preheater and evaporator significantly differed for off-design TW,in and mW.
3.3. Heat Transfer Characteristics
Figure 4 shows the heat transfer rates of the preheater (Qpre) and evaporator (Qeva) as functions of TW,in and mW. It is clear that, as TW,in (or mW) increased, Qpre and Qeva increased linearly from 762 to 1475 kW (or from 687 to 1515 kW) and from 1169 to 2262 kW (or from 1053 to 2324 kW), respectively, resulting in increased Qtot. Unlike the characteristics of TW,mid, TW,out, or ΔTlm, the heat transfer rates showed similar trends for off-design TW,in and mW. These results also demonstrated that higher TW,in or mW resulted in better heat transfer performance of the designed preheater as well as higher requirements for the evaporator’s heat capacity. The present results of the requirement for the evaporator’s heat capacity were entirely contrary to previous studies [6,7], which reported that higher TW,in or mW resulted in smaller requirements for the evaporator’s heat capacity. This is primarily due to the different control approaches used in the present and previous studies as the system operated under off-design heat source conditions.
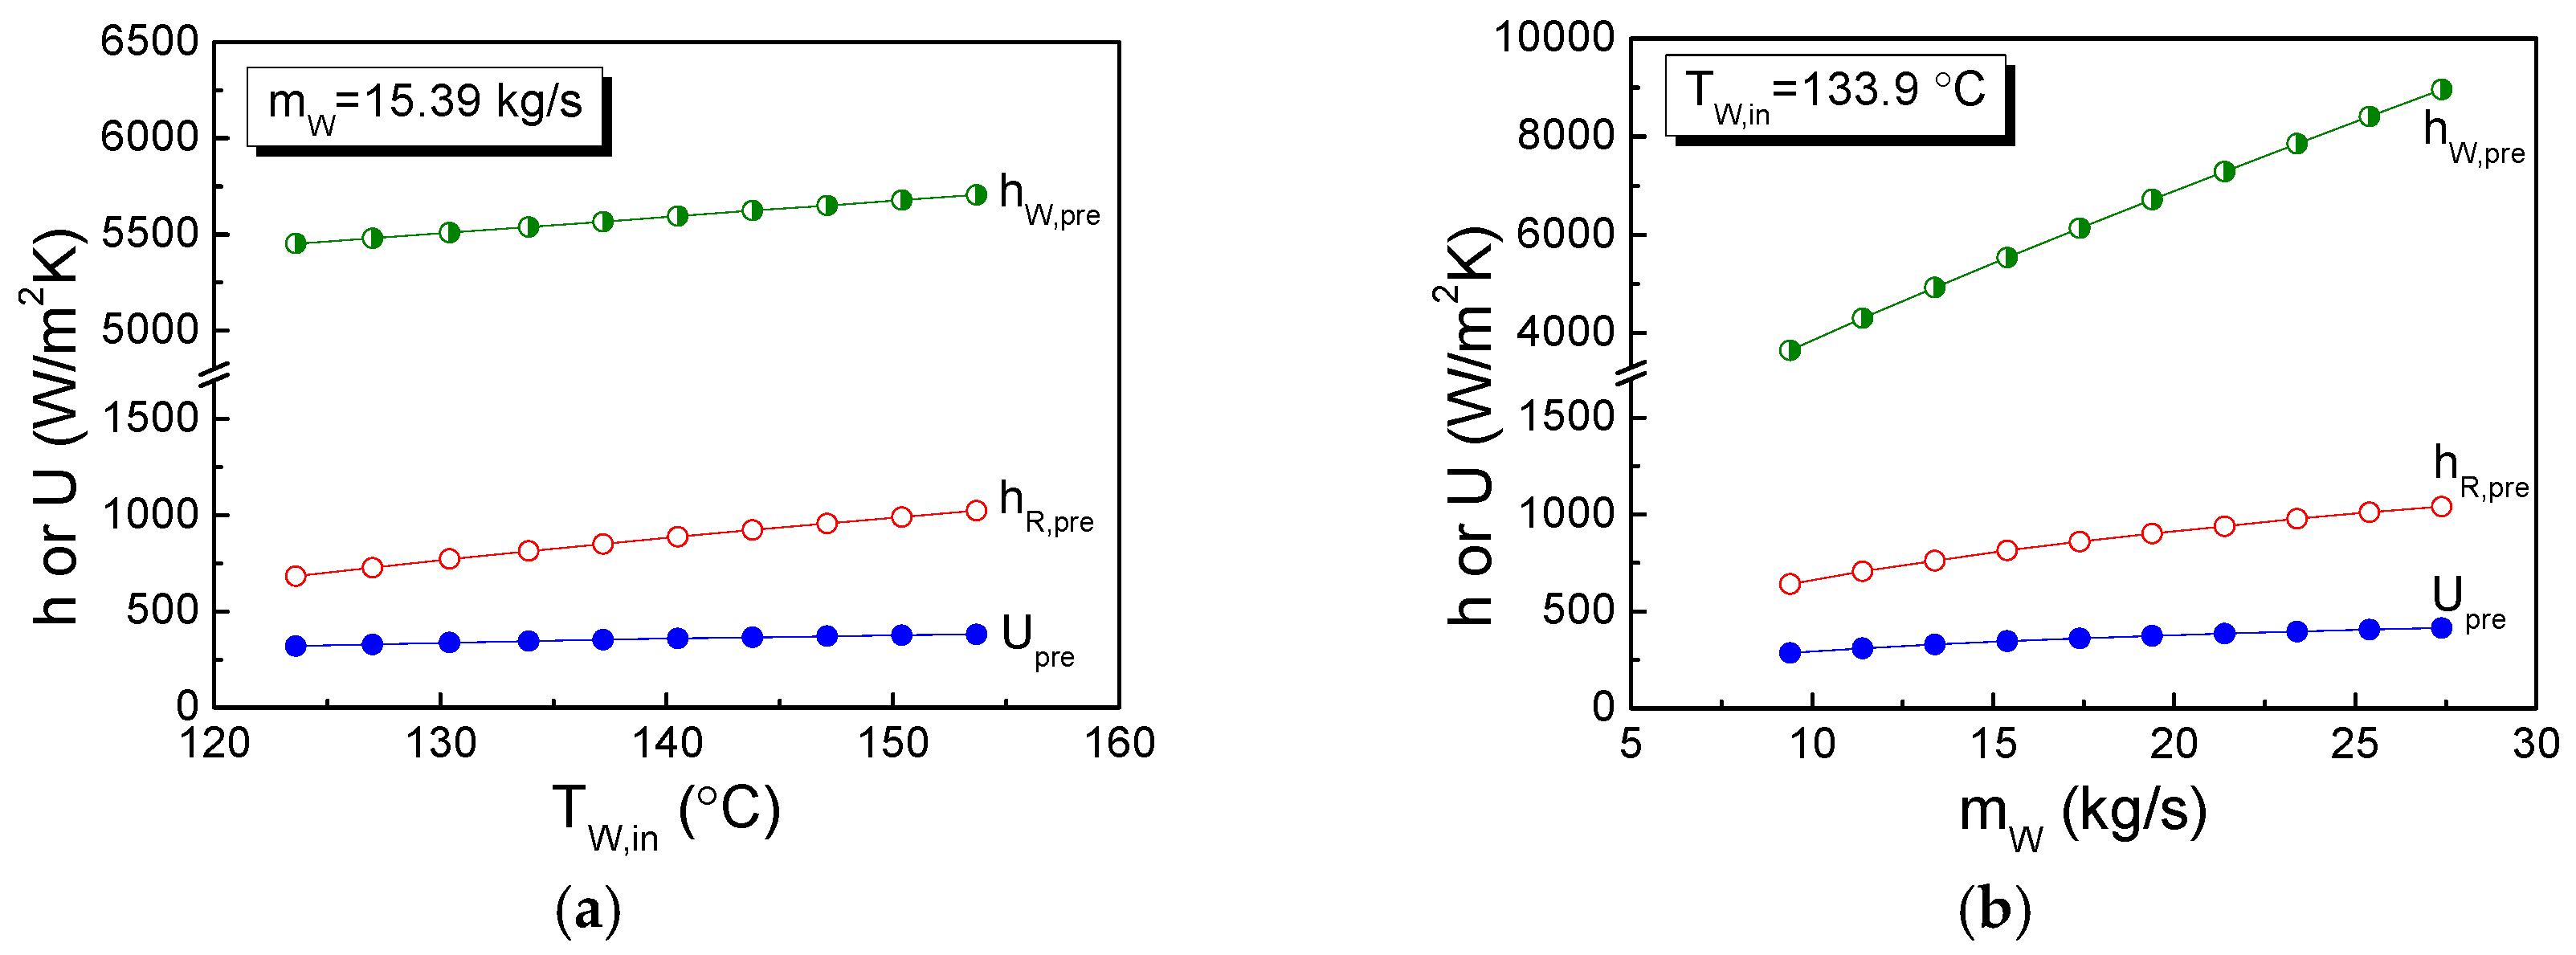
Figure 5 shows the preheater heat transfer coefficients as functions of TW,in and mW. This figure demonstrates that the tube-side heat transfer coefficient (hW,pre) increased slowly from 5453 to 5706 W/m2·K for the studied range of TW,in, but increased rapidly from 3651 to 8961 W/m2·K for the studied range of mW, indicating that, as expected, increased tube-side flow rate significantly enhances the tube-side heat transfer coefficient. On the contrary, the shell-side and overall heat transfer coefficients (hR,pre and Upre) similarly increased for the studied range of TW,in and mW. This figure also demonstrates that the increase in Upre was relatively small. The increase in Qpre, as shown in Figure 4, primarily results from the increase in ΔTlm,pre, as shown in Figure 3. In addition, one might expect the increase in the pressure drop as the flow rate of the working fluid increases. The experimental results of the present ORC system [9,18] had demonstrated that the pressure drop within the preheater was less than 40 kPa, which is relative small compared to the designed operating pressure (1265 kPa), whereas the pressure drops in the flooded-type evaporator and condenser were negligibly small (<10 kPa). In the present analysis, the maximum increase in the flow rate of the working fluid is about 45% (compared to the design point); therefore, we might expect that the pressure drop would be less than 100 kPa, which is mainly from the preheater (i.e., single-phase flow). As a result, the pressure drop might not be a critical issue of the present ORC system, and the operating pressures of the preheater/evaporator and condenser were kept constant, as mentioned earlier. Indeed, the pressure drops through the heat exchangers and pipelines were generally ignored in the related ORC studies, such as in Hu et al. [5,19].
The evaporator heat transfer coefficients as functions of TW,in and mW are presented in Figure 6. Similar to the preheater, the tube-side heat transfer coefficient of the evaporator (hW,eva) for the studied range of mW increased more rapidly than that for the range of TW,in. Additionally, this figure demonstrates that the shell-side heat transfer coefficients of the evaporator (hR,eva) were higher than those of the tube side, rapidly and similarly increasing for both off-design conditions. Consequently, the overall heat transfer coefficient of the evaporator (Ueva) increased from 6107 to 7176 W/m2·K (or from 4469 to 10,389 W/m2·K) for the range of TW,in (or mW). Furthermore, the heat transfer area requirement of the evaporator (Aeva) decreased for both studied off-design cases, as shown in Figure 6, although the requirement for the evaporator’s heat capacity (Qeva) increased, as shown in Figure 4. These results indicate that the increase in Qeva is attributable to increases in both Ueva and ΔTlm,eva.
3.4. Net Power Output
As shown in Figure 7, the present results further demonstrate that the net power output (Wnet) increased linearly from 183 to 353 kW (or from 164 to 363 kW) as TW,in (or mW) increased. The results also illustrate that, for both off-design cases, the pump power requirement (Win) constituted only 4.1% of the designated back work ratio of the generator’s power output (Wout). Regarding off-design operation, the flow rate control of R245fa within heat source temperature (flow rate) variations from design temperature (flow rate) of −10.3 to +19.8 °C (−6 to +12 kg/s; i.e., −39.0% to +78.0%) results in variations of −24.7% to +45.3% (−32.5% to +49.4%) in net power output.
Additionally, for further comparison, Figure 7 presents results of previous studies that used the pressure control approach for off-design conditions. It is clear that Wnet was generally higher than that of previous studies when TW,in or mW exceeded the design point. On the contrary, Wnet was generally lower than that of previous studies when TW,in or mW was smaller than the design point. These results indicate that the control strategy should be significantly different for various off-design conditions. To obtain maximum net power output, the flow rate control approach is optimal when TW,in or mW exceeds the design point, but the pressure control approach is better when TW,in or mW is lower than the design point. In addition, it should be mentioned that the present study is a theoretical analysis and a wide variation of the power output can therefore be obtained. However, in practice, such wide variations might not be possible because the hardware cannot function well at those extreme off-design conditions. The experimental results of the present turbine ORC system using the pressure control approach demonstrated that the power output ranged from about 113 to 242.5 kW [9,18]. To conclude, the present study focuses on the heat transfer characteristics in the preheater and evaporator as well as on the power output of the system under off-design conditions. The behaviors of other components in the system, such as the turbine expander and pump, are available in Hu et al. [5,19] and Li et al. [20], respectively.
4. Conclusions
This work investigated the effects of TW,in or mW on the heat transfer characteristics, particularly in the preheater and evaporator, and system performance of a 250-kW-level ORC system. The design operating pressures in the preheater/evaporator and condenser were 1.265 MPa (i.e., evaporation temperature of 100 °C) and 0.242 MPa (i.e., condensation temperature of 39 °C), respectively. The design points of TW,in and mW were 133.9 °C and 15.39 kg/s, respectively. The net power output was 243 kW and system thermal efficiency was 9.5% under design conditions. For off-design heat source temperature or flow rate, the operation flow rate of R245fa was controlled to ensure that R245fa reached saturation liquid and vapor states at the outlets of the preheater and evaporator, respectively. The primary findings of this study are detailed as follows.
- (1)
- The operation flow rate of R245fa increased with increasing TW,in or mW. Differences in pinch point temperatures of the heat exchanger system, except for cases of higher TW,in, were appropriate regarding the ORC system performance.
- (2)
- A higher TW,in or mW yielded better heat transfer performance of the designed preheater, primarily resulting from the increase in ΔTlm,pre, and required the evaporator’s heat capacity to be higher, which is attributable to increases in both Ueva and ΔTlm,eva.
- (3)
- Heat transfer characteristics of the preheater and evaporator, such as logarithmic mean temperature differences and shell- and tube-side heat transfer coefficients, showed different trends for off-design TW,in and mW.
- (4)
- Net power output increased linearly with increasing TW,in or mW. The flow rate control of R245fa within heat source temperature (flow rate) variations of −10.3 to +19.8 °C (−6 to +12 kg/s) from design temperature (flow rate) resulted in variations of −24.7% to +45.3% (−32.5% to +49.4%) in the net power output.
- (5)
- Regarding maximum net power output, the flow rate control approach is the optimal strategy when TW,in or mW exceeds the design point, but the pressure control approach is better when TW,in or mW is lower than the design point.
Acknowledgments
This work was supported by the Ministry of Science and Technology, Taiwan (grant number: MOST 105-2218-E-131-002-MY3).
Conflicts of Interest
The author declares no conflict of interest.
References
- Quoilin, S.; Broek, M.V.D.; Declaye, S.; Dewallef, P.; Lemort, V. Techno-economic survey of Organic Rankine Cycle (ORC) systems. Renew. Sustain. Energy Rev. 2013, 22, 168–186. [Google Scholar] [CrossRef]
- Peris, B.; Navarro-Esbrí, J.; Molés, F.; Mota-Babiloni, A. Experimental study of an ORC (organic Rankine cycle) for low grade waste heat recovery in a ceramic industry. Energy 2015, 85, 534–542. [Google Scholar] [CrossRef]
- Manente, G.; Toffolo, A.; Lazzaretto, A.; Paci, M. An Organic Rankine Cycle off-design model for the search of the optimal control strategy. Energy 2013, 58, 97–106. [Google Scholar] [CrossRef]
- Bamgbopa, M.O.; Uzgoren, E. Quasi-dynamic model for an organic Rankine cycle. Energy Convers. Manag. 2013, 72, 117–124. [Google Scholar] [CrossRef]
- Hu, D.; Zheng, Y.; Wu, Y.; Li, S.; Dai, Y. Off-design performance comparison of an organic Rankine cycle under different control strategies. Appl. Energy 2015, 156, 268–279. [Google Scholar] [CrossRef]
- Fu, B.R.; Hsu, S.W.; Lee, Y.R.; Hsieh, J.C.; Chang, C.M.; Liu, C.H. Effect of off-design heat source temperature on heat transfer characteristics and system performance of a 250-kW organic Rankine cycle system. Appl. Therm. Eng. 2014, 70, 7–12. [Google Scholar] [CrossRef]
- Fu, B.R.; Hsu, S.W.; Lee, Y.R.; Hsieh, J.C.; Chang, C.M.; Liu, C.H. Performance of a 250 kW organic Rankine cycle system for off-design heat source conditions. Energies 2014, 7, 3684–3694. [Google Scholar] [CrossRef]
- Wang, E.H.; Zhang, H.G.; Fan, B.Y.; Ouyang, M.G.; Zhao, Y.; Mu, Q.H. Study of working fluid selection of organic Rankine cycle (ORC) for engine waste heat recovery. Energy 2011, 36, 3406–3418. [Google Scholar] [CrossRef]
- Fu, B.R.; Lee, Y.R.; Hsieh, J.C. Design, construction, and preliminary results of a 250-kW organic Rankine cycle system. Appl. Therm. Eng. 2015, 80, 339–346. [Google Scholar] [CrossRef]
- Bejan, A. Free turbulent flows. In Convection Heat Transfer; Wiley: New York, NY, USA, 1993. [Google Scholar]
- Bell, K.J. Final Report of the Cooperative Research Program on Shell and Tube Heat Exchangers; Bulletin No. 5; University of Delaware Engineering Experiment Station: Newark, DE, USA, 1963. [Google Scholar]
- Gnielinski, V. New equation for heat and mass transfer in turbulent pipe and channel flow. Int. J. Chem. Eng. 1976, 16, 359–368. [Google Scholar]
- Gorenflo, G. Behalterseiden (Pool Boiling). In VDI-Wärmeatlas, 6th ed.; VDI-Verlag: Dusseldorf, Germany, 1991. [Google Scholar]
- Chen, T. Water-heated pool boiling of different refrigerants on the outside surface of a horizontal smooth tube. J. Heat Transf. 2011, 134, 021502:1–021502:8. [Google Scholar] [CrossRef]
- Wang, Z.Q.; Zhou, N.J.; Guo, J.; Wang, X.Y. Fluid selection and parametric optimization of organic Rankine cycle using low temperature waste heat. Energy 2012, 40, 107–115. [Google Scholar] [CrossRef]
- Wang, J.; Yan, Z.; Wang, M.; Maa, S.; Dai, Y. Thermodynamic analysis and optimization of an (Organic Rankine Cycle) ORC using low grade heat source. Energy 2013, 49, 356–365. [Google Scholar] [CrossRef]
- Li, J.; Pei, G.; Ji, J. Optimization of low temperature solar thermal electric generation with organic Rankine cycle in different areas. Appl. Energy 2010, 87, 3355–3365. [Google Scholar]
- Fu, B.R.; Lee, Y.R.; Hsieh, J.C. Experimental investigation of a 250-kW turbine organic Rankine cycle system for low-grade waste heat recovery. Int. J. Green Energy 2016. [Google Scholar] [CrossRef]
- Hu, D.; Li, S.; Zheng, Y.; Wang, J.; Dai, Y. Preliminary design and off-design performance analysis of an organic Rankine cycle for geothermal sources. Energy Convers. Manag. 2015, 96, 175–187. [Google Scholar] [CrossRef]
- Li, H.; Hu, D.; Wang, M.; Dai, Y. Off-design performance analysis of Kalina cycle for low temperature geothermal source. Appl. Therm. Eng. 2016, 107, 728–737. [Google Scholar] [CrossRef]
Figure 1.
Schematic of the studied organic Rankine cycle (ORC) system.

Figure 2.
Operating flow rate of R245fa and temperature distribution of the hot stream as functions of (a) TW,in and (b) mW.
Figure 2.
Operating flow rate of R245fa and temperature distribution of the hot stream as functions of (a) TW,in and (b) mW.

Figure 3.
Pinch point and logarithmic mean temperature differences of the preheater and evaporator as functions of (a) TW,in and (b) mW.
Figure 3.
Pinch point and logarithmic mean temperature differences of the preheater and evaporator as functions of (a) TW,in and (b) mW.

Figure 4.
Heat transfer rate as functions of (a) TW,in and (b) mW.

Figure 5.
Preheater heat transfer coefficient as functions of (a) TW,in and (b) mW.

Figure 6.
Evaporator heat transfer coefficient and heat transfer area as functions of (a) TW,in and (b) mW.
Figure 6.
Evaporator heat transfer coefficient and heat transfer area as functions of (a) TW,in and (b) mW.

Figure 7.
Net power output as functions of (a) TW,in and (b) mW.

© 2016 by the author; licensee MDPI, Basel, Switzerland. This article is an open access article distributed under the terms and conditions of the Creative Commons Attribution (CC-BY) license (http://creativecommons.org/licenses/by/4.0/).
Share and Cite
MDPI and ACS Style
Fu, B.-R. A Flow Rate Control Approach on Off-Design Analysis of an Organic Rankine Cycle System. Energies 2016, 9, 759. https://doi.org/10.3390/en9090759
AMA Style
Fu B-R. A Flow Rate Control Approach on Off-Design Analysis of an Organic Rankine Cycle System. Energies. 2016; 9(9):759. https://doi.org/10.3390/en9090759
Chicago/Turabian StyleFu, Ben-Ran. 2016. "A Flow Rate Control Approach on Off-Design Analysis of an Organic Rankine Cycle System" Energies 9, no. 9: 759. https://doi.org/10.3390/en9090759
Note that from the first issue of 2016, this journal uses article numbers instead of page numbers. See further details here.