
Tuneable Giant Magnetocaloric Effect in (Mn,Fe)2(P,Si) Materials by Co-B and Ni-B Co-Doping

Abstract
:1. Introduction
2. Results and Discussion
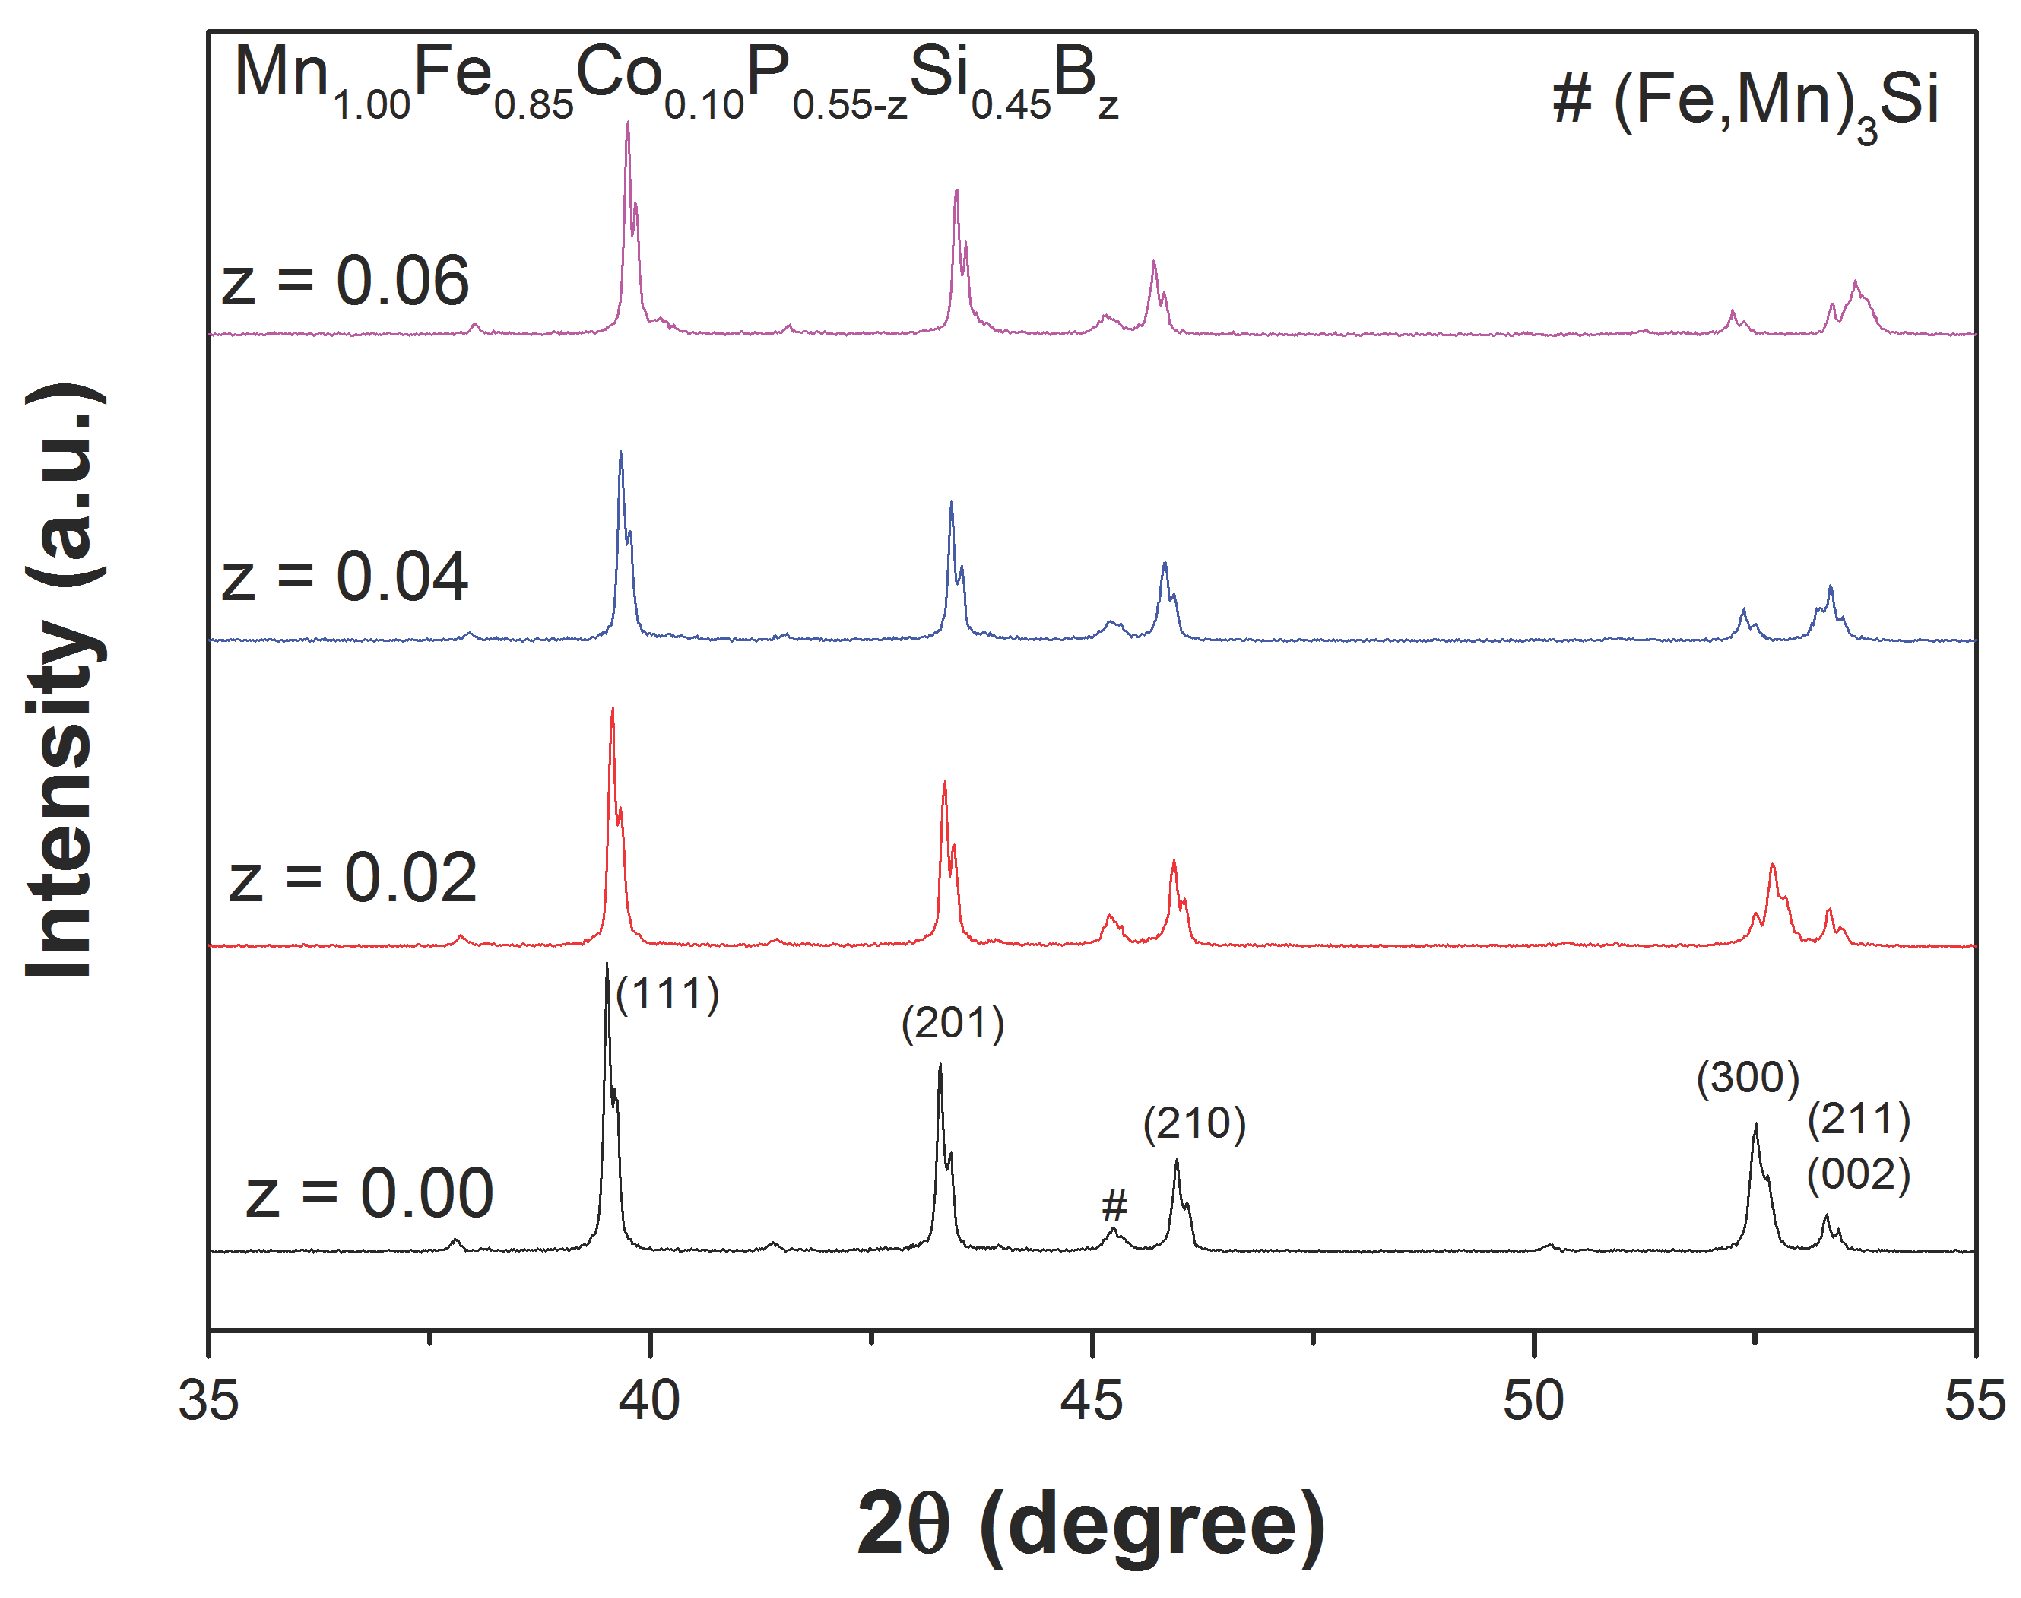
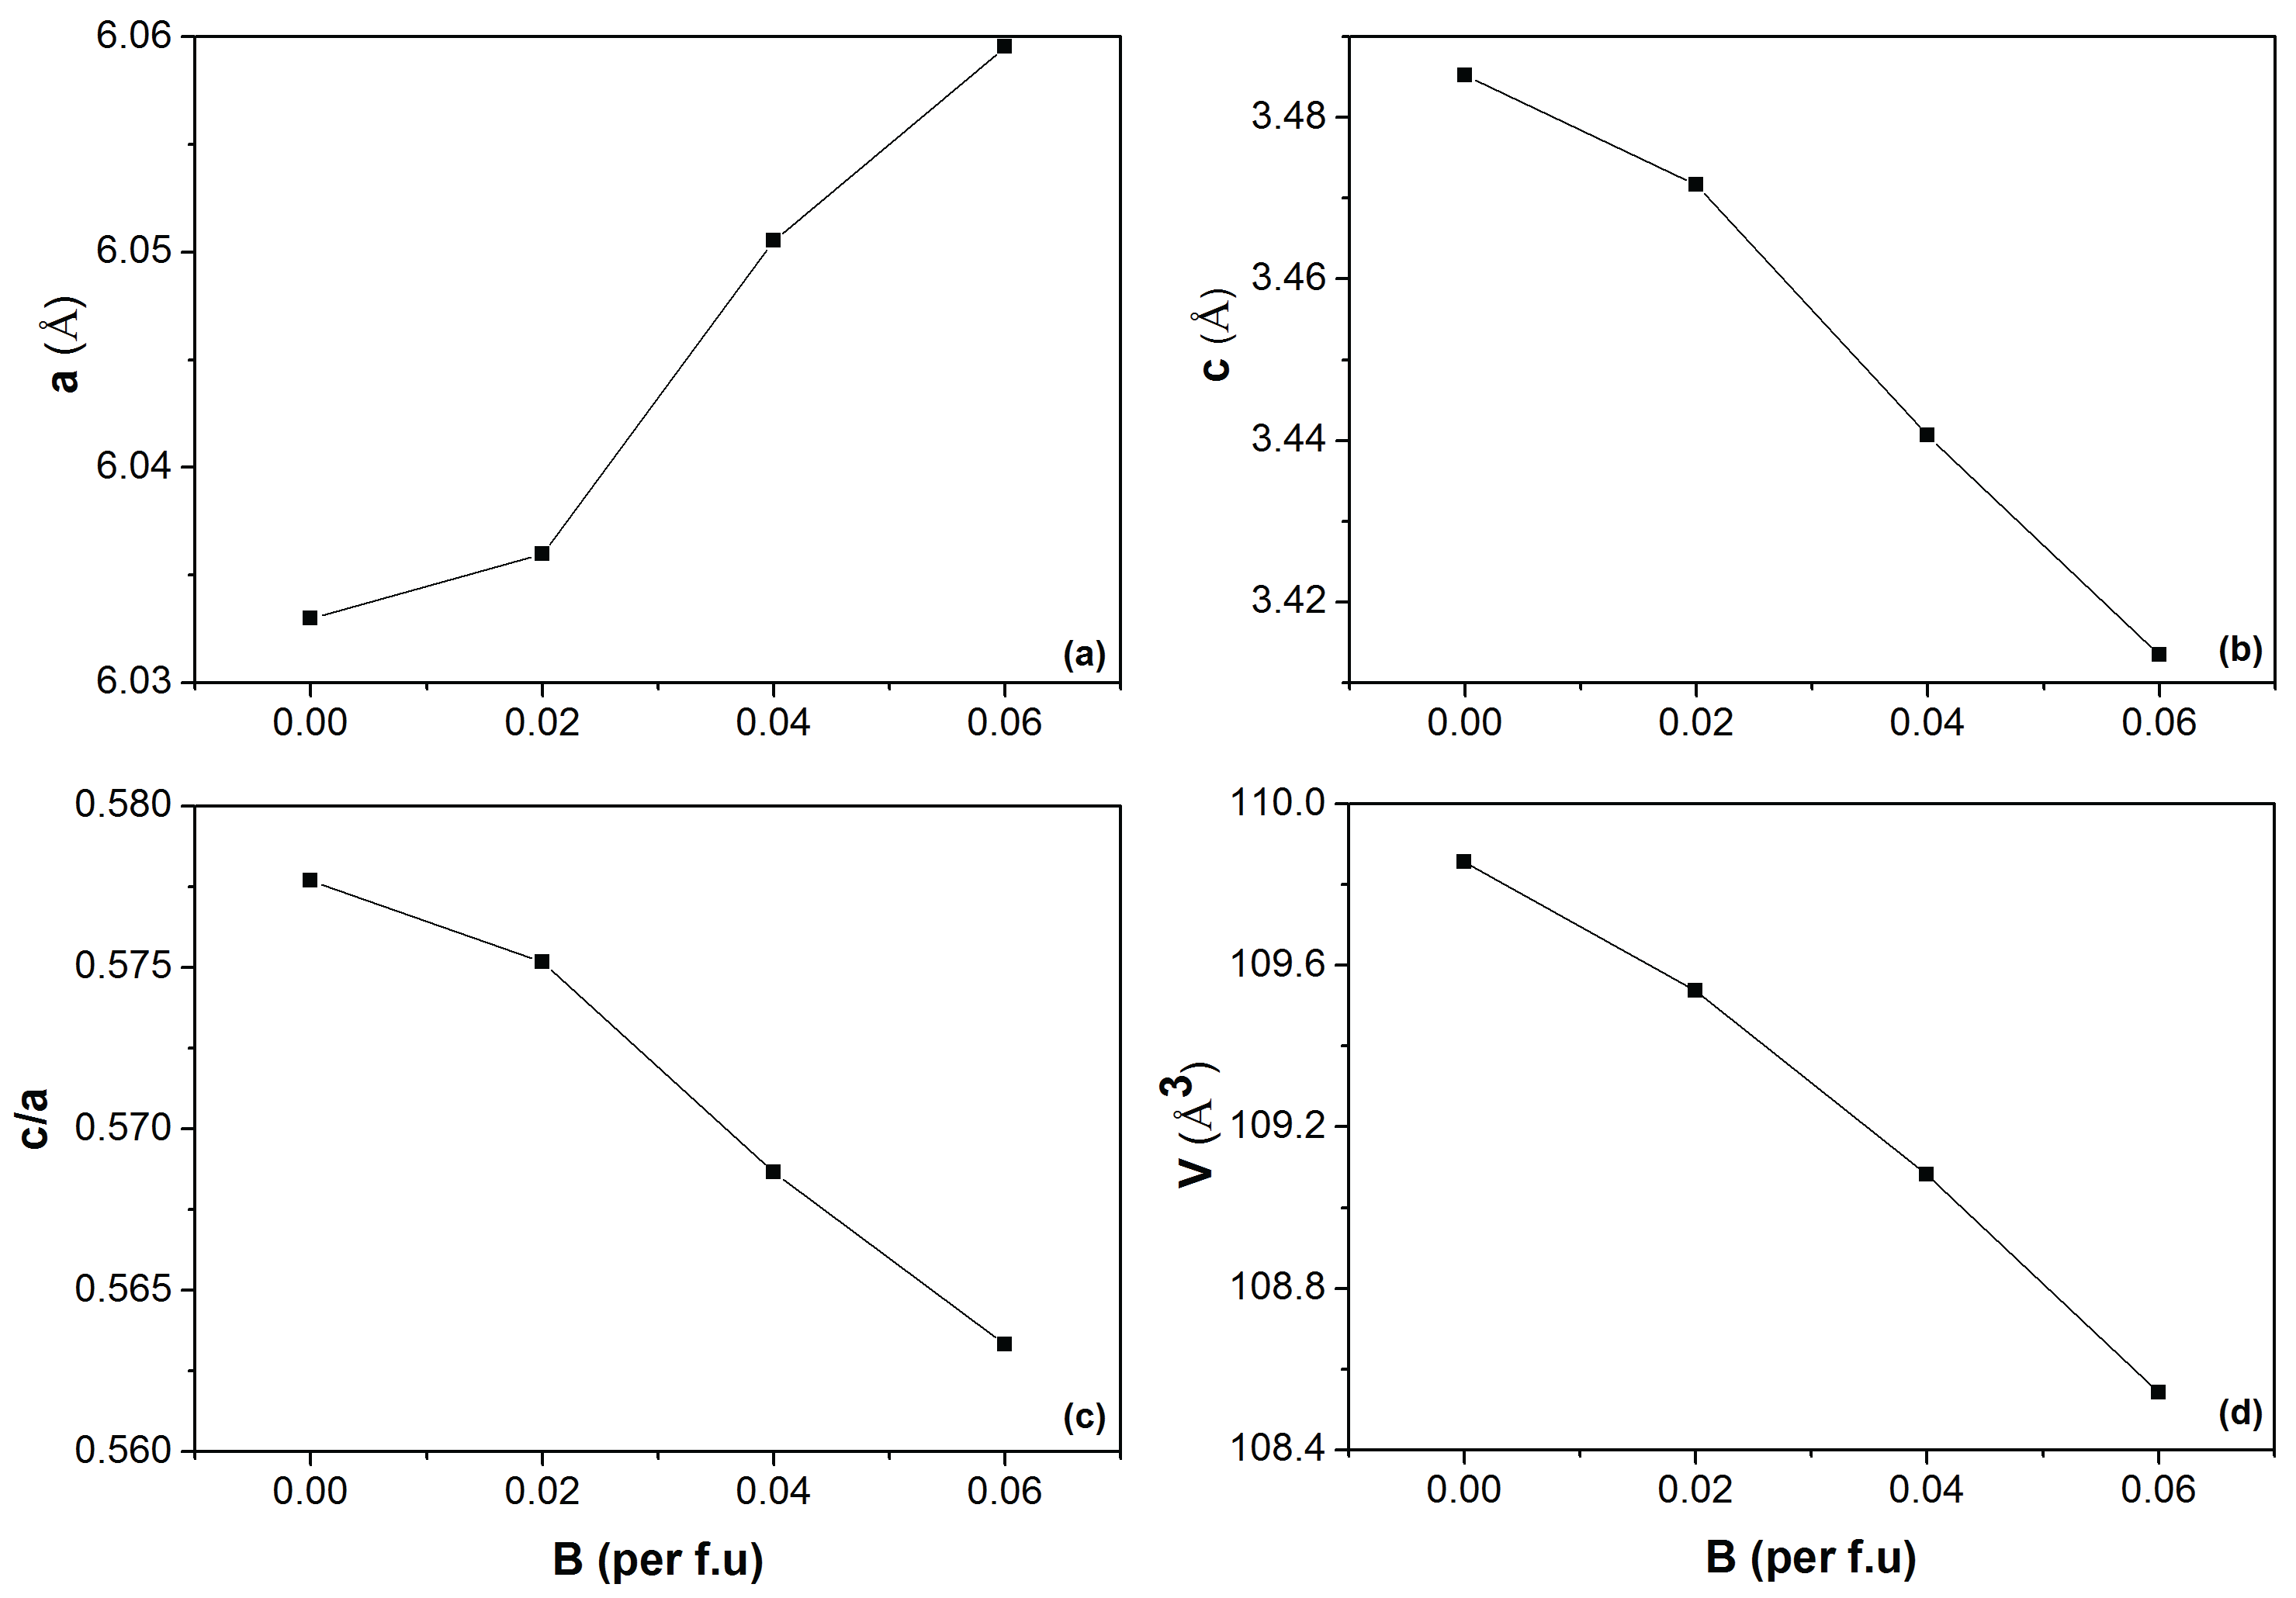
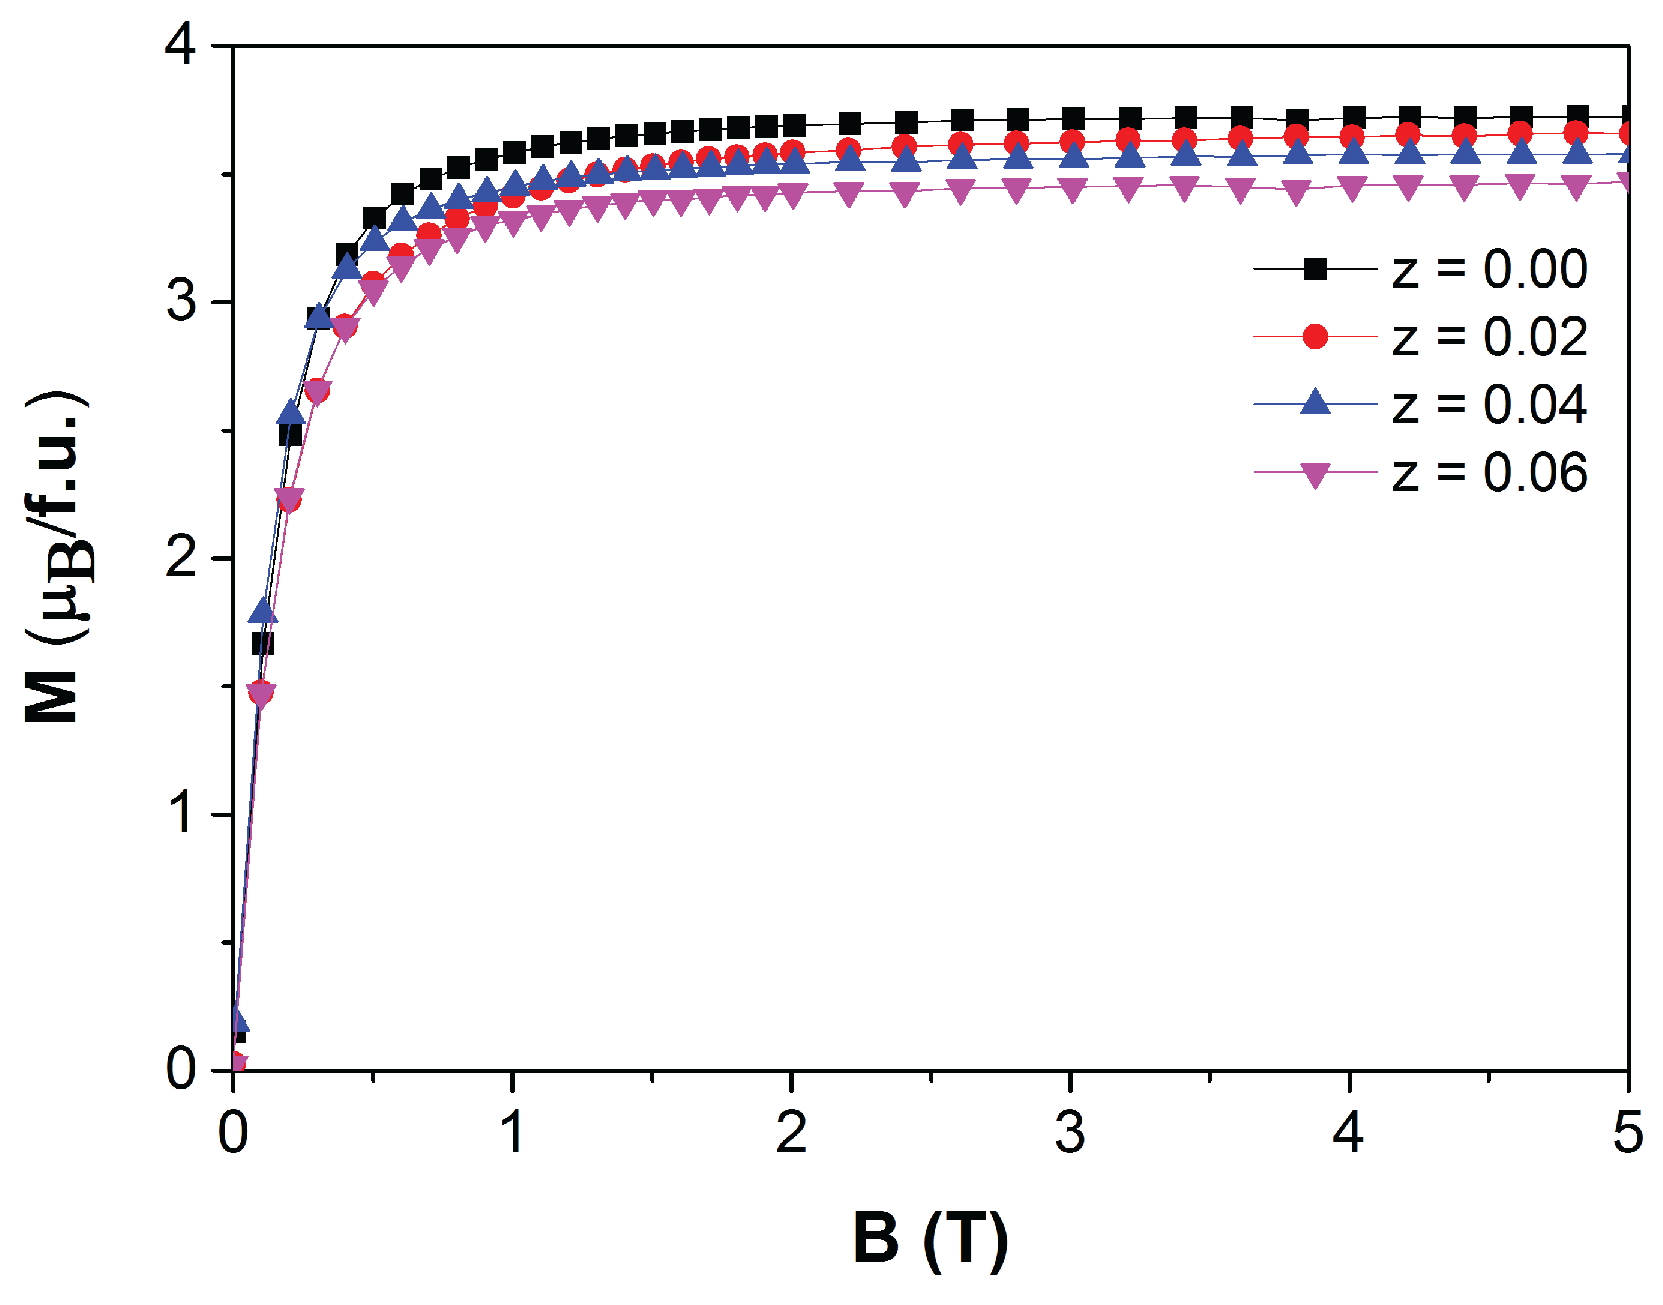
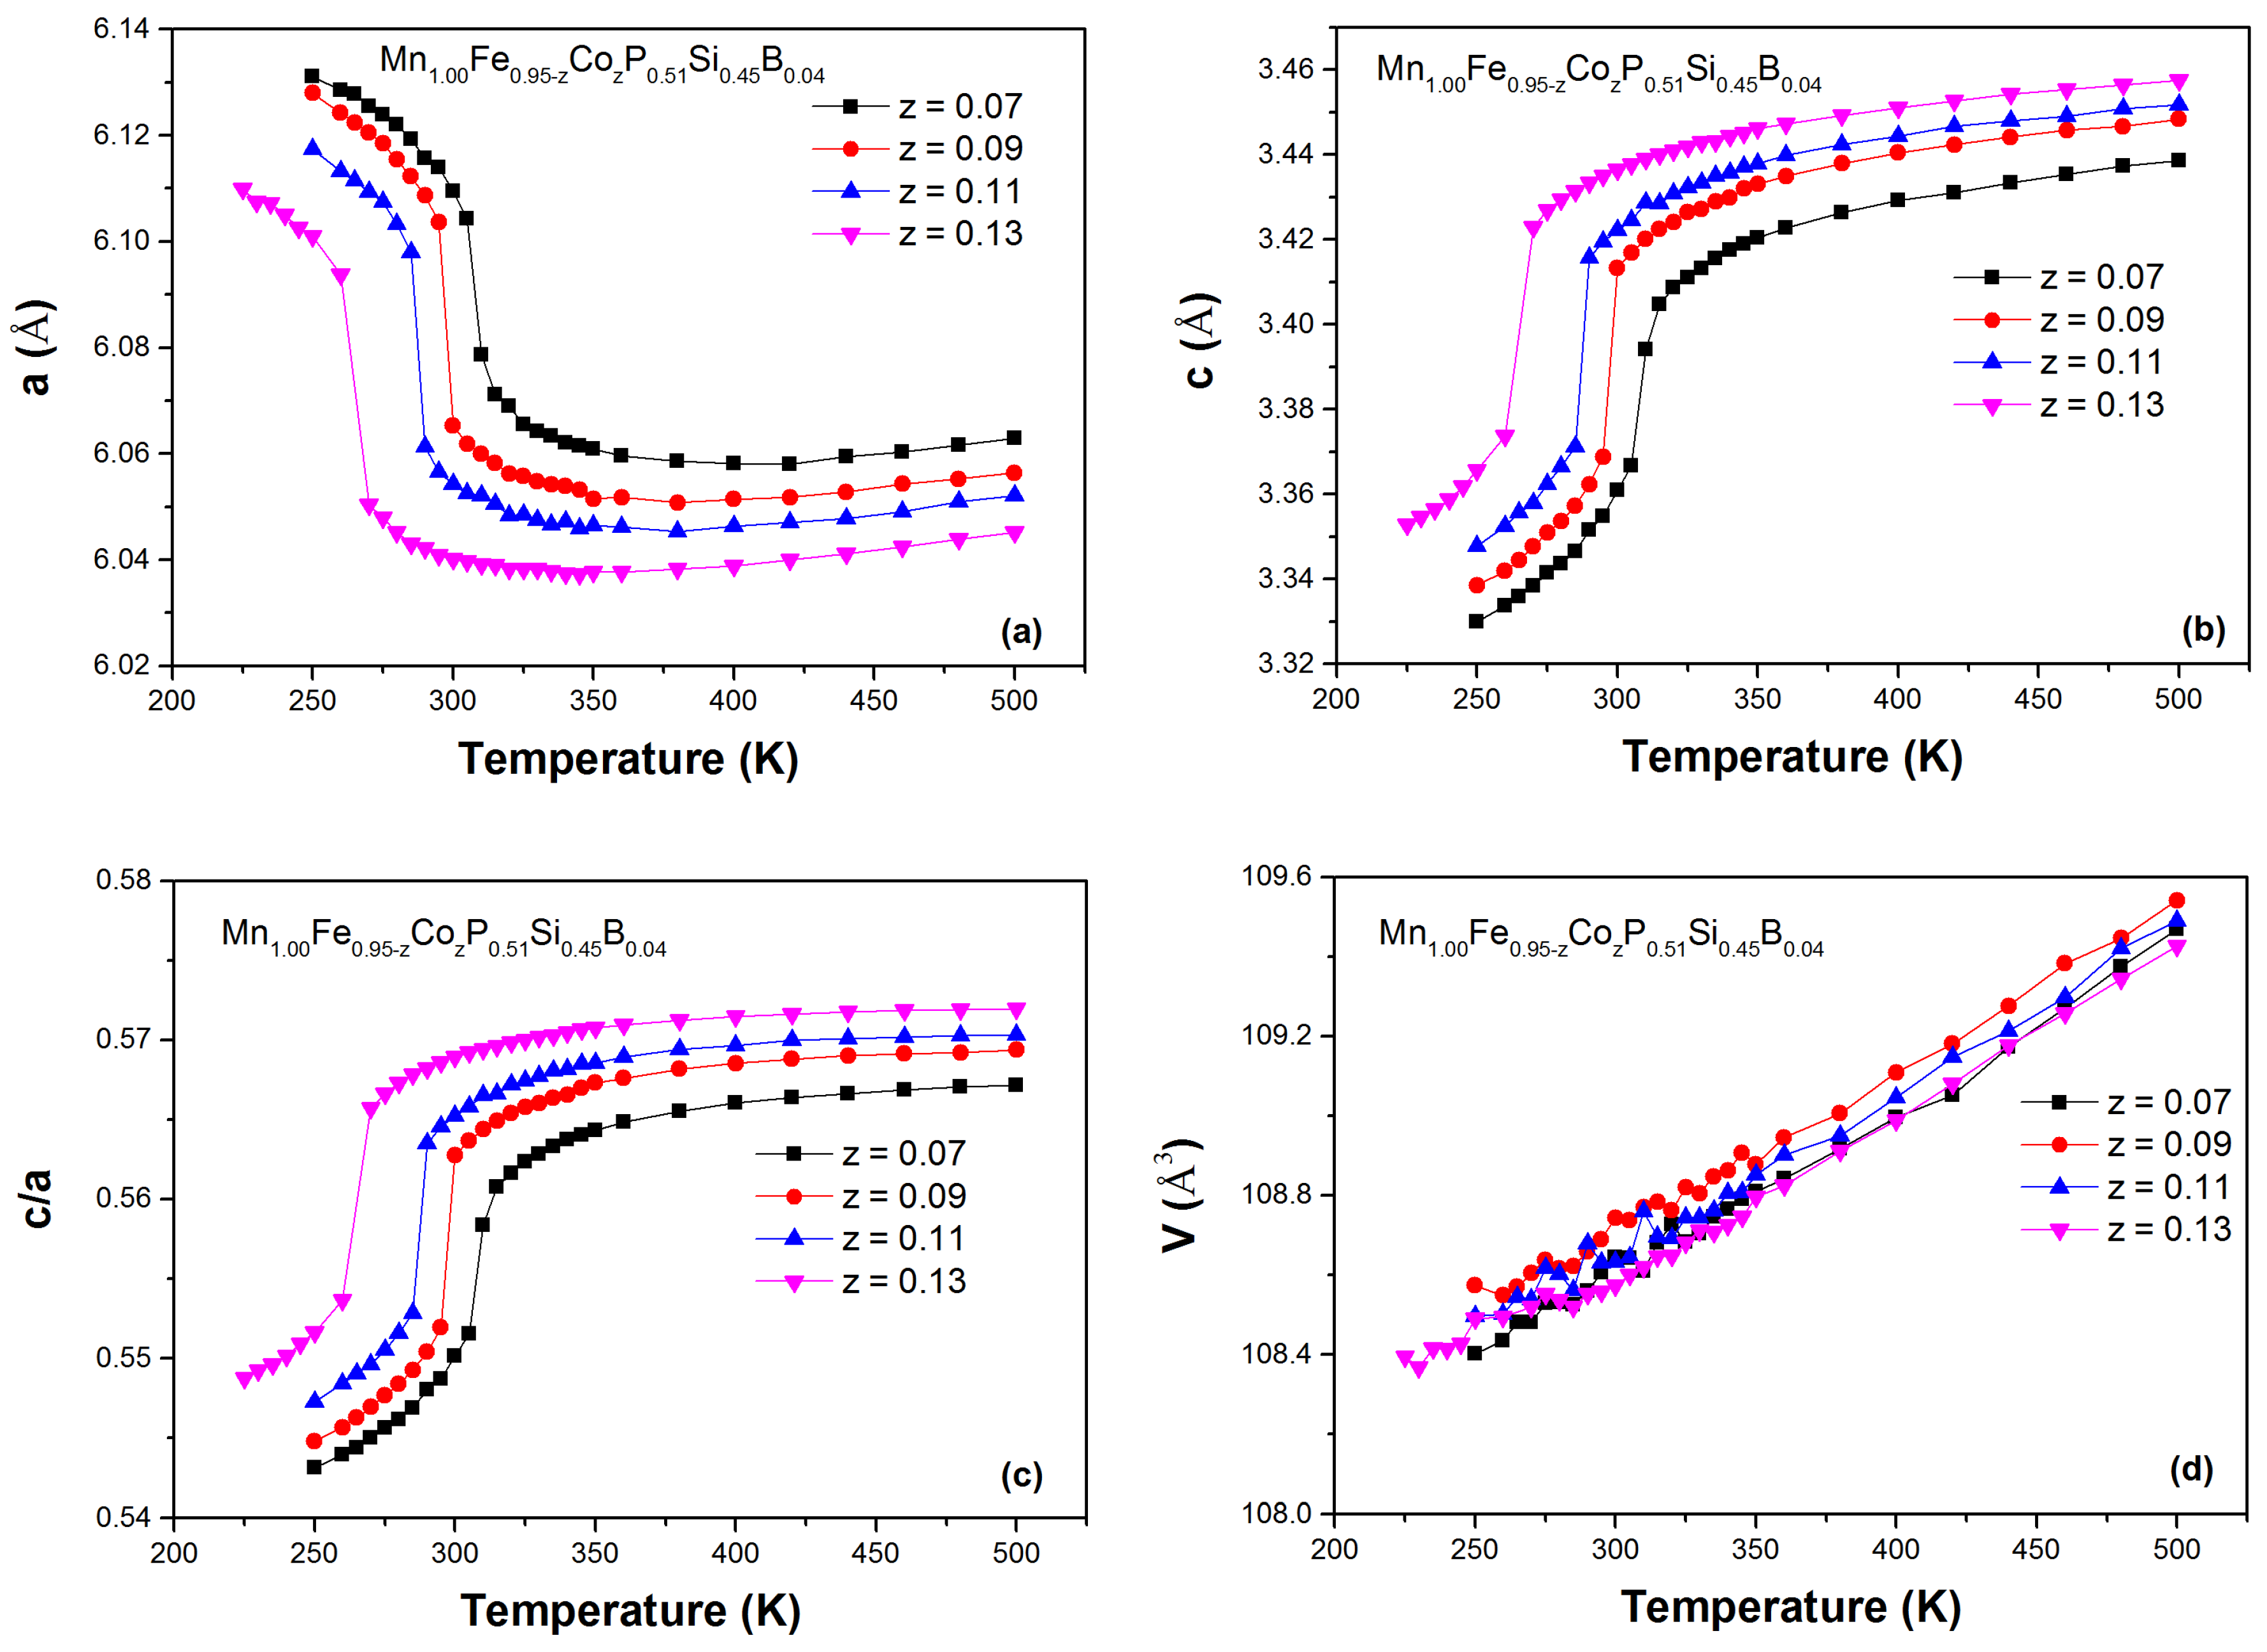
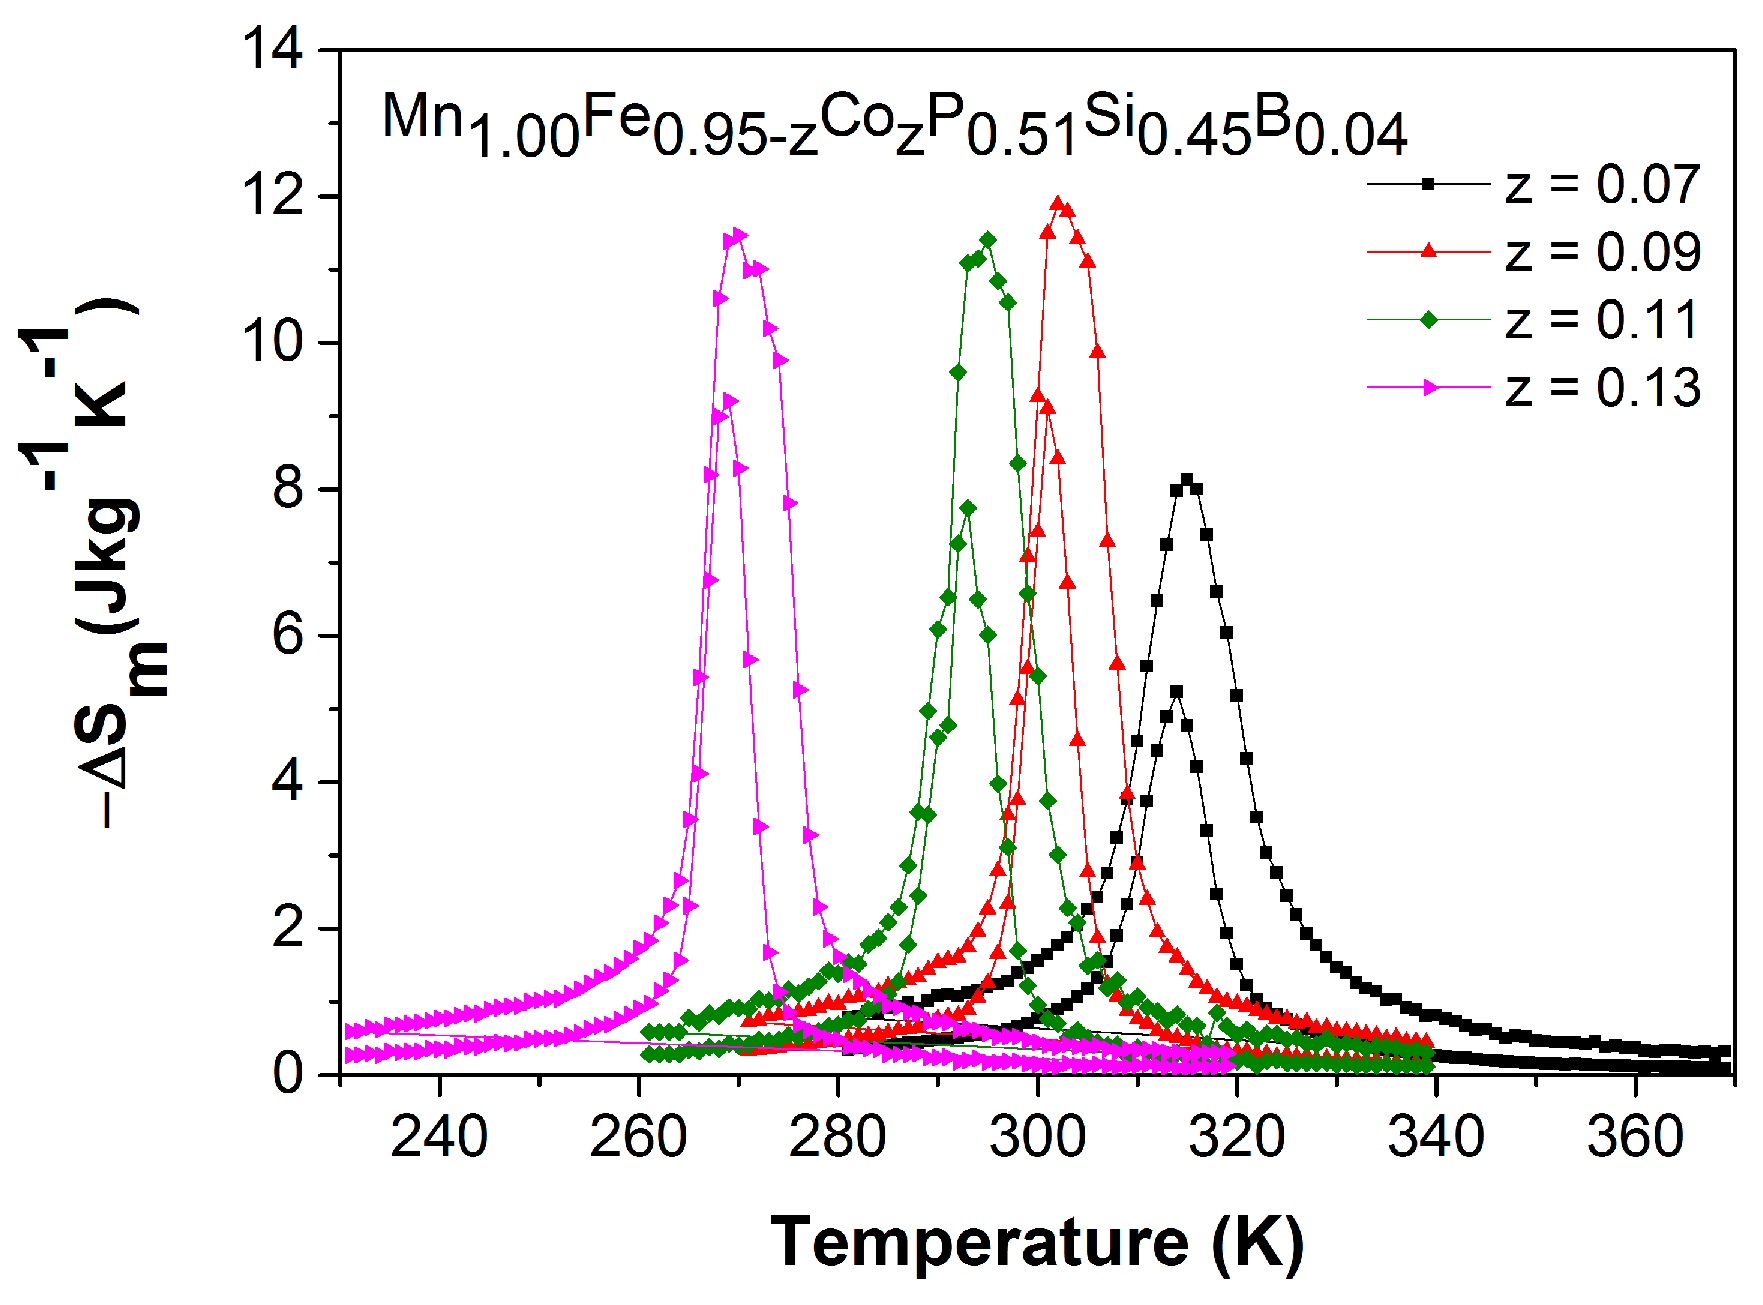
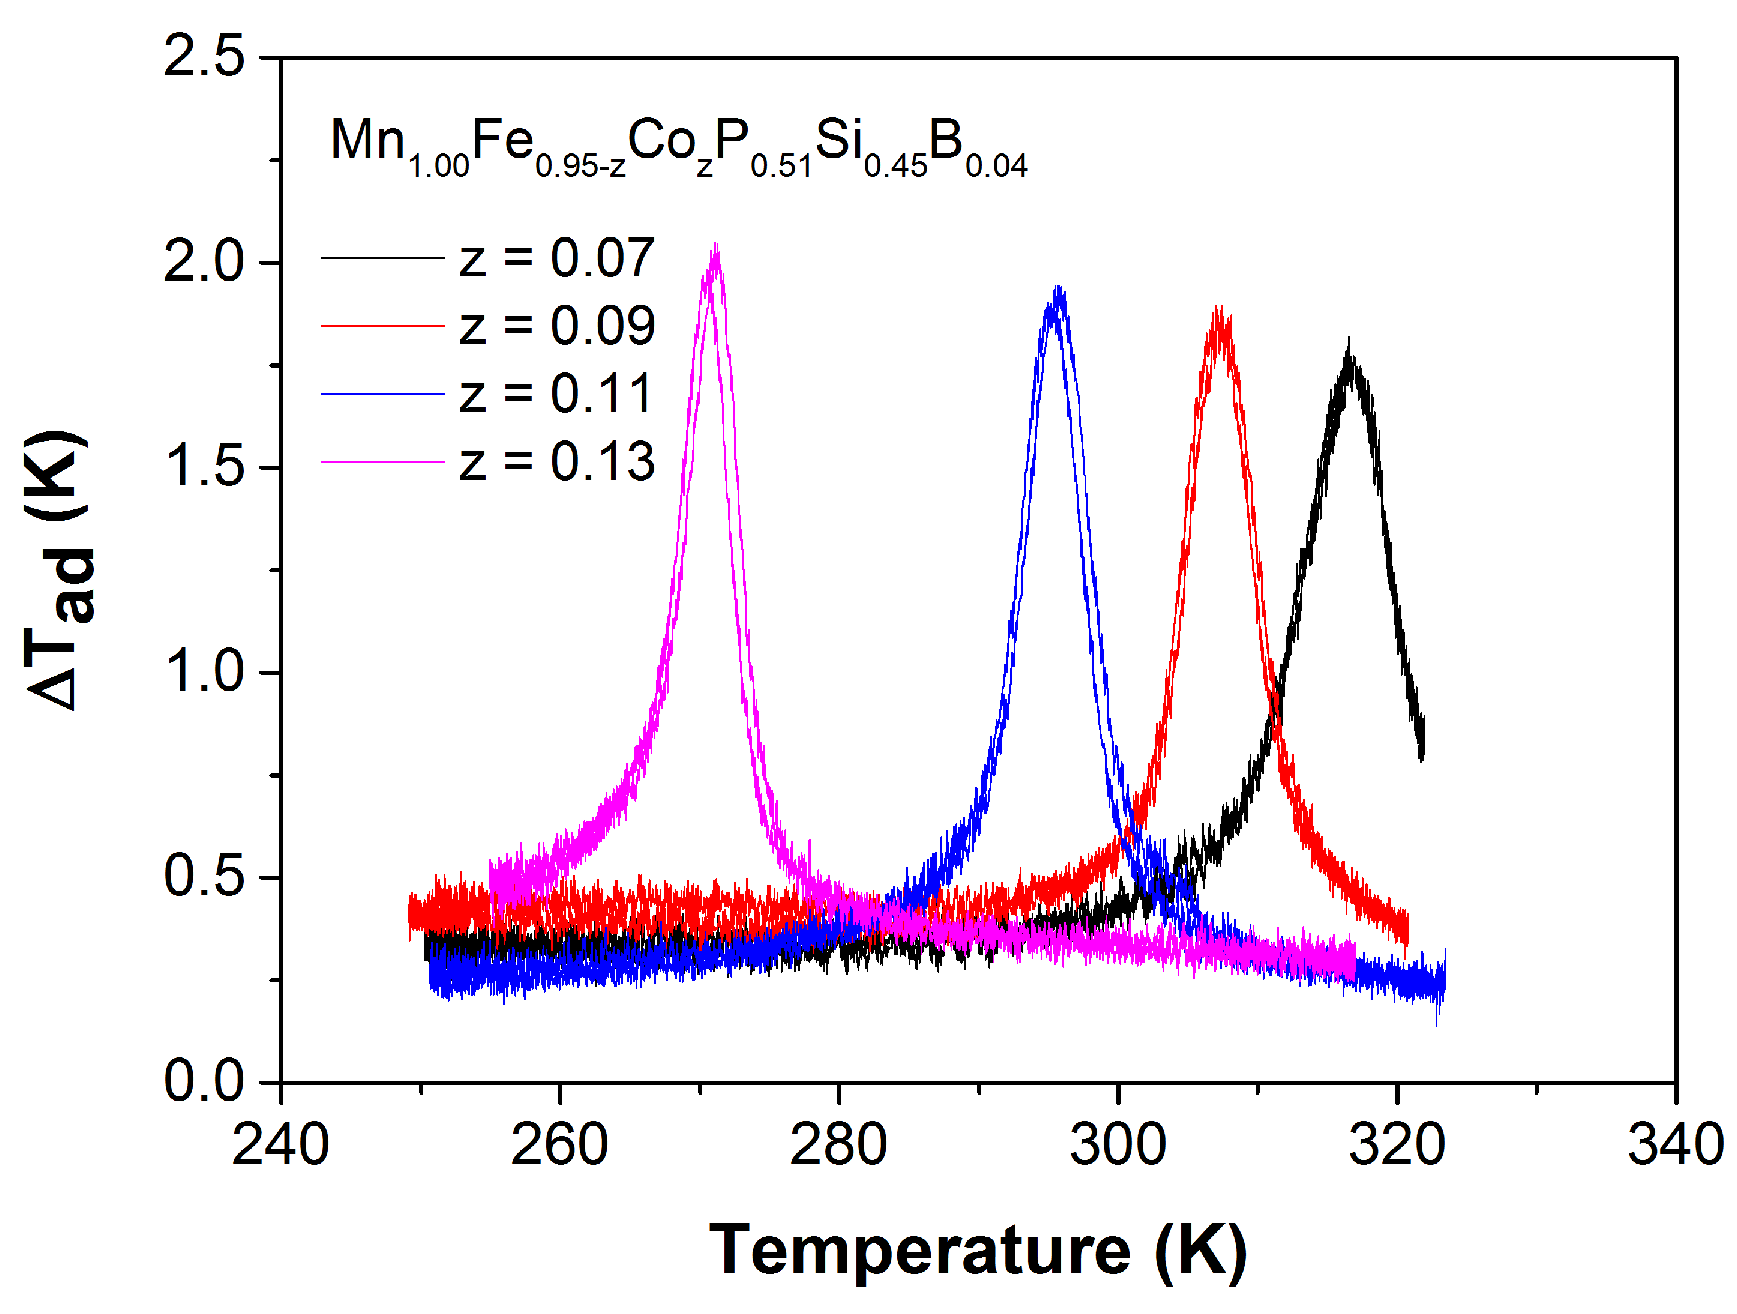
2.1. MnFeCoPSiB Compounds
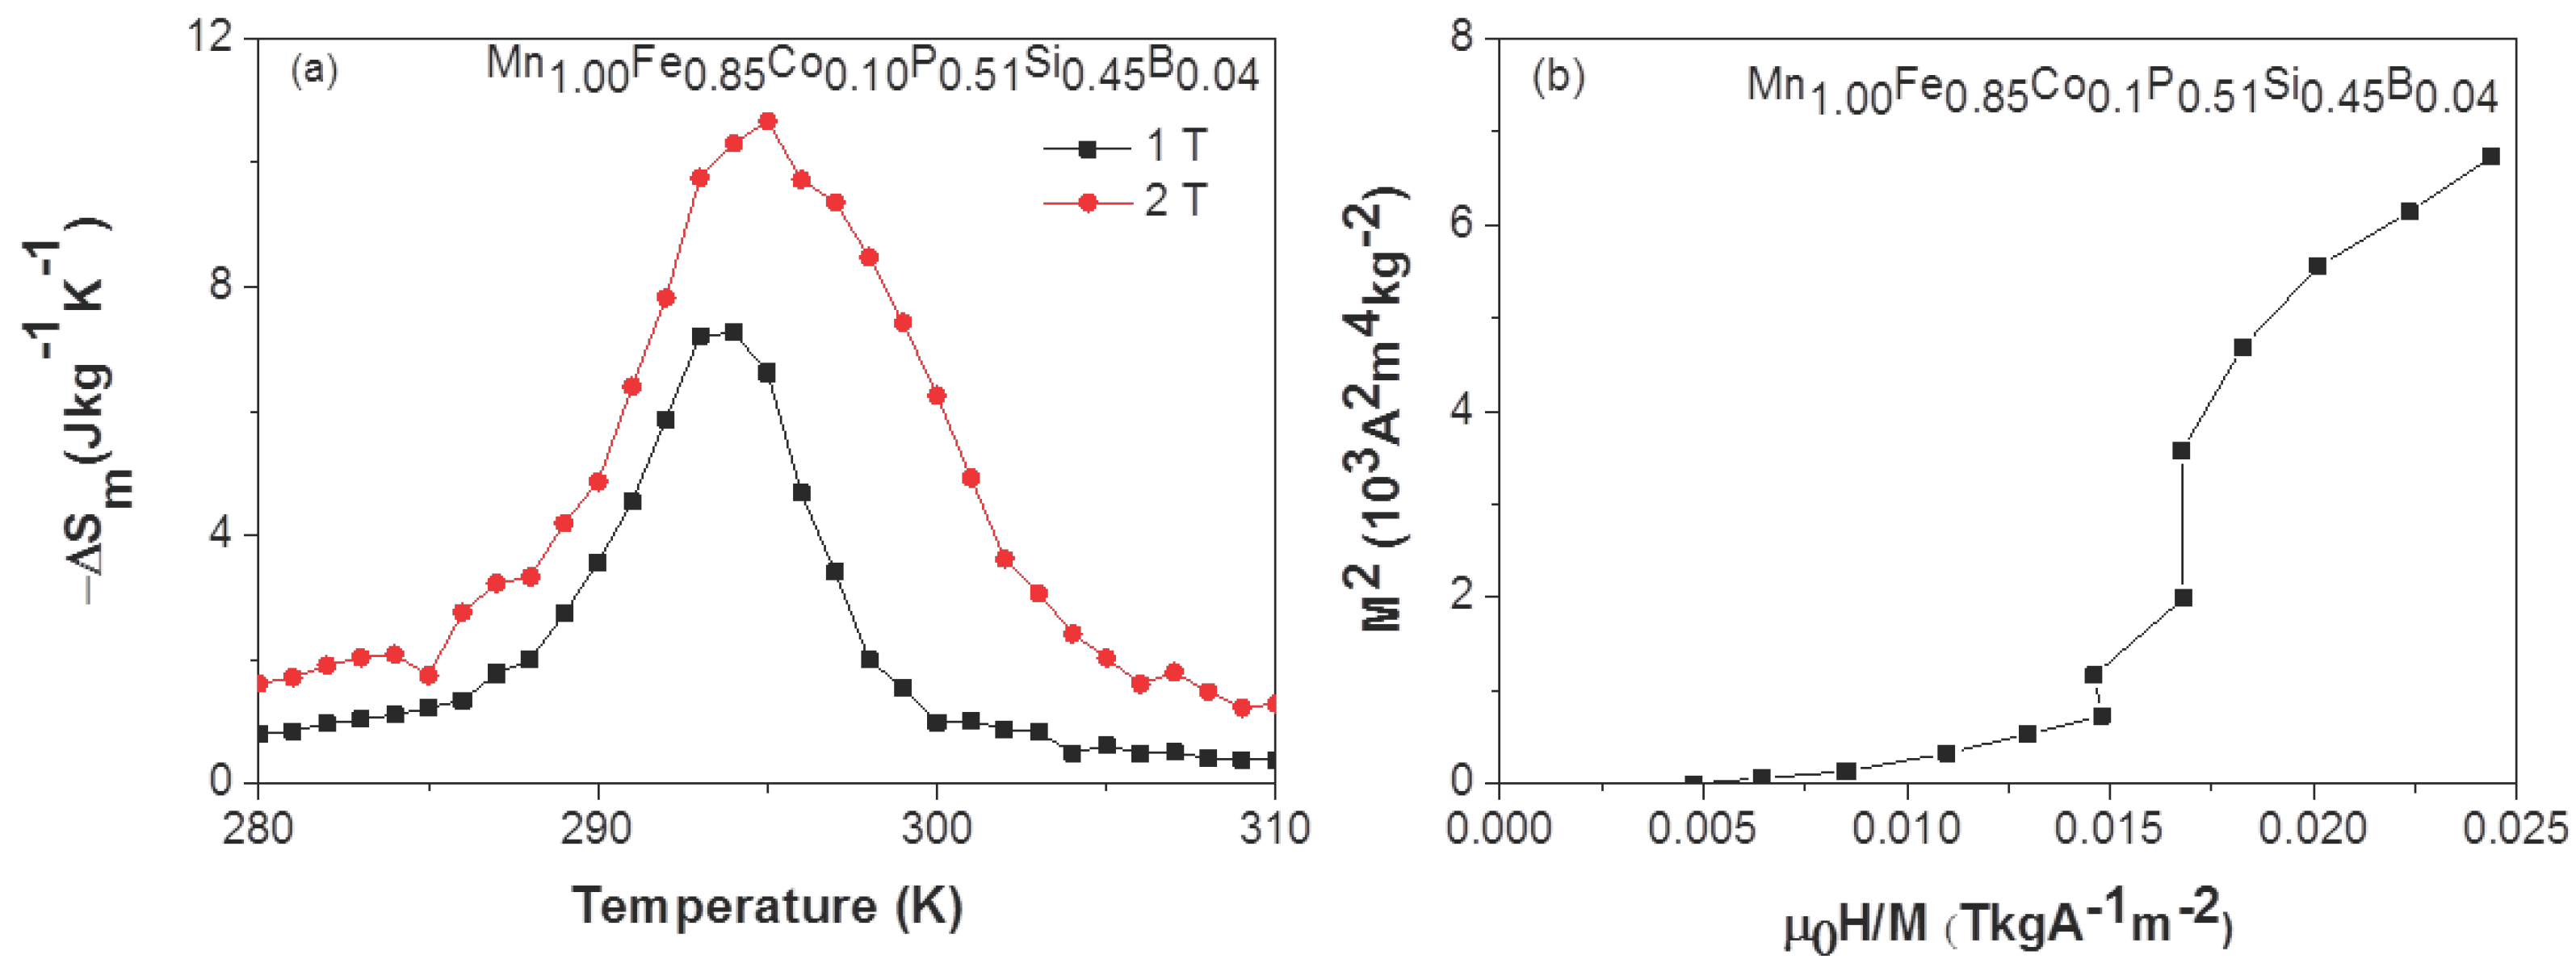
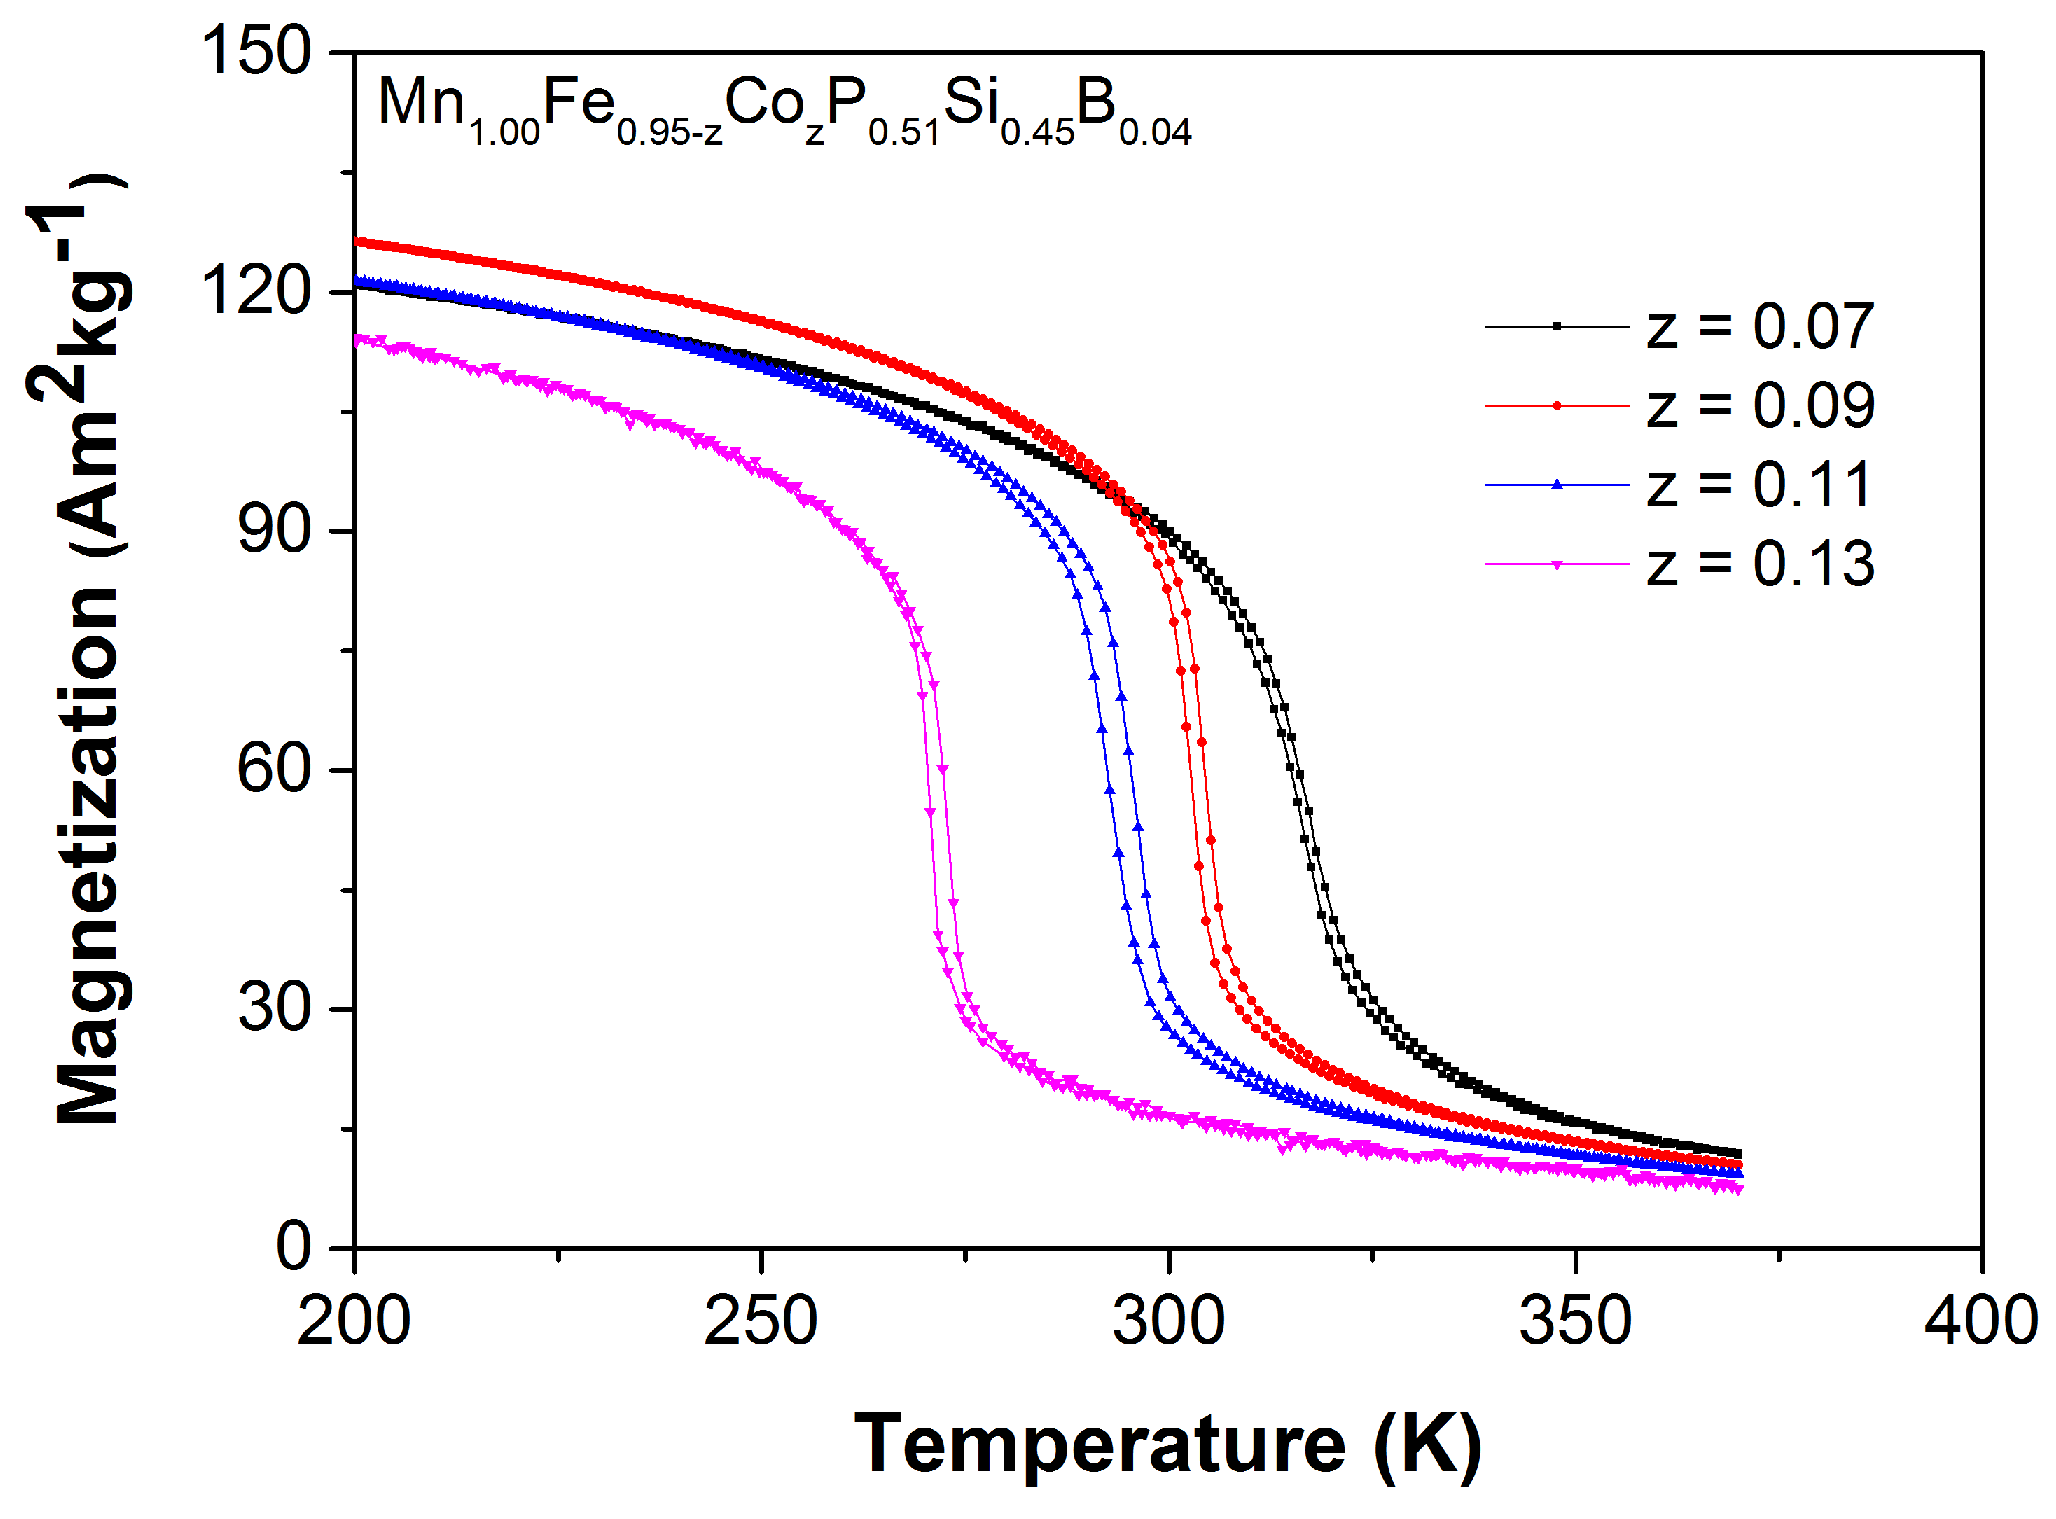
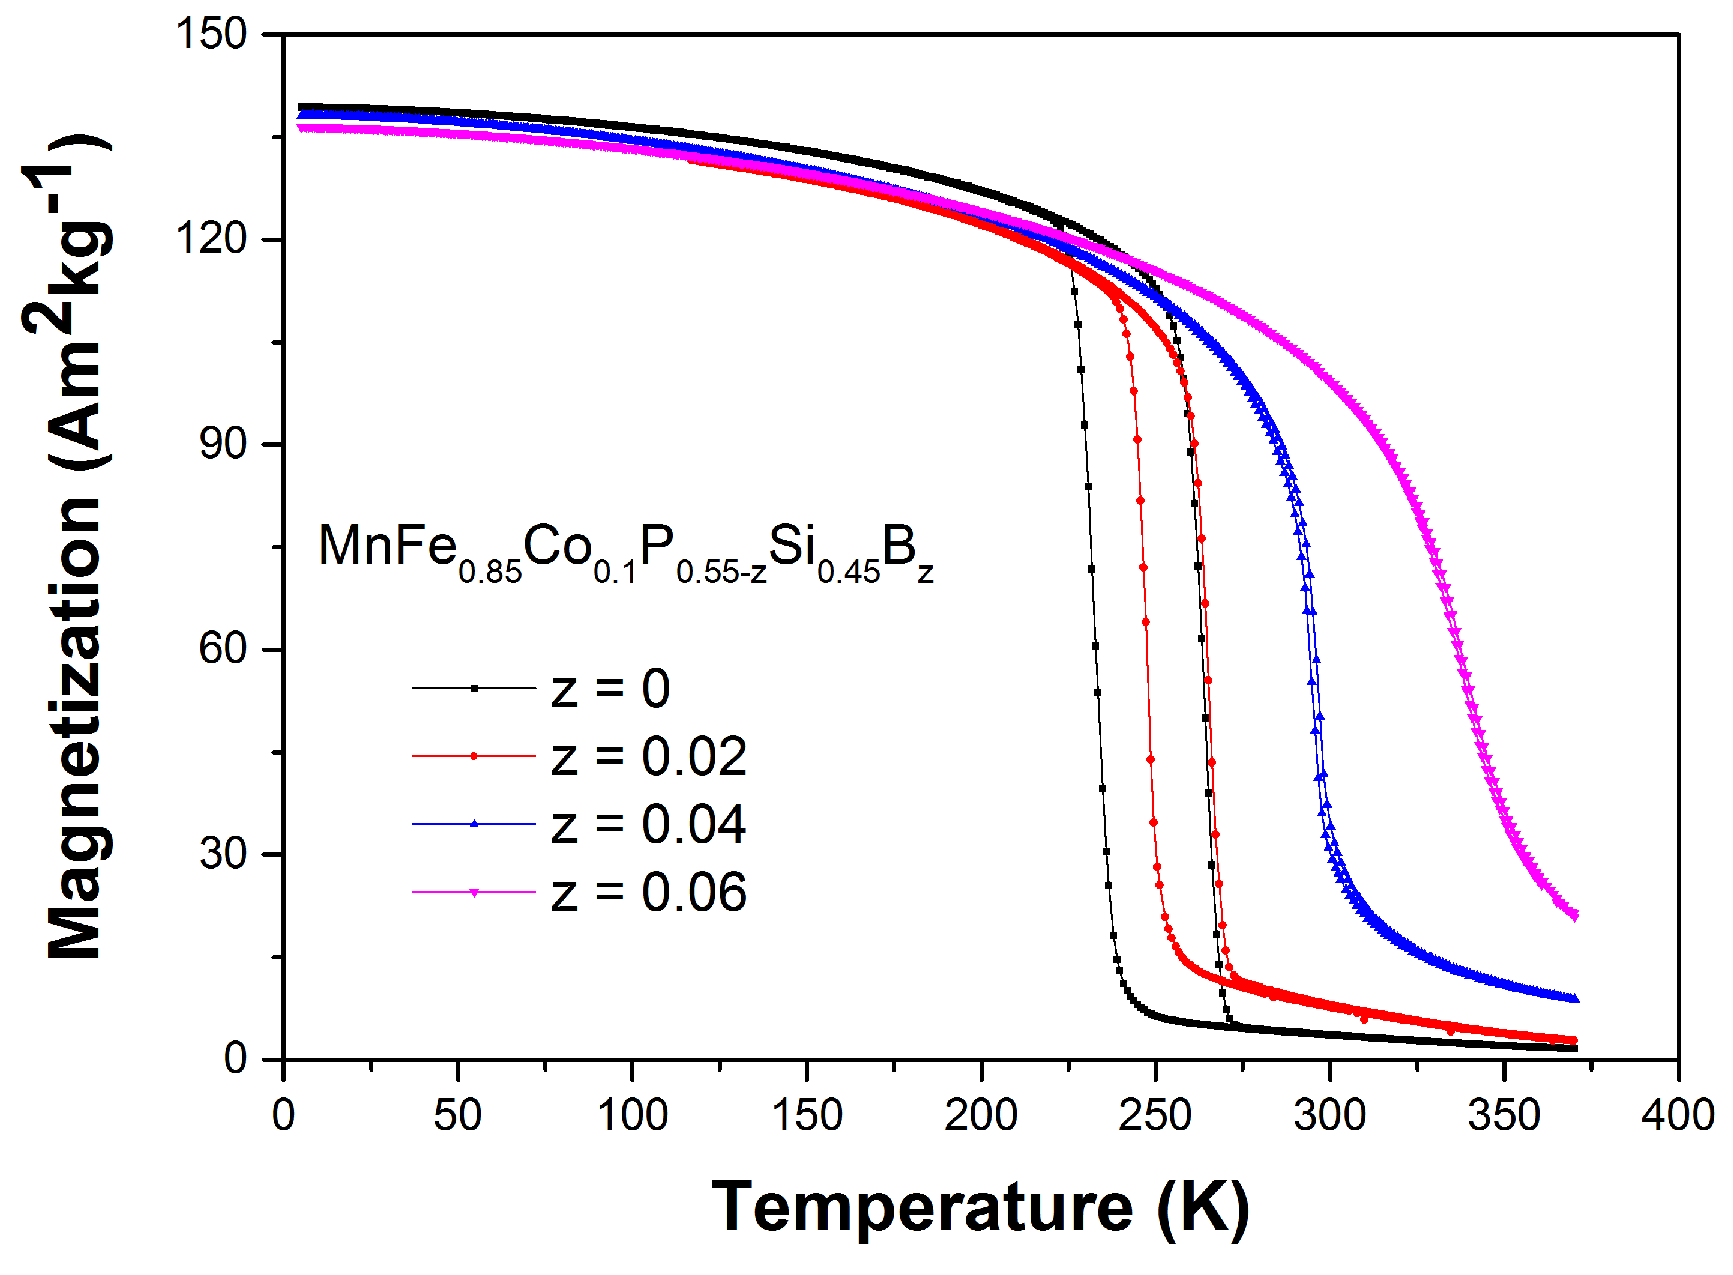
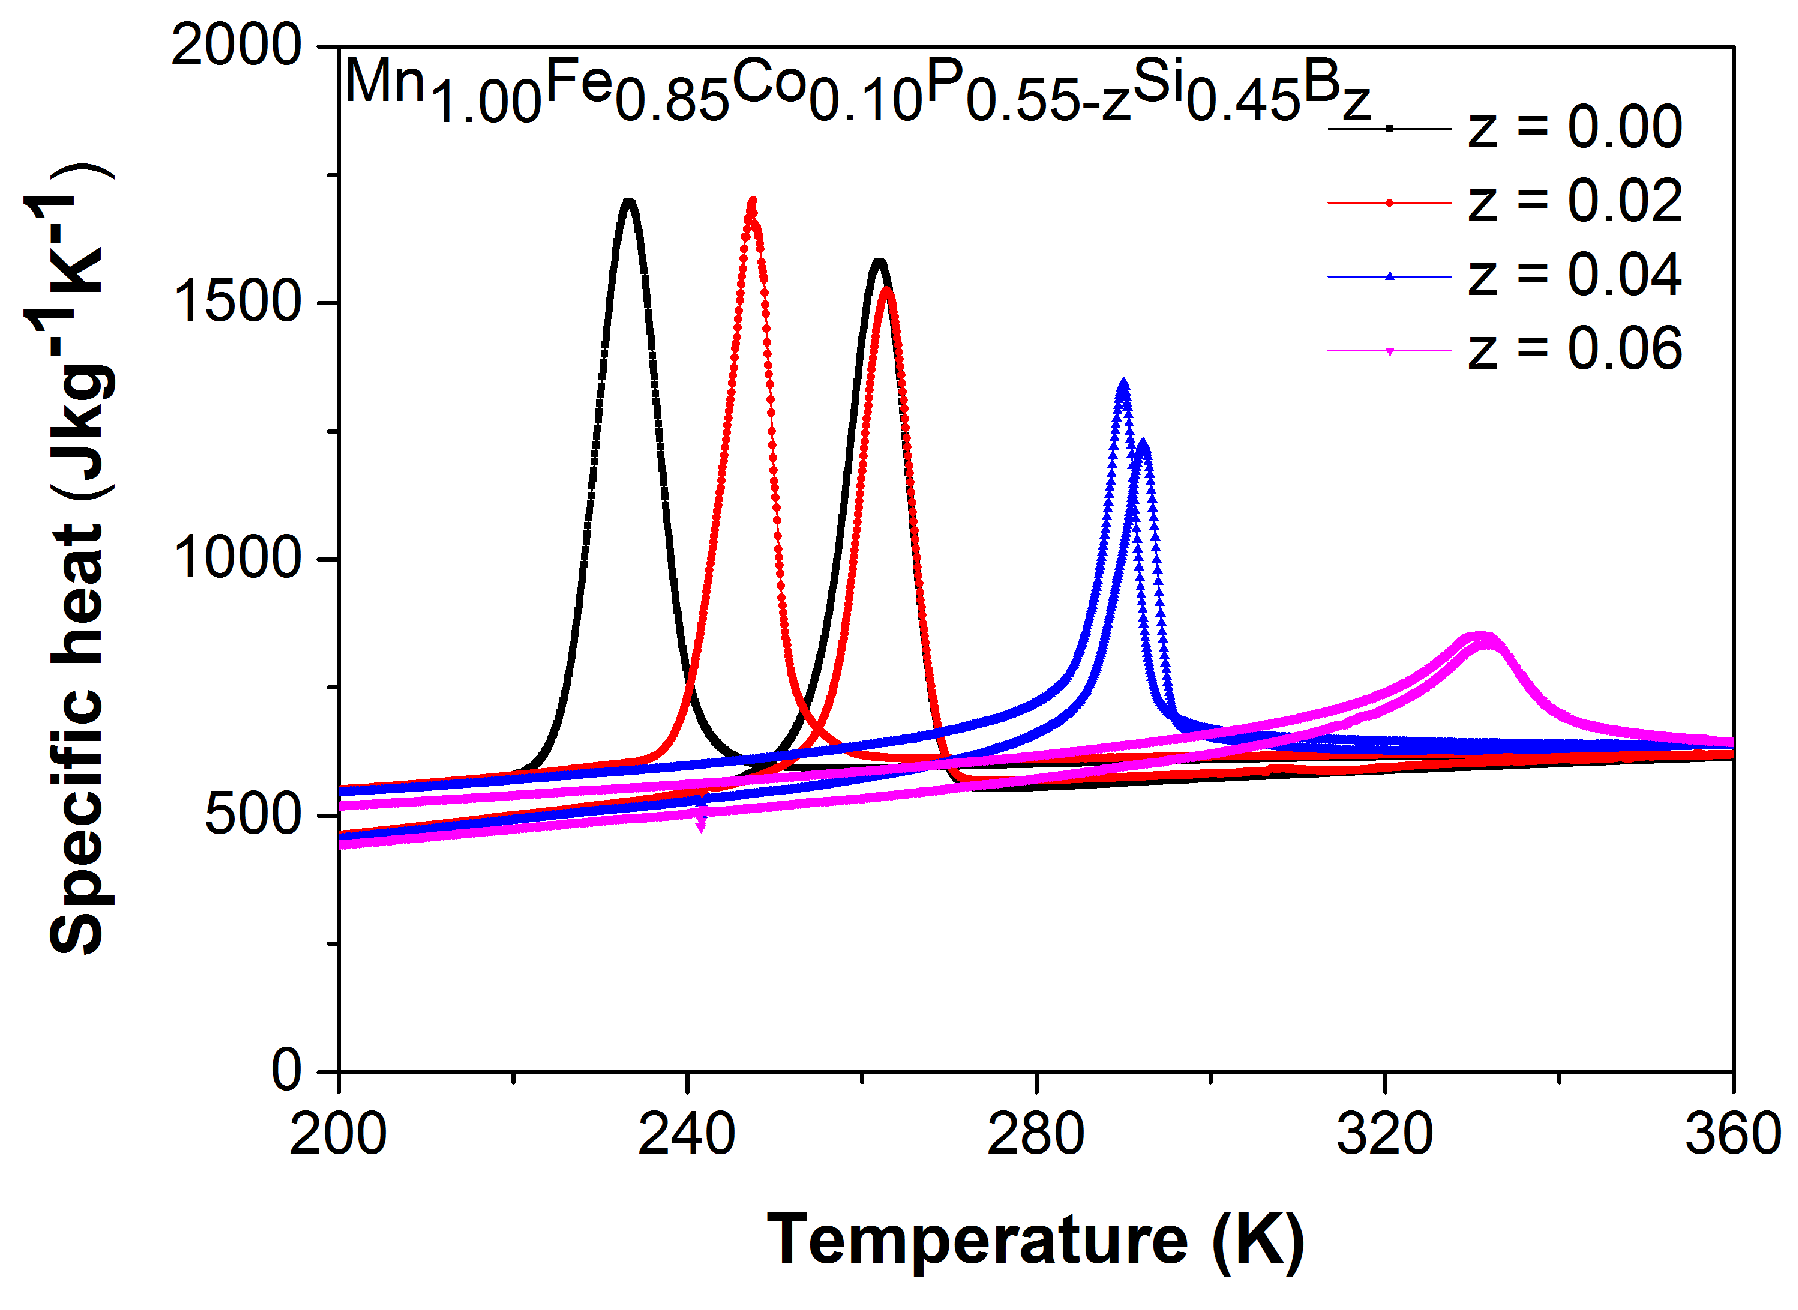
2.2. MnFeCoPSiB
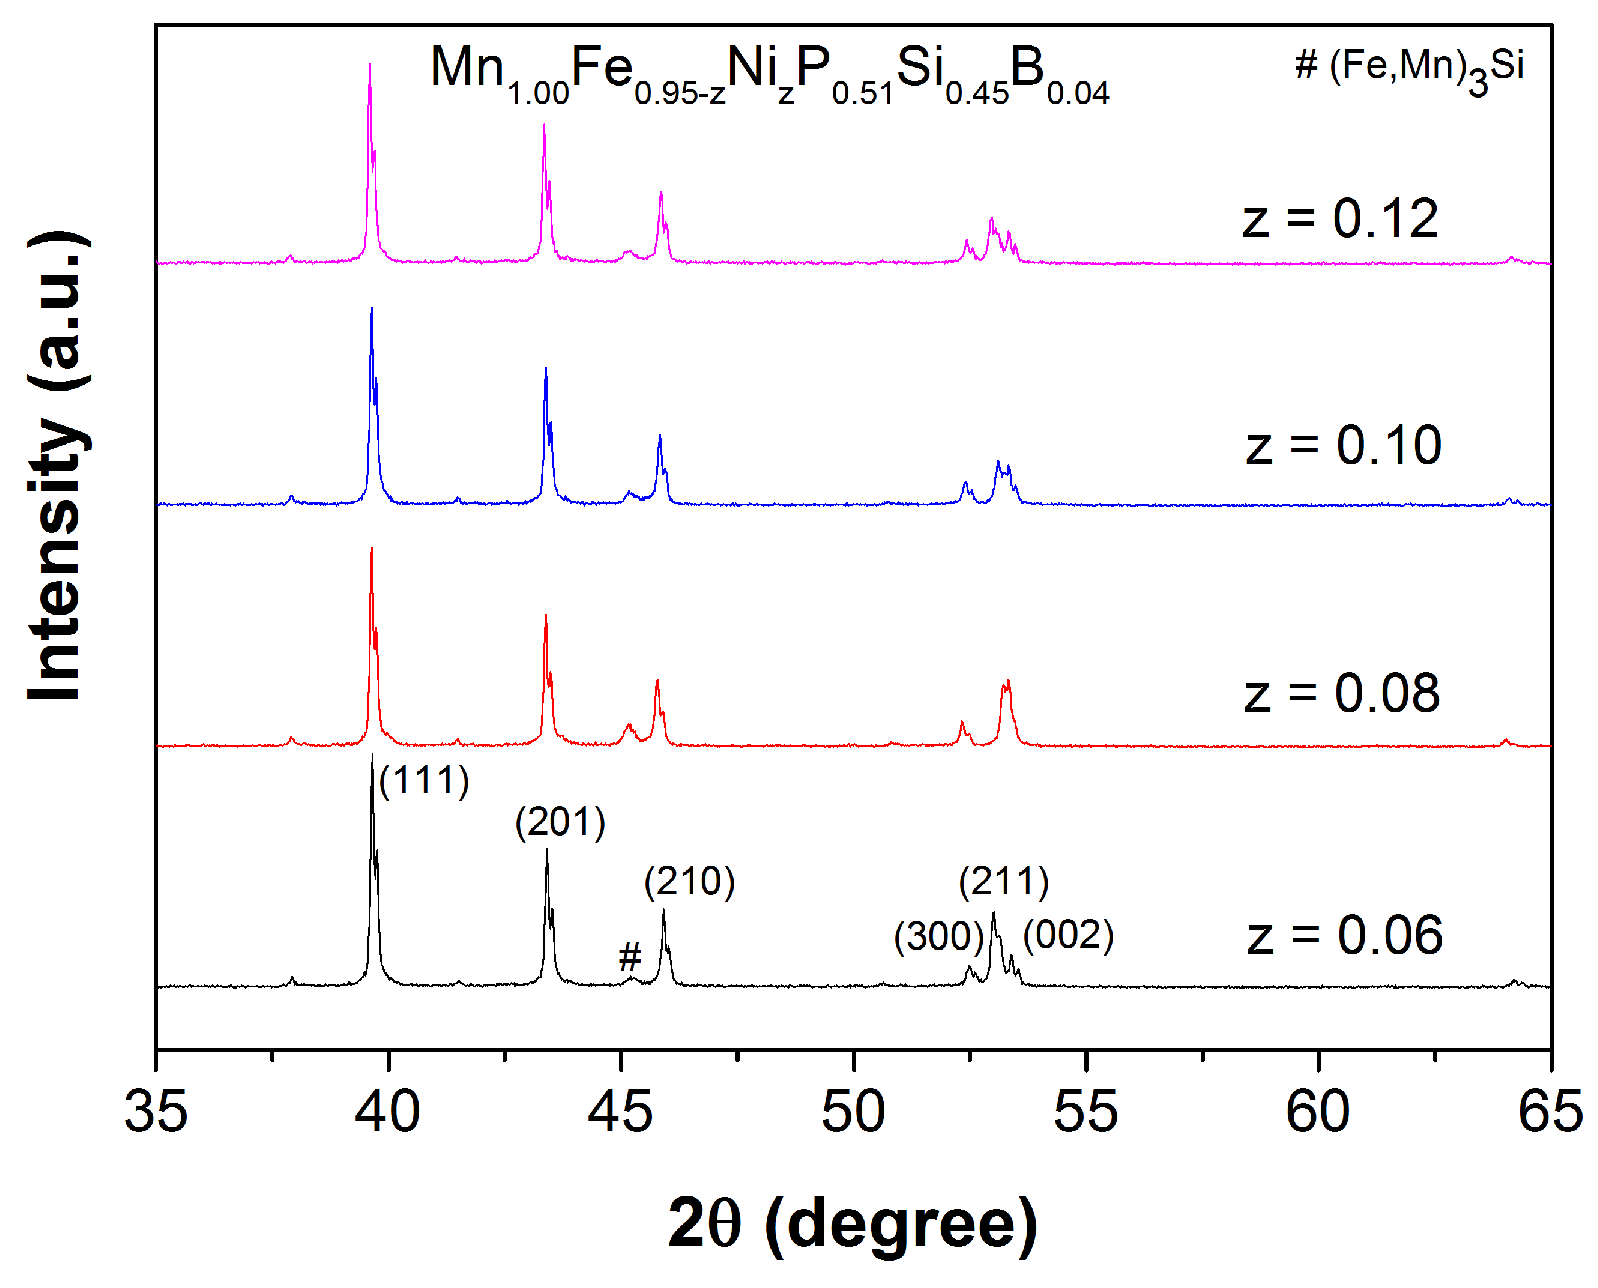
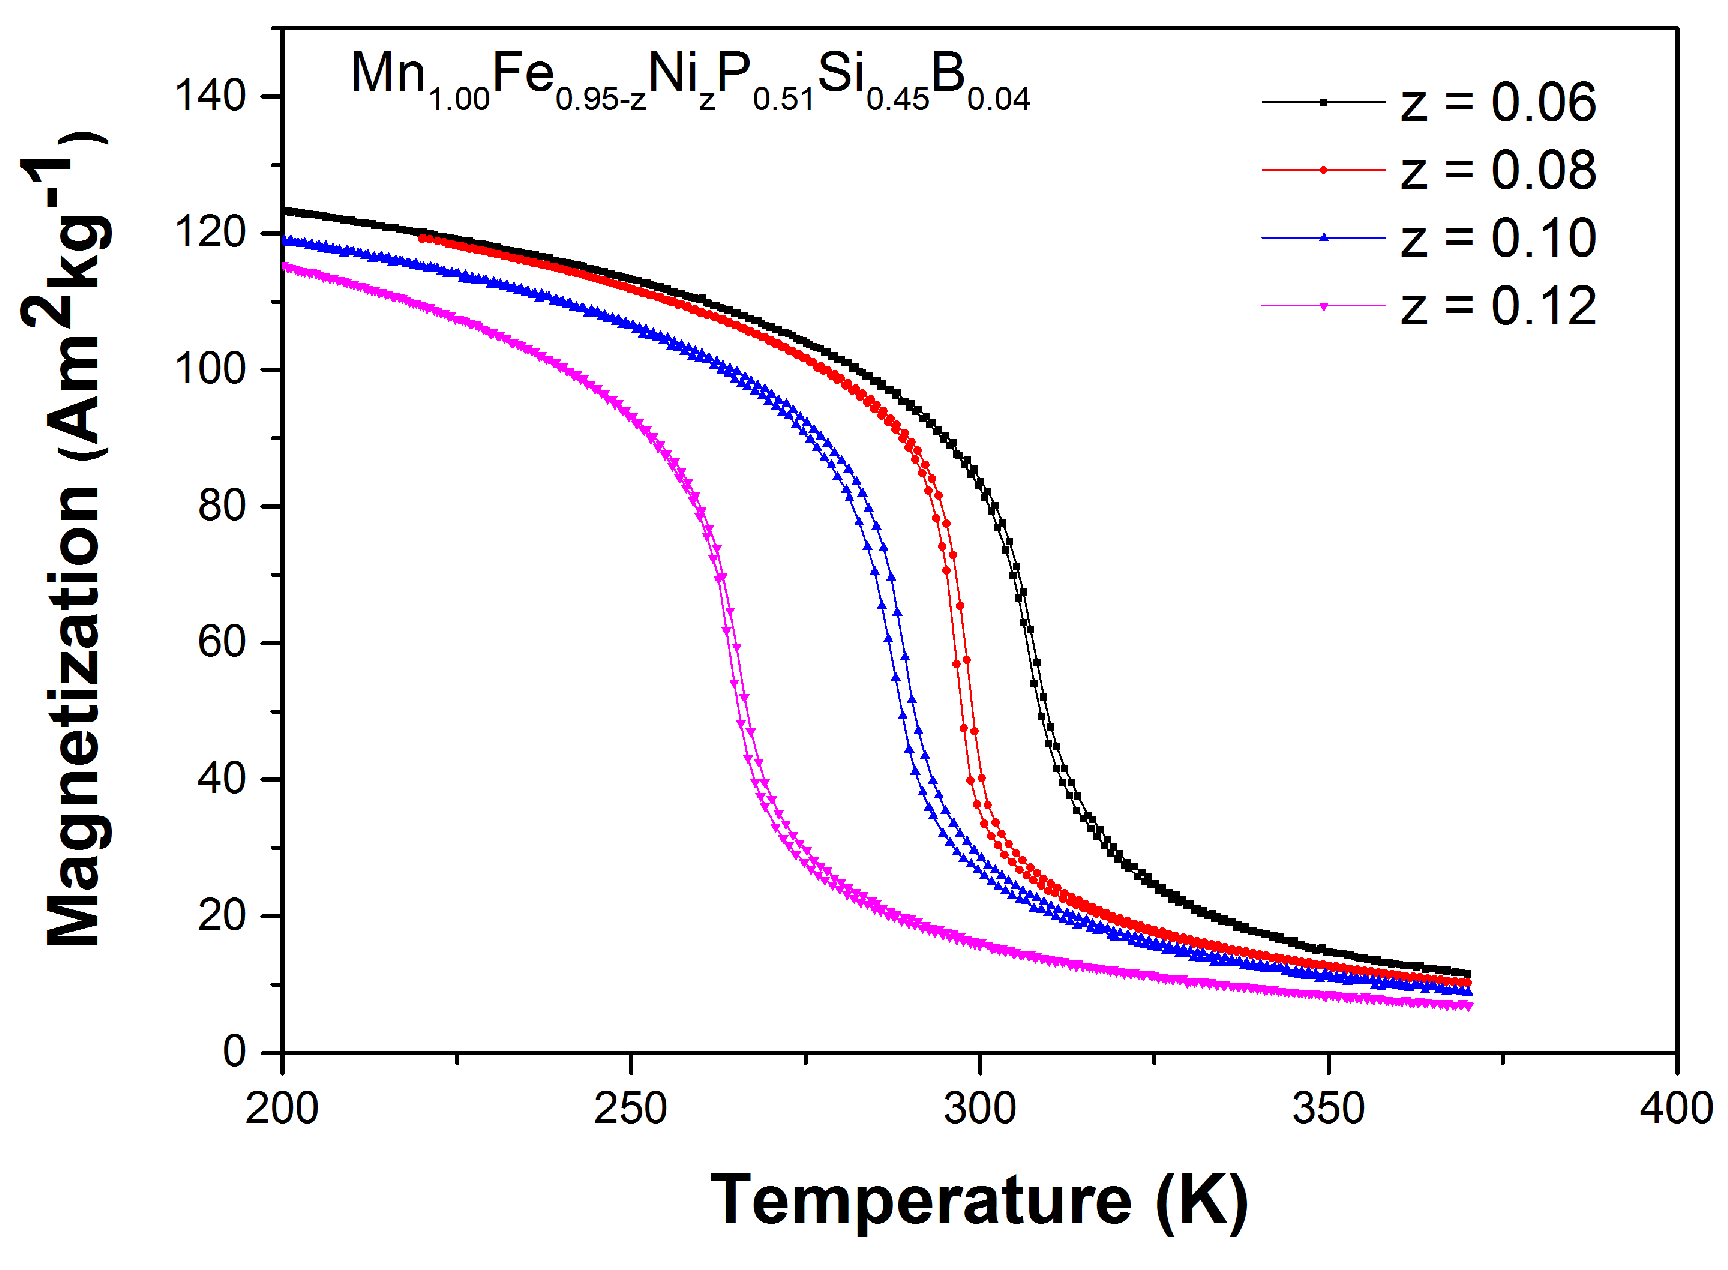
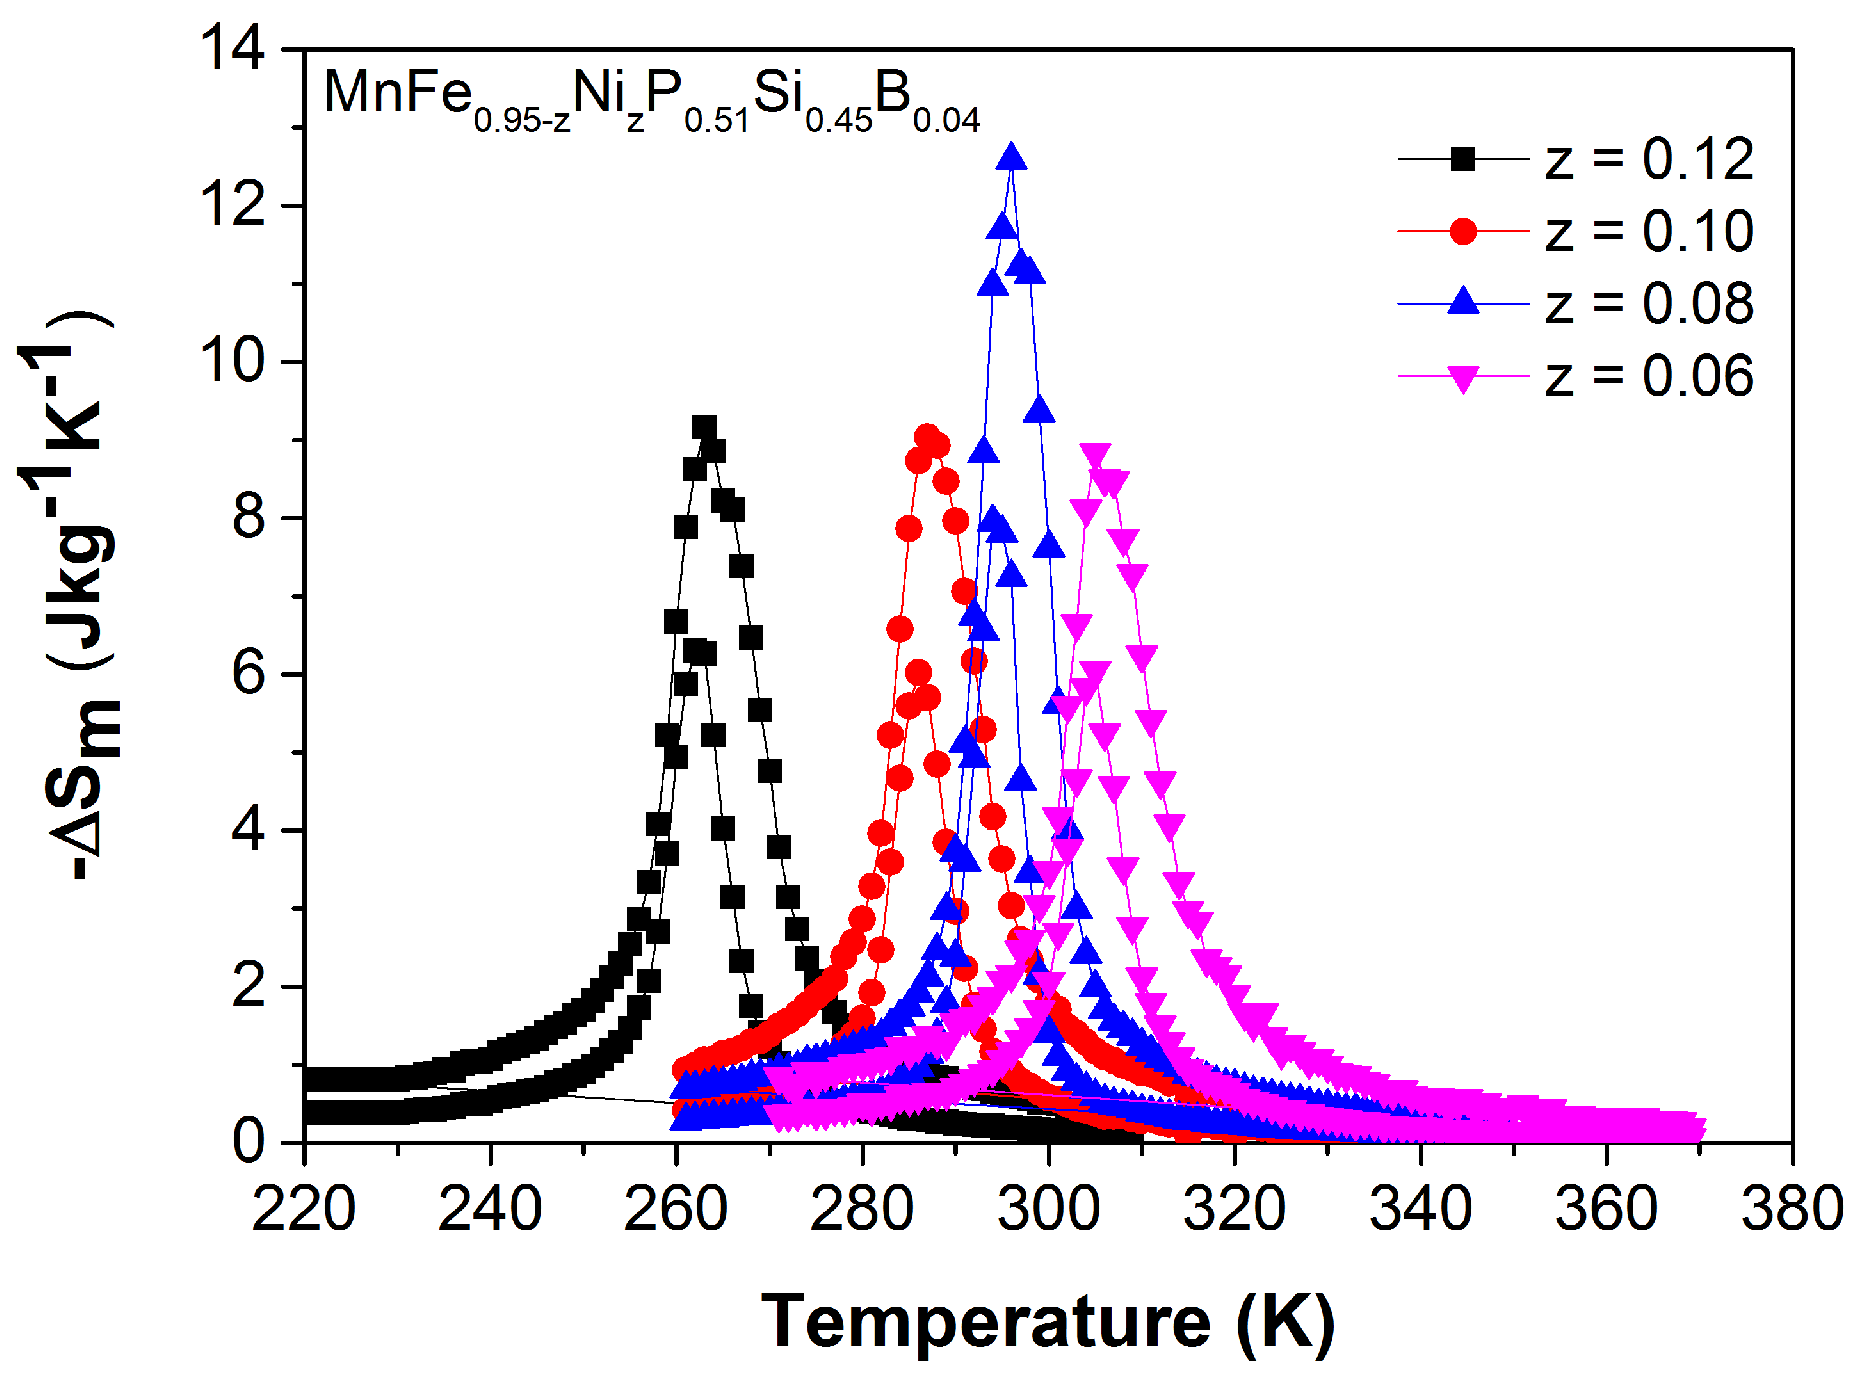
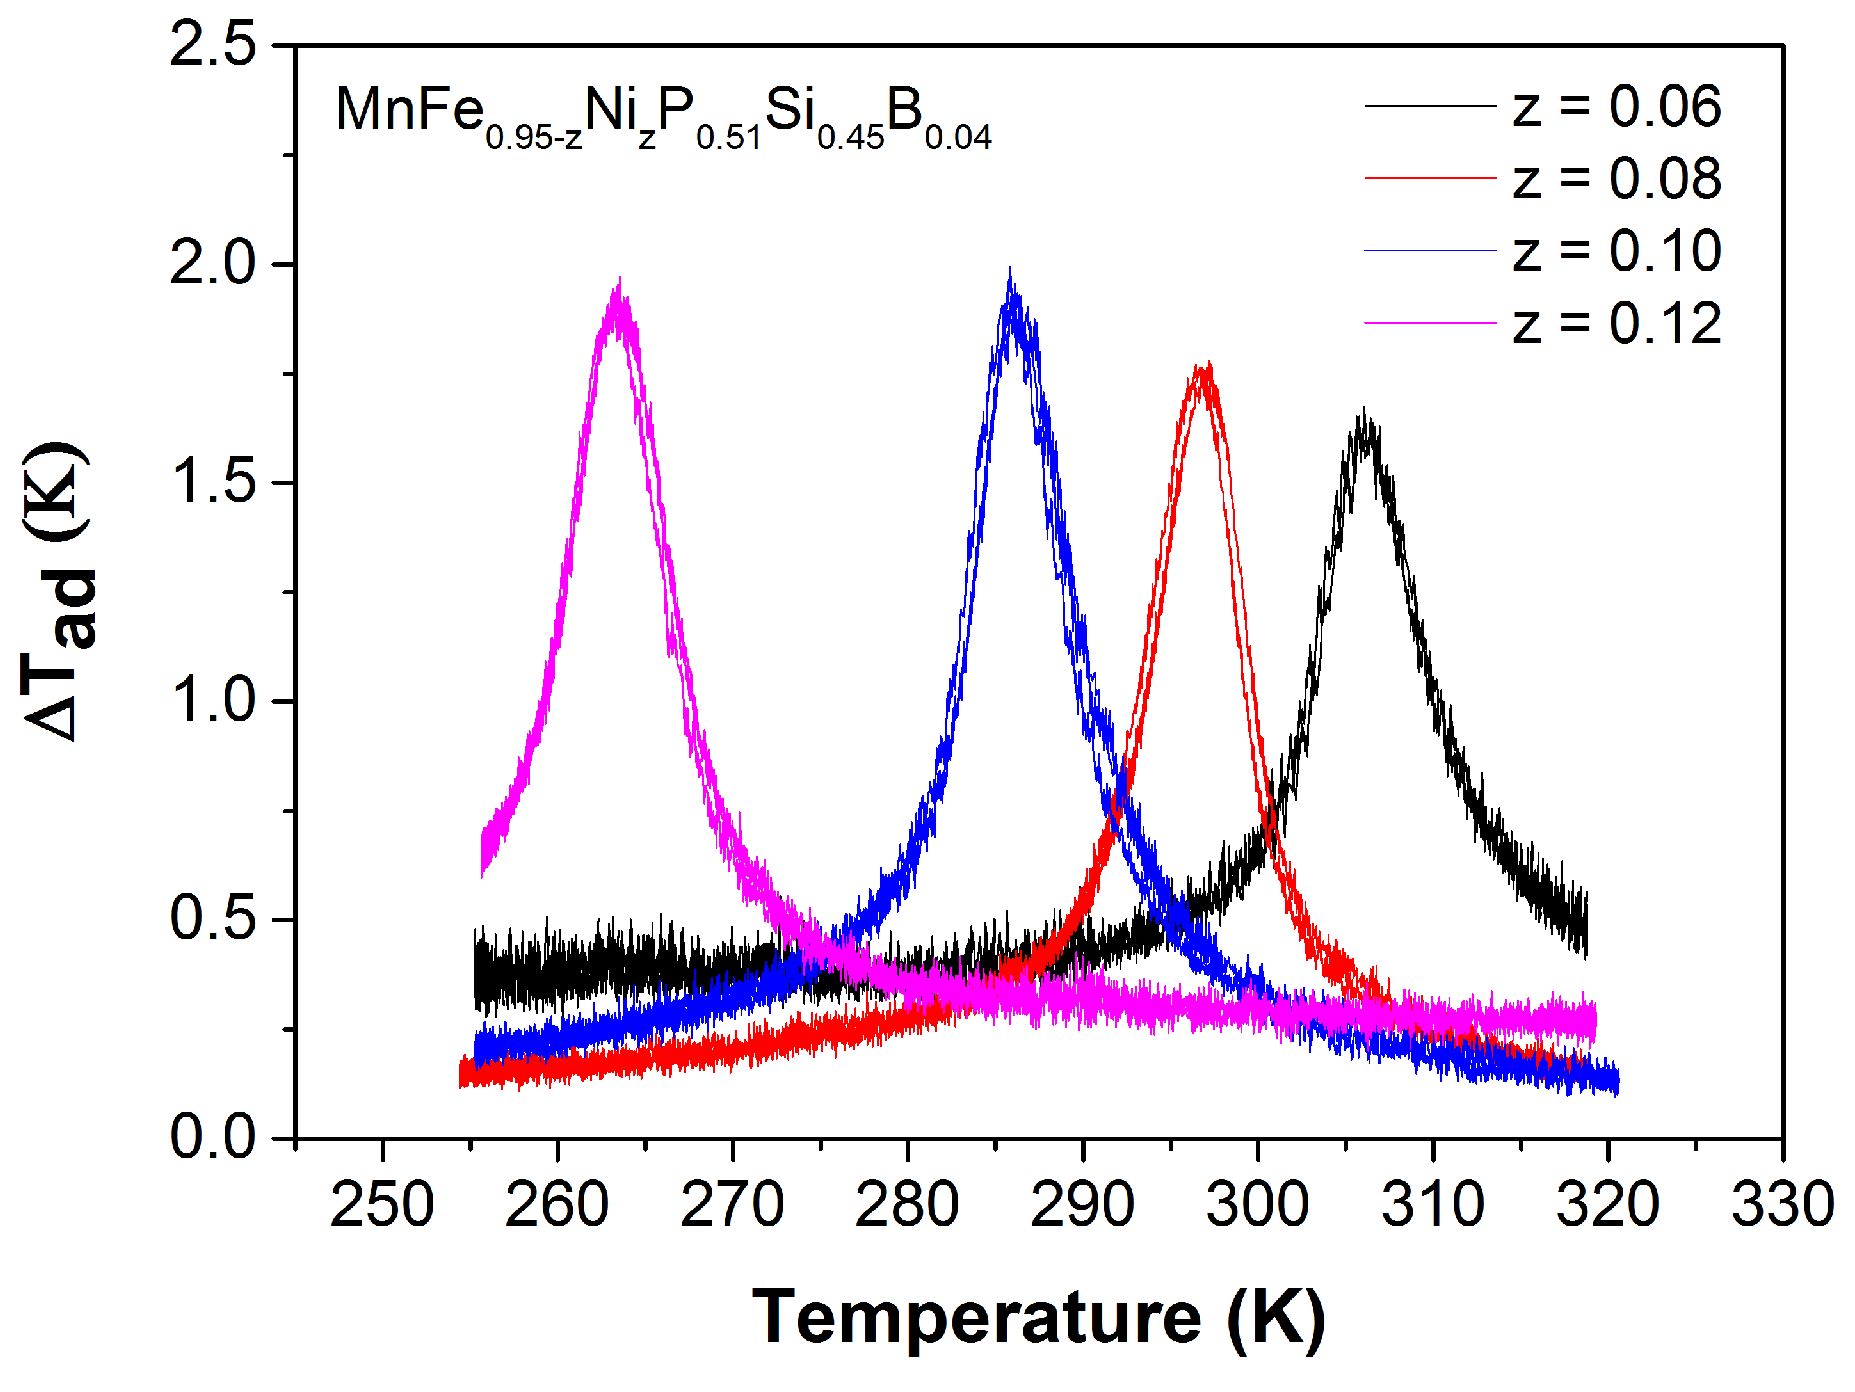
2.3. MnFeNiPSiB
3. Materials and Methods
4. Conclusions
Acknowledgments
Author Contributions
Conflicts of Interest
Abbreviations
| MCE | Magnetocaloric effect |
| Isothermal magnetic entropy change | |
| Adiabatic temperature change | |
| FOMT | First-order magnetic transition |
| Curie temperature | |
| XRD | X-ray diffraction |
| DSC | Differential scanning calorimeter |
| SQUID | Superconducting quantum interference device |
| Thermal hysteresis | |
| FOMET | First-order magneto-elastic transition |
| FM | Ferromagnetic |
| PM | Paramagnetic |
References
- Weiss, P.; Picard, A. Le phènomène magnètocalorique. J. Phys. Theor. Appl. 1917, 7, 103–109. (In French) [Google Scholar] [CrossRef]
- Smith, A. Who discovered the magnetocaloric effect? Eur. Phys. J. H 2013, 38, 507–517. [Google Scholar] [CrossRef]
- Smith, A.; Bahl, C.R.; Bjørk, R.; Engelbrecht, K.; Nielsen, K.K.; Pryds, N. Materials Challenges for High Performance Magnetocaloric Refrigeration Devices. Adv. Energy Mater. 2012, 2, 1288–1318. [Google Scholar] [CrossRef]
- Franco, V.; Blázquez, J.; Ingale, B.; Conde, A. The Magnetocaloric Effect and Magnetic Refrigeration Near Room Temperature: Materials and Models. Annu. Rev. Mater. Res. 2012, 42, 305–342. [Google Scholar] [CrossRef]
- Tishin, A.M.; Spichkin, Y.I. The Magnetocaloric Effect and Its Applications; Institue of Physics Publishing: Bristol, UK, 2003. [Google Scholar]
- Gschneidner, K., Jr.; Pecharsky, V.; Tsokol, A. Recent developments in magnetocaloric materials. Rep. Prog. Phys. 2005, 68, 1479–1539. [Google Scholar] [CrossRef]
- Pecharsky, V.K.; Gschneidner, K.A. Giant Magnetocaloric Effect in Gd5(Si2Ge2). Phys. Rev. Lett. 1997, 78, 4494–4497. [Google Scholar] [CrossRef]
- Wada, H.; Tanabe, Y. Giant magnetocaloric effect of MnAs1−xSbx. Appl. Phys. Lett. 2001, 79, 3302–3304. [Google Scholar] [CrossRef]
- Wada, H.; Morikawa, T.; Taniguchi, K.; Shibata, T.; Yamada, Y.; Akishige, Y. Giant magnetocaloric effect of MnAs1−x Sbx in the vicinity of first-order magnetic transition. Phys. B Condens. Matter 2003, 328, 114–116. [Google Scholar] [CrossRef]
- Tegus, O.; Brück, E.; Buschow, K.H.J.; de Boer, F.R. Transition-metal-based magnetic refrigerants for room-temperature applications. Nature 2002, 415, 150–152. [Google Scholar] [CrossRef] [PubMed]
- Trung, N.T.; Ou, Z.Q.; Gortenmulder, T.J.; Tegus, O.; Buschow, K.H.J.; Brück, E. Tunable thermal hysteresis in MnFe(P,Ge) compounds. Appl. Phys. Lett. 2009, 94, 102513. [Google Scholar] [CrossRef]
- Cam Thanh, D.T.; Brück, E.; Trung, N.T.; Klaasse, J.C.P.; Buschow, K.H.J.; Ou, Z.Q.; Tegus, O.; Caron, L. Structure, magnetism, and magnetocaloric properties of MnFeP1−xSix compounds. J. Appl. Phys. 2008, 103, 07B318. [Google Scholar] [CrossRef]
- Hu, F.; Shen, B.; Sun, J.; Cheng, Z.; Rao, G.; Zhang, X. Influence of negative lattice expansion and metamagnetic transition on magnetic entropy change in the compound LaFe11.4Si1.6. Appl. Phys. Lett. 2001, 78, 3675. [Google Scholar] [CrossRef]
- Hu, F.X.; Ilyn, M.; Tishin, A.M.; Sun, J.R.; Wang, G.J.; Chen, Y.F.; Wang, F.; Cheng, Z.H.; Shen, B.G. Direct measurements of magnetocaloric effect in the first-order system LaFe11.7Si1.3. J. Appl. Phys. 2003, 93, 5503. [Google Scholar] [CrossRef]
- Fujita, A.; Fujieda, S.; Hasegawa, Y.; Fukamichi, K. Itinerant-electron metamagnetic transition and large magnetocaloric effects in La(FexSi1−x)13 compounds and their hydrides. Phys. Rev. B 2003, 67, 104416. [Google Scholar] [CrossRef]
- Guillou, F.; Yibole, H.; Porcari, G.; Zhang, L.; van Dijk, N.H.; Brück, E. Magnetocaloric effect, cyclability and coefficient of refrigerant performance in the MnFe(P,Si,B) system. J. Appl. Phys. 2014, 116, 063903. [Google Scholar] [CrossRef]
- Thang, N.; Miao, X.; van Dijk, N.; Brück, E. Structural and magnetocaloric properties of (Mn,Fe)2(P,Si) materials with added nitrogen. J. Alloys Compd. 2016, 670, 123–127. [Google Scholar] [CrossRef]
- Liu, J.; Gottschall, T.; Skokov, K.P.; Moore, J.D.; Gutfleisch, O. Giant magnetocaloric effect driven by structural transitions. Nat. Mater. 2012, 11, 620–626. [Google Scholar] [CrossRef] [PubMed]
- Nikitin, S.A.; Myalikgulyev, G.; Tishin, A.M.; Annaorazov, M.P.; Asatryan, K.A.; Tyurin, A.L. The magnetocaloric effect in Fe49Rh51 compound. Phys. Lett. A 1990, 148, 363–366. [Google Scholar] [CrossRef]
- Quintana-Nedelcos, A.; Sánchez Llamazares, J.; Flores-Zuñiga, H. On the magnetostructural transition in MnCoGeBx alloy ribbons. J. Alloys Compd. 2015, 644, 1003–1008. [Google Scholar] [CrossRef]
- Zhang, D.; Nie, Z.; Wang, Z.; Huang, L.; Zhang, Q.; Wang, Y.D. Giant magnetocaloric effect in MnCoGe with minimal Ga substitution. J. Magn. Magn. Mater. 2015, 387, 107–110. [Google Scholar] [CrossRef]
- Chen, J.; Wei, Z.; Liu, E.; Qi, X.; Wang, W.; Wu, G. Structural and magnetic properties of MnCo1−xFexSi alloys. J. Magn. Magn. Mater. 2015, 387, 159–164. [Google Scholar] [CrossRef]
- Miao, X.F.; Caron, L.; Roy, P.; Dung, N.H.; Zhang, L.; Kockelmann, W.A.; de Groot, R.A.; van Dijk, N.H.; Brück, E. Tuning the phase transition in transition-metal-based magnetocaloric compounds. Phys. Rev. B 2014, 89, 174429. [Google Scholar] [CrossRef]
- Dung, N. Moment Formation and Giant Magnetocaloric Effects in Hexagonal Mn-Fe-P-Si Compounds. Ph.D. Thesis, TU Delft, Delft, The Netherlands, 2012. [Google Scholar]
- Wada, H.; Takahara, T.; Katagiri, K.; Ohnishi, T.; Soejima, K.; Yamashita, K. Recent progress of magnetocaloric effect and magnetic refrigerant materials of Mn compounds (invited). J. Appl. Phys. 2015, 117, 172606. [Google Scholar] [CrossRef]
- Guillou, F.; Porcari, G.; Yibole, H.; van Dijk, N.; Brück, E. Taming the first-order transition in giant magnetocaloric materials. Adv. Mater. 2014, 26, 2671–2675. [Google Scholar] [CrossRef] [PubMed]
- Guillou, F.; Yibole, H.; van Dijk, N.; Brück, E. Effect of boron substitution on the ferromagnetic transition of MnFe0.95P2/3Si1/3. J. Alloys Compd. 2015, 632, 717–722. [Google Scholar] [CrossRef]
- Guillou, F.; Yibole, H.; van Dijk, N.; Zhang, L.; Hardy, V.; Brück, E. About the mechanical stability of MnFe(P,Si,B) giant-magnetocaloric materials. J. Alloys Compd. 2014, 617, 569–574. [Google Scholar] [CrossRef]
- Ou, Z. Magnetic Structure and Phase Formation of Magnetocaloric Mn-Fe-P-X Compounds. Ph.D. Thesis, TU Delft, Delft, The Netherlands, 2013. [Google Scholar]
- Huliyageqi, B.; Geng, Y.X.; Li, Y.J.; Tegus, O. A significant reduction of hysteresis in MnFe(P,Si) compounds. J. Korean Phys. Soc. 2013, 63, 525–528. [Google Scholar] [CrossRef]
- Tocado, L.; Palacios, E.; Burriel, R. Entropy determinations and magnetocaloric parameters in systems with first-order transitions: Study of MnAs. J. Appl. Phys. 2009, 105, 093918. [Google Scholar] [CrossRef]
- Carvalho, A.M.G.; Coelho, A.; von Ranke, P.; Alves, C. The isothermal variation of the entropy (ΔST) may be miscalculated from magnetization isotherms in some cases: MnAs and Gd5Ge2Si2 compounds as examples. J. Alloys Compd. 2011, 509, 3452–3456. [Google Scholar] [CrossRef]
- Yibole, H.; Guillou, F.; Zhang, L.; van Dijk, N.H.; Brück, E. Direct measurement of the magnetocaloric effect in MnFe(P, X) (X = As, Ge, Si) materials. J. Phys. D Appl. Phys. 2014, 47, 075002. [Google Scholar] [CrossRef]
- Commodity and Metal Prices. Available online: http://www.infomine.com/investment/metal-prices/ (accessed on 20 December 2016).
- Dung, N.H.; Zhang, L.; Ou, Z.Q.; Zhao, L.; van Eijck, L.; Mulders, A.M.; Avdeev, M.; Suard, E.; van Dijk, N.H.; Brück, E. High/low-moment phase transition in hexagonal Mn-Fe-P-Si compounds. Phys. Rev. B 2012, 86, 045134. [Google Scholar] [CrossRef]
- The FullProf Suite. Available online: http://www.ill.eu/sites/fullprof/index.html (accessed on 20 December 2016).
- Yibole, H. Nature of the First-Order Magnetic Phase Transition in Giant-Magnetocaloric Materials. Ph.D. Thesis, TU Delft, Delft, The Netherlands, 2016. [Google Scholar]


| z | (JKkg) | (K) | ||||
|---|---|---|---|---|---|---|
| = 0.5 T | = 1.0 T | = 1.5 T | = 2.0 T | |||
| 0.07 | 316 | 2.7 | 5.3 | 6.8 | 8.1 | 1.3 |
| 0.09 | 304 | 5.0 | 9.1 | 10.7 | 11.9 | 1.7 |
| 0.11 | 295 | 3.7 | 7.7 | 10.0 | 11.4 | 2.5 |
| 0.13 | 272 | 7.7 | 9.2 | 10.6 | 11.5 | 1.9 |
© 2016 by the authors. Licensee MDPI, Basel, Switzerland. This article is an open access article distributed under the terms and conditions of the Creative Commons Attribution (CC-BY) license ( http://creativecommons.org/licenses/by/4.0/).
Share and Cite
Thang, N.V.; Dijk, N.H.v.; Brück, E. Tuneable Giant Magnetocaloric Effect in (Mn,Fe)2(P,Si) Materials by Co-B and Ni-B Co-Doping. Materials 2017, 10, 14. https://doi.org/10.3390/ma10010014
Thang NV, Dijk NHv, Brück E. Tuneable Giant Magnetocaloric Effect in (Mn,Fe)2(P,Si) Materials by Co-B and Ni-B Co-Doping. Materials. 2017; 10(1):14. https://doi.org/10.3390/ma10010014
Chicago/Turabian StyleThang, Nguyen Van, Niels Harmen van Dijk, and Ekkes Brück. 2017. "Tuneable Giant Magnetocaloric Effect in (Mn,Fe)2(P,Si) Materials by Co-B and Ni-B Co-Doping" Materials 10, no. 1: 14. https://doi.org/10.3390/ma10010014
APA StyleThang, N. V., Dijk, N. H. v., & Brück, E. (2017). Tuneable Giant Magnetocaloric Effect in (Mn,Fe)2(P,Si) Materials by Co-B and Ni-B Co-Doping. Materials, 10(1), 14. https://doi.org/10.3390/ma10010014