
Effect of Energy Input on Microstructure and Mechanical Properties of Titanium Aluminide Alloy Fabricated by the Additive Manufacturing Process of Electron Beam Melting


Abstract
:1. Introduction
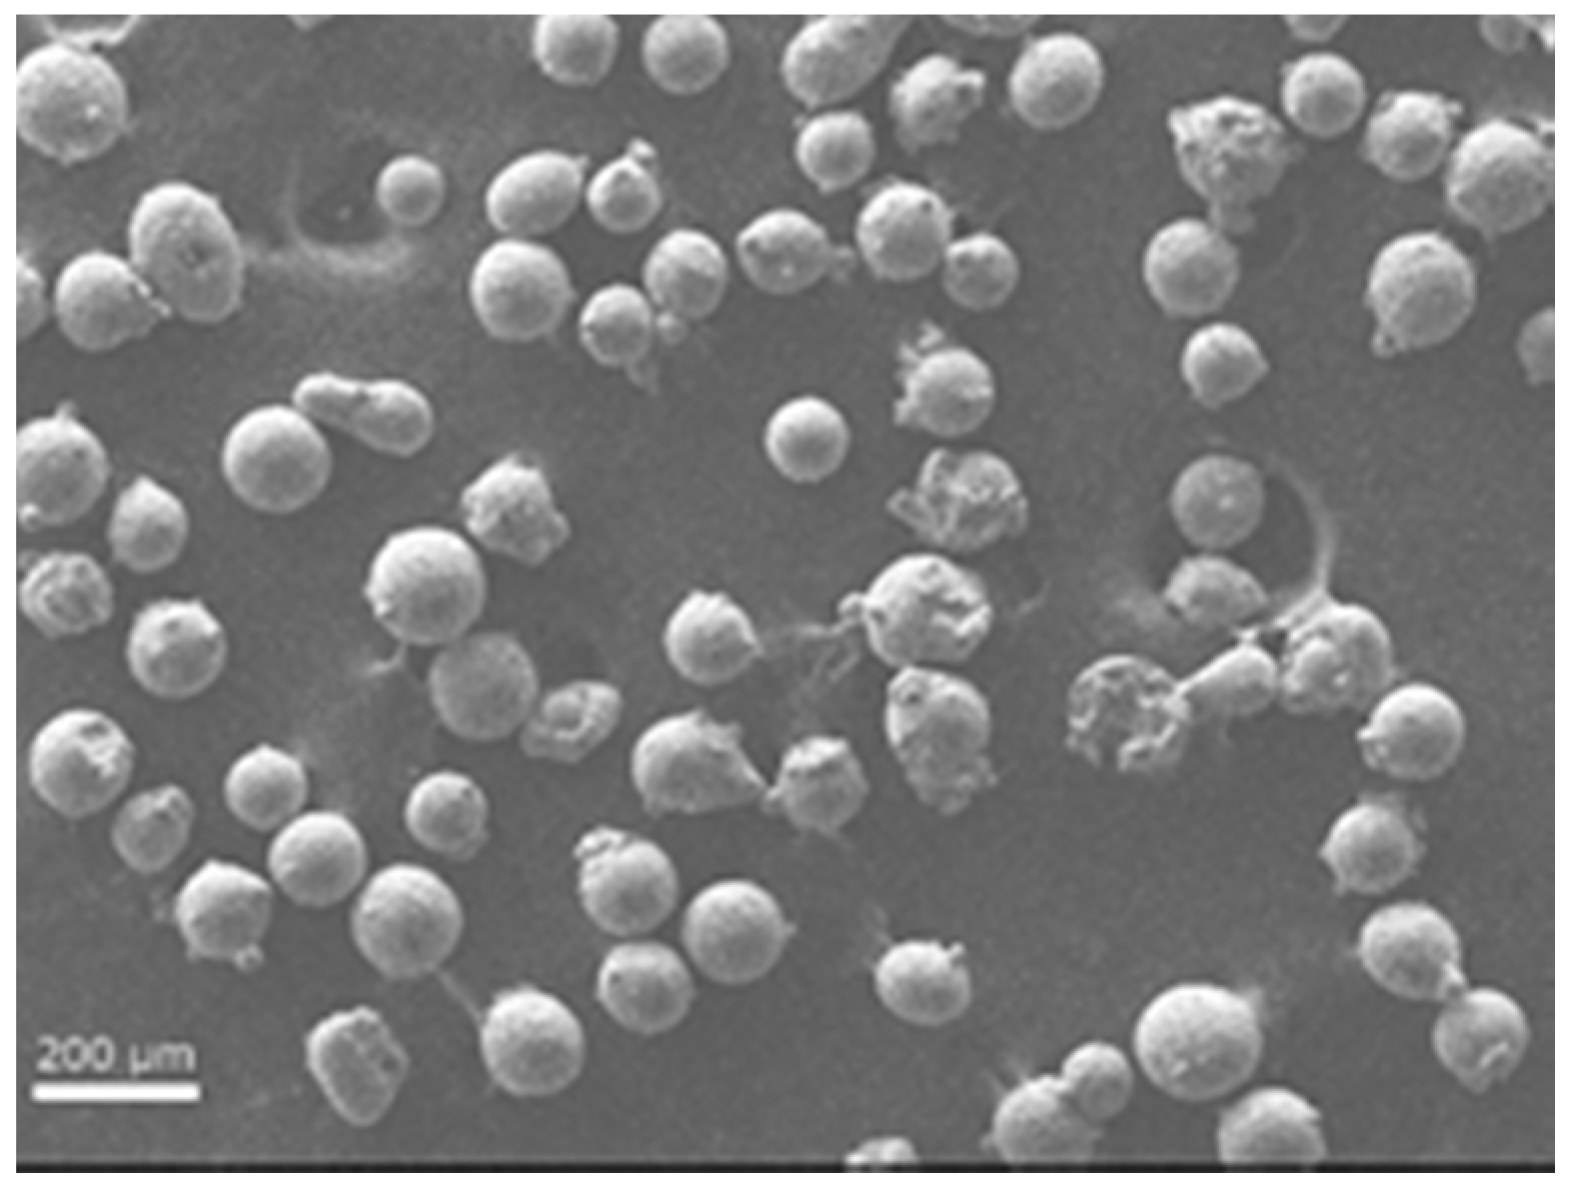
2. Materials and Methods
3. Results and Discussion
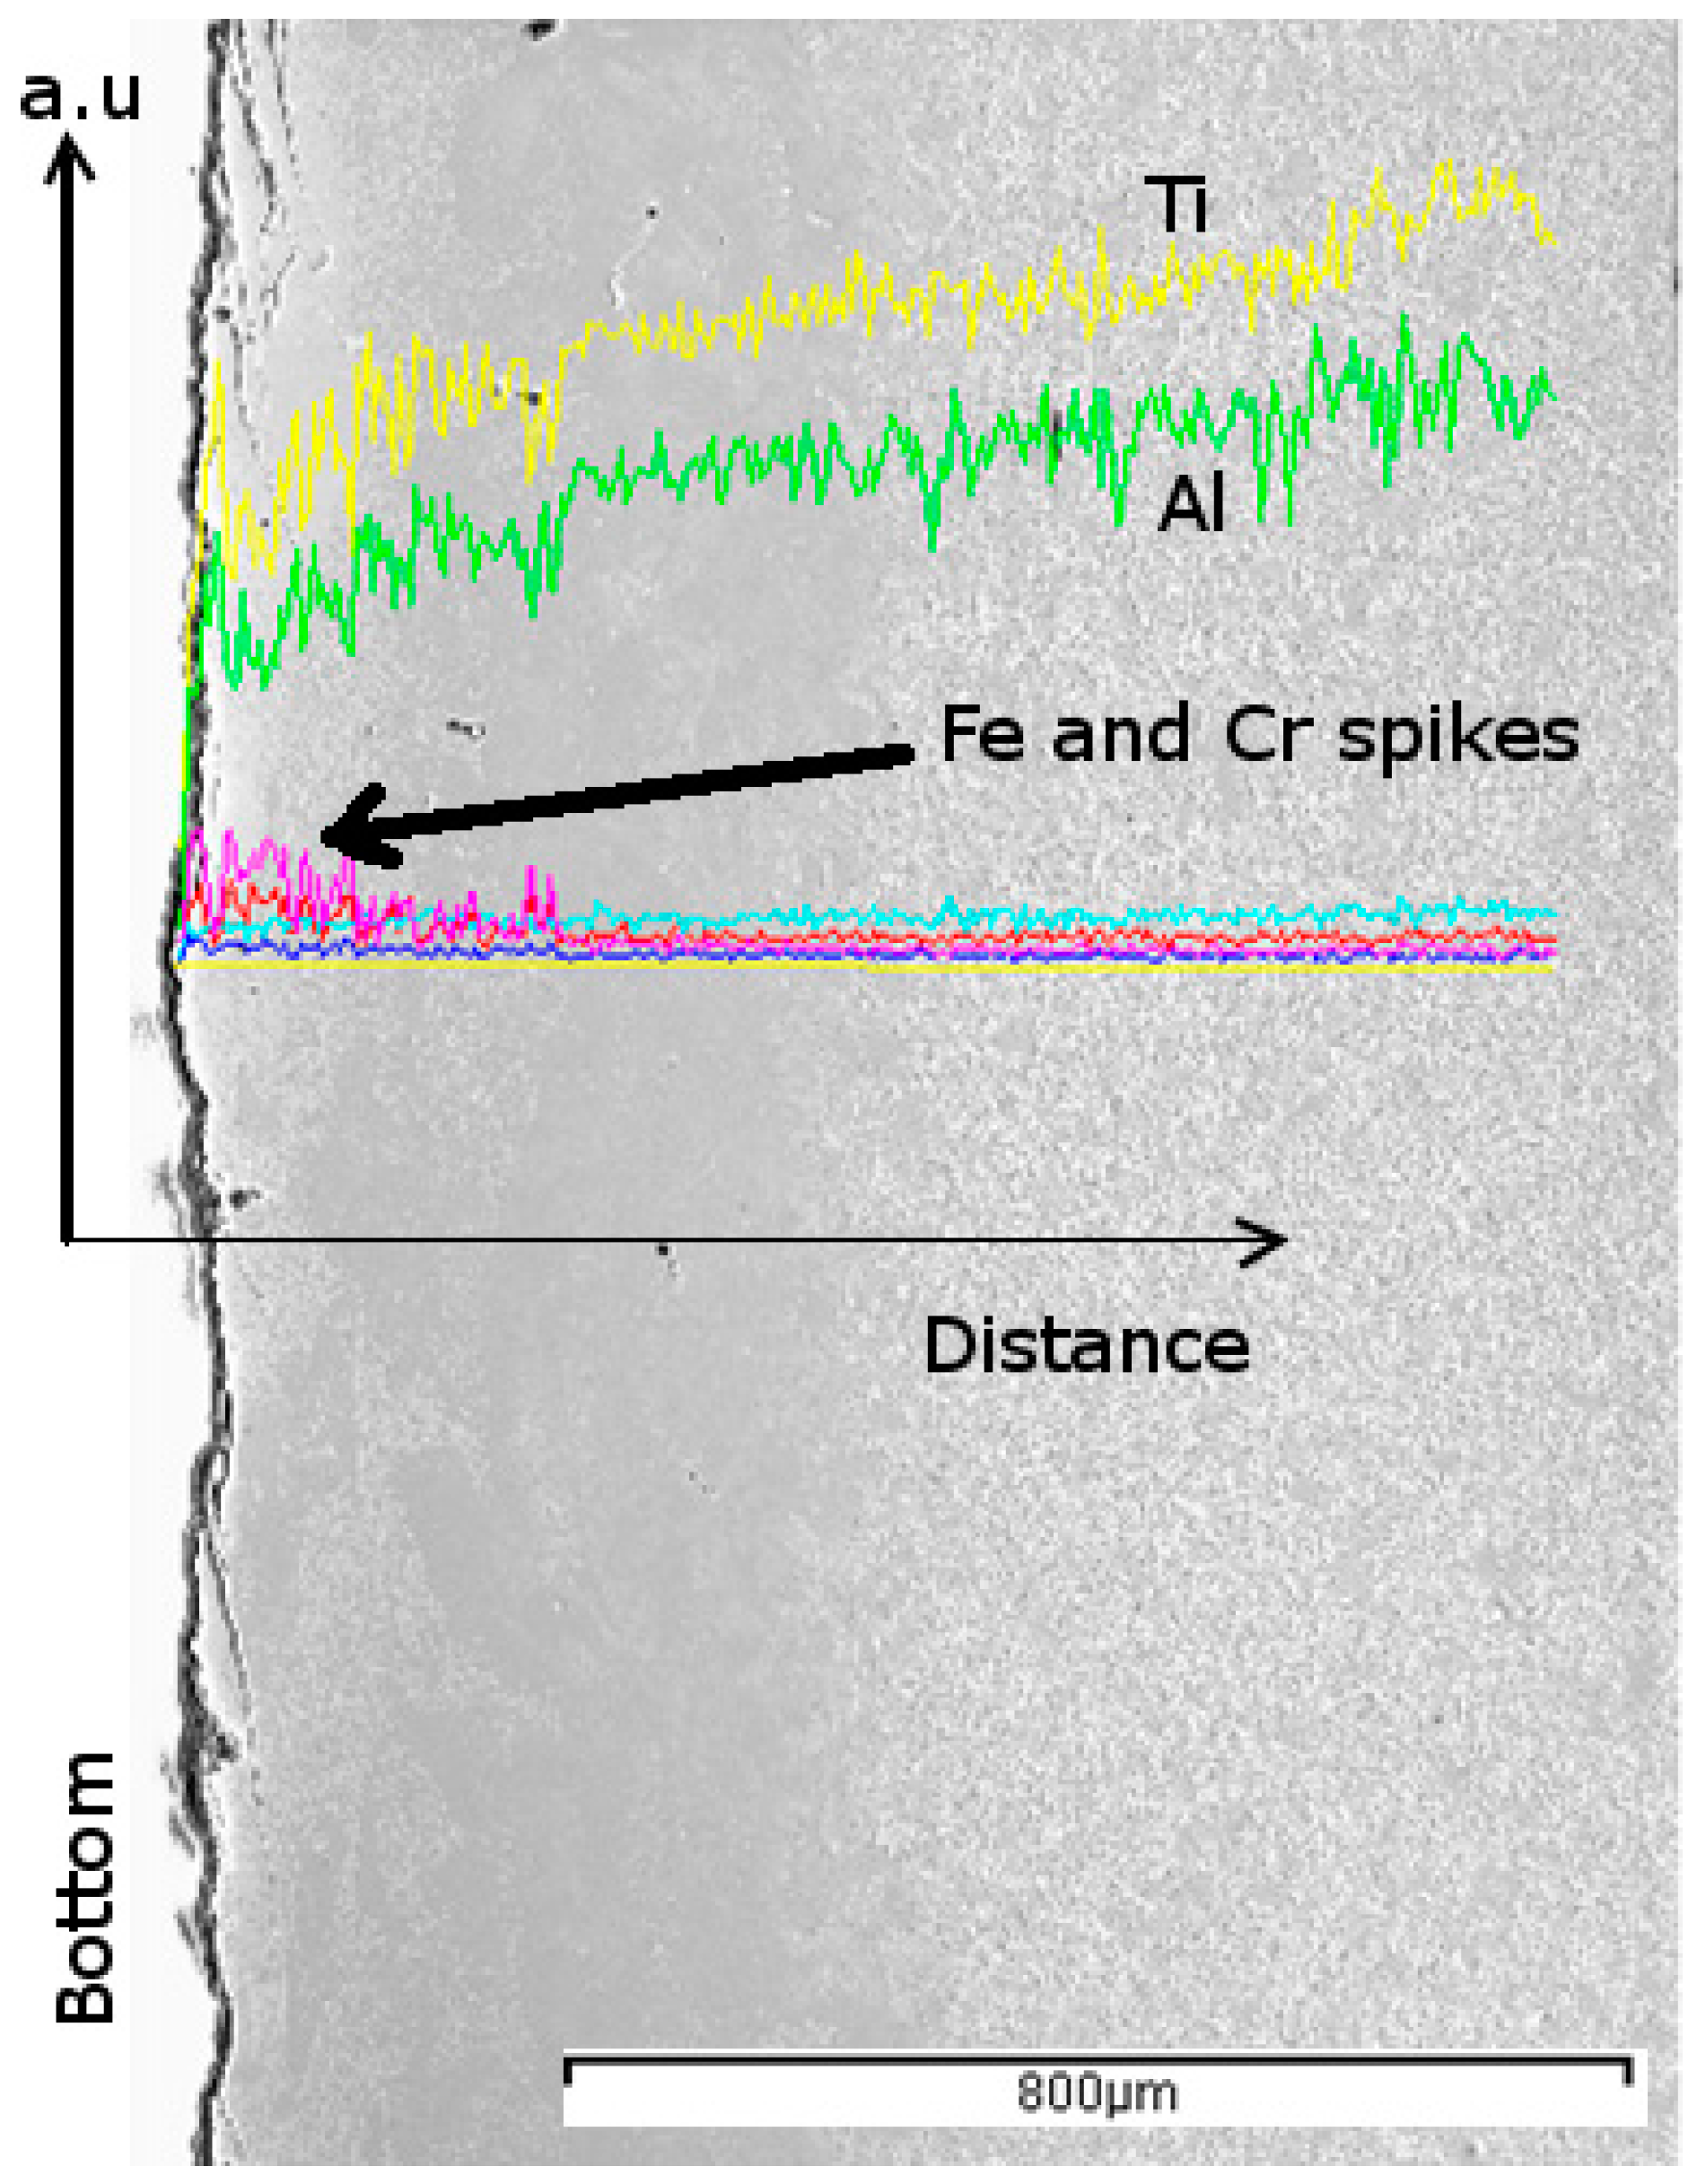
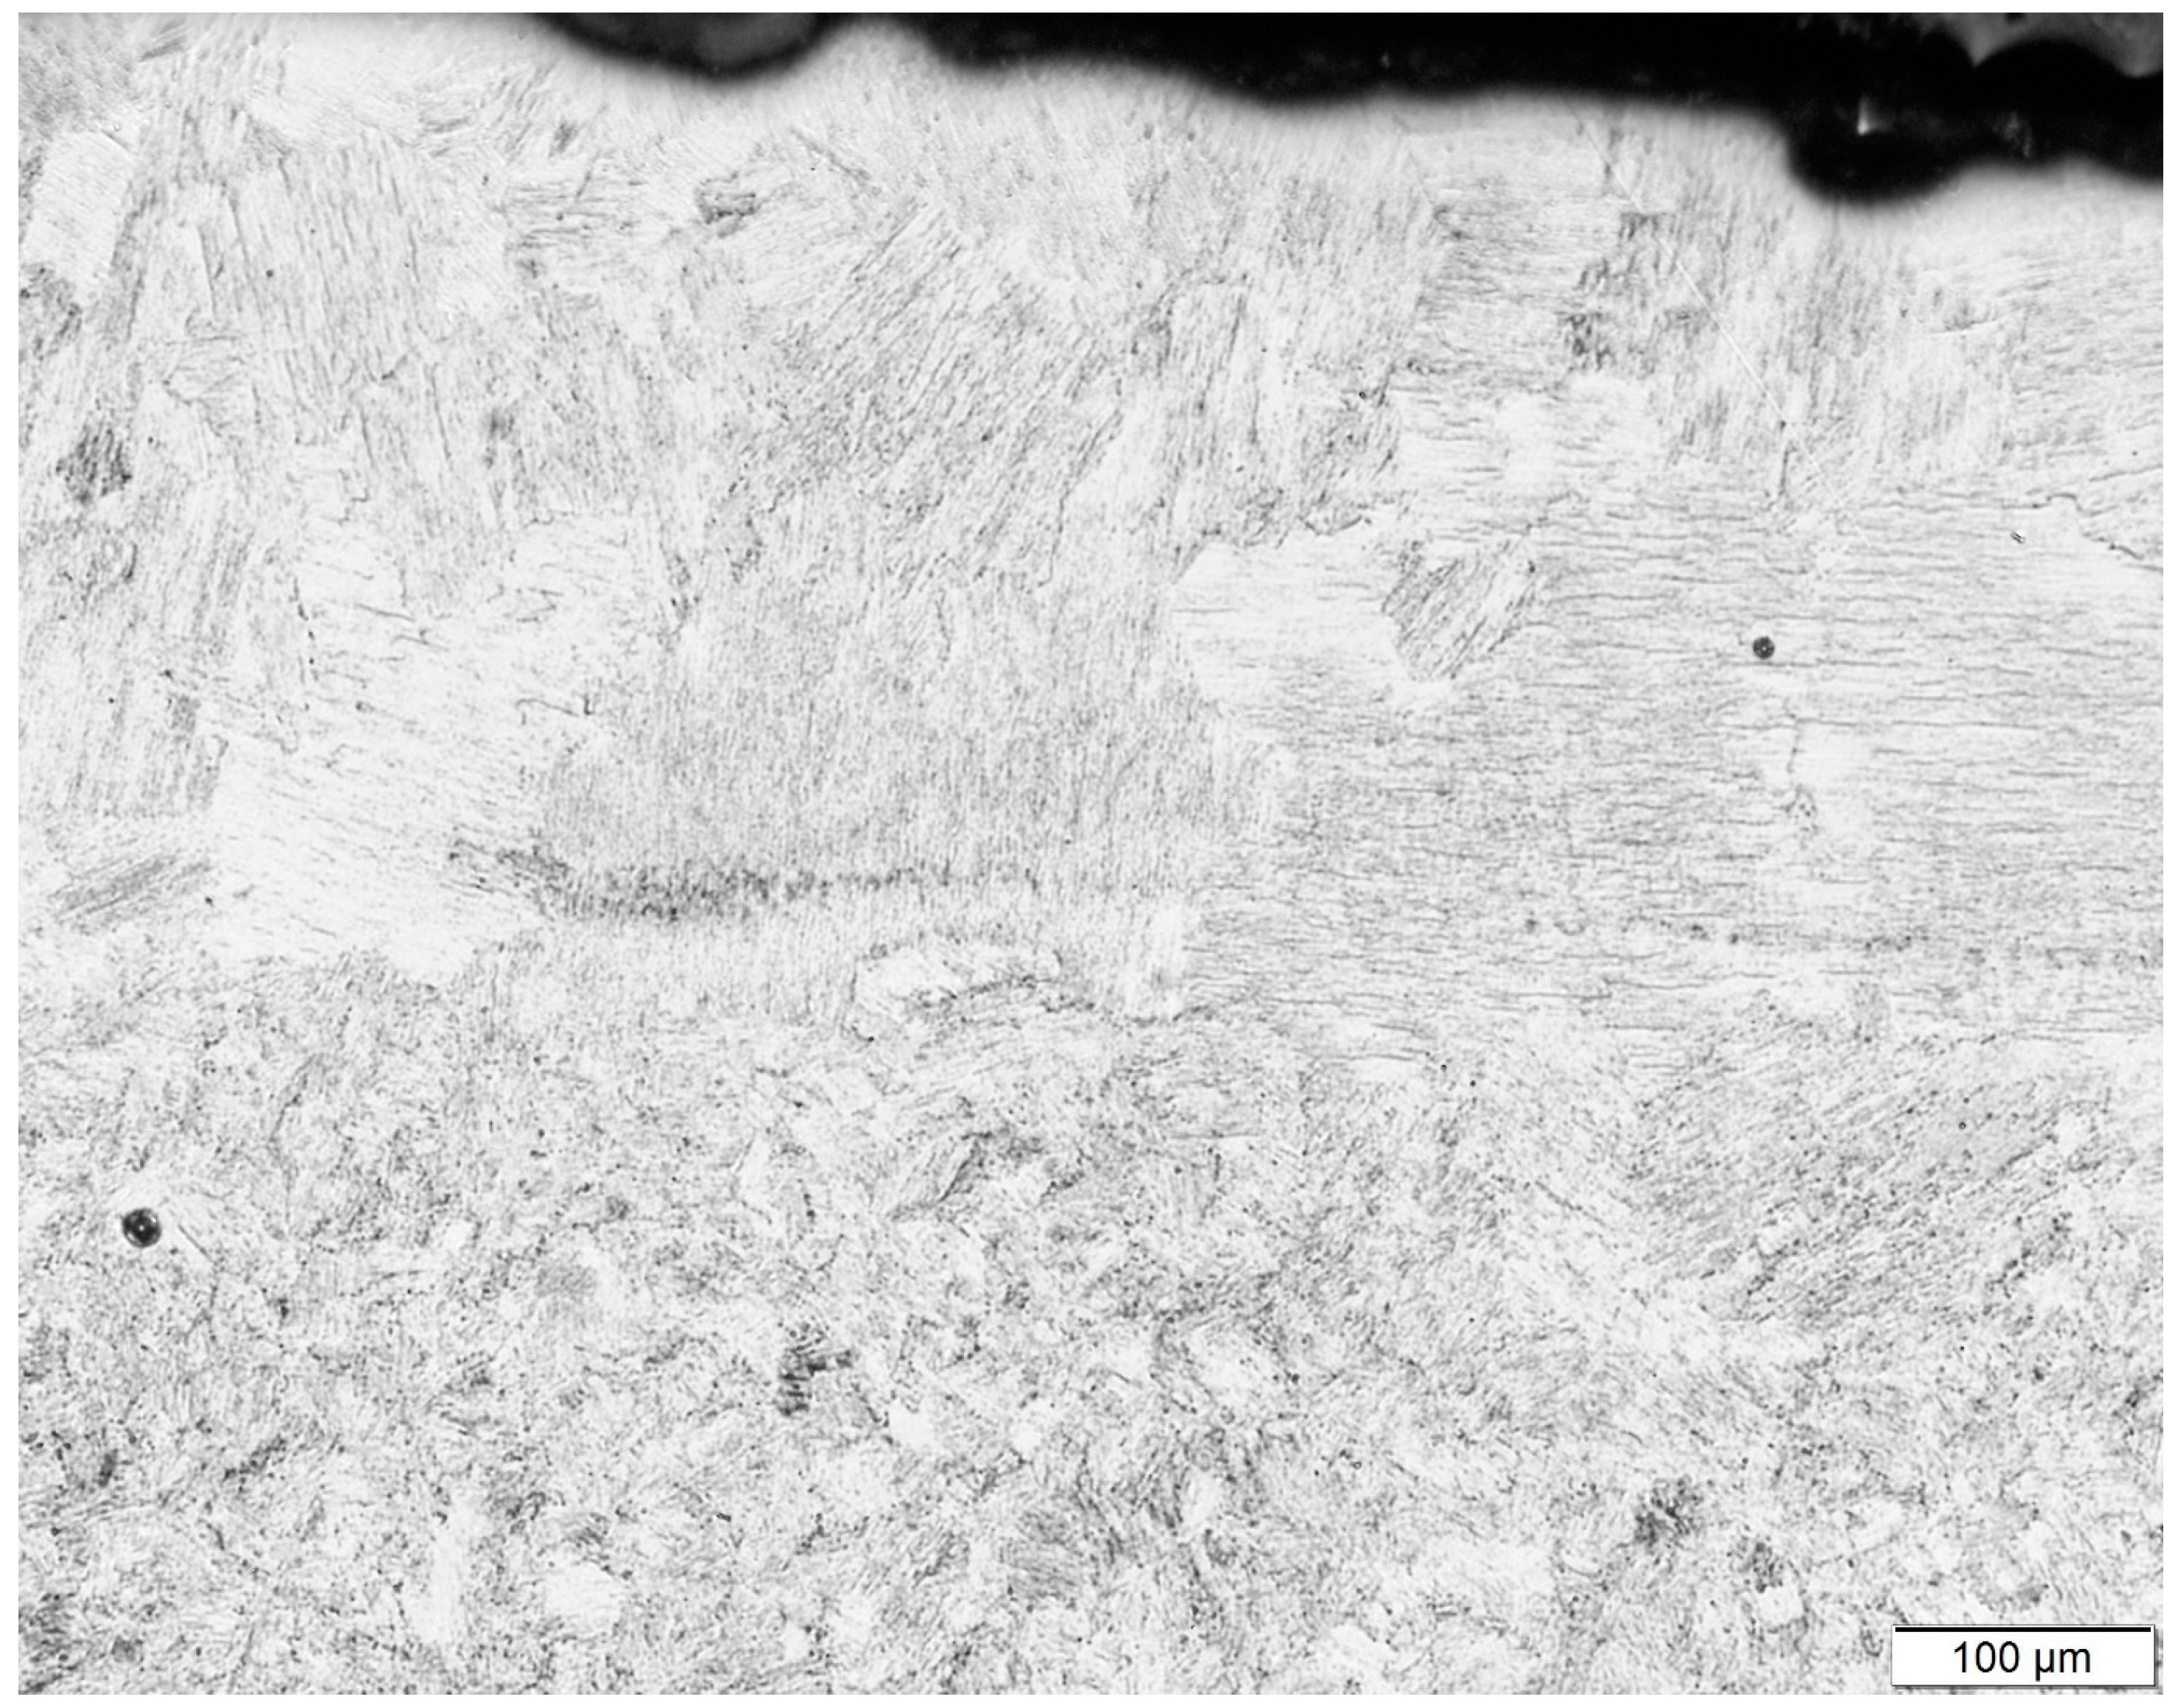
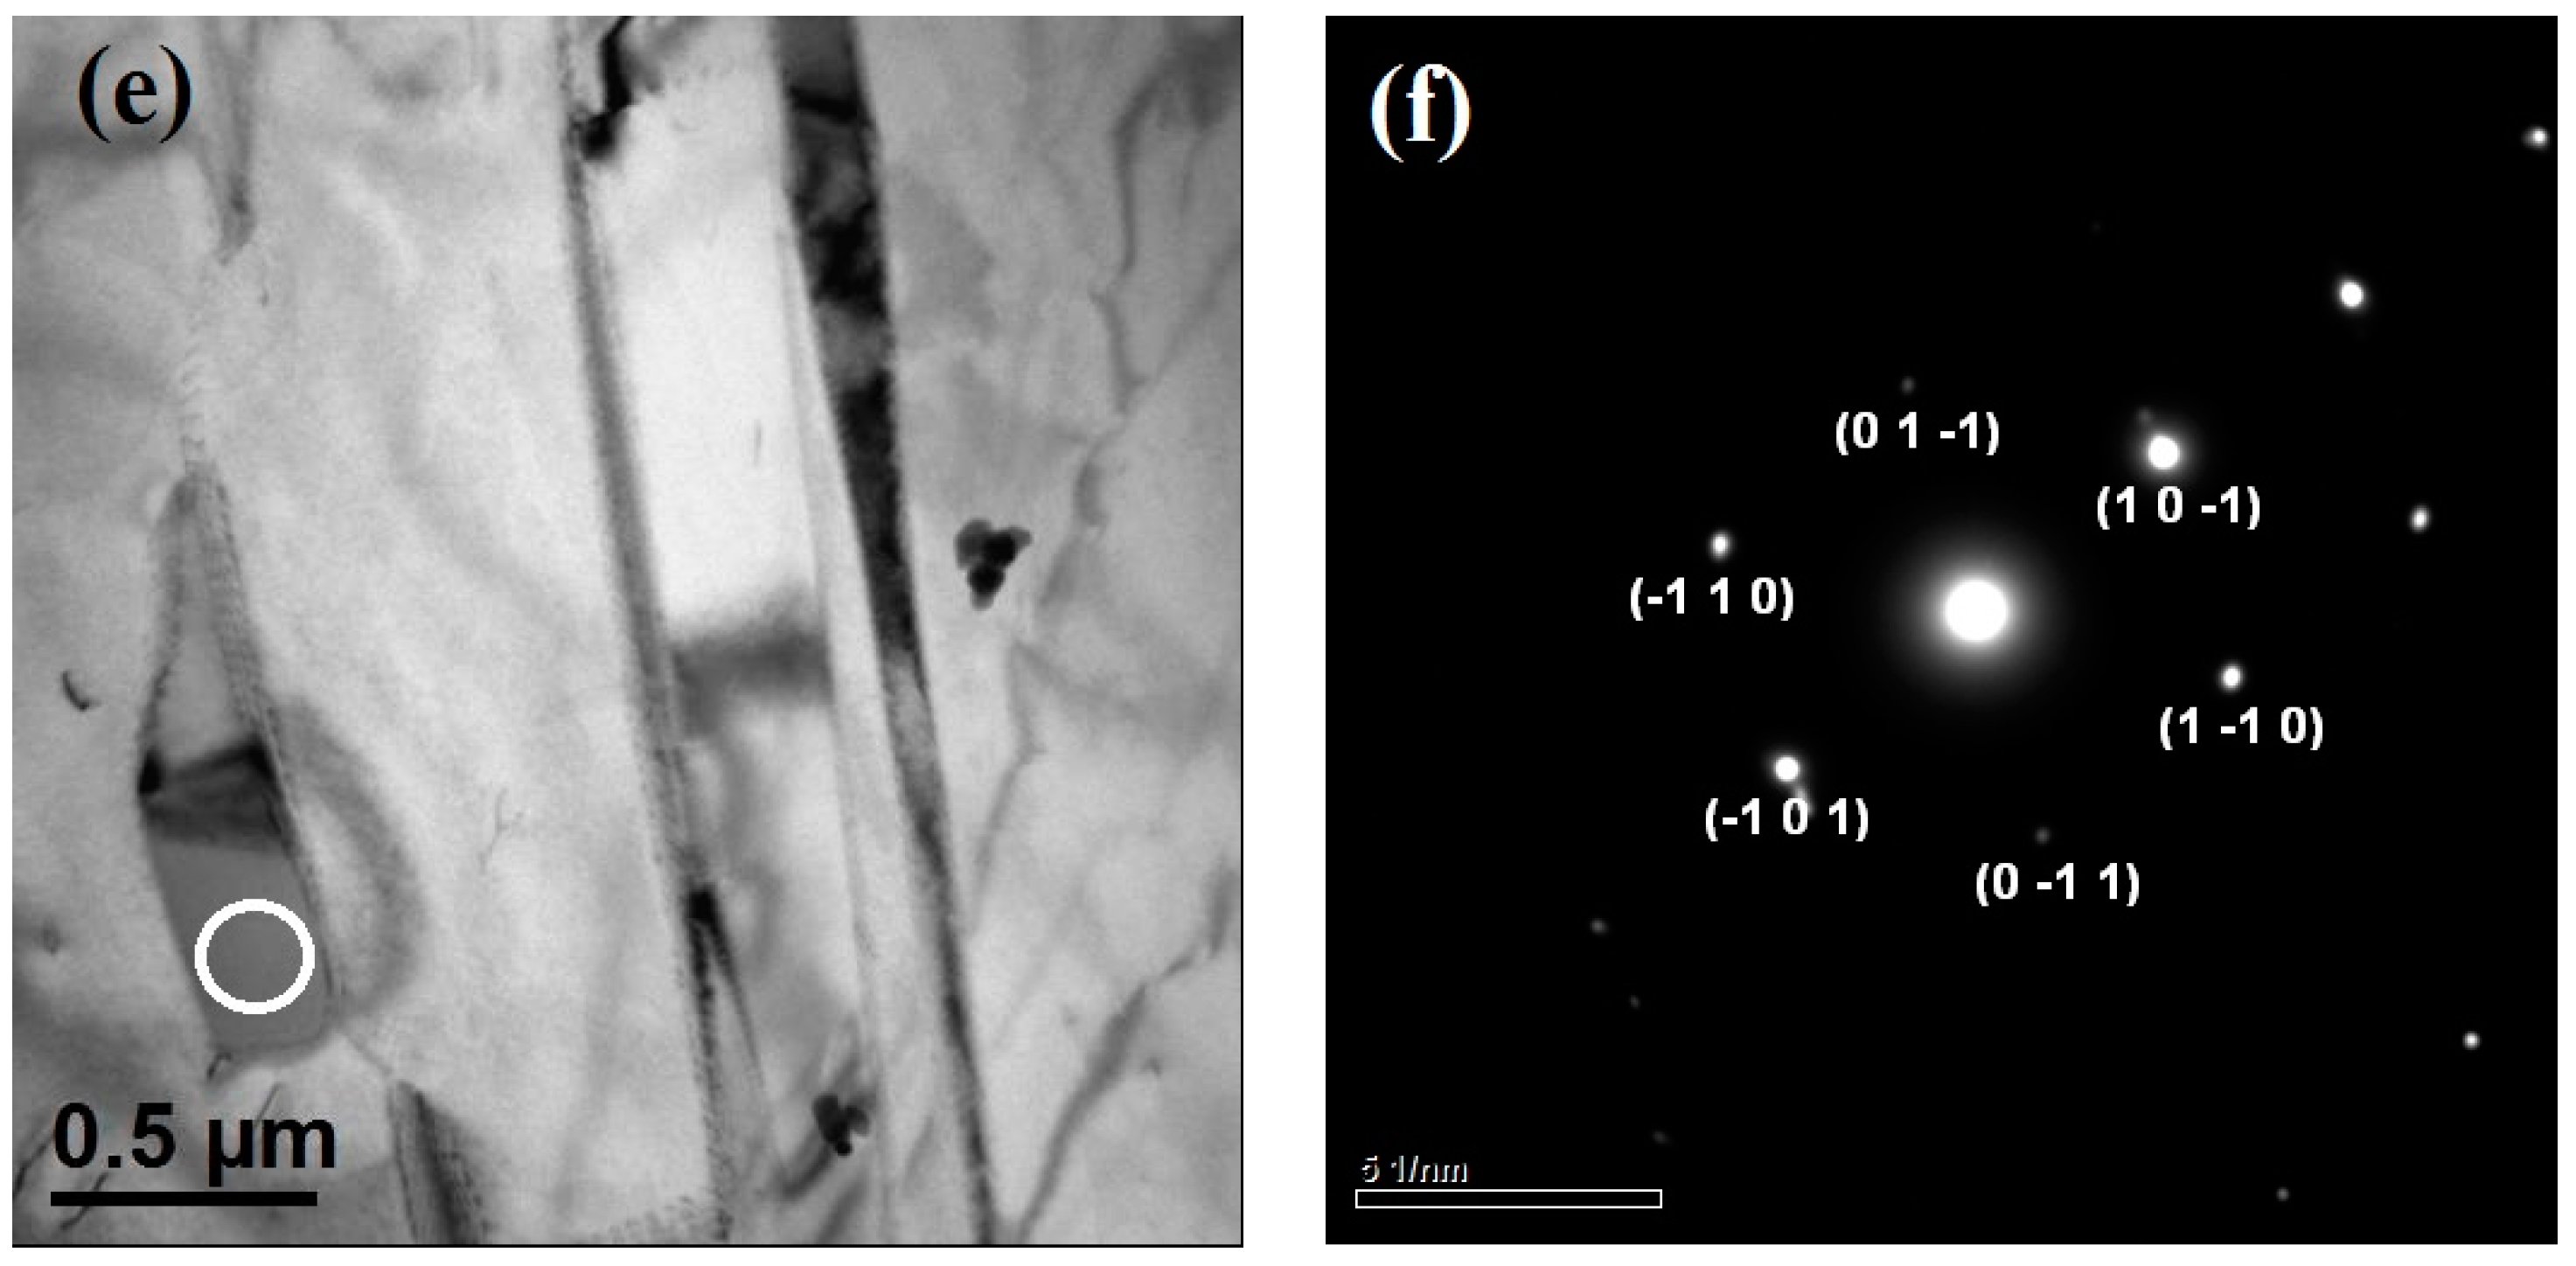
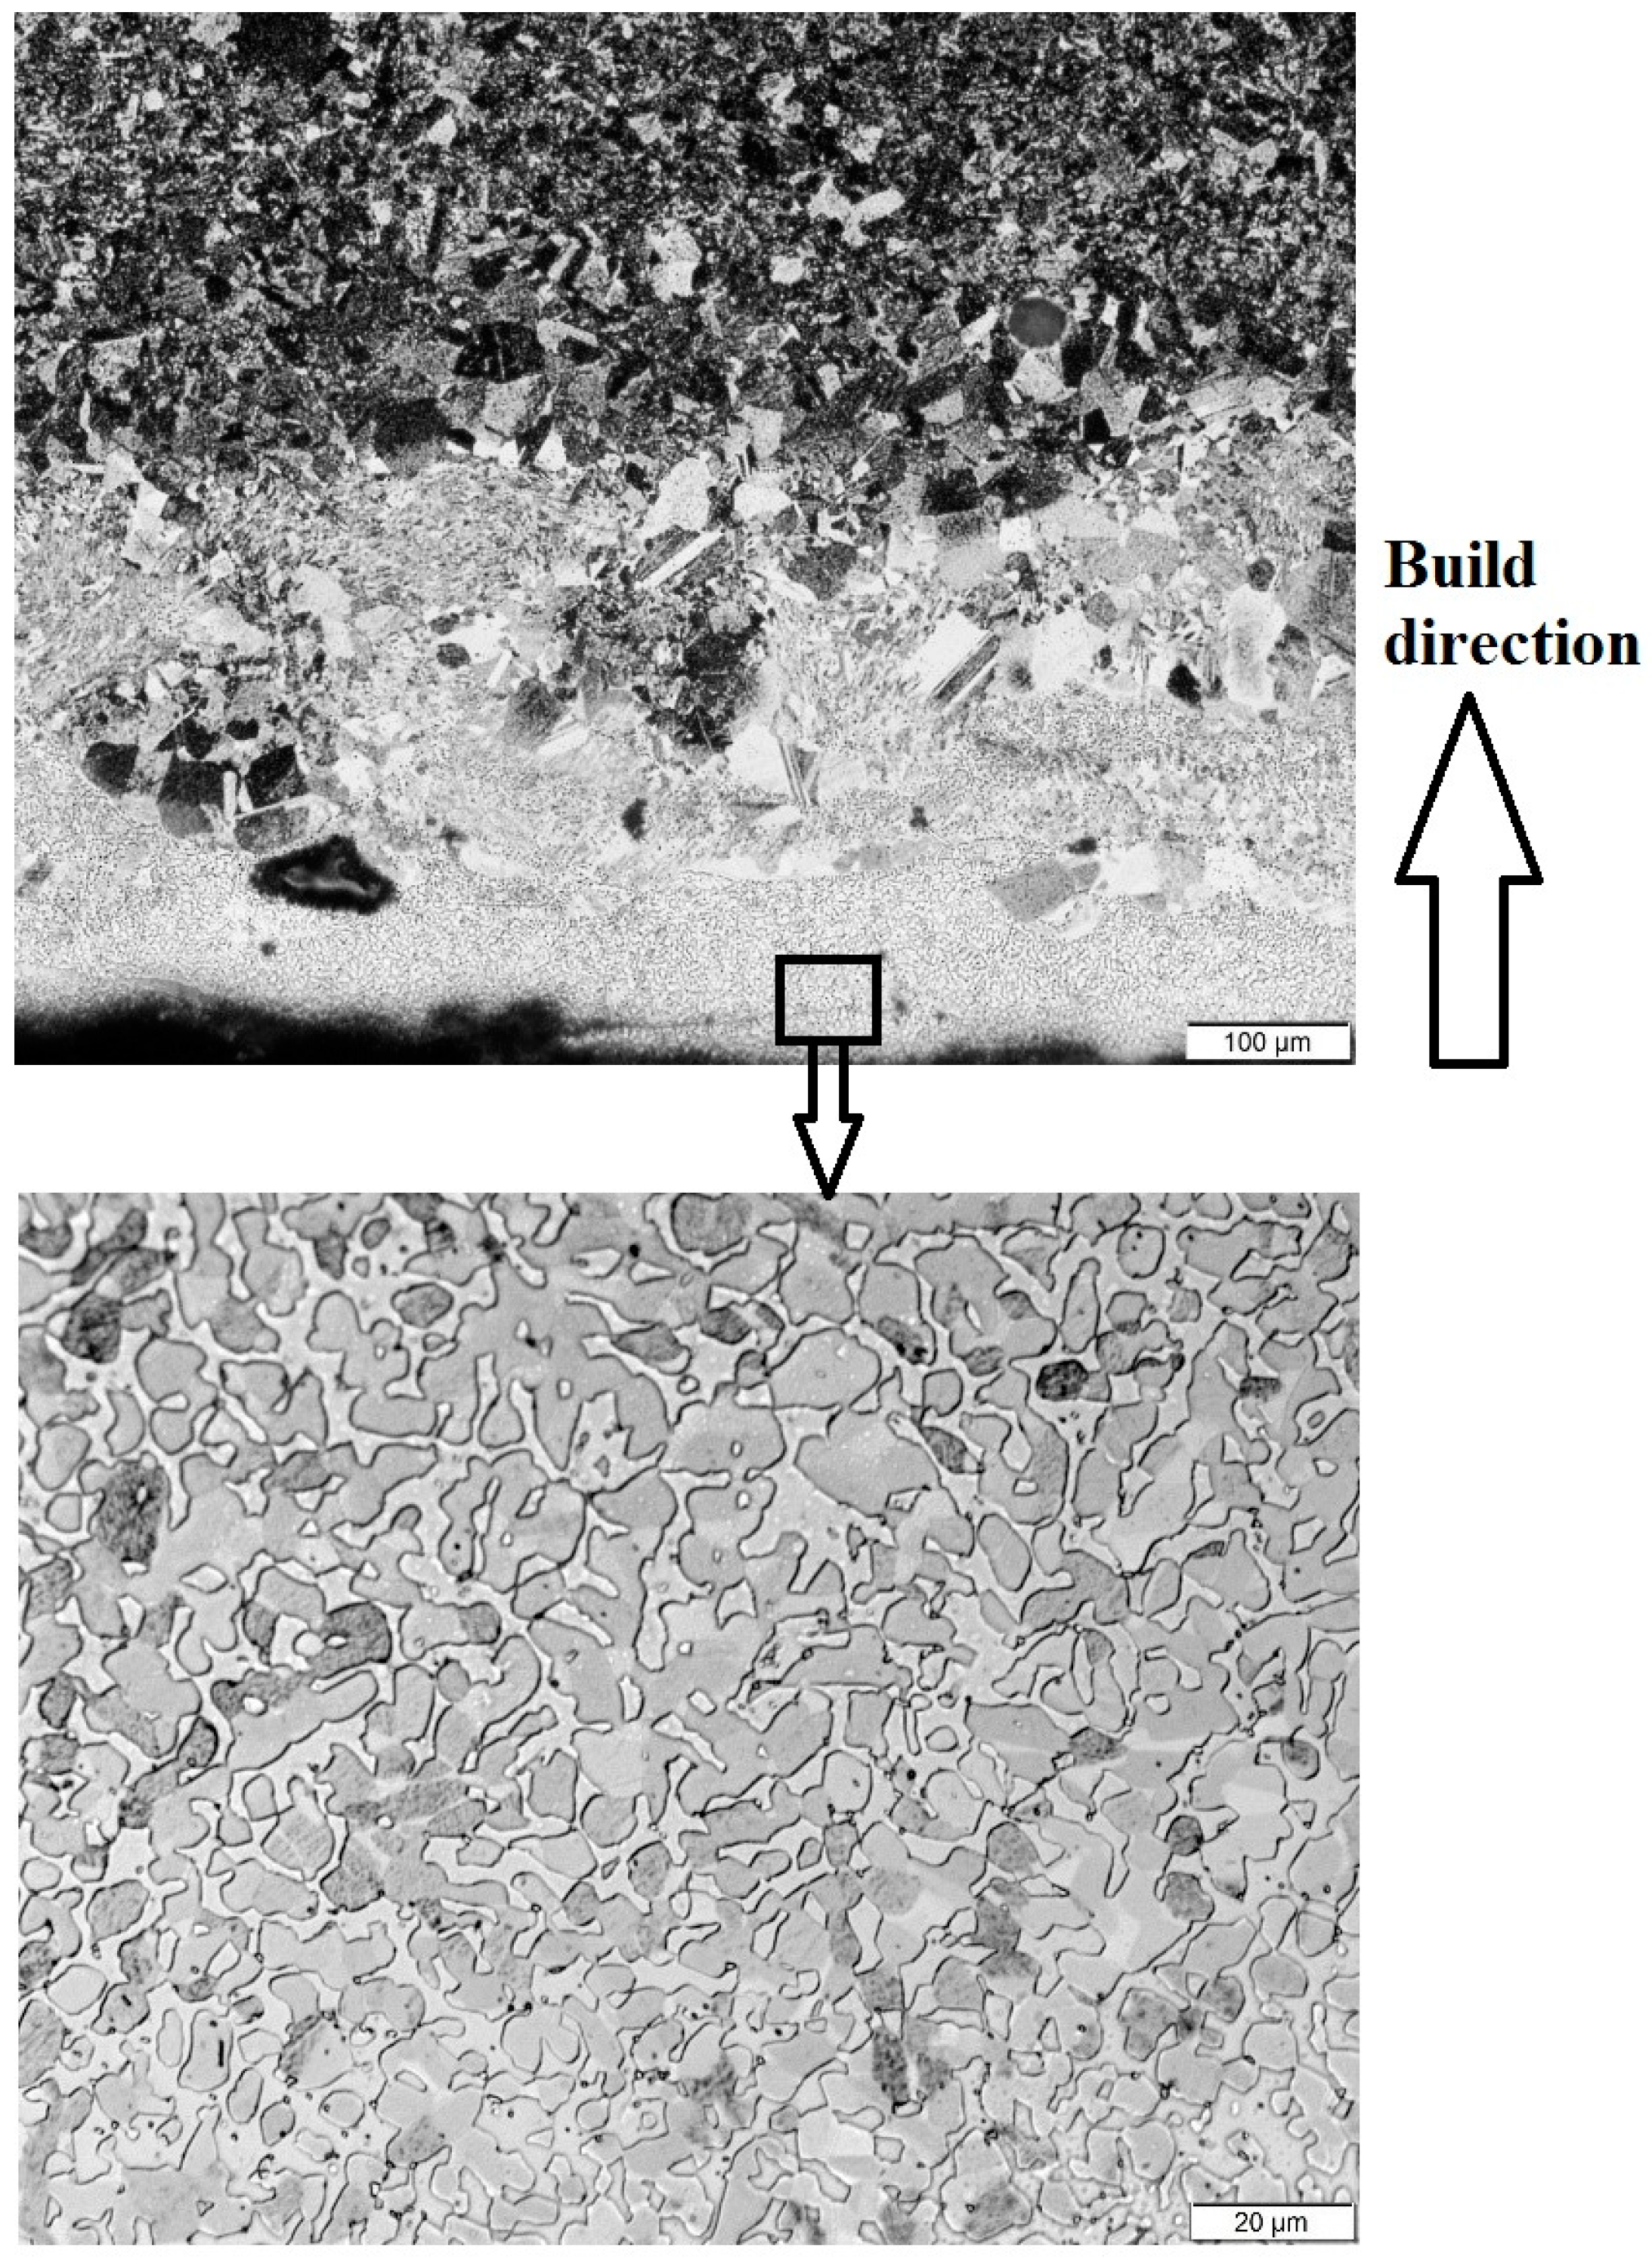
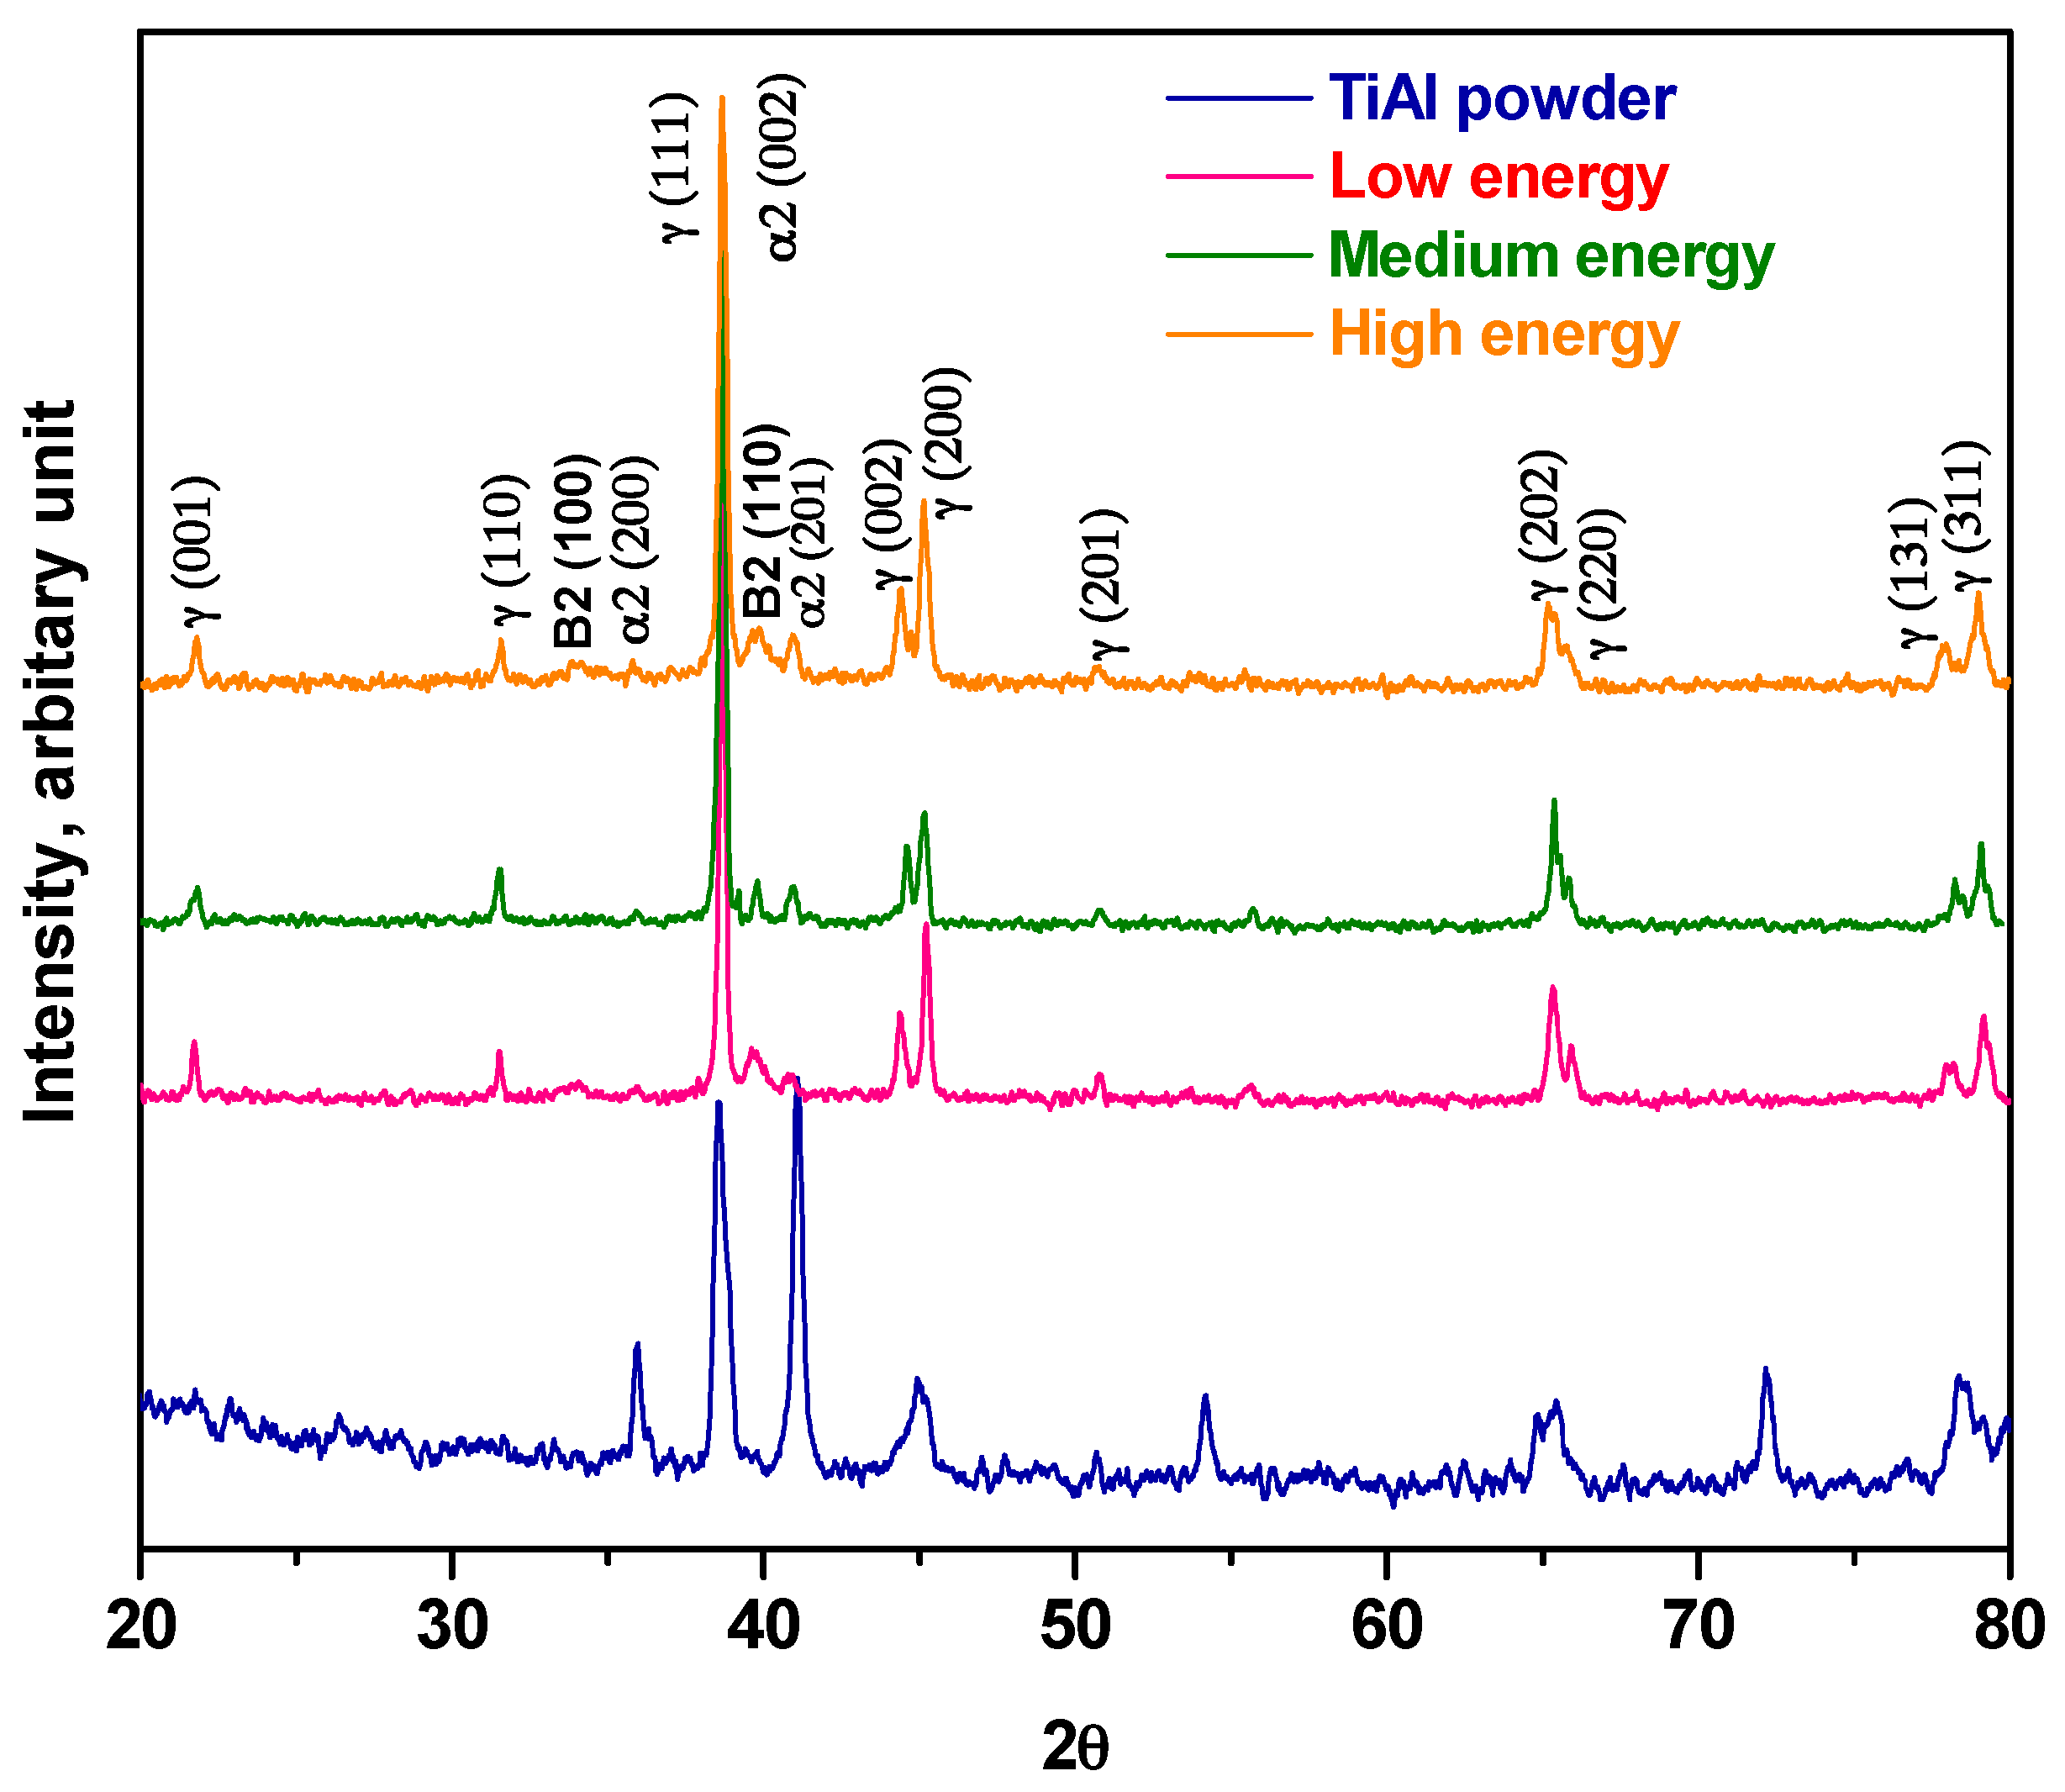
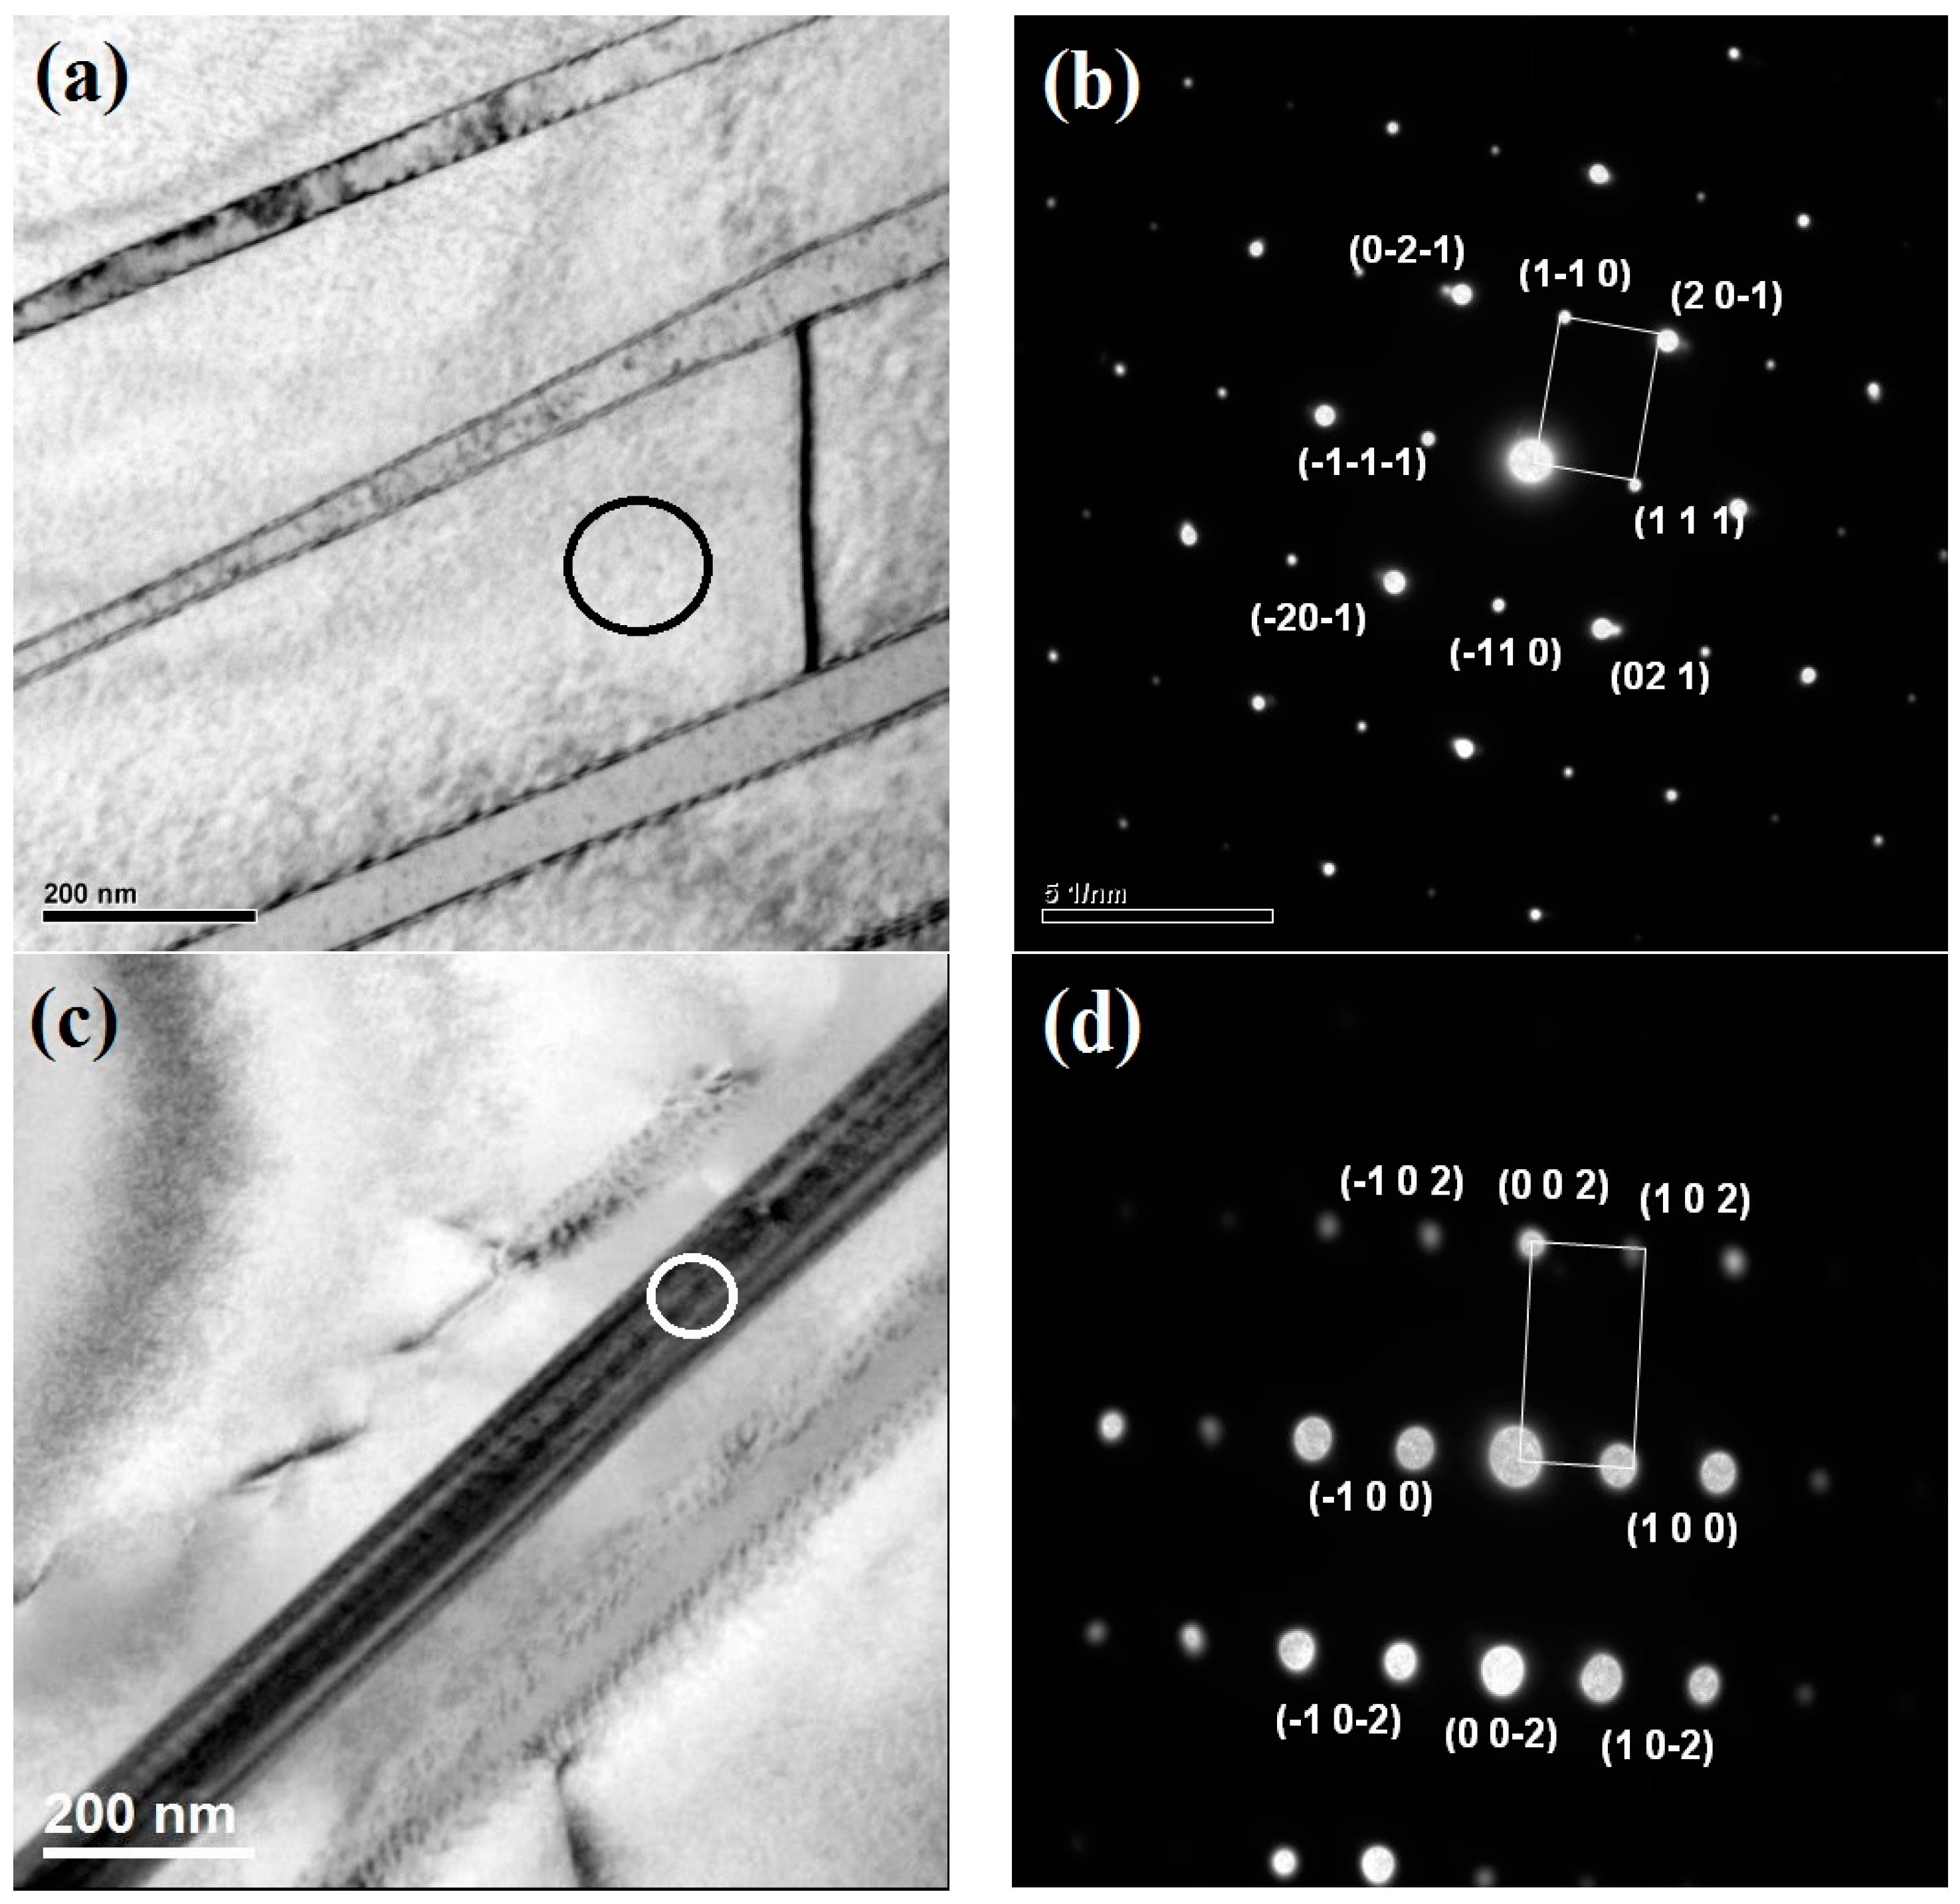
3.1. Microstructure
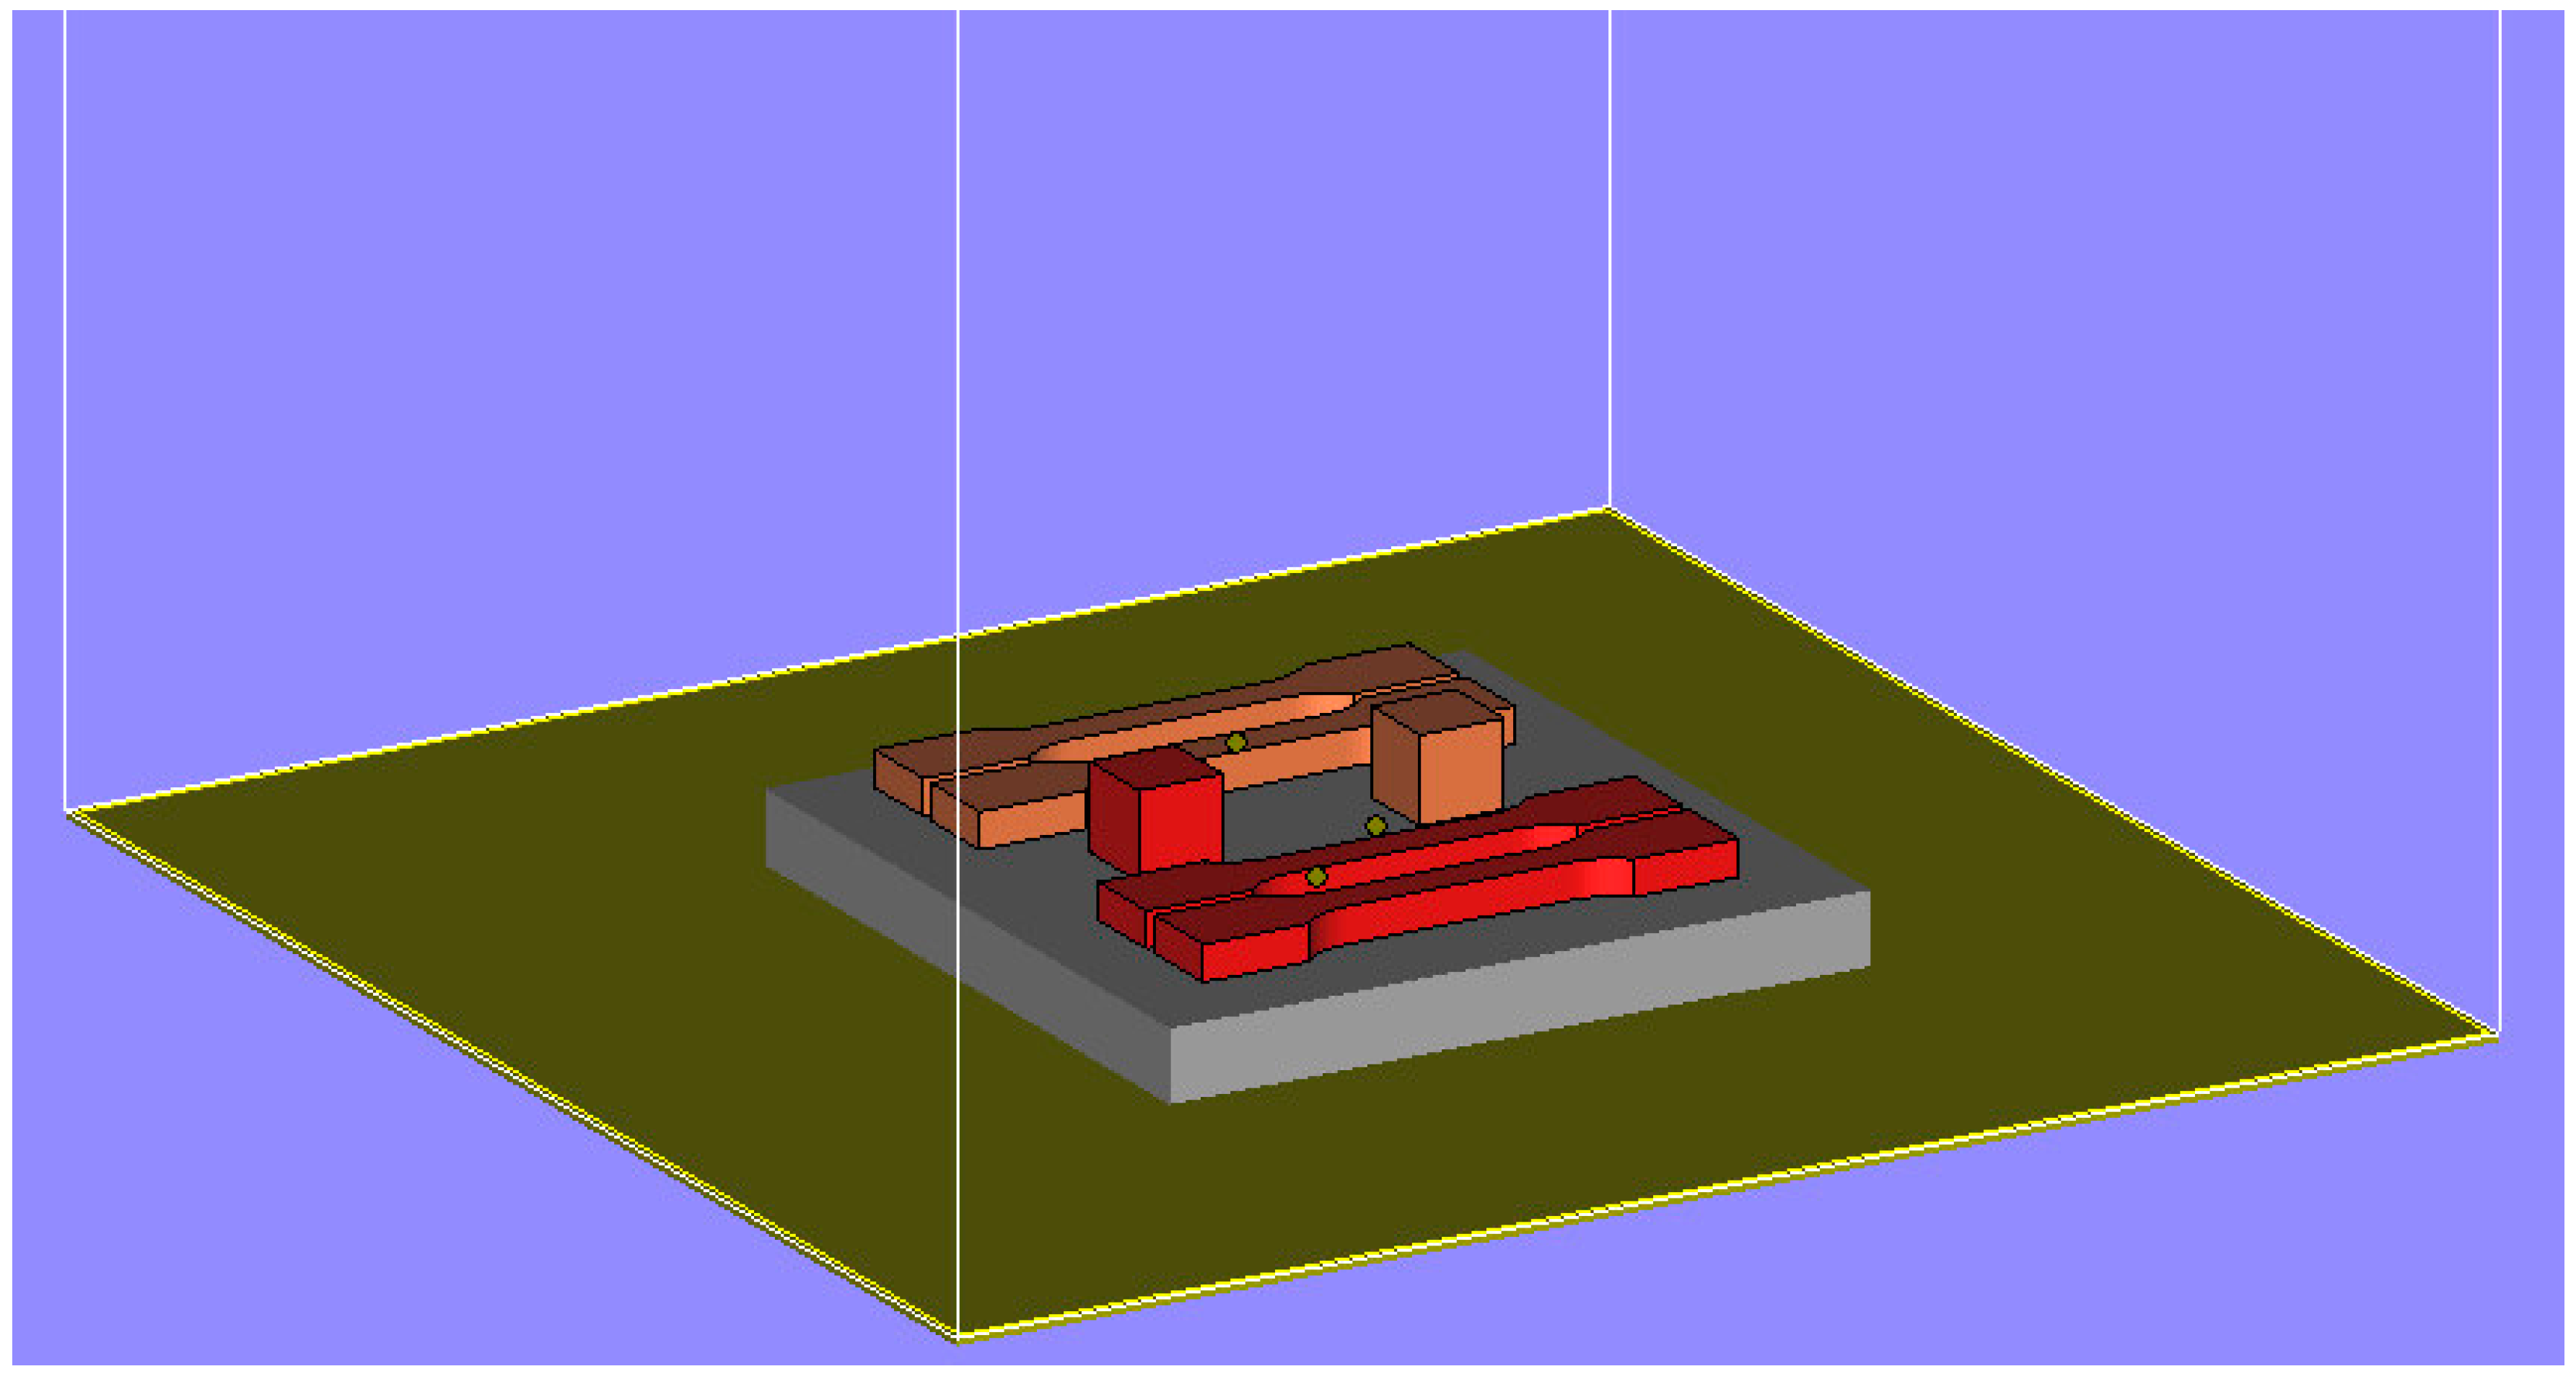
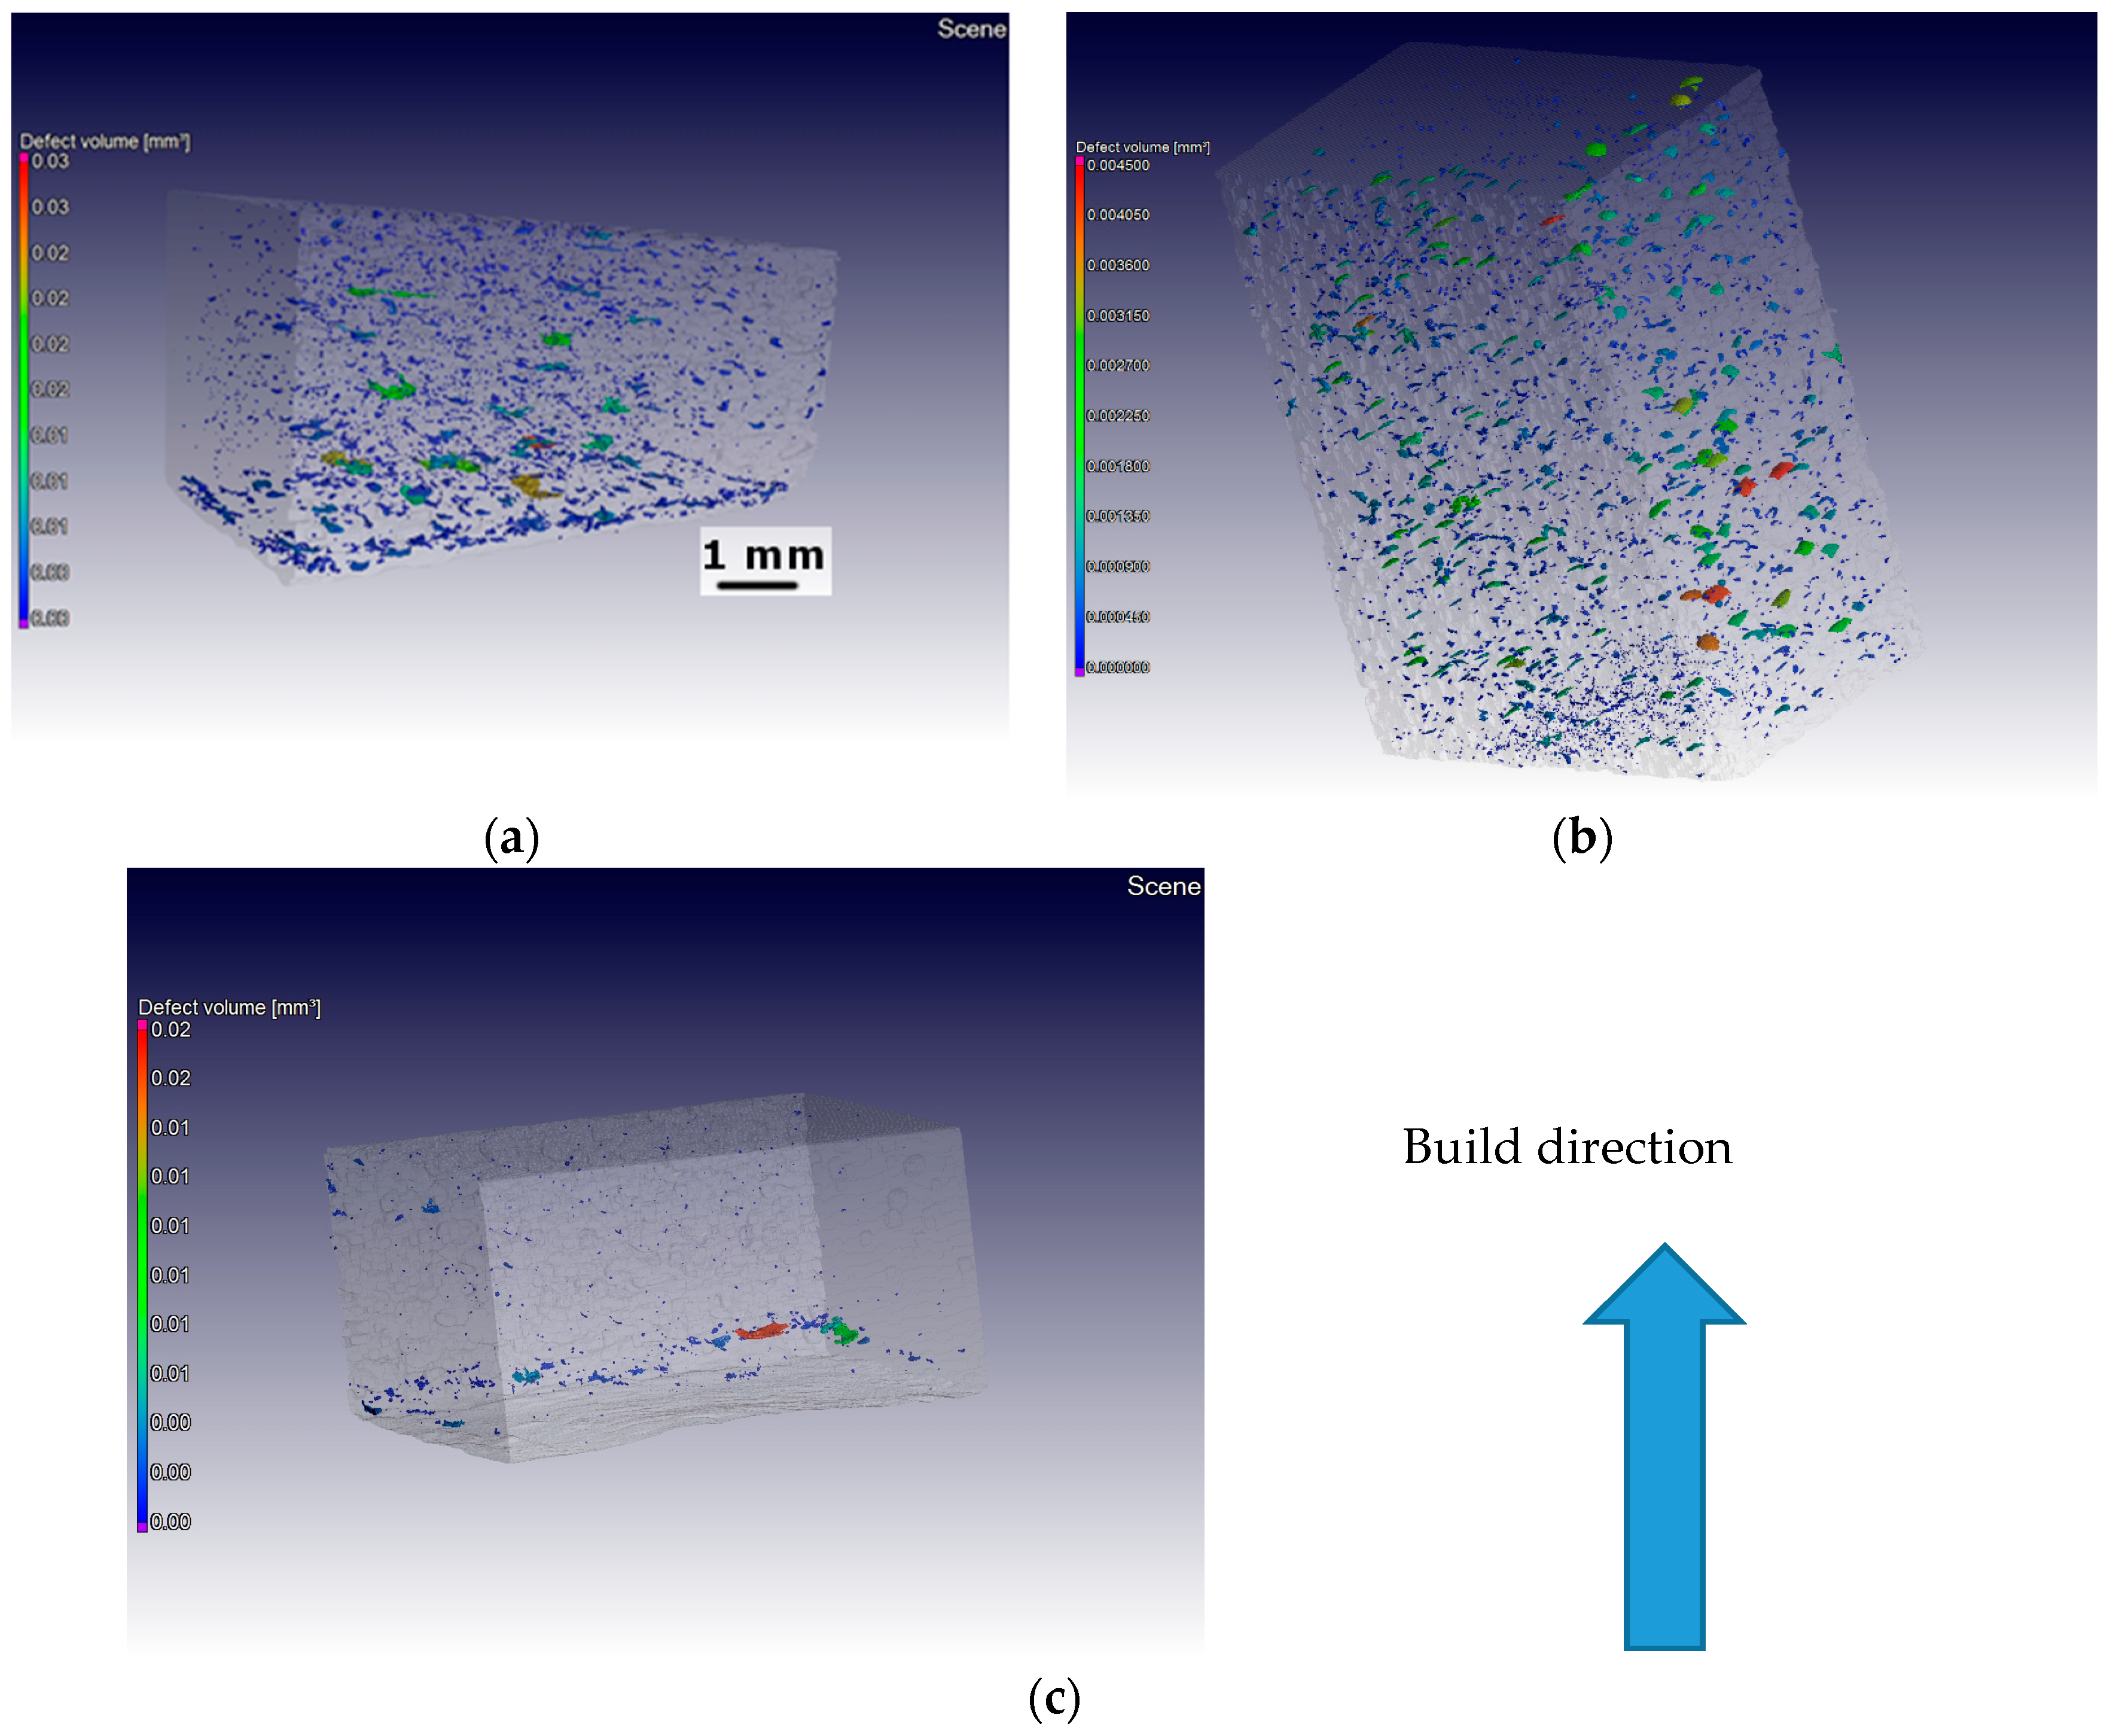
3.2. Micro-CT
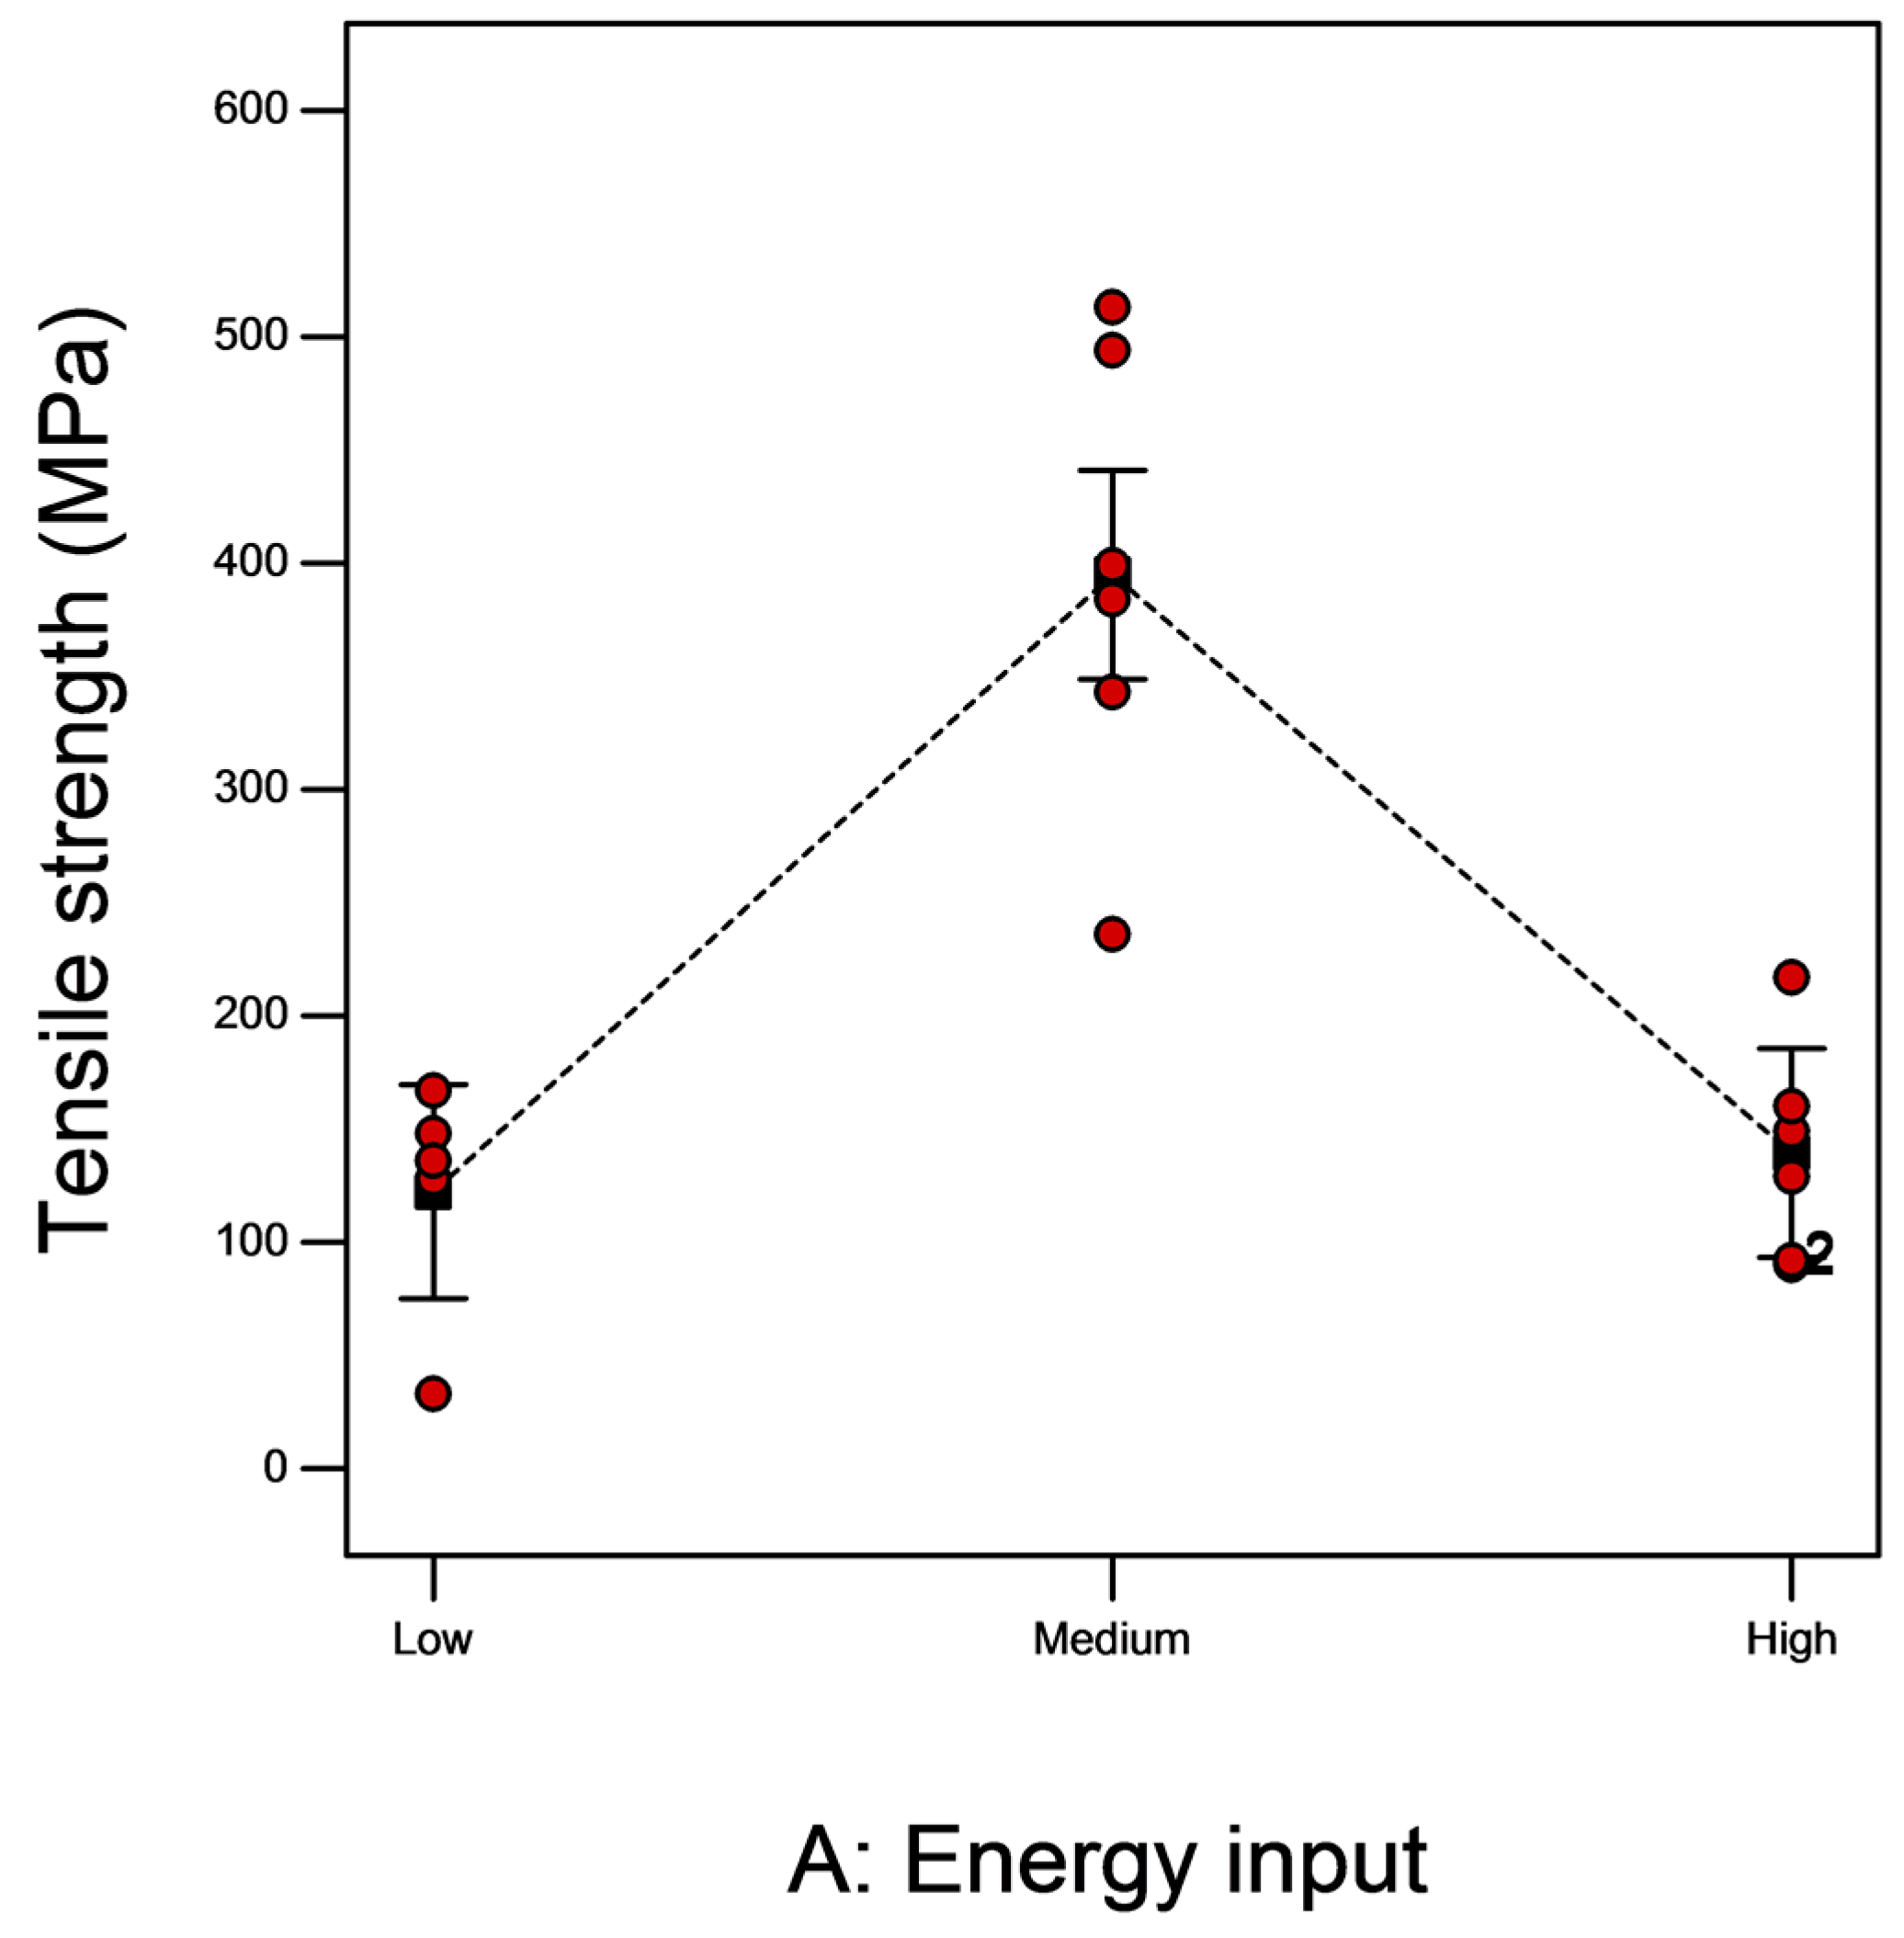
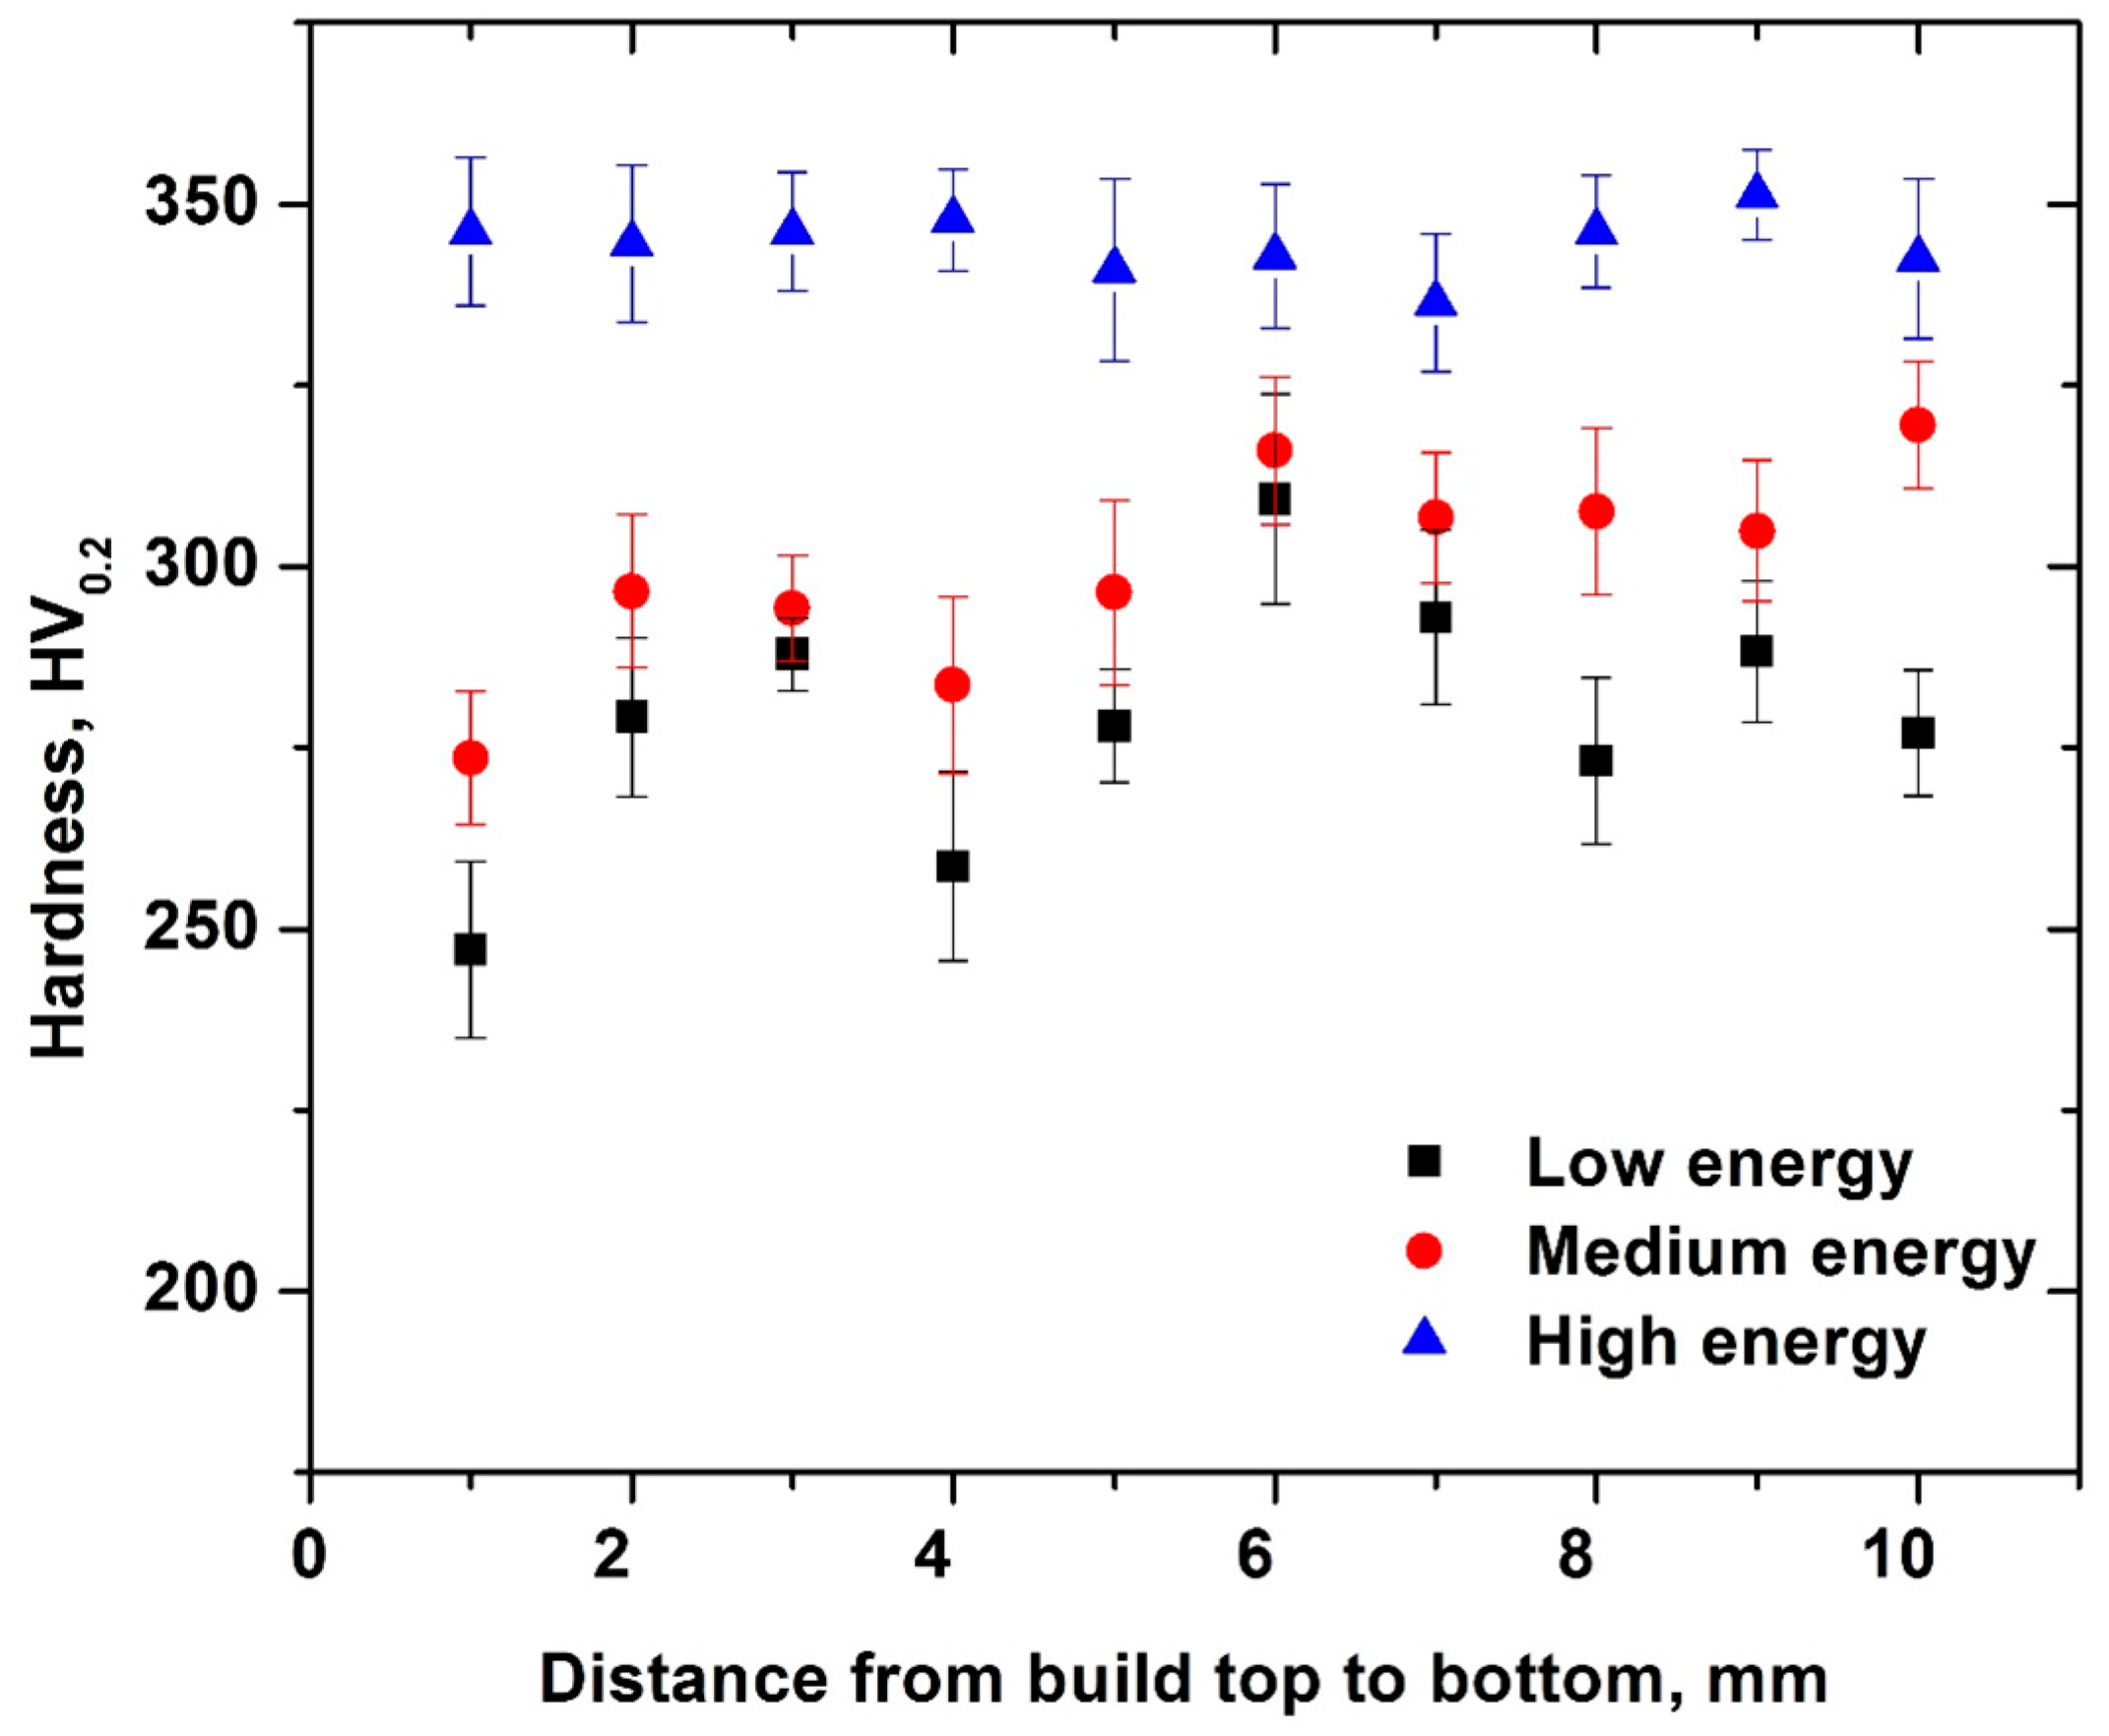
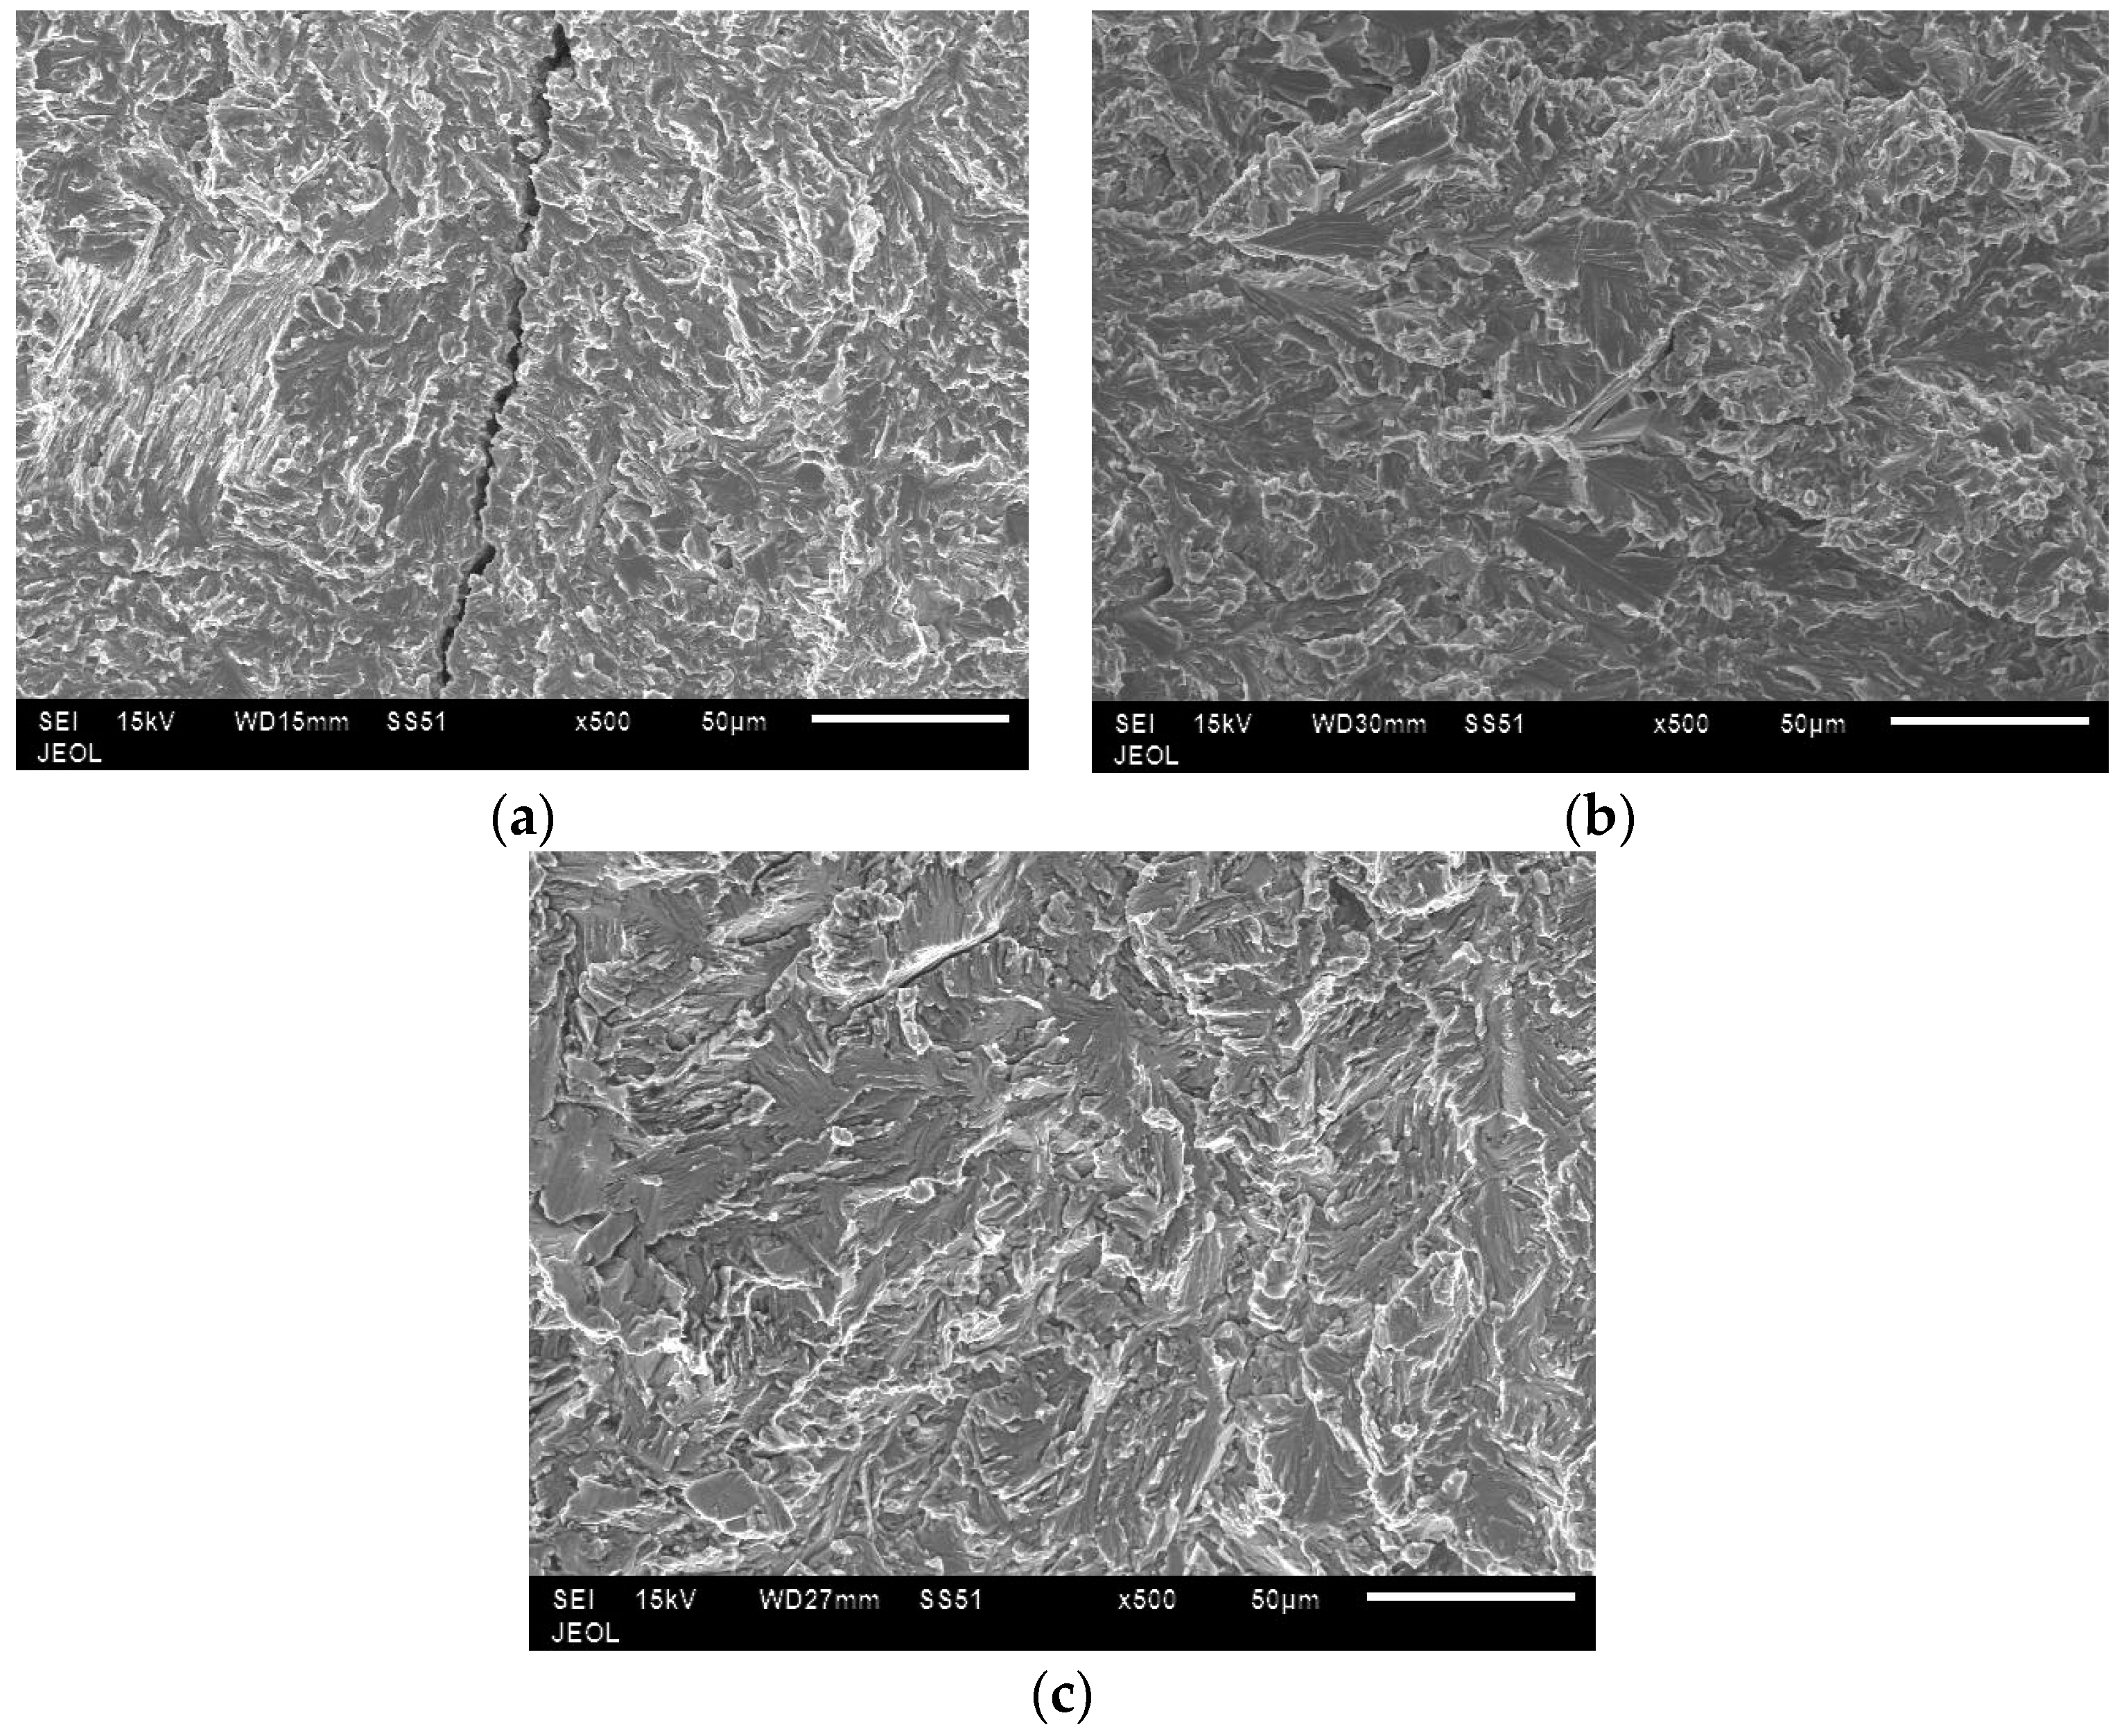
3.3. Mechanical Properties
4. Conclusions
- In EBM, scan distance is one among other main parameters that decides consolidation of each powder layer. Because the scan distance parameter was absent in the line energy index, we used a higher order term called ‘area energy’ as a criterion to determine the effects on the build quality.
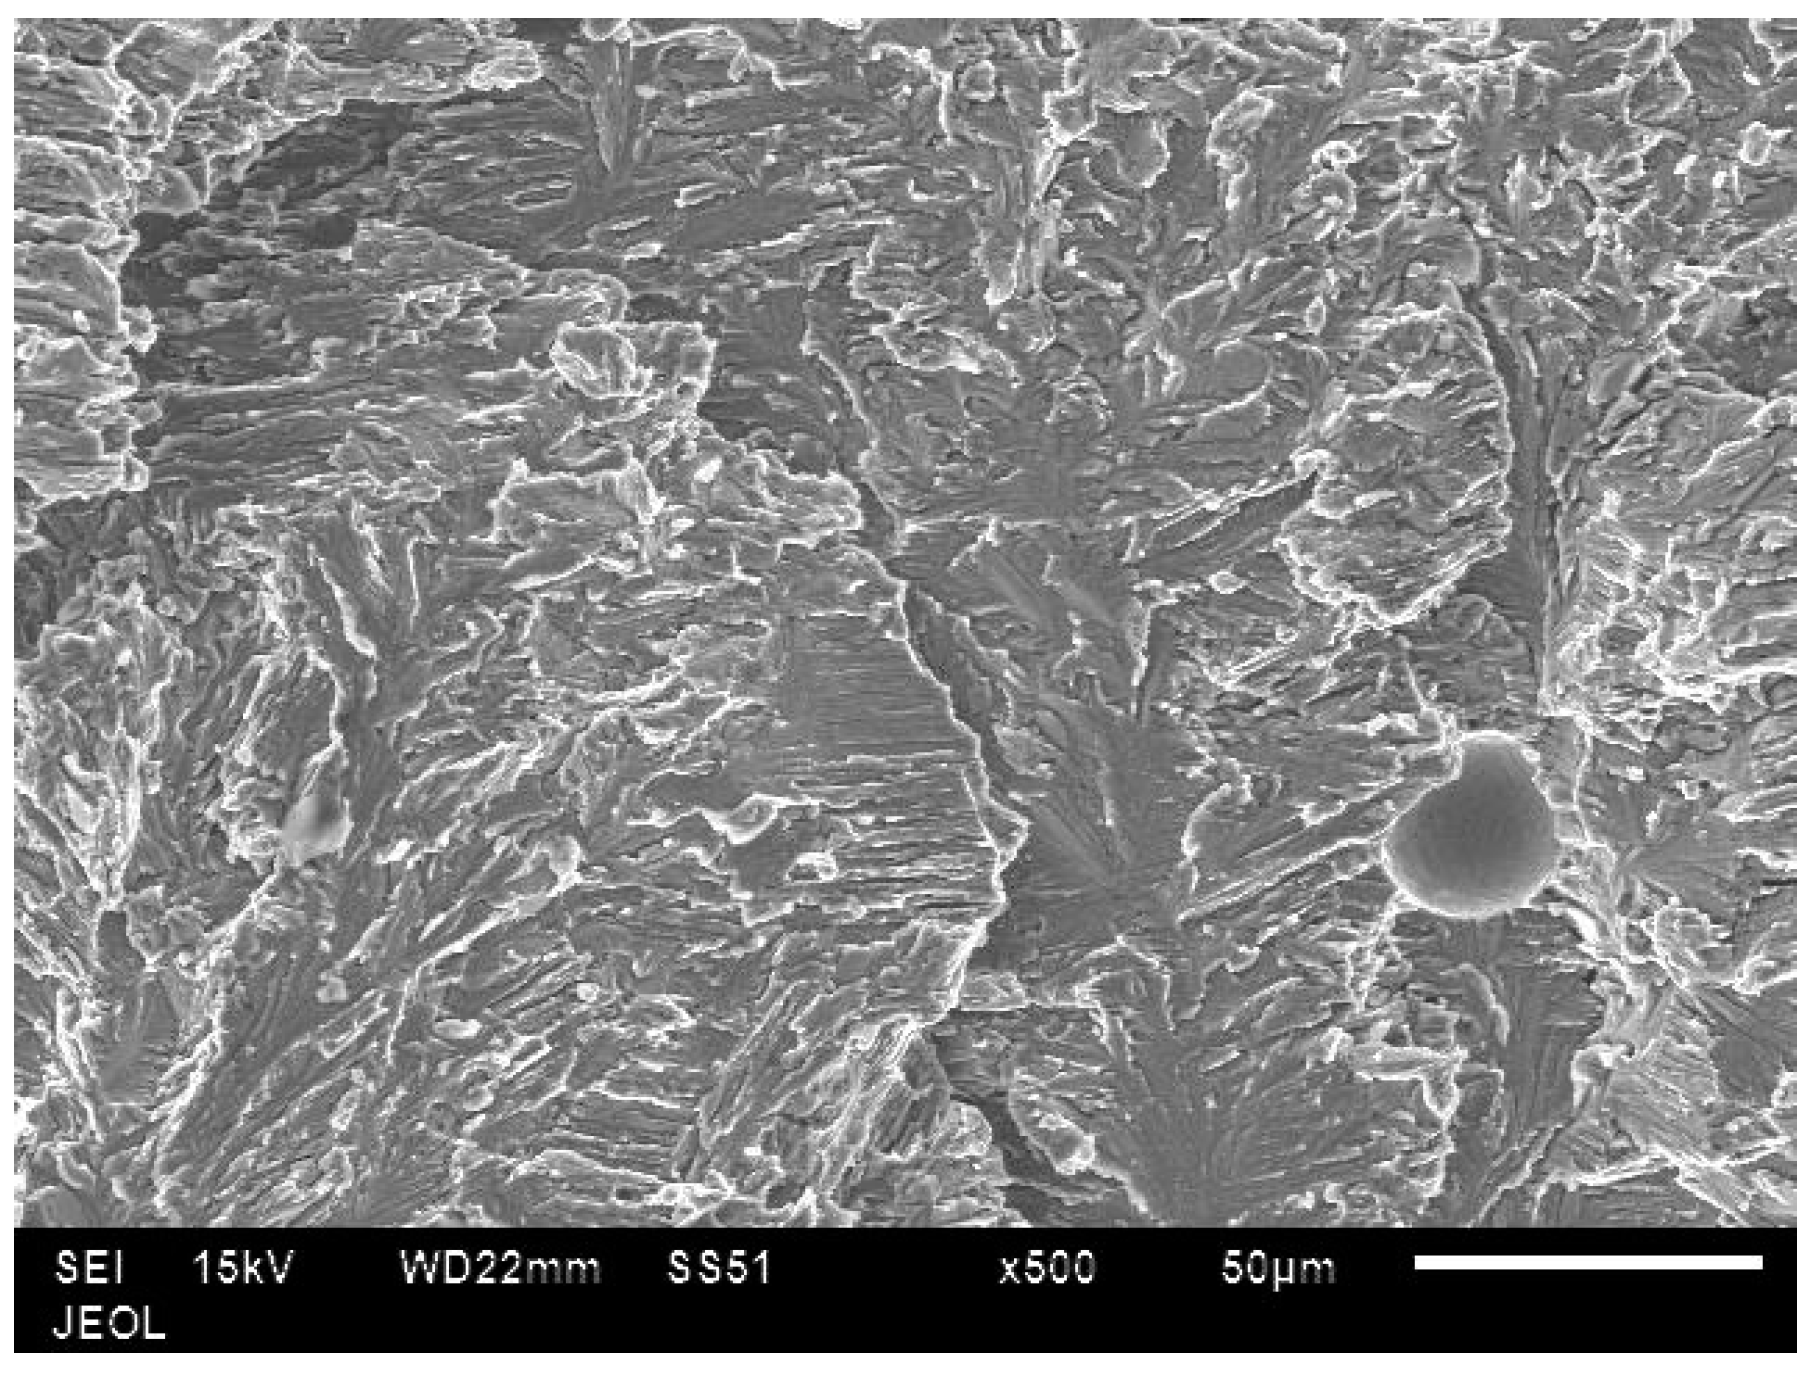
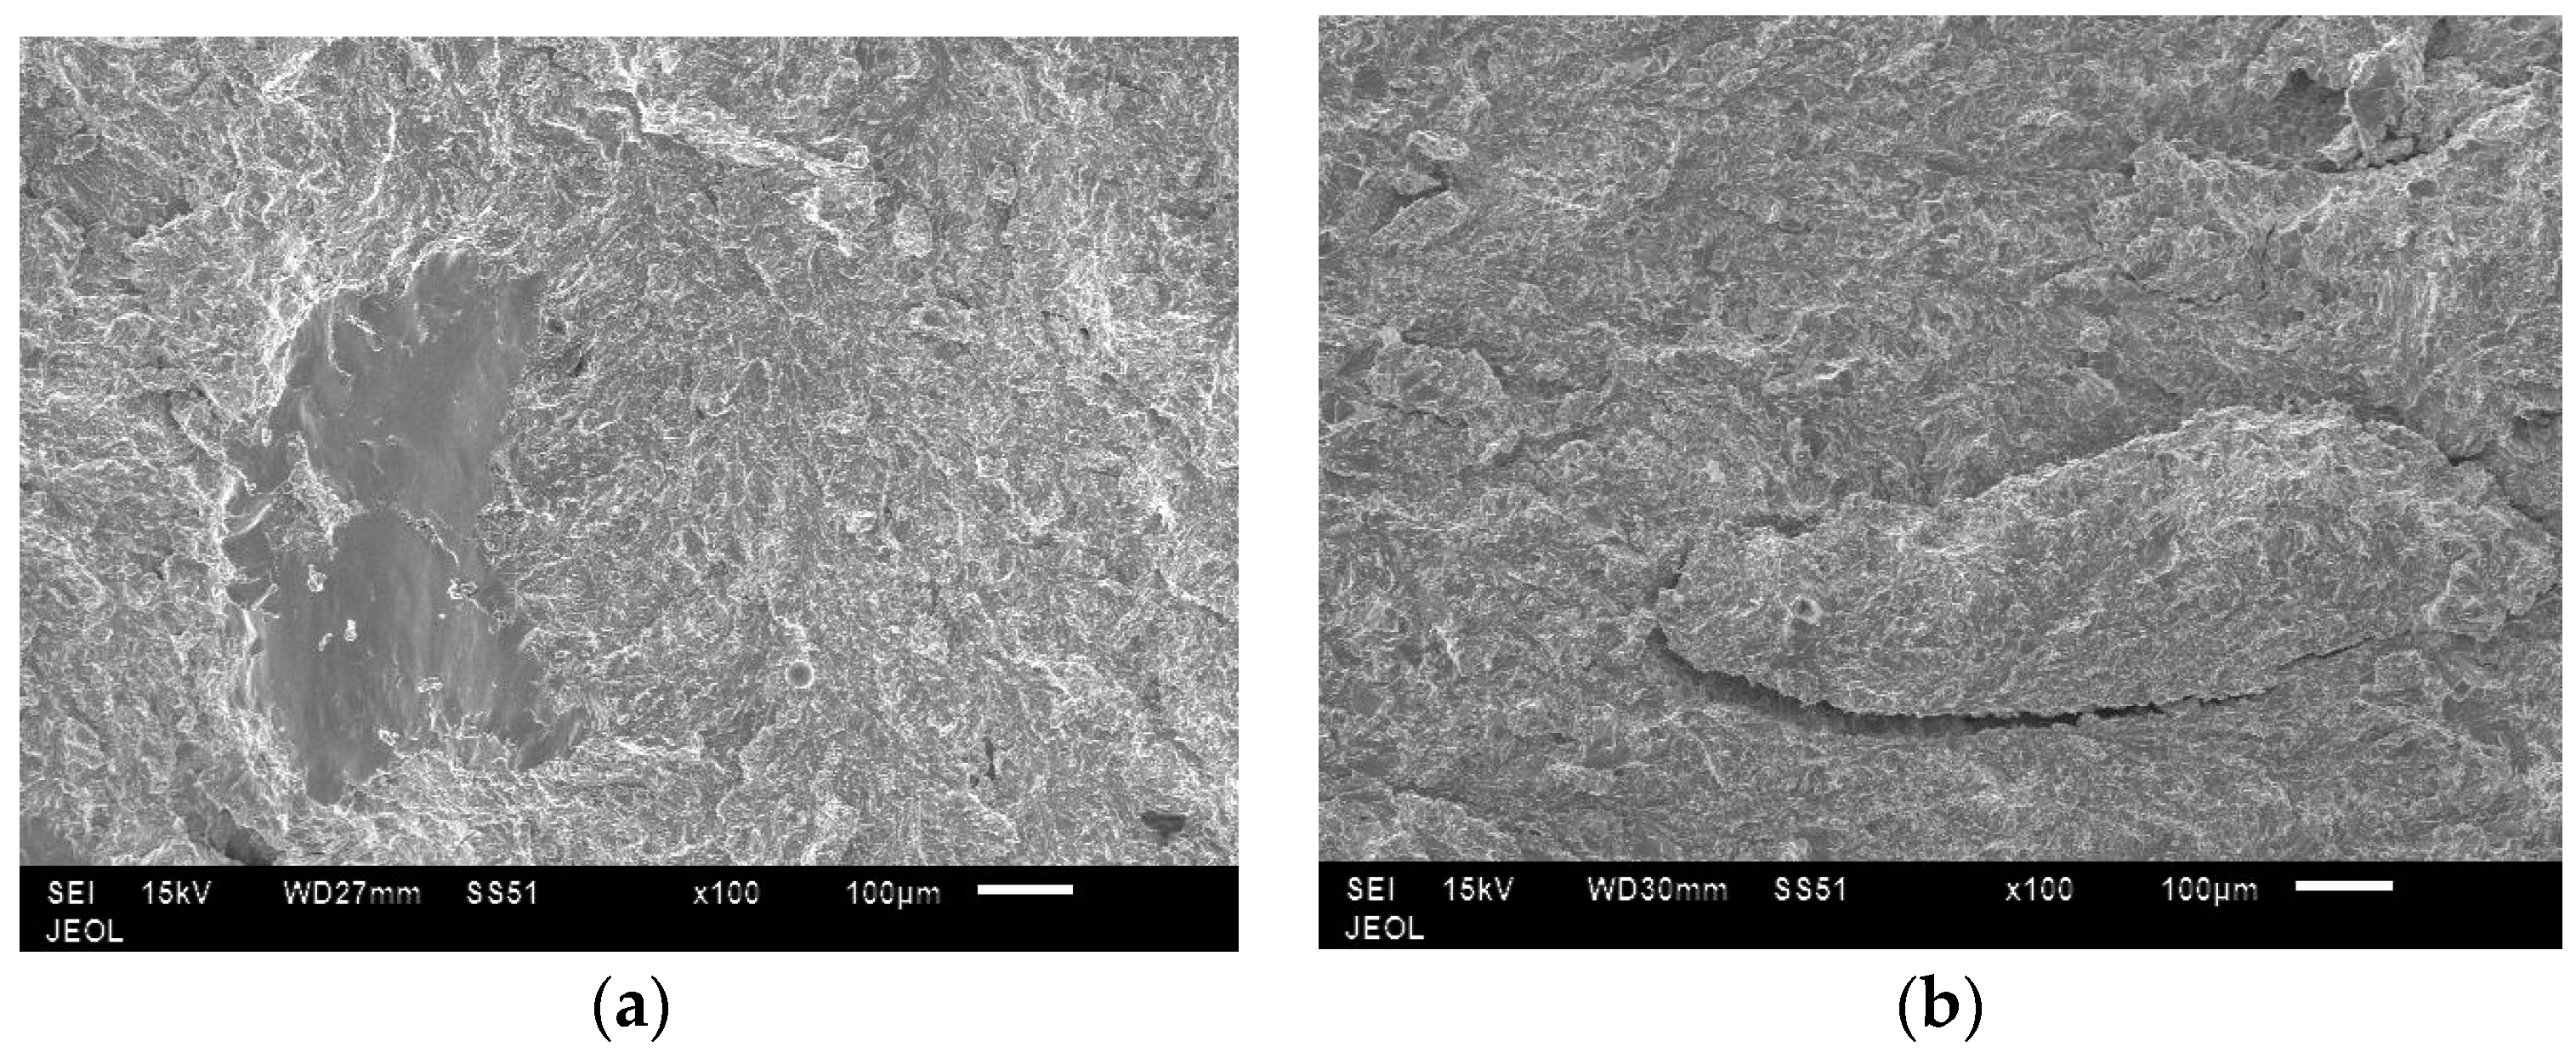
- Only the right amount of energy results in a duplex microstructure. Lower energies produce a predominantly equiaxed microstructure and relatively higher energies result in a completely lamellar microstructure.
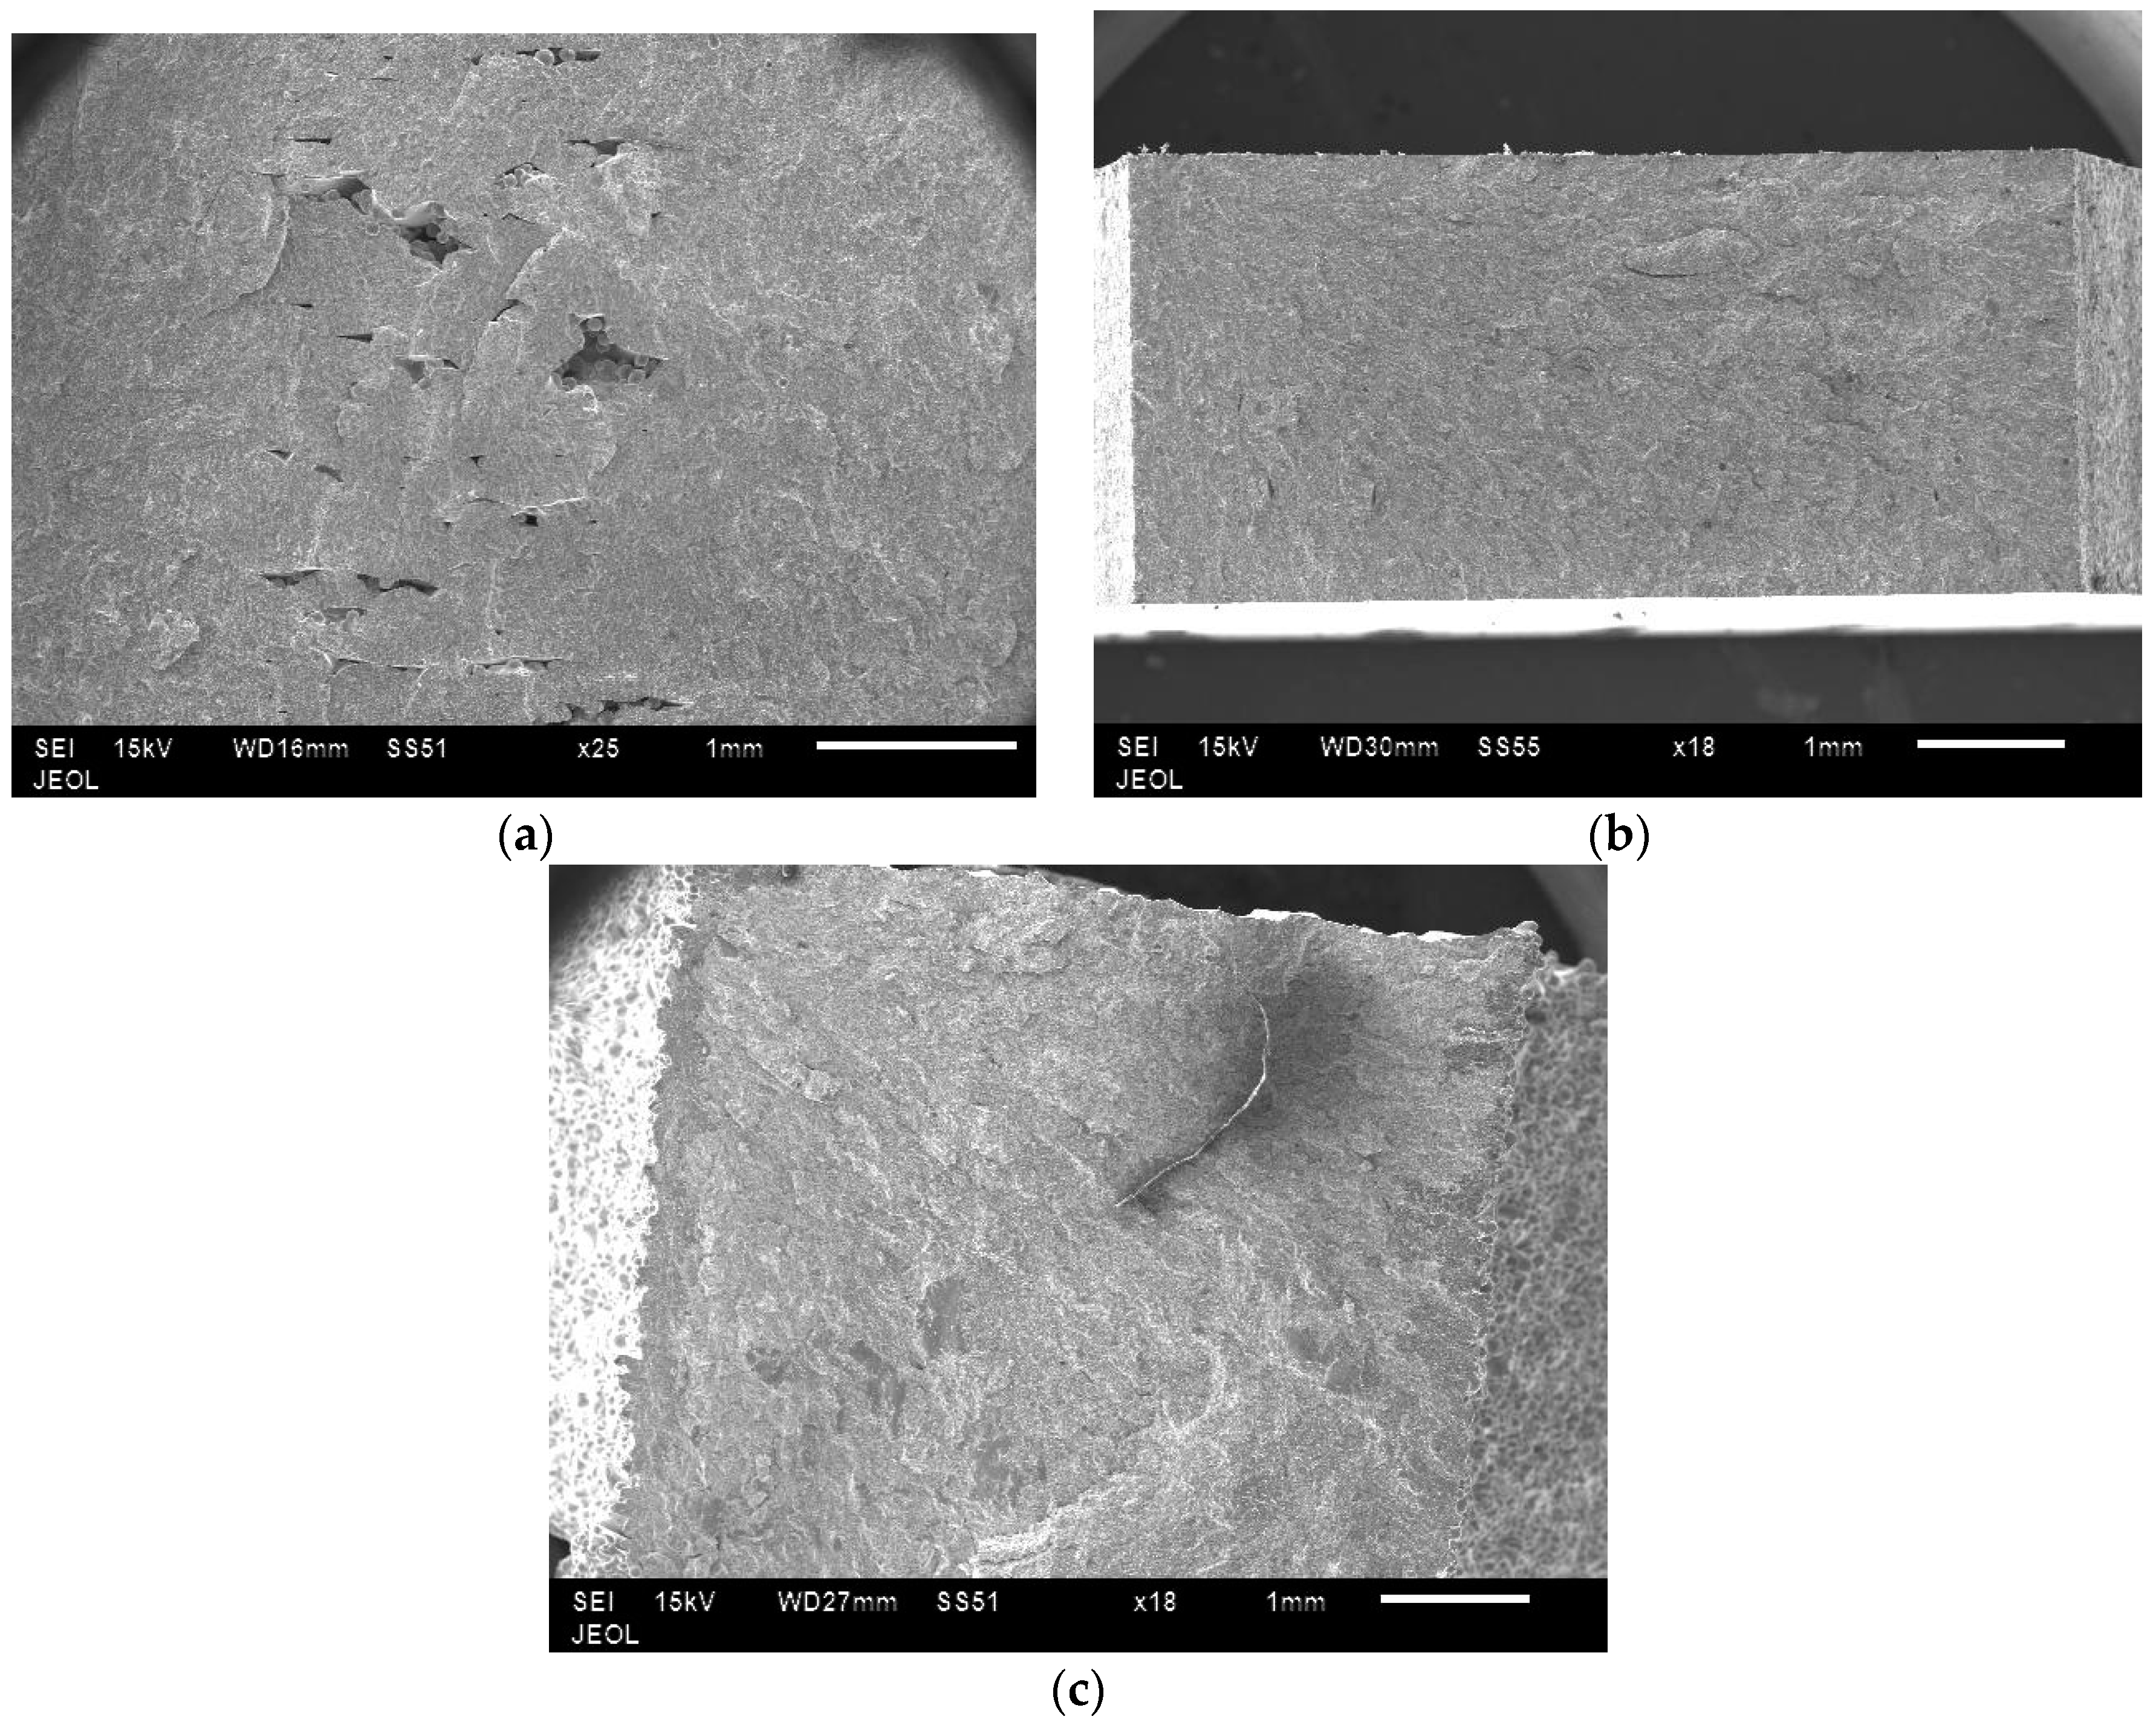
- Lower energies resulted in lack of bonding between adjacent layers thus leading to high-aspect defects lying along the direction of the layers.
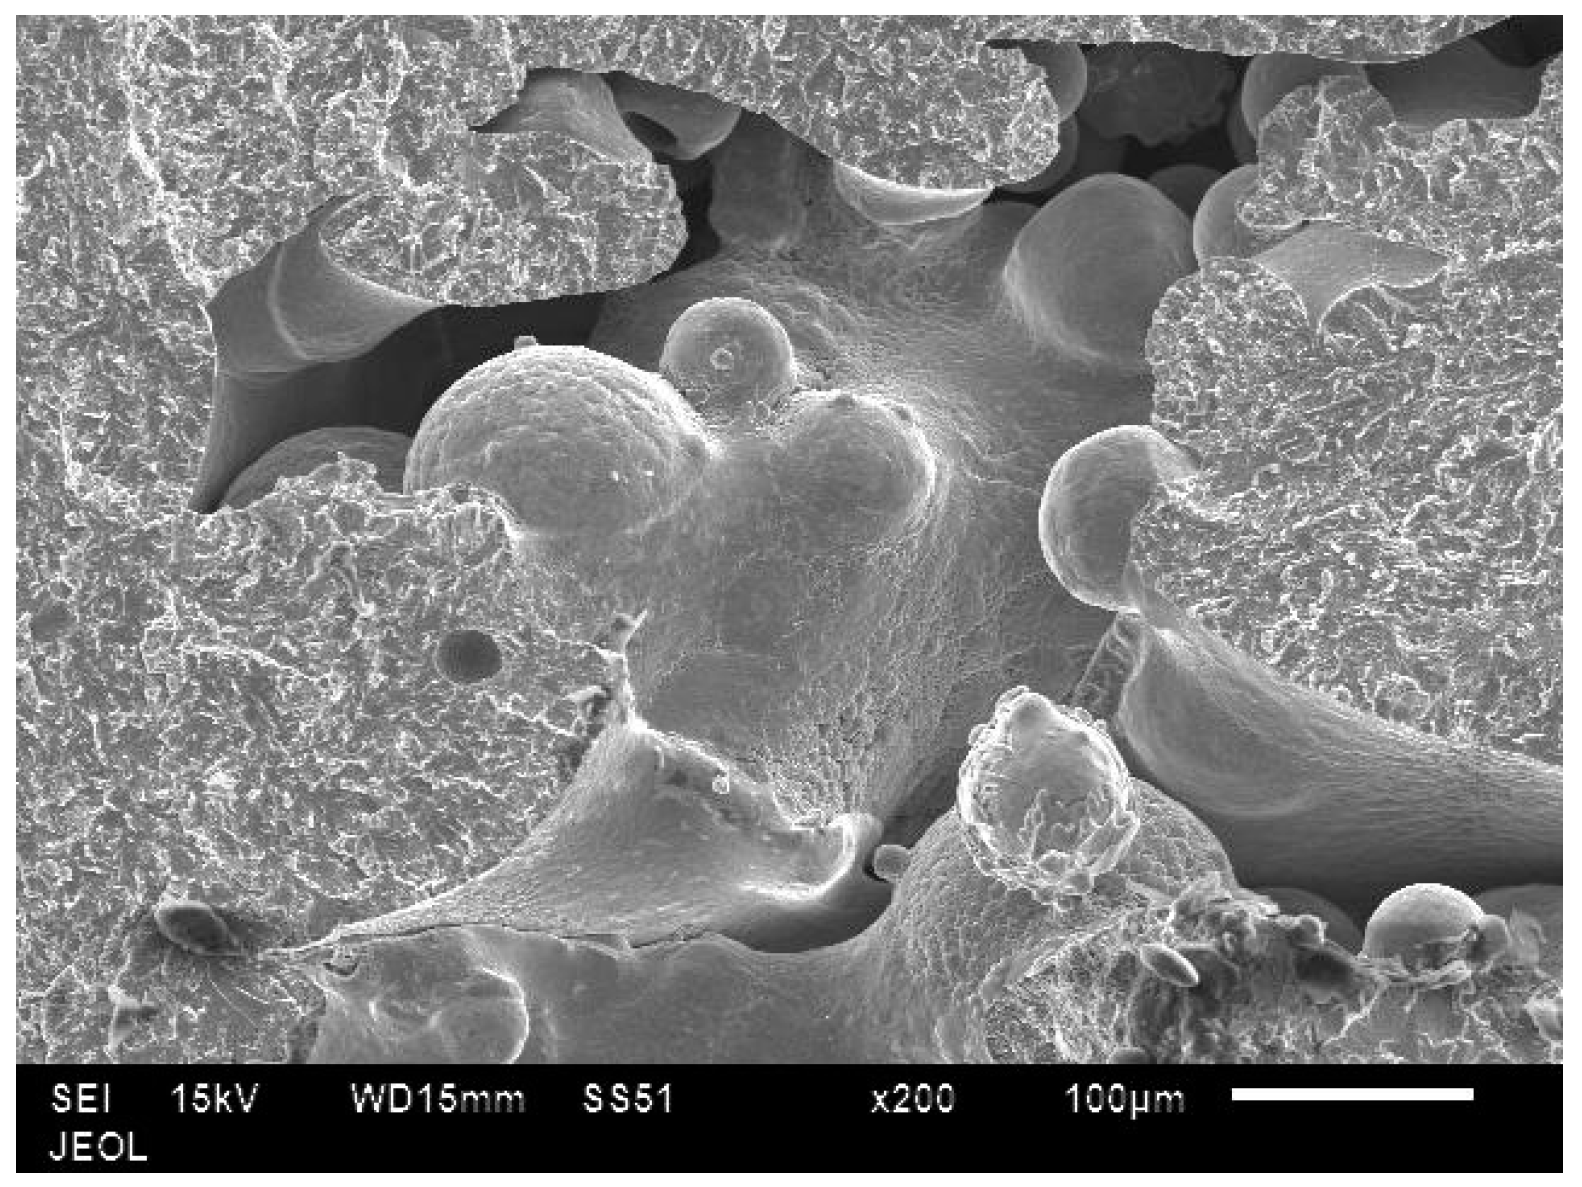
- The highest amount of energy reduced the percentage volume of the pores; however, the same intense beam also produced key-hole defects. The near-complete lamellar microstructure combined with such large sized defects rendered the high-energy samples weaker. Whereas, the right amount of energy, seen in the case of medium energy samples, produced a better microstructure as well as negligibly smaller sized pores, thereby resulting in the strongest components.
Acknowledgments
Author Contributions
Conflicts of Interest
References
- Loria, E.A. Gamma titanium aluminides as prospective structural materials. Intermetallics 2000, 8, 1339–1345. [Google Scholar] [CrossRef]
- Chandley, D. Use of gamma titanium aluminide for automotive engine valves. Metall. Sci. Tecnol. 2000, 18, 8–11. [Google Scholar]
- Klocke, F.; Settineri, L.; Lung, D.; Claudio Priarone, P.; Arft, M. High performance cutting of gamma titanium aluminides: Influence of lubricoolant strategy on tool wear and surface integrity. Wear 2013, 302, 1136–1144. [Google Scholar] [CrossRef]
- Harding, R.A.; Wickins, M.; Wang, H.; Djambazov, G.; Pericleous, K.A. Development of a turbulence-free casting technique for titanium aluminides. Intermetallics 2011, 19, 805–813. [Google Scholar] [CrossRef]
- Hrabe, N.; Quinn, T. Effects of processing on microstructure and mechanical properties of a titanium alloy (Ti–6Al–4V) fabricated using Electron Beam Melting (EBM), part 1: Distance from build plate and part size. Mater. Sci. Eng. A 2013, 573, 264–270. [Google Scholar] [CrossRef]
- Cormier, D.; Harrysson, O.; Mahale, T.; West, H. Freeform Fabrication of Titanium Aluminide via Electron Beam Melting Using Prealloyed and Blended Powders. Res. Lett. Mater. Sci. 2007, 2007, 34737. [Google Scholar] [CrossRef]
- Murr, L.E.; Gaytan, S.M.; Ceylan, A.; Martinez, E.; Martinez, J.L.; Hernandez, D.H.; Machado, B.I.; Ramirez, D.A.; Medina, F.; Collins, S.; et al. Characterization of titanium aluminide alloy components fabricated by additive manufacturing using electron beam melting. Acta Mater. 2010, 58, 1887–1894. [Google Scholar] [CrossRef]
- Franzen, S.F.; Karlsson, J. γ-Titanium Aluminide Manufactured by Electron Beam Melting. Master’s Thesis, Chalmers University of Technology, Gothenburg, Sweden, 2010. [Google Scholar]
- Fukuda, H.; Takahashi, H.; Kuramoto, K.; Nakano, T. Effect of Energy Density of Incident Beam on Mechanical Property of Titanium Alloy Products Fabricated by Electron Beam Melting (EBM) Method. Mater. Sci. Forum 2012, 706–709, 488–491. [Google Scholar] [CrossRef]
- Puebla, K. Effect of Melt Scan Rate on Microstructure and Macrostructure for Electron Beam Melting of Ti-6Al-4V. Mater. Sci. Appl. 2012, 3, 259–264. [Google Scholar] [CrossRef]
- Juechter, V.; Scharowsky, T.; Singer, R.F.; Körner, C. Processing window and evaporation phenomena for Ti–6Al–4V produced by selective electron beam melting. Acta Mater. 2014, 76, 252–258. [Google Scholar] [CrossRef]
- Gong, H.; Rafi, K.; Gu, H.; Starr, T.; Stucker, B. Analysis of defect generation in Ti–6Al–4V parts made using powder bed fusion additive manufacturing processes. Addit. Manuf. 2014, 1–4, 87–98. [Google Scholar] [CrossRef]
- Körner, C.; Helmer, H.; Bauereiß, A.; Singer, R.F. Tailoring the grain structure of IN718 during selective electron beam melting. MATEC Web Conf. 2014, 14, 8001. [Google Scholar] [CrossRef]
- Murr, L.E.; Esquivel, E.V.; Quinones, S.A.; Gaytan, S.M.; Lopez, M.I.; Martinez, E.Y.; Medina, F.; Hernandez, D.H.; Martinez, E.; Martinez, J.L.; et al. Microstructures and mechanical properties of electron beam-rapid manufactured Ti-6Al-4V biomedical prototypes compared to wrought Ti-6Al-4V. Mater. Charact. 2009, 60, 96–105. [Google Scholar] [CrossRef]
- Kirchner, A.; Klöden, B.; Luft, J.; Weißgärber, T.; Kieback, B. Process window for electron beam melting of Ti-6Al-4V. Powder Metall. 2015, 58, 246–249. [Google Scholar] [CrossRef]
- Lamirand, M.; Bonnentien, J.-L.; Ferrière, G.; Guérin, S.; Chevalier, J.-P. Relative effects of chromium and niobium on microstructure and mechanical properties as a function of oxygen content in TiAl alloys. Scr. Mater. 2007, 56, 325–328. [Google Scholar] [CrossRef]
- Kim, Y.-W. Microstructural evolution and mechanical properties of a forged gamma titanium aluminide alloy. Acta Metall. Mater. 1992, 40, 1121–1134. [Google Scholar] [CrossRef]
- Kothari, K.; Radhakrishnan, R.; Sudarshan, T.S.; Wereley, N.M. Characterization of rapidly consolidated γ-TiAl. Adv. Mater. Res. 2012, 1, 51–74. [Google Scholar] [CrossRef]
- Murr, L.E. Metallurgy of additive manufacturing: Examples from electron beam melting. Addit. Manuf. 2015, 5, 40–53. [Google Scholar] [CrossRef]
- Antonysamy, A.A.; Meyer, J.; Prangnell, P.B. Effect of build geometry on the β-grain structure and texture in additive manufacture of Ti–6Al–4V by selective electron beam melting. Mater. Charact. 2013, 84, 153–168. [Google Scholar] [CrossRef]
- Gabalcová, Z.; Lapin, J. Experimental study of columnar to equiaxed transition during directional solidification of Intermetallic Ti-46Al-8Nb Alloy. In Proceedings of the METAL 2009, Symposium E, Hradec nad Moravicí, Czech Republic, 19–21 May 2009; pp. 38–47.
- Zhang, W.J.; Francesconi, L.; Evangelista, E. A novel heat treatment to develop very fine lamellar structure in cast gamma-base TiAl alloys. Mater. Lett. 1996, 27, 135–138. [Google Scholar] [CrossRef]
- Schwerdtfeger, J.; Körner, C. Selective electron beam melting of Ti–48Al–2Nb–2Cr: Microstructure and aluminium loss. Intermetallics 2014, 49, 29–35. [Google Scholar] [CrossRef]
- Biamino, S.; Penna, A.; Ackelid, U.; Sabbadini, S.; Tassa, O.; Fino, P.; Pavese, M.; Gennaro, P.; Badini, C. Electron beam melting of Ti–48Al–2Cr–2Nb alloy: Microstructure and mechanical properties investigation. Intermetallics 2011, 19, 776–781. [Google Scholar] [CrossRef]
- Westbrook, J.H.; Fleischer, R.L. Intermetallic Compounds: Principles and Practice; J. Wiley: Chichester, UK; New York, NY, USA, 1995. [Google Scholar]
- Thomas, M.; Bacos, M.P. Processing and Characterization of TiAl-based Alloys: Towards an Industrial Scale. Aerosp. Lab J. 2011, 3, 1–11. [Google Scholar]
- Gong, H.; Gu, H.; Zeng, K.; Dilip, J.J.S.; Pal, D.; Stucker, B.; Christiansen, D.; Beuth, J.; Lewandowski, J.J. Melt Pool Characterization for Selective Laser Melting of Ti-6Al-4V Pre-alloyed Powder. In Proceedings of the Solid Freeform Fabrication Symposium, Austin, TX, USA, 4–6 August 2014.
- Tammas-Williams, S.; Withers, P.J.; Todd, I.; Prangnell, P.B. The Effectiveness of Hot Isostatic Pressing for Closing Porosity in Titanium Parts Manufactured by Selective Electron Beam Melting. Metall. Mater. Trans. A 2016, 47, 1939–1946. [Google Scholar] [CrossRef]
- Guo, F.A.; Ji, V.; Francois, M.; Zhang, Y.G. Effect of internal stresses on the fracture toughness of a TiAl-based alloy with duplex microstructures. Acta Mater. 2003, 51, 5349–5358. [Google Scholar] [CrossRef]


| Element | Al | Cr | Nb | Fe | C | O | N | H | Ti |
|---|---|---|---|---|---|---|---|---|---|
| Weight % | 33.9 | 2.3 | 4.6 | 0.04 | 0.01 | 0.09 | 0.01 | 0.002 | Bal. |
| Parameter | Low Energy | Medium Energy | High Energy |
|---|---|---|---|
| Beam current, Ib (mA) | 15 | 19 | 25 |
| Line offset, Lo (mm) | 0.35 | 0.20 | 0.17 |
| Line energy, El (J/mm) | 0.34 | 0.54 | 0.69 |
| Energy per unit area, EA (J/mm2) | 0.97 | 2.71 | 4.07 |
| Element | Low Energy Input (at%) | Medium Energy Input (at%) | High Energy Input (at%) |
|---|---|---|---|
| Al K | 44.35 | 44.40 | 41.30 |
| Ti K | 51.80 | 52.20 | 54.70 |
| Cr K | 1.93 | 1.99 | 2.01 |
| Nb L | 1.92 | 1.91 | 1.92 |
| Sample | Average Porosity (vol%) | Largest Pore Diameter (mm) | Total Number of Defects Detected |
|---|---|---|---|
| Low energy | 0.26 | 1.53 | 4493 |
| Medium energy | 0.16 | 0.47 | 3807 |
| High energy | 0.03 | 1.03 | 560 |
© 2017 by the authors. Licensee MDPI, Basel, Switzerland. This article is an open access article distributed under the terms and conditions of the Creative Commons Attribution (CC BY) license ( http://creativecommons.org/licenses/by/4.0/).
Share and Cite
Mohammad, A.; Alahmari, A.M.; Mohammed, M.K.; Renganayagalu, R.K.; Moiduddin, K. Effect of Energy Input on Microstructure and Mechanical Properties of Titanium Aluminide Alloy Fabricated by the Additive Manufacturing Process of Electron Beam Melting. Materials 2017, 10, 211. https://doi.org/10.3390/ma10020211
Mohammad A, Alahmari AM, Mohammed MK, Renganayagalu RK, Moiduddin K. Effect of Energy Input on Microstructure and Mechanical Properties of Titanium Aluminide Alloy Fabricated by the Additive Manufacturing Process of Electron Beam Melting. Materials. 2017; 10(2):211. https://doi.org/10.3390/ma10020211
Chicago/Turabian StyleMohammad, Ashfaq, Abdulrahman M. Alahmari, Muneer Khan Mohammed, Ravi Kottan Renganayagalu, and Khaja Moiduddin. 2017. "Effect of Energy Input on Microstructure and Mechanical Properties of Titanium Aluminide Alloy Fabricated by the Additive Manufacturing Process of Electron Beam Melting" Materials 10, no. 2: 211. https://doi.org/10.3390/ma10020211