Article

Tunable Luminescence in Sr2MgSi2O7:Tb3+, Eu3+Phosphors Based on Energy Transfer

Department of Chemistry and Pharmaceutical Science, Qindao Agricultural University, Qingdao 266109, China
*
Authors to whom correspondence should be addressed.
Materials 2017, 10(3), 227; https://doi.org/10.3390/ma10030227
Submission received: 22 December 2016 / Accepted: 17 February 2017 / Published: 24 February 2017
(This article belongs to the Special Issue Luminescent Materials 2017)

Abstract

:
A series of Tb3+, Eu3+-doped Sr2MgSi2O7 (SMSO) phosphors were synthesized by high temperature solid-state reaction. X-ray diffraction (XRD) patterns, Rietveld refinement, photoluminescence spectra (PL), and luminescence decay curves were utilized to characterize each sample’s properties. Intense green emission due to Tb3+ 5D47F5 transition was observed in the Tb3+ single-doped SMSO sample, and the corresponding concentration quenching mechanism was demonstrated to be a diople-diople interaction. A wide overlap between Tb3+ emission and Eu3+ excitationspectraresults in energy transfer from Tb3+ to Eu3+. This has been demonstrated by the emission spectra and decay curves of Tb3+ in SMSO:Tb3+, Eu3+ phosphors. Energy transfer mechanism was determined to be a quadrupole-quadrupole interaction. And critical distance of energy transfer from Tb3+ to Eu3+ ions is calculated to be 6.7 Å on the basis of concentration quenching method. Moreover, white light emission was generated via adjusting concentration ratio of Tb3+ and Eu3+ in SMSO:Tb3+, Eu3+ phosphors. All the results indicate that SMSO:Tb3+, Eu3+ is a promising single-component white light emitting phosphor.

Graphical Abstract

1. Introduction

With the increasing seriousness of environmental problems and energy issues, white light emitting diodes (w-LEDs) have attract great attention in the lighting and display field due to their environmental friendliness, lower energy consumption, long lifetime, and extraordinary luminous efficiency compared with traditional incandescent or fluorescent lamps [1,2,3,4]. In general, three effective strategies can be used to generate white light. First is the combination of multiple LED chips (red, green, and blue) in a single device, called RGB-LEDs [5]. However, it is uneconomic to combine three or more LED chips to fabricate w-LEDs due to low efficiencies and expensive cost. The second approach to generate white light is the assembly of a single LED chip with red, green, and blue phosphors or a single-phase phosphor, which is called phosphor converted white LEDs (pc-WLEDs) [6]. Nowadays, leading commercial w-LEDs are fabricated by a “blue (InGaN) LED chip + yellow (YAG:Ce3+) phosphor” [7,8]. However, inherent weaknesses such as high correlated color temperature (CCT > 7000 K) and poor color rendering index (CRI < 80) were caused by the absence of red component, which greatly limiting its application [9,10]. In order to overcome these drawbacks, UV LED chip excited tricolor phosphors were prepared, which can provide high color-rendering index and quality of light [11]. However, poor luminescence efficiency was caused by mixing of multiemission bands, which contributed to strong reabsorption. As an alternative, it is obligatory to develop single-phase phosphor.
Rare earth ions doped silicate phosphors have been investigated extensively due to their cheap raw materials and good chemical and physical stability, which originates from the strong and rigid frameworks with covalent Si–O bonds [12]. Recently, Zhou et al. reported a single-component MgY2Si3O10:Bi3+, Eu3+ phosphor that can give white light emission under excitation of UV light and provide potential application for white-LEDs [13]. Effective energy transfer was observed from Eu2+ to Mn2+ in Mg2Al4Si5O18:Eu2+, Mn2+ phosphor, which was researched by Chen et al. [14]. In 2014, Wang et al. reported the luminescence properties of Y2SiO5:Ce3+, Tb3+, Eu3+ phosphor, which gives white light emission via energy transfer from Ce3+ to Tb3+ to Eu3+ [15]. In addition to similar host materials, on the other hand, energy transfer process was observed in rare earth co-doped phosphors. It is well known that energy transfer from sensitizers to activators plays an important role in realizing tunable emission [16]. For the rare earth family, trivalent Tb3+ ions have been widely studied due to 5D37FJ transitions in blue region and 5D47FJ transitions in green region (J = 6, 5, 4 and 3) based on different doping concentration [17,18]. It can effectively transfer its energy to activators to improve the luminescence intensity of co-activators [19]. Eu3+ is an effective red component due to its 5D07F2 electric dipole transition, which subsititute sites without symmetry center. In order to realize tunable emission color, Tb3+ and Eu3+ co-doped SMSO (Sr2MgSi2O7) phosphors were prepared in this experiment.
In this work, new single-phased SMSO:Tb3+, Eu3+phosphors were synthesized via high temperature solid state reaction. Crystal structure, photoluminescence properties, Commission International De L’Eclairage (CIE) chromaticity coordinates, and luminescence lifetimes have been investigated in detail. Energy transfer from Tb3+ to Eu3+ in SMSO:Tb3+, Eu3+ was investigated, and the corresponding energy transfer mechanism was determined to be a quadrupole-quadrupole interaction. Moreover, tunable emission from blue to white, up to red-orange, was observed under excitation of UV light. All results show that SMSO:Tb3+, Eu3+ is a potential single-component phosphor.

2. Results

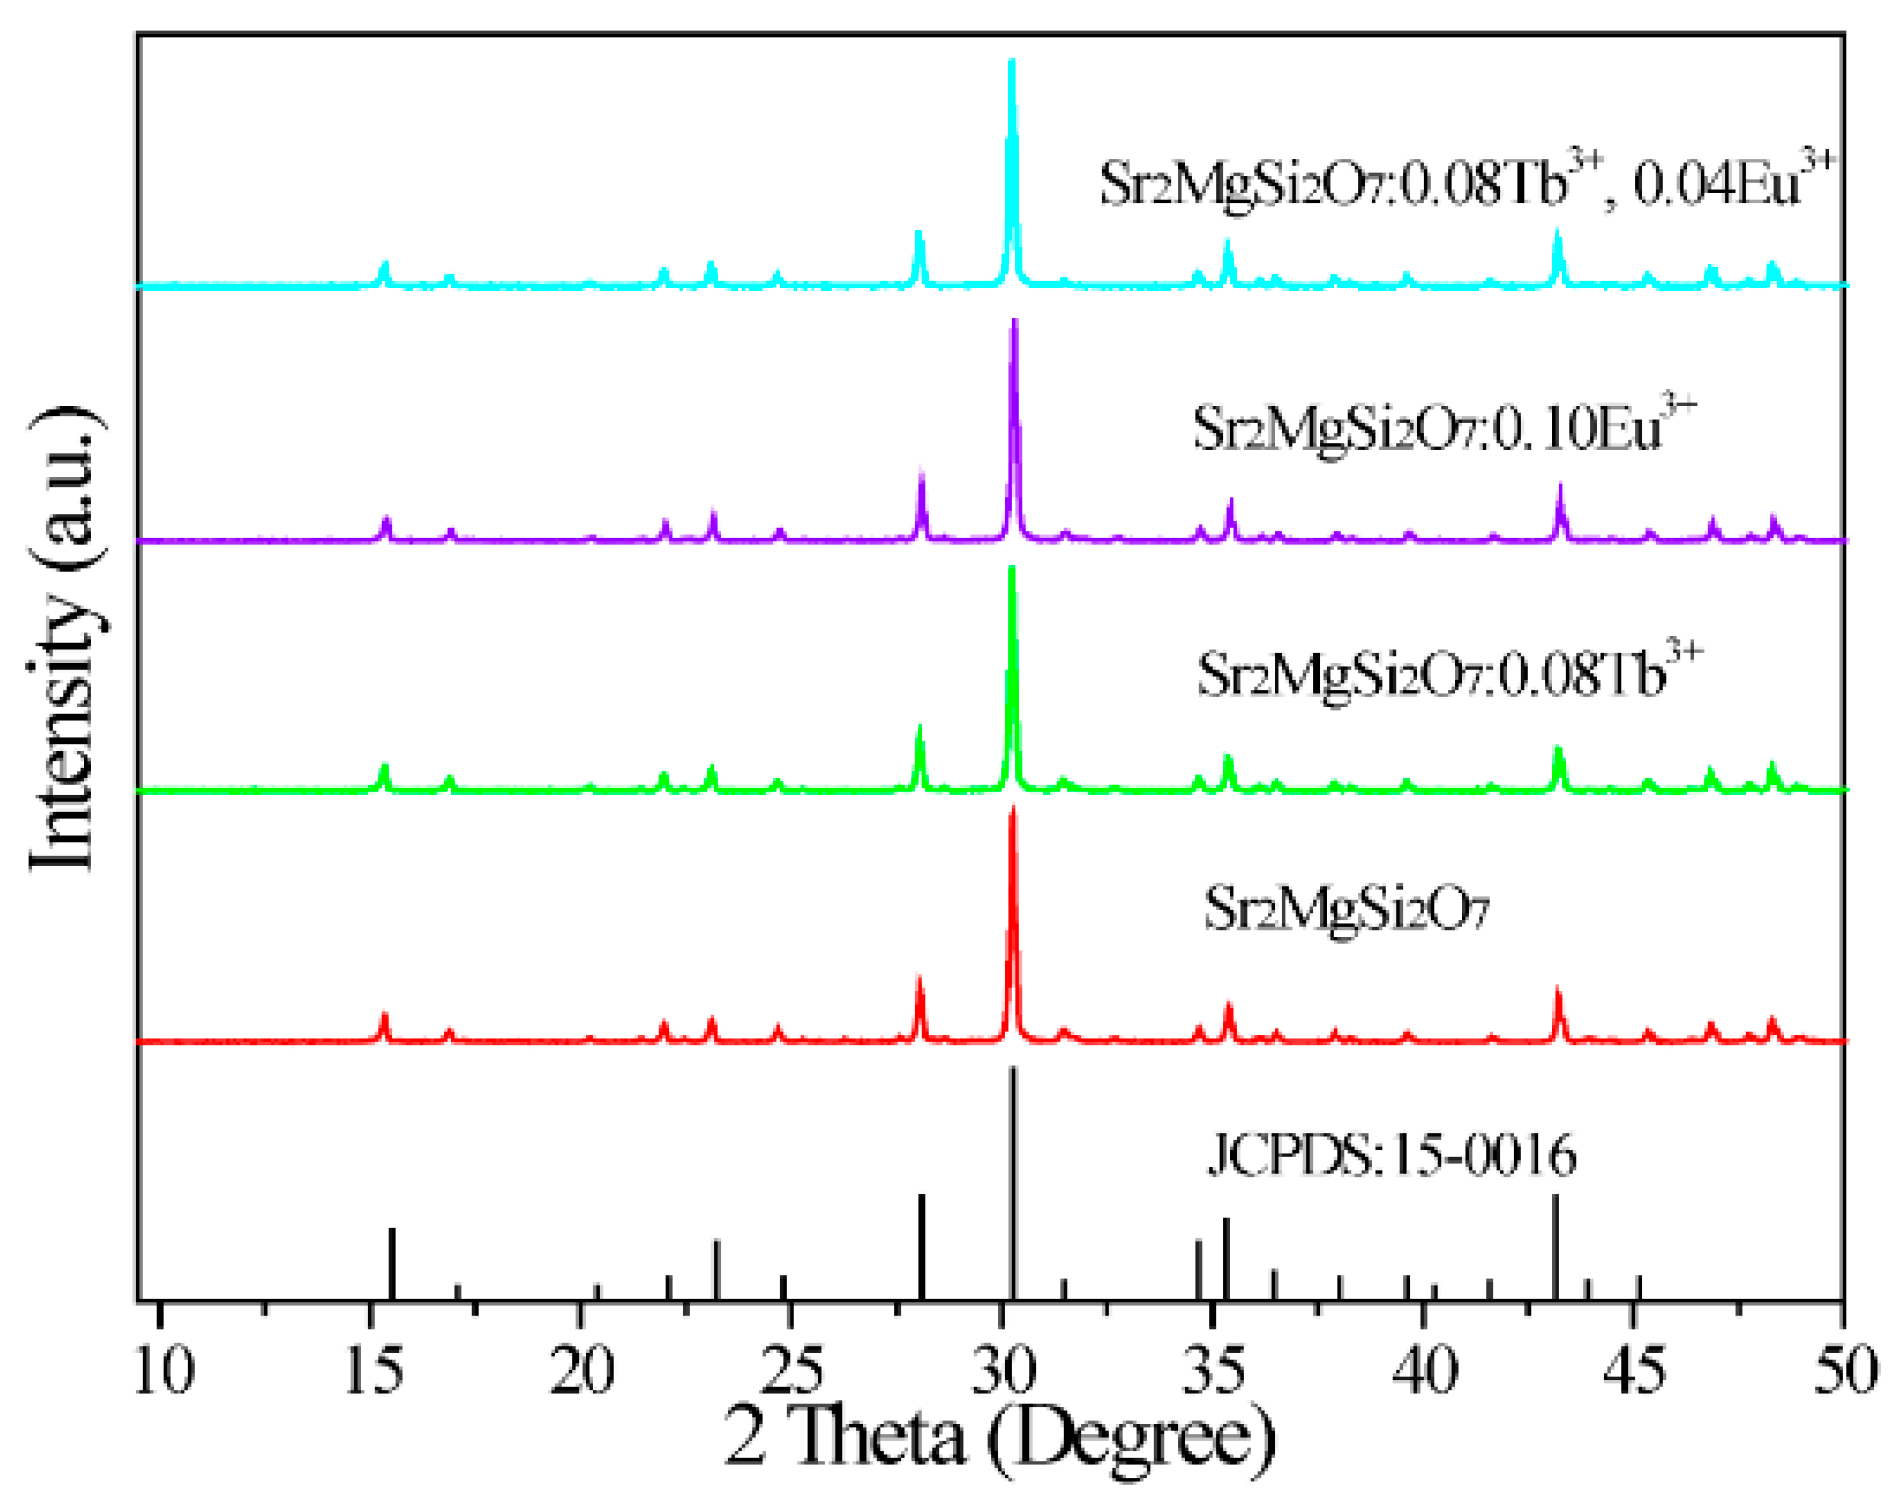
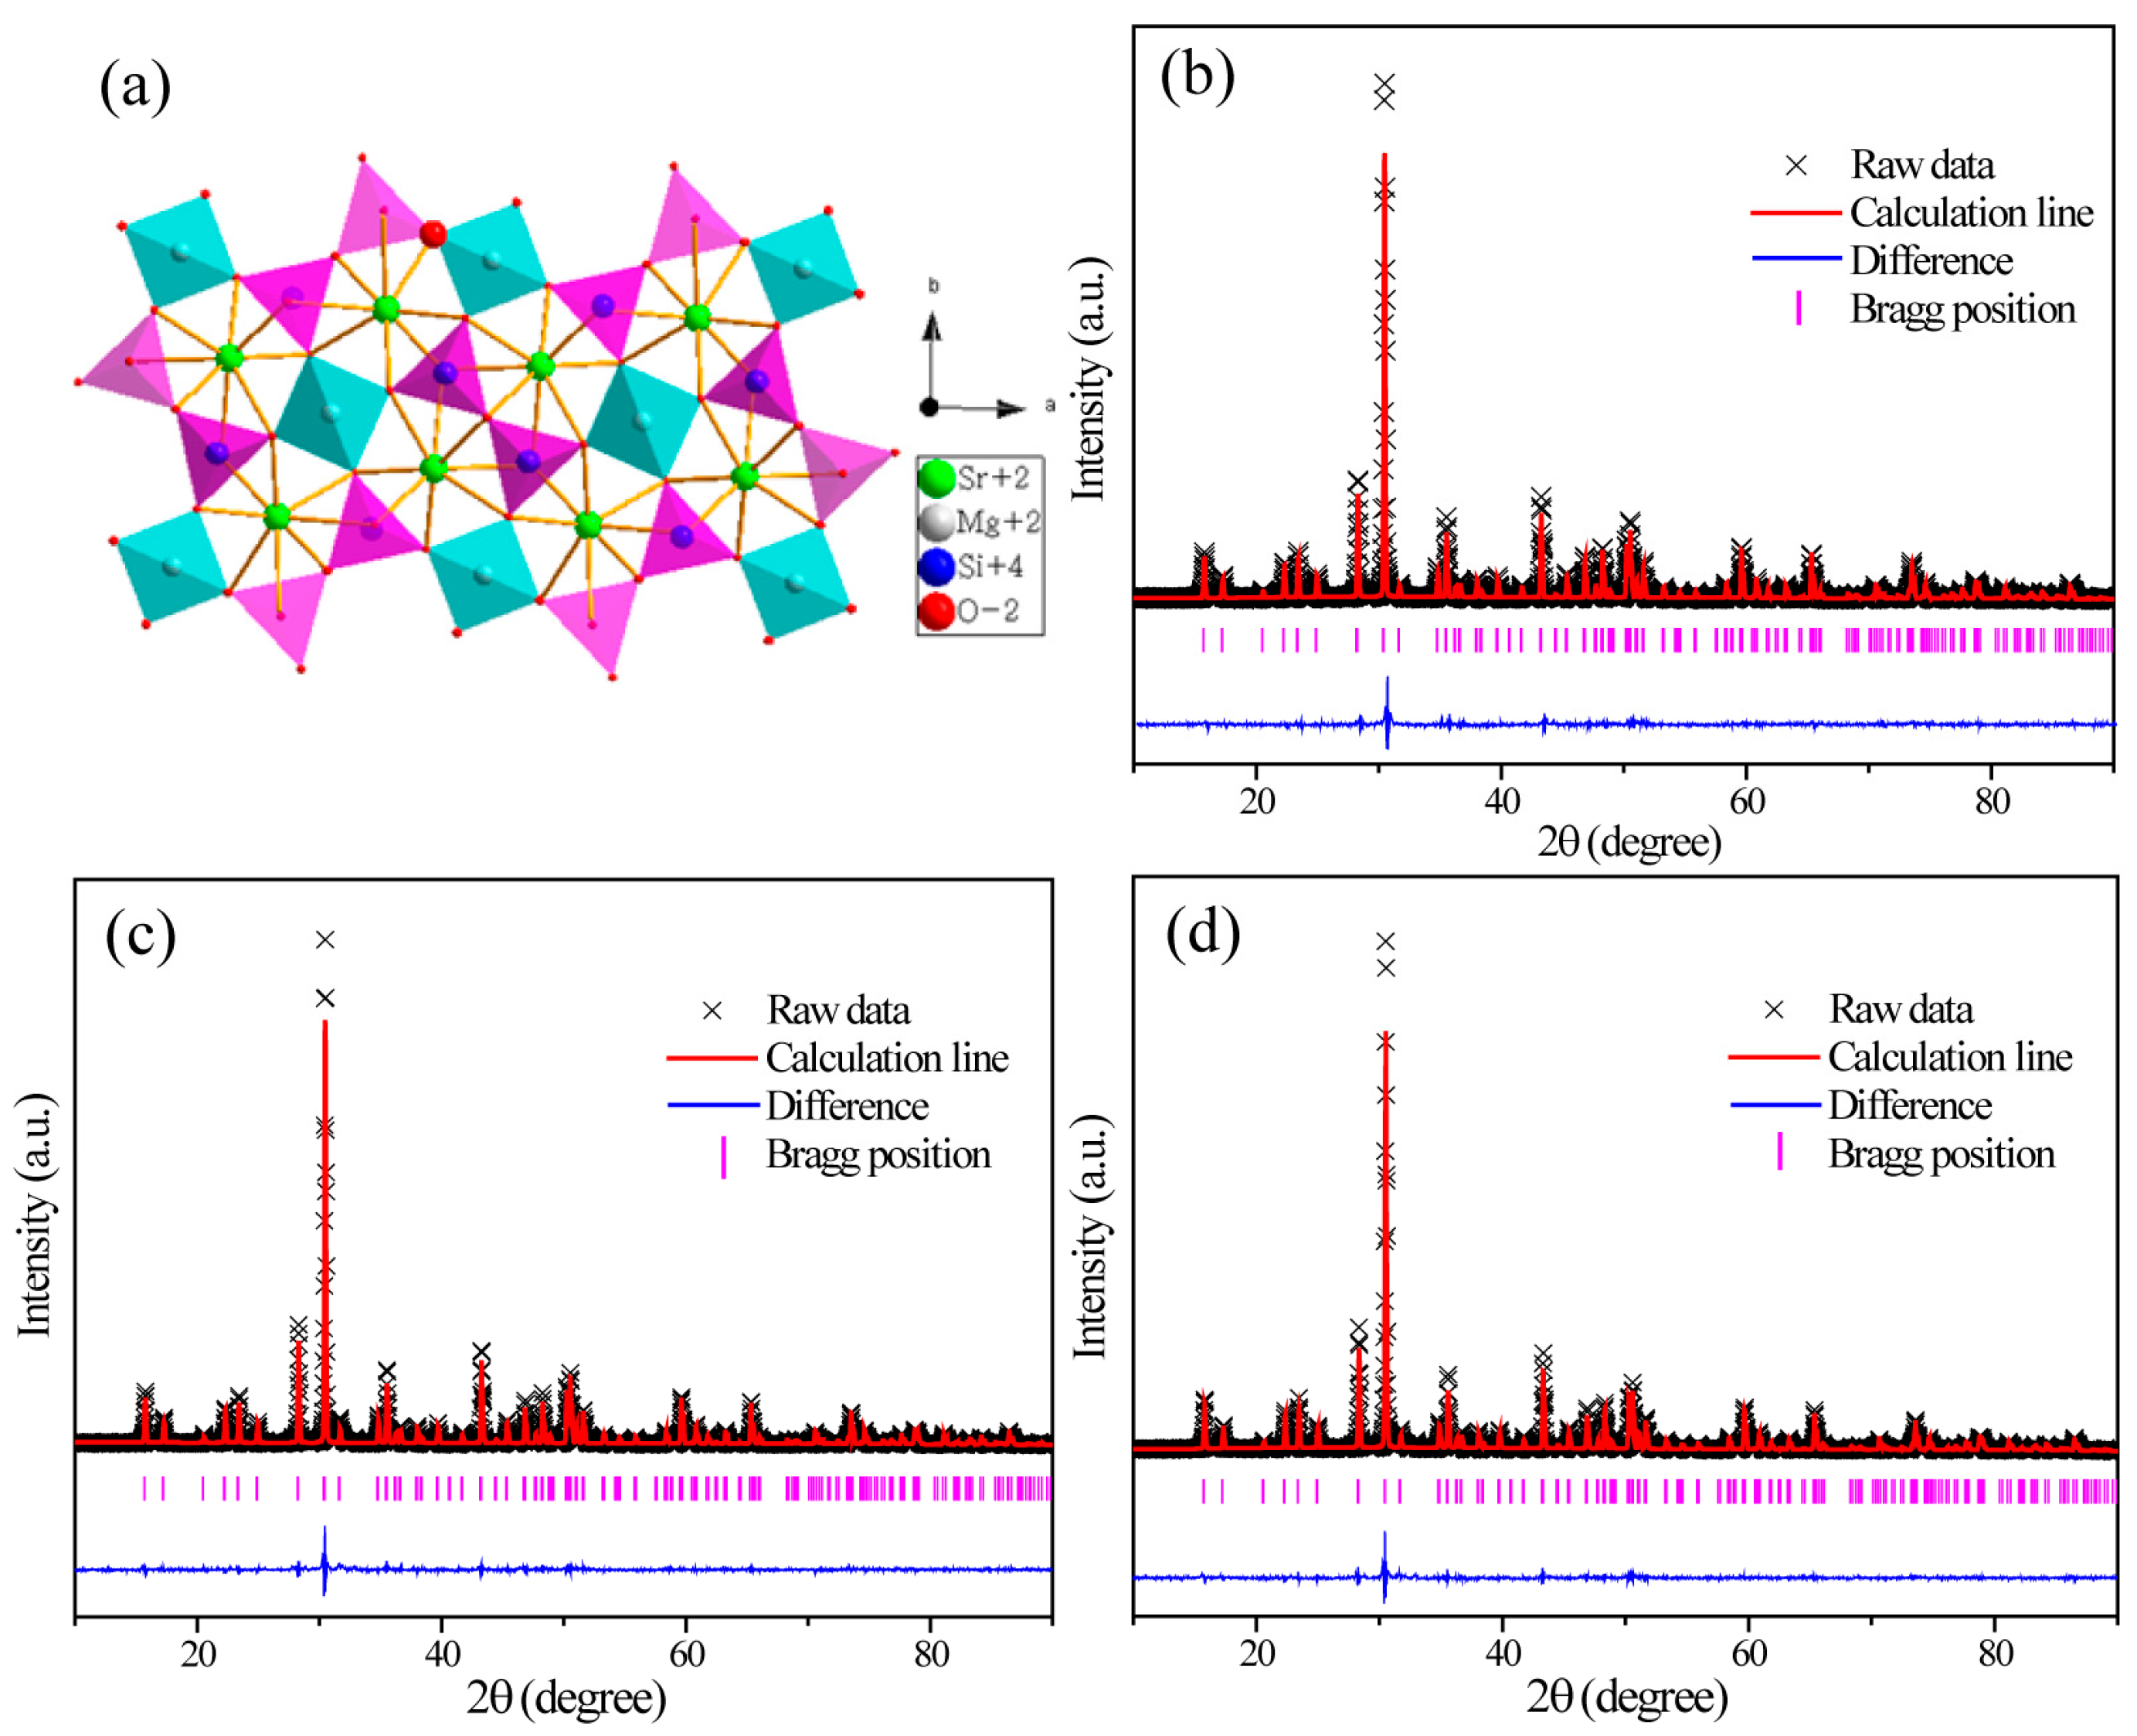
2.1.Phase and Structure Analysis

Figure 1 gives the XRD patterns of Tb3+ and Eu3+ ions single-doped or co-doped SMSO phosphors prepared by high temperature solid state reaction at 1300 °C for 3 h. It can be found that all diffraction peaks of phosphors matched well with SMSO phase (JCPDS#15-0016), demonstrating that prepared samples are single-component and a small quantity of Tb3+ and Eu3+ ions will not induce any other significant changes for SMSO lattice.
Figure 2a depicts the crystal structure of SMSO crystallizes in a tetragon, with cell parameters of a = b = 8.01 Å, c = 5.16 Å, V = 331.34 Å3, Z = 2. Rare earth ions preferred to occupy Sr2+ rather than Mg2+ sites because of similar ionic radius of Sr2+ (r = 1.26 Å for CN = 8), Mg2+ (r = 0.57 Å for CN = 4), Tb3+ (r = 1.04 Å for CN = 8) and Eu3+ (r = 1.06 Å for CN = 8) [20]. In order to further identify the influence of doping ions on crystal structure, structure refinement of powder XRD patterns of SMSO:0.08Tb3+, SMSO:0.10Eu3+ and SMSO:0.08Tb3+, 0.04Eu3+ samples were performed by the general structure analysis system (GSAS) method. The final results were summarized in Table 1. The original structure model with crystallographic data of SMSO (ICSD #155330) was used to refine the above samples. Corresponding patterns for Rietveld refinements of SMSO:0.08Tb3+, SMSO:0.10Eu3+ and SMSO:0.08Tb3+, 0.04Eu3+ samples at room temperature are displayed in Figure 2b,c, respectively. The results indicate that rare earth ions doped SMSO phosphors with space group of P-421m have a tetragonal structure.

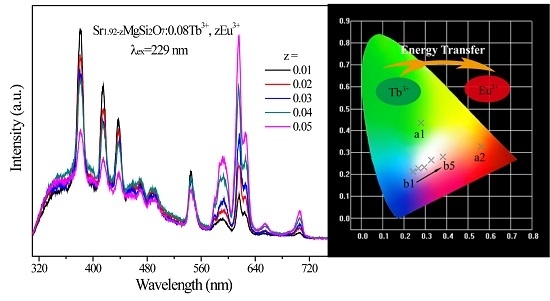
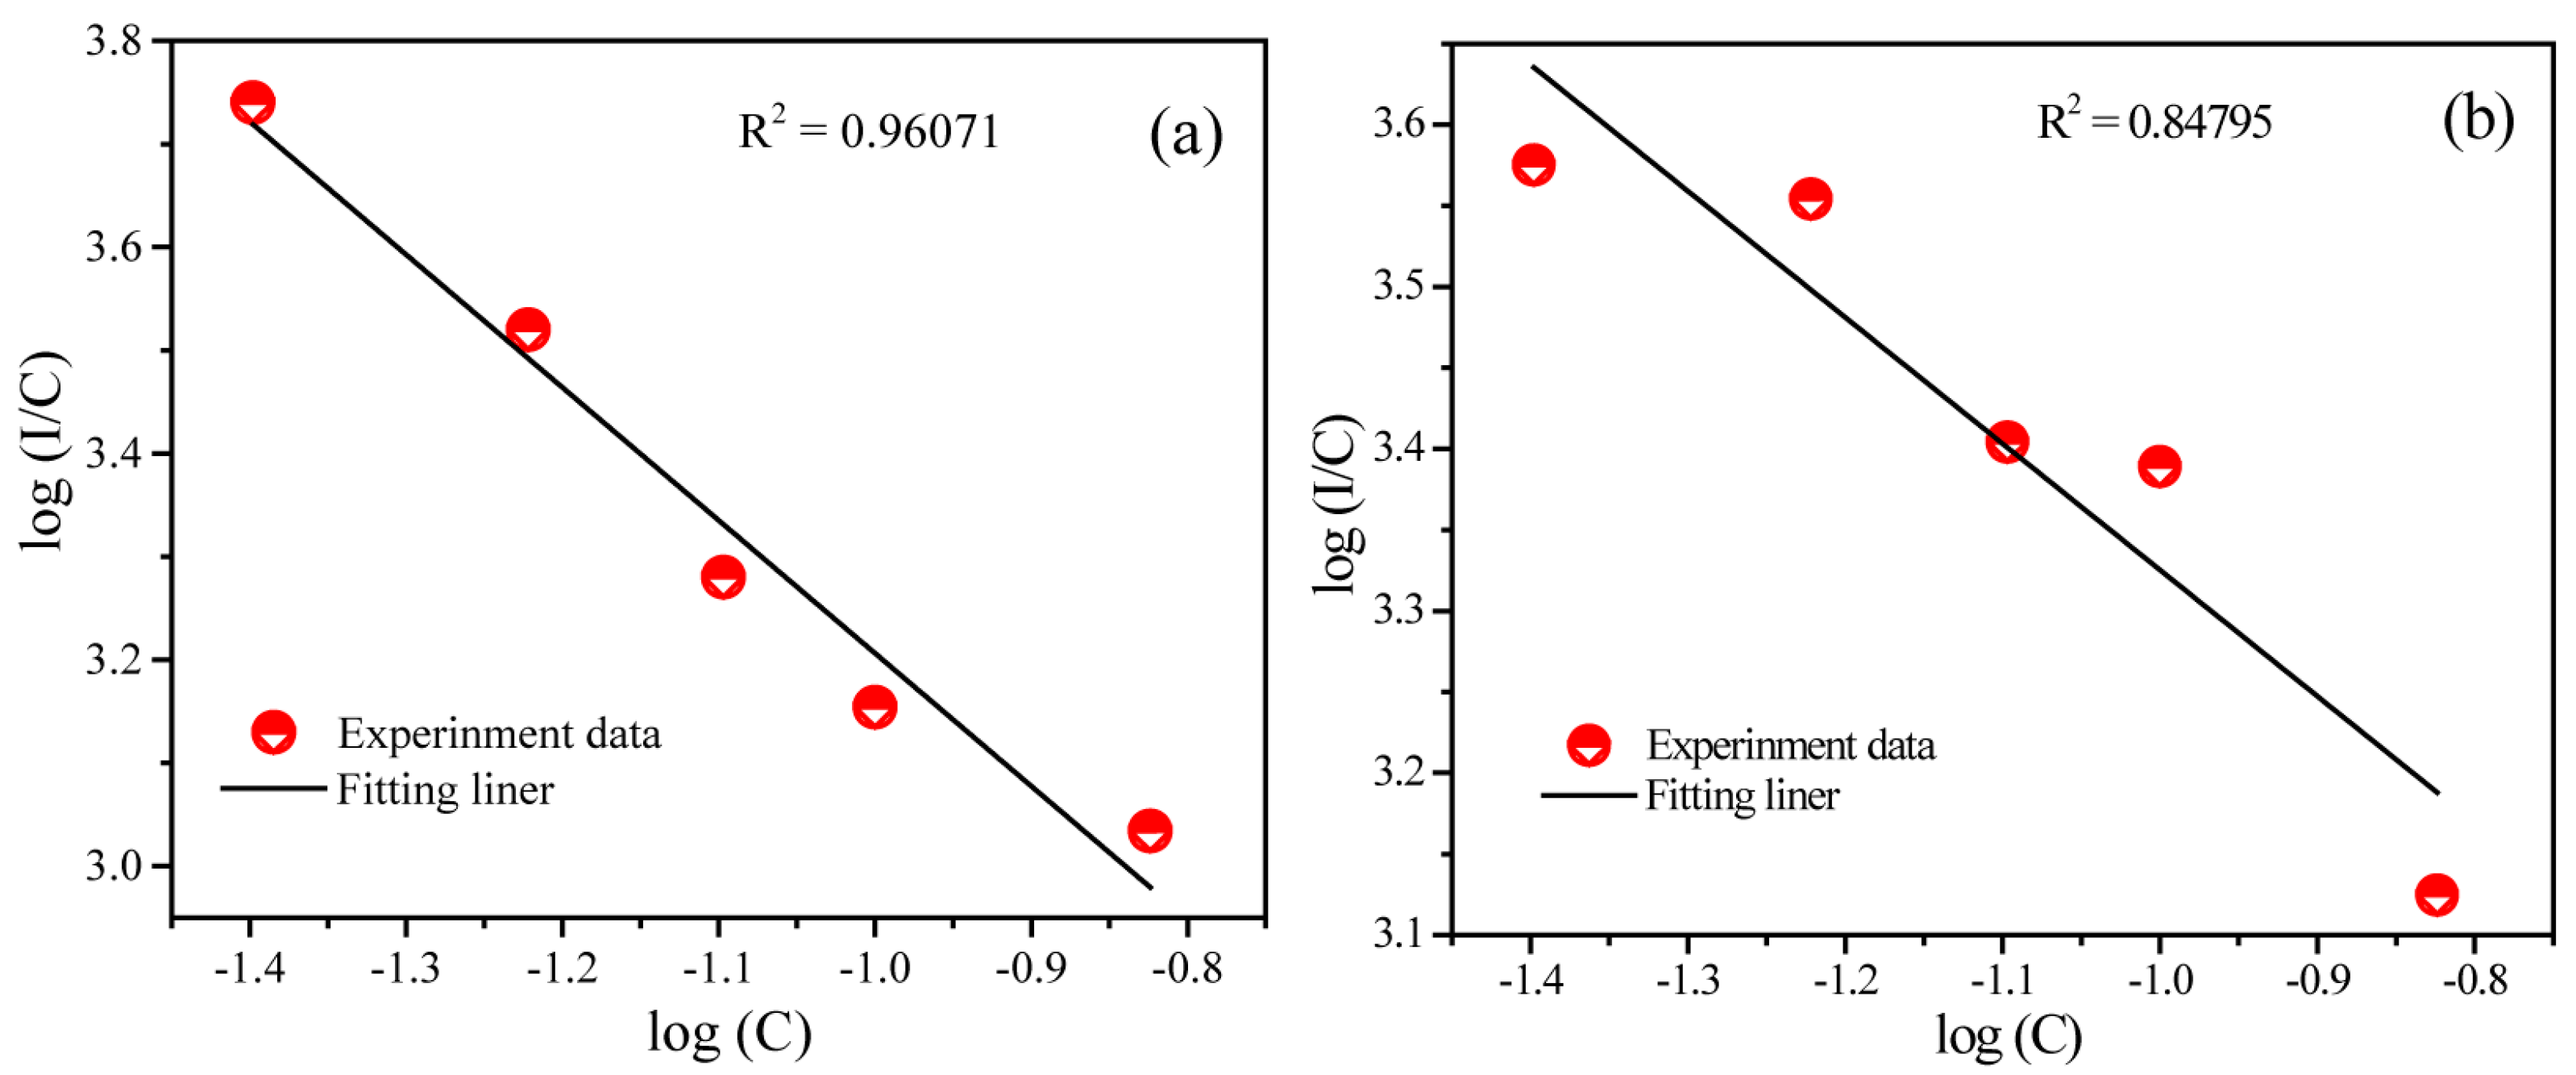
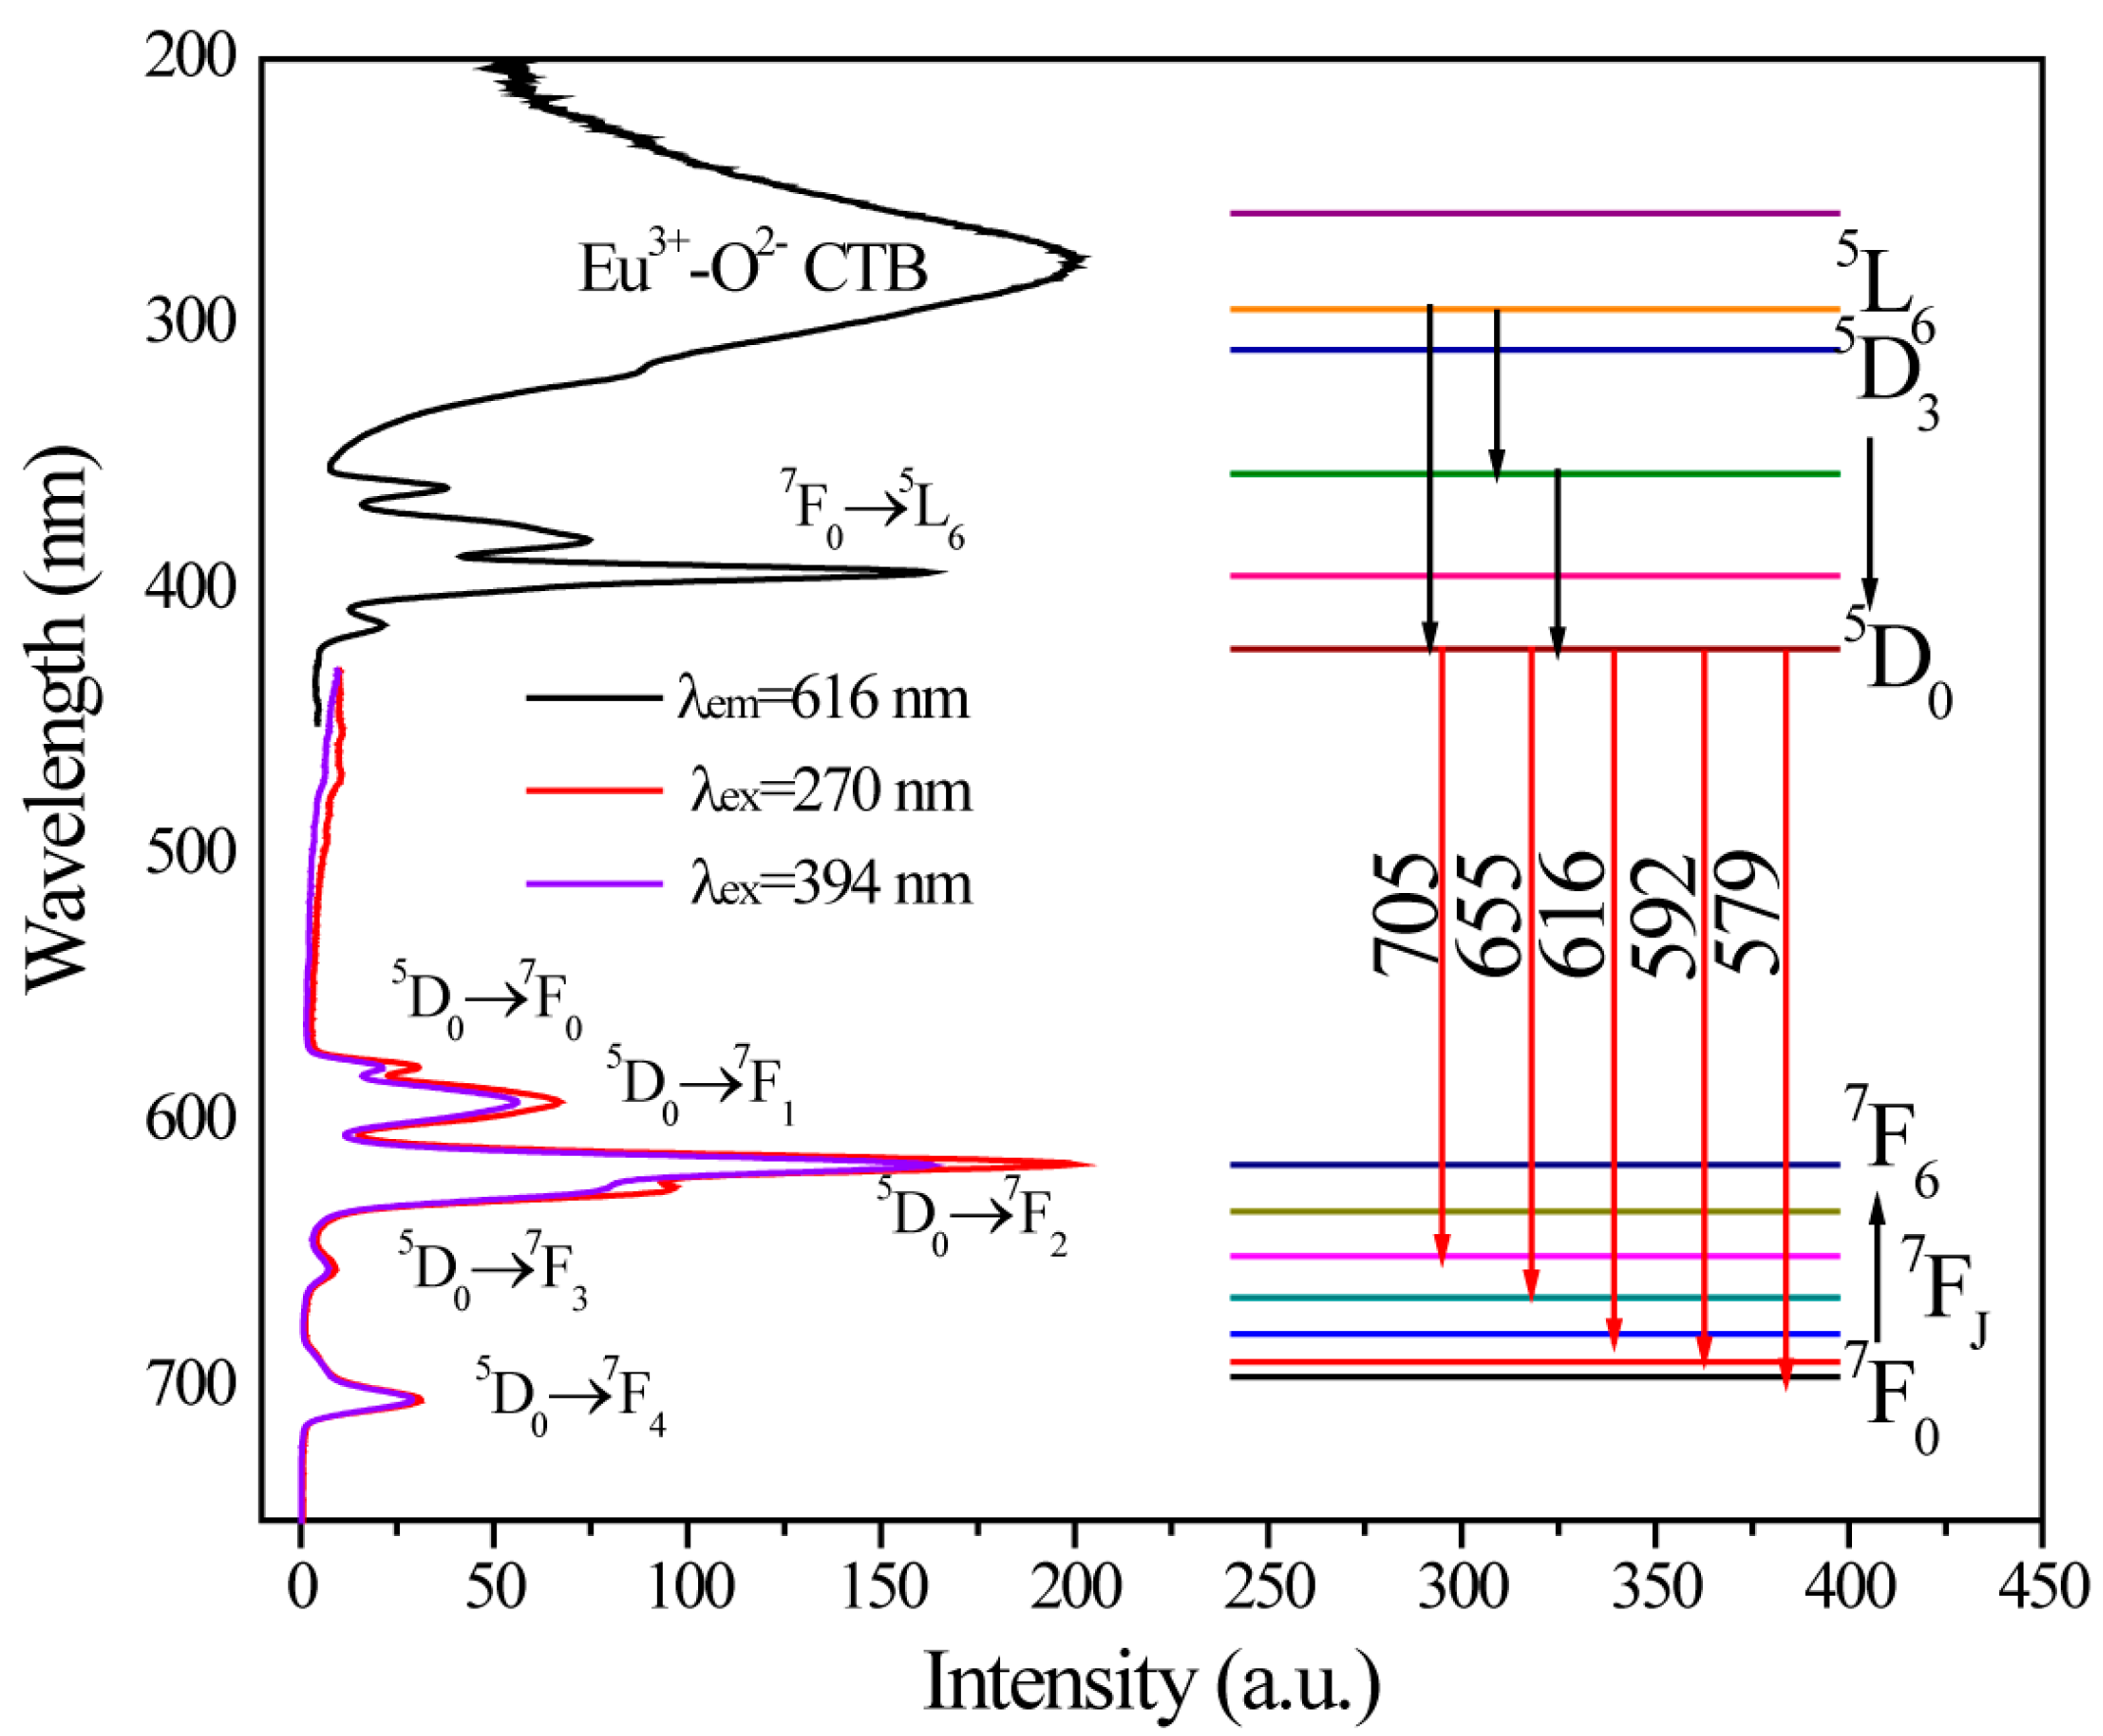
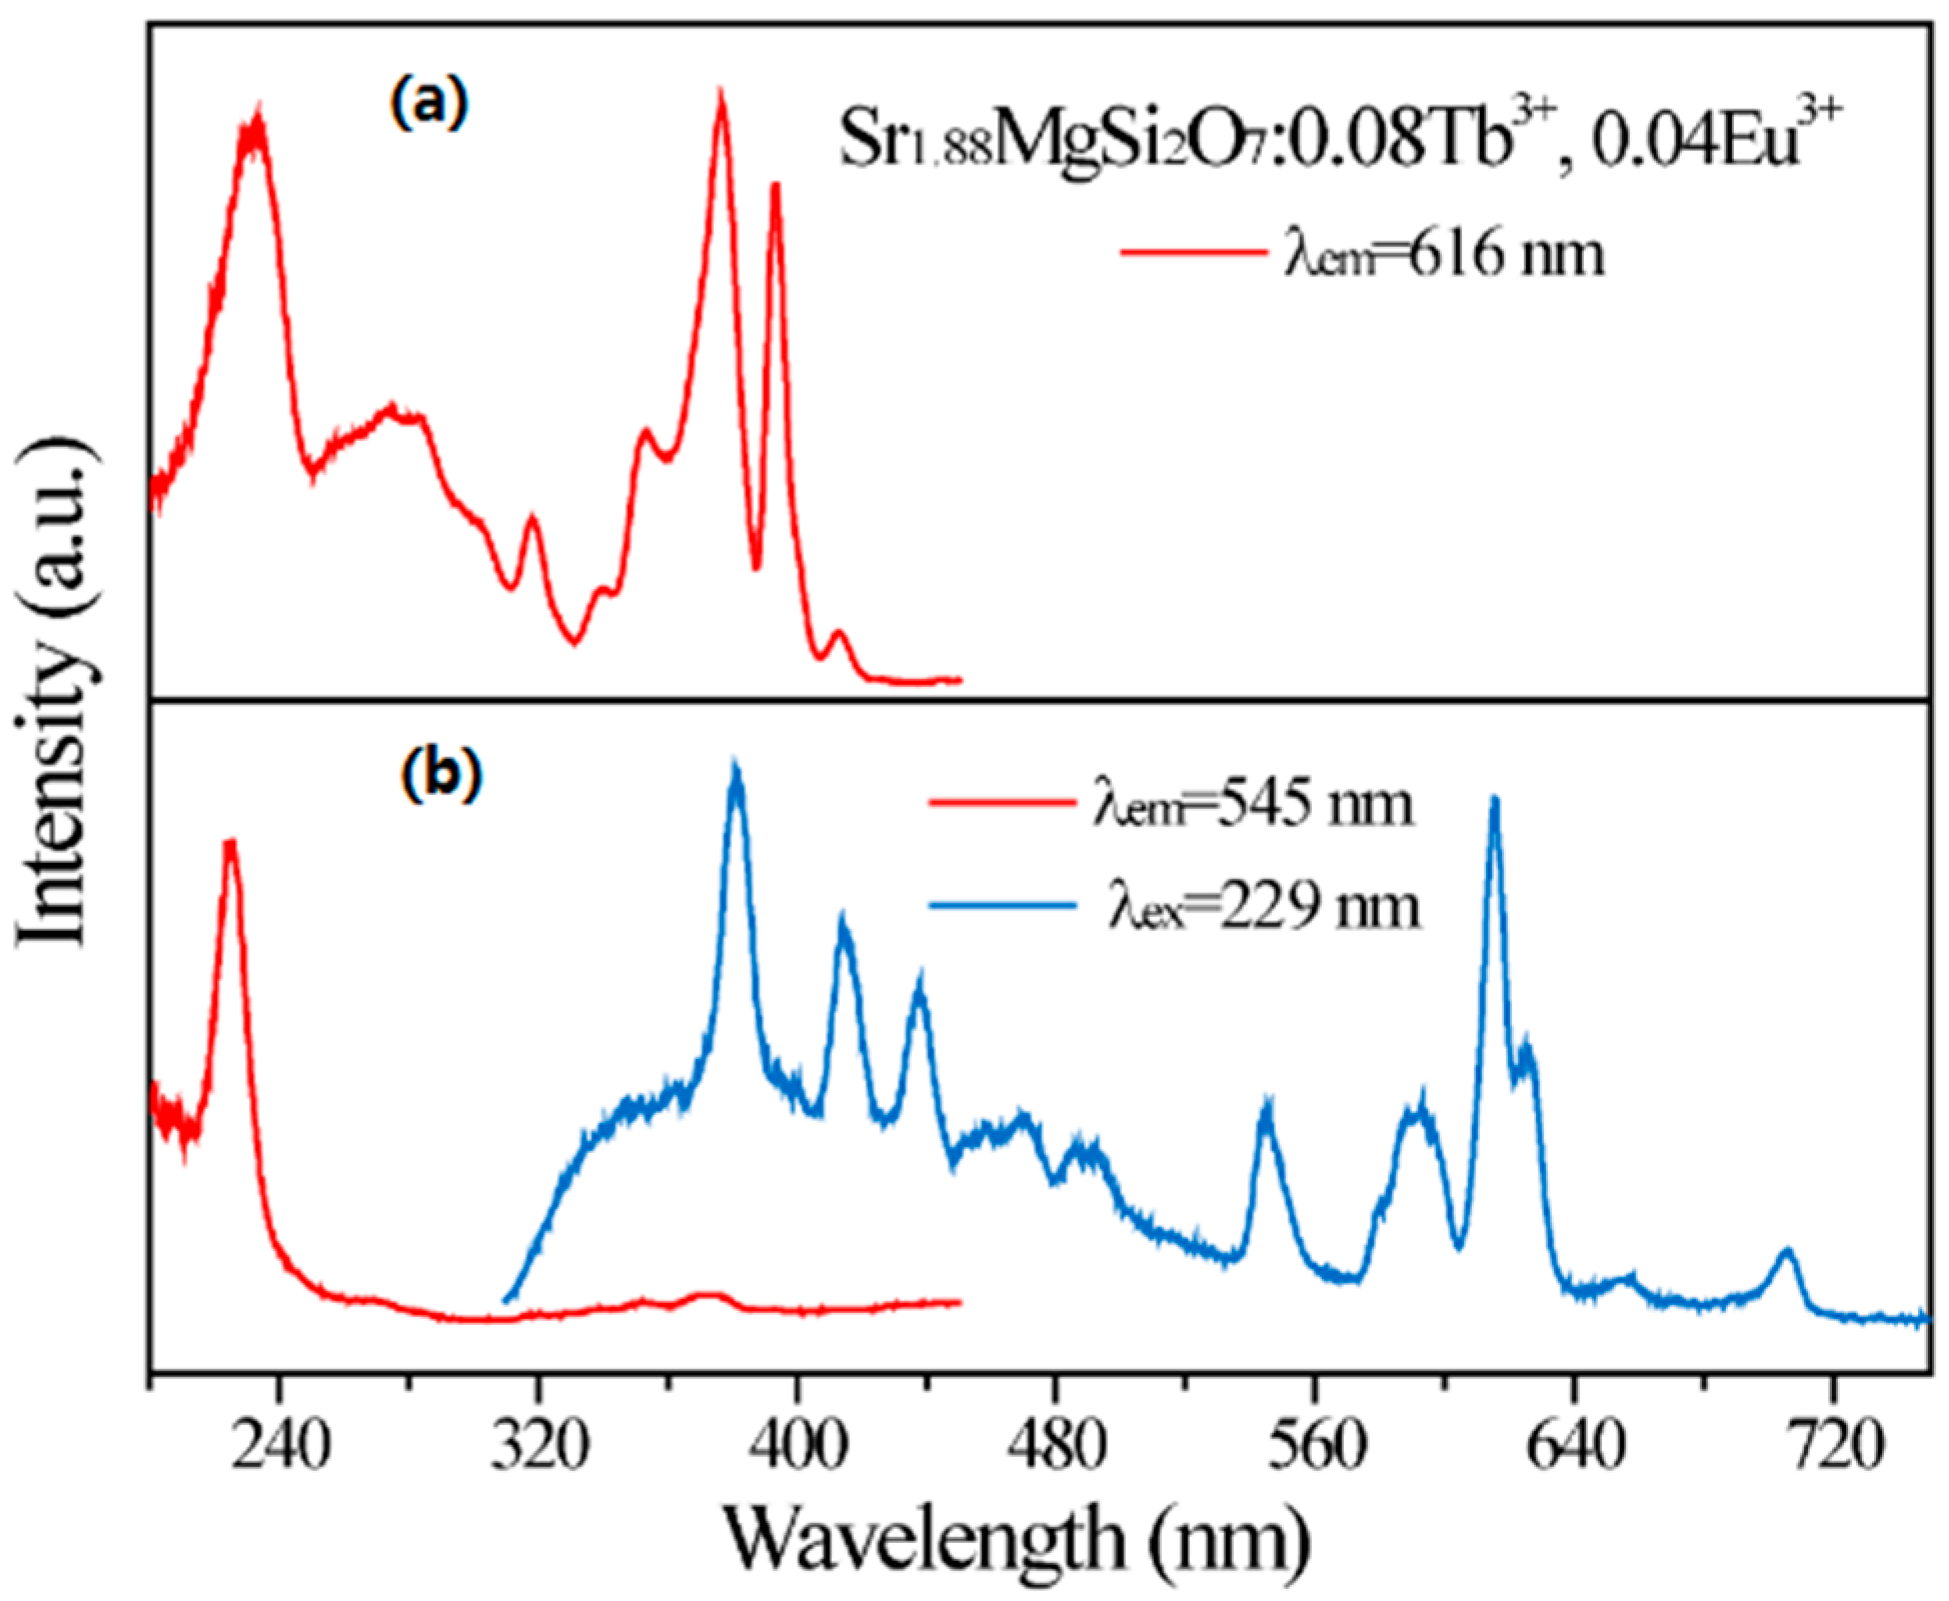
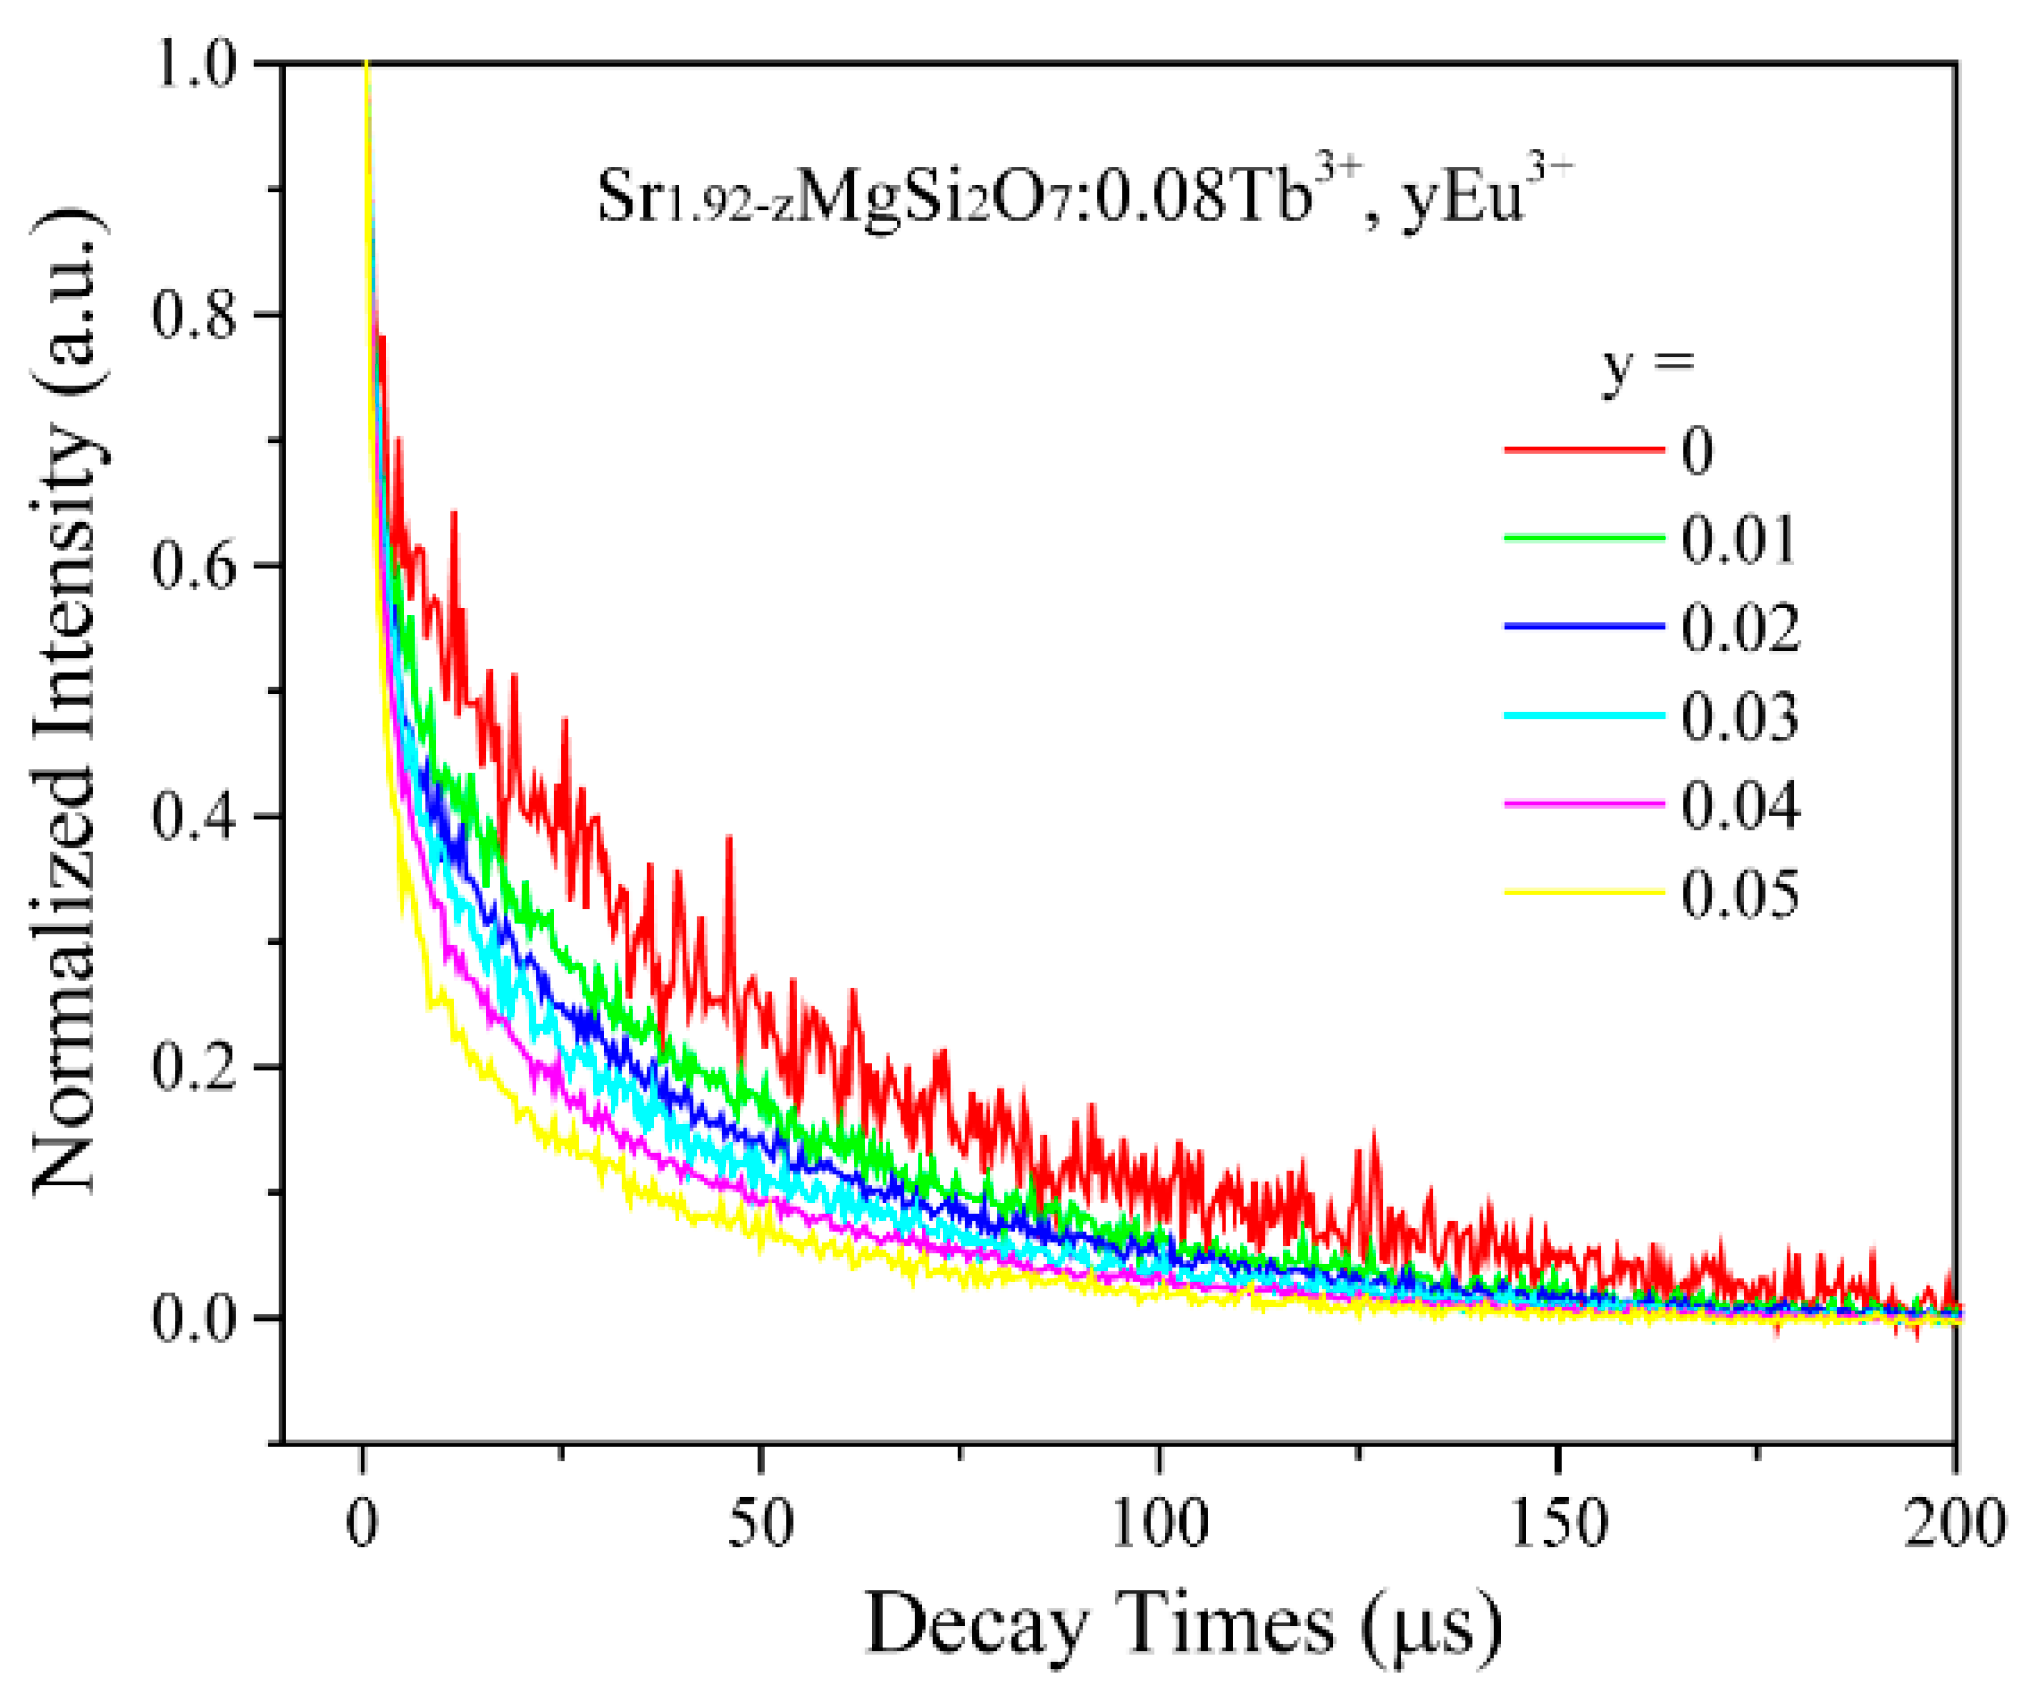
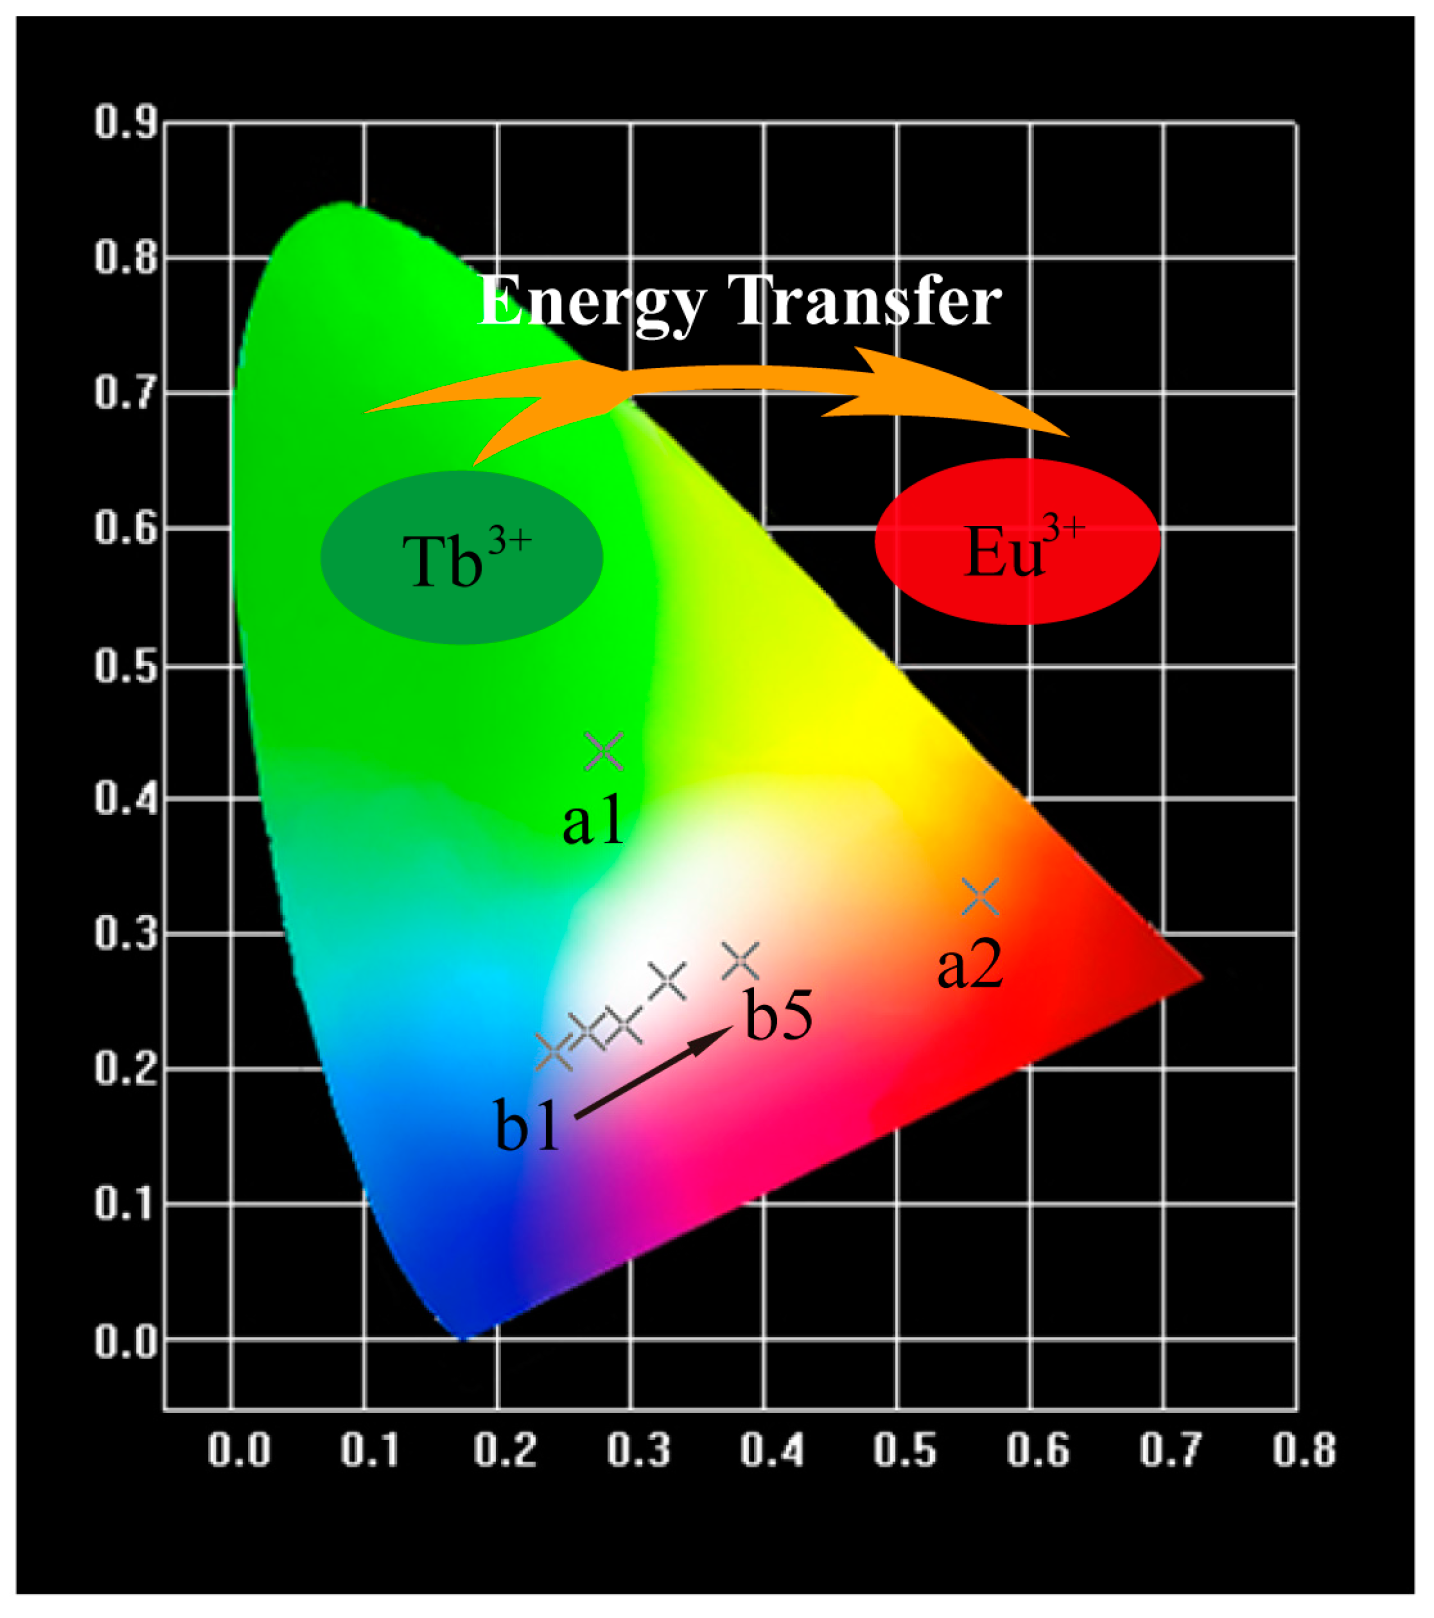
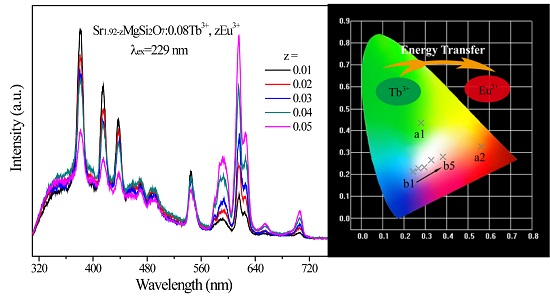
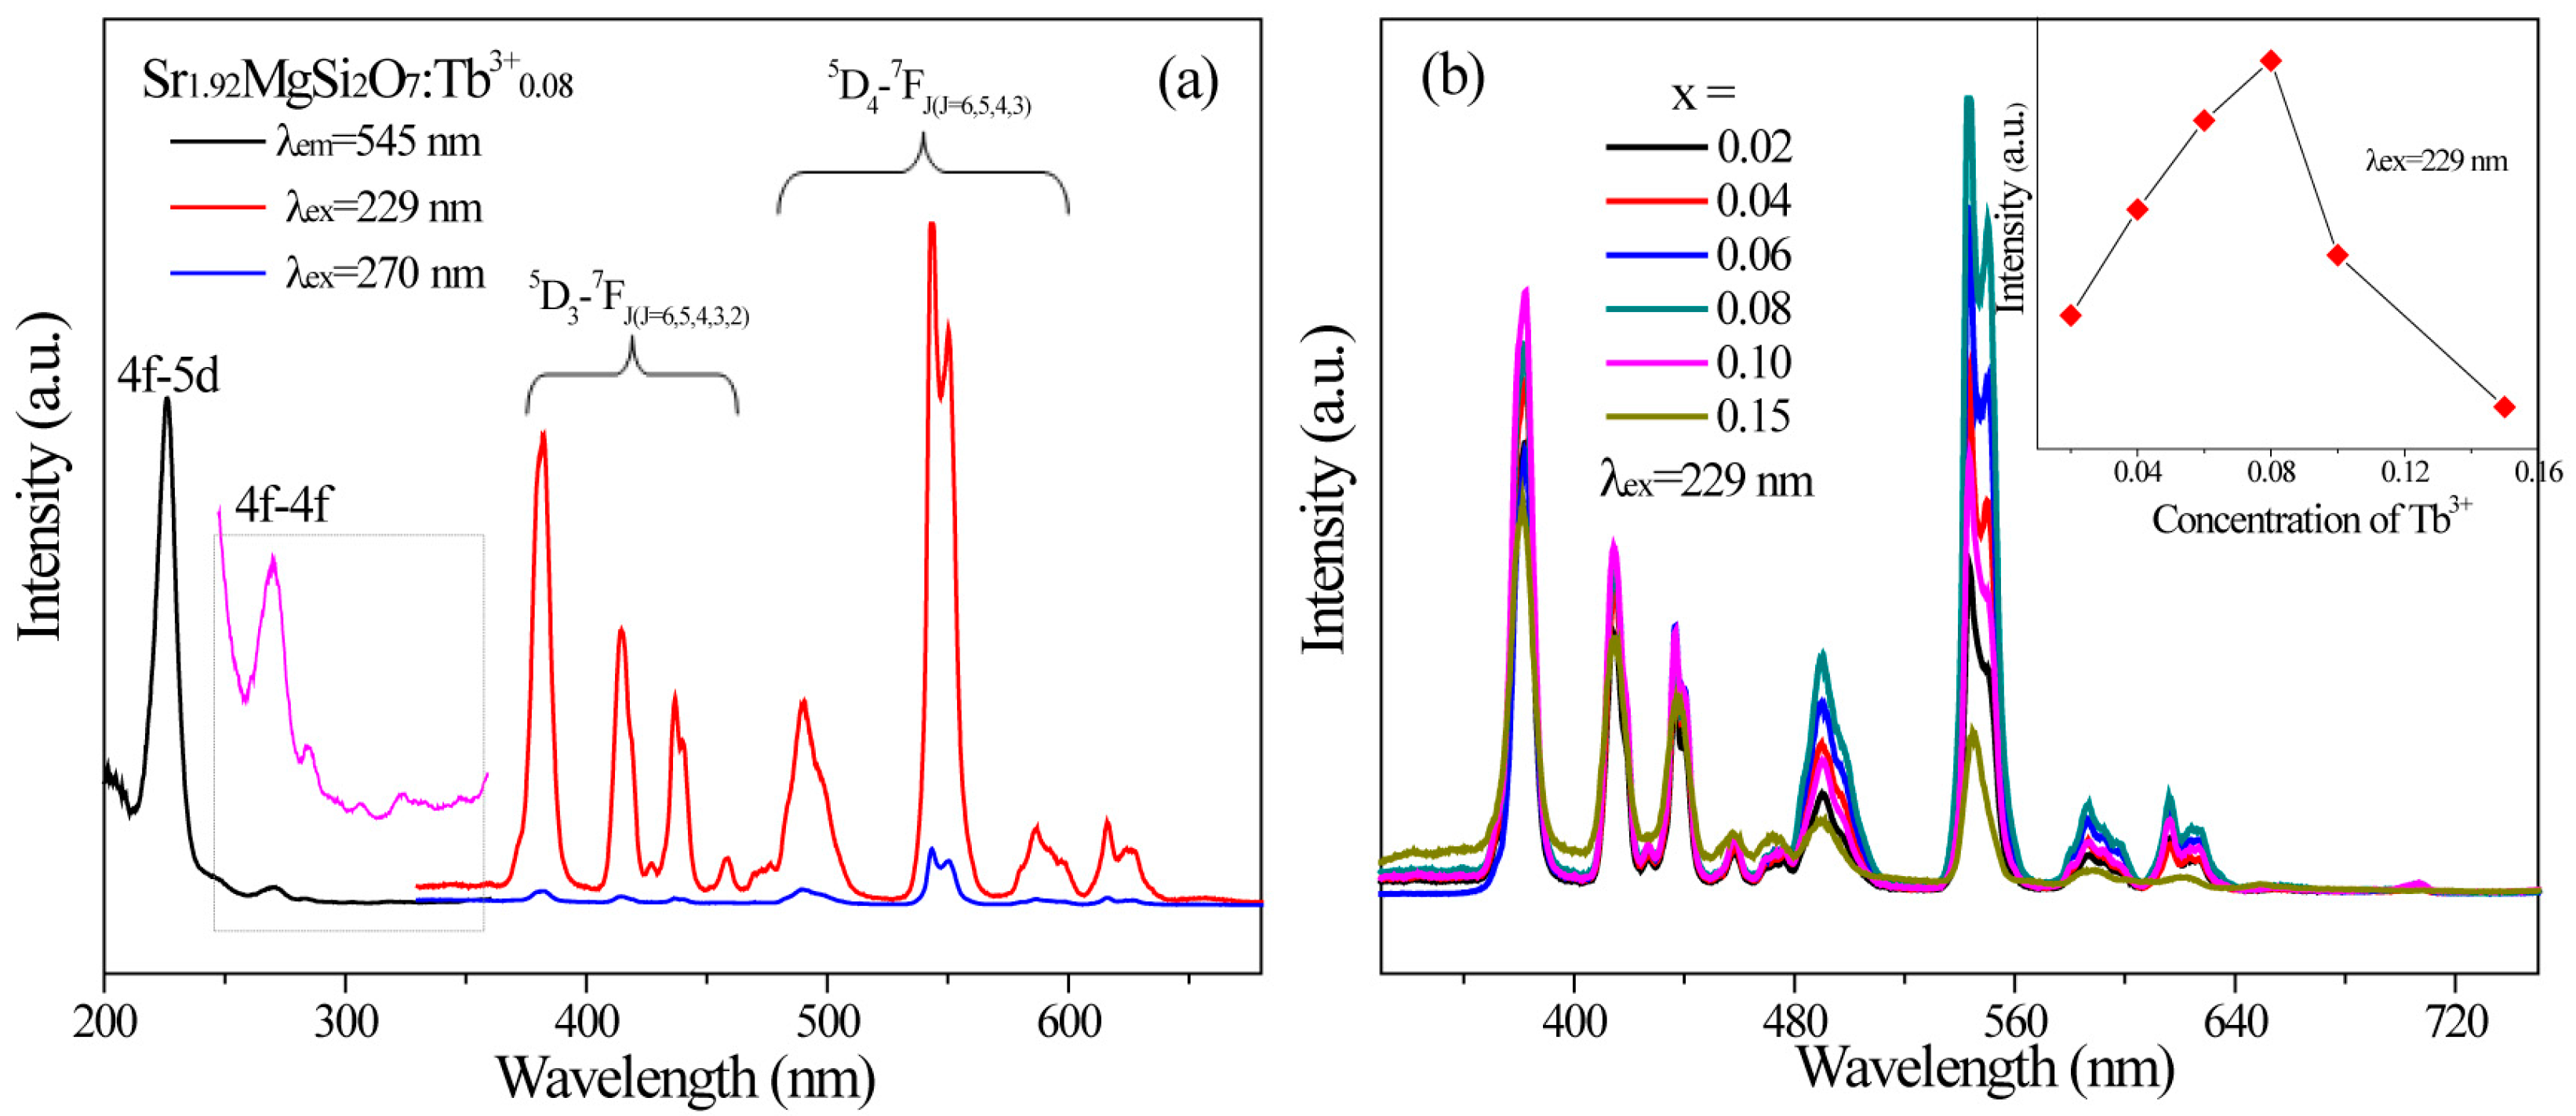
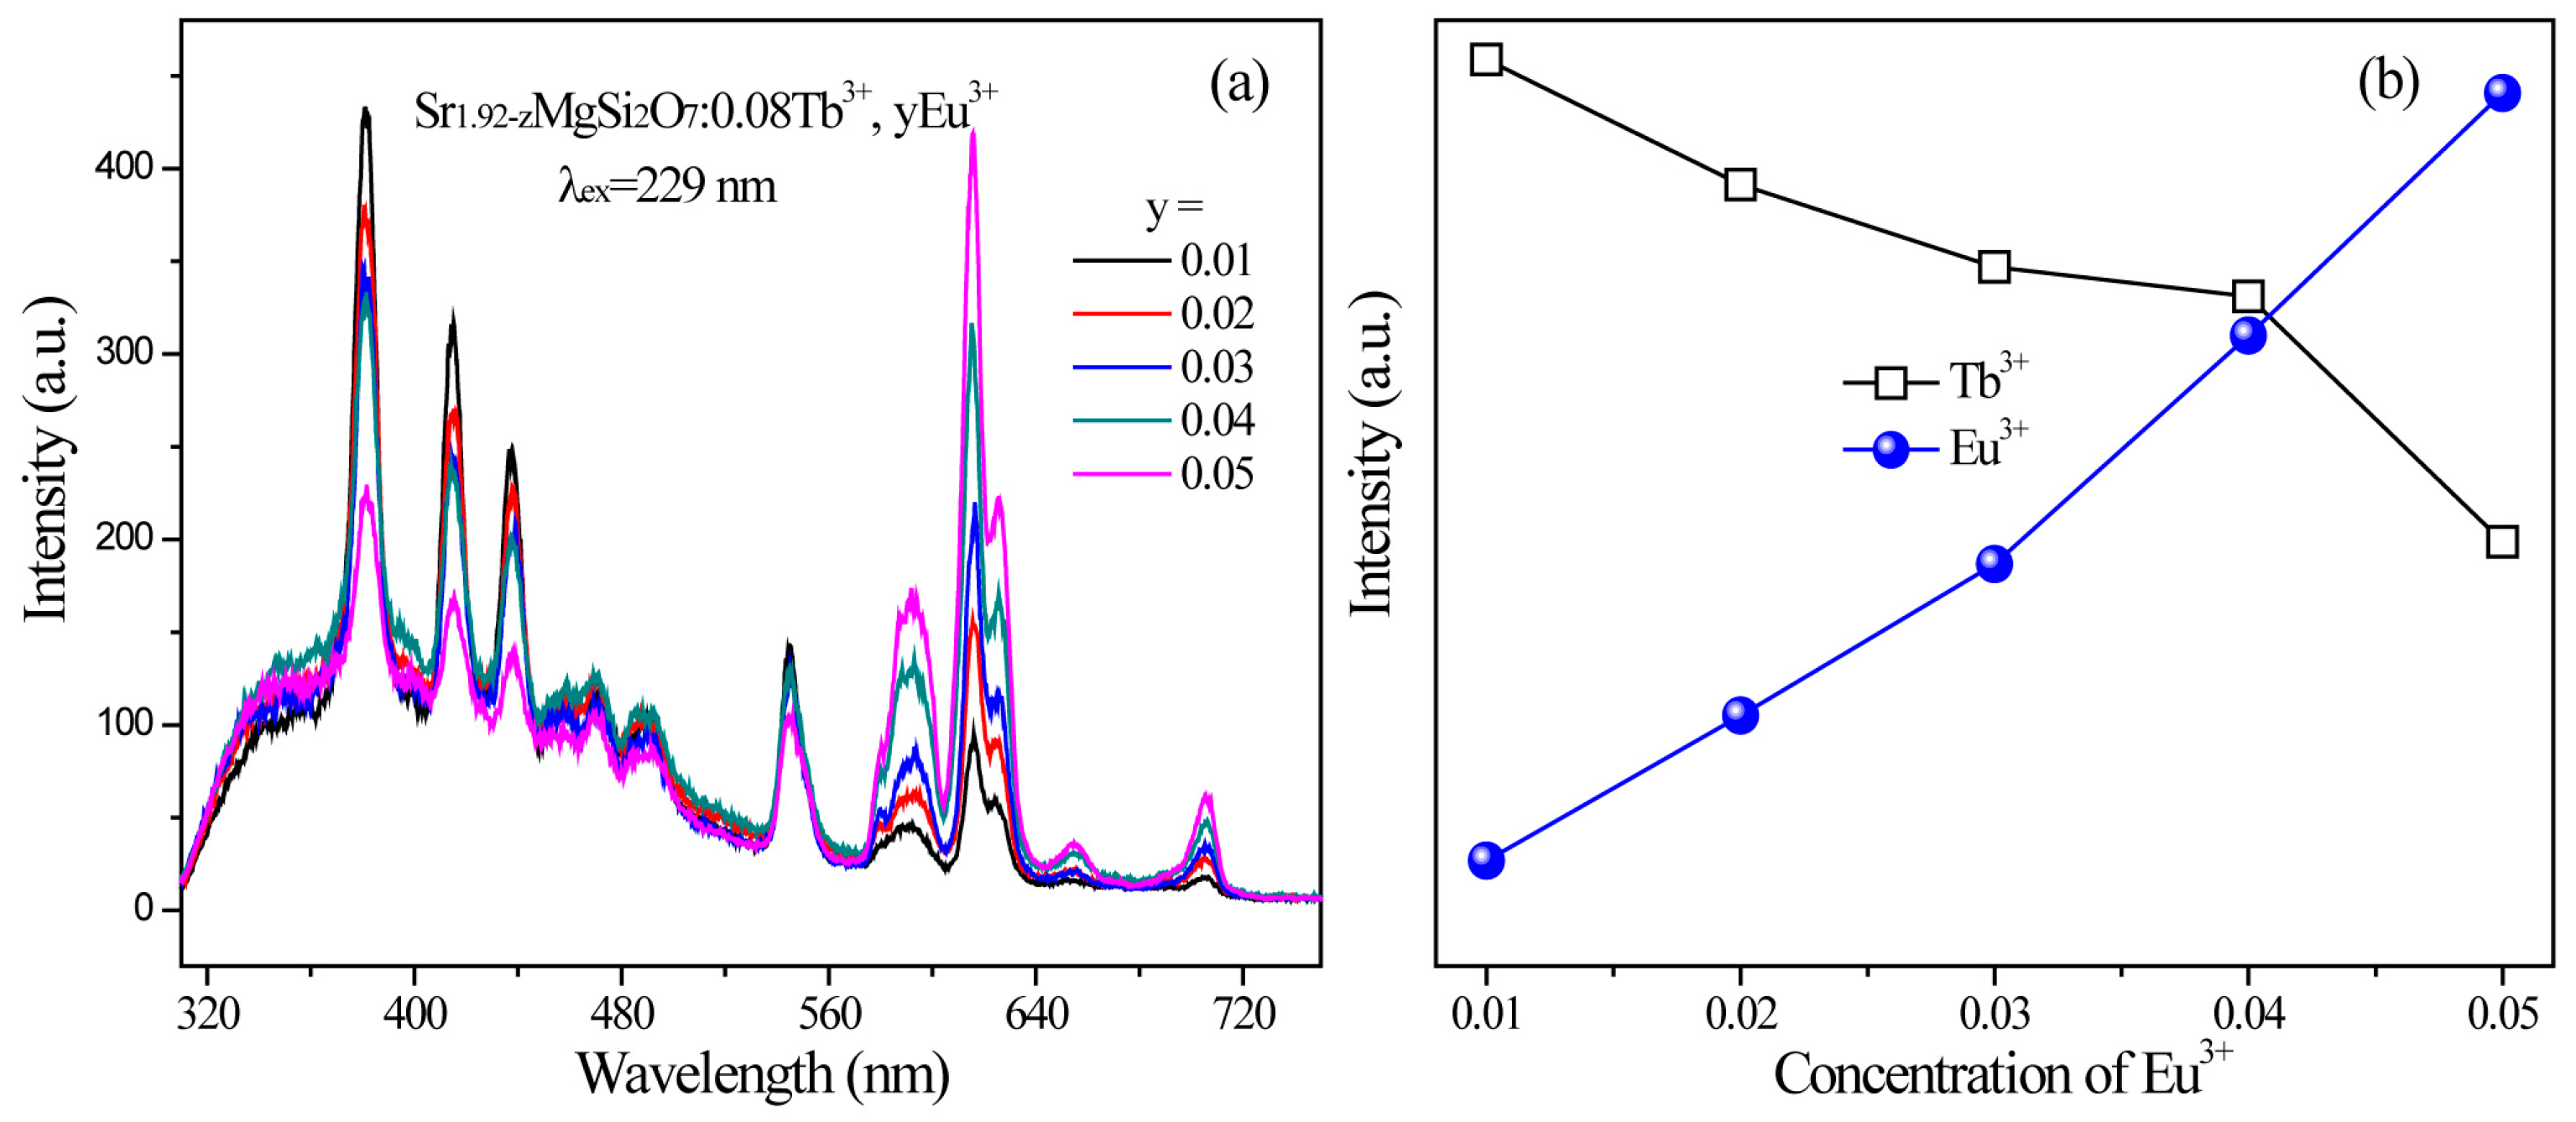
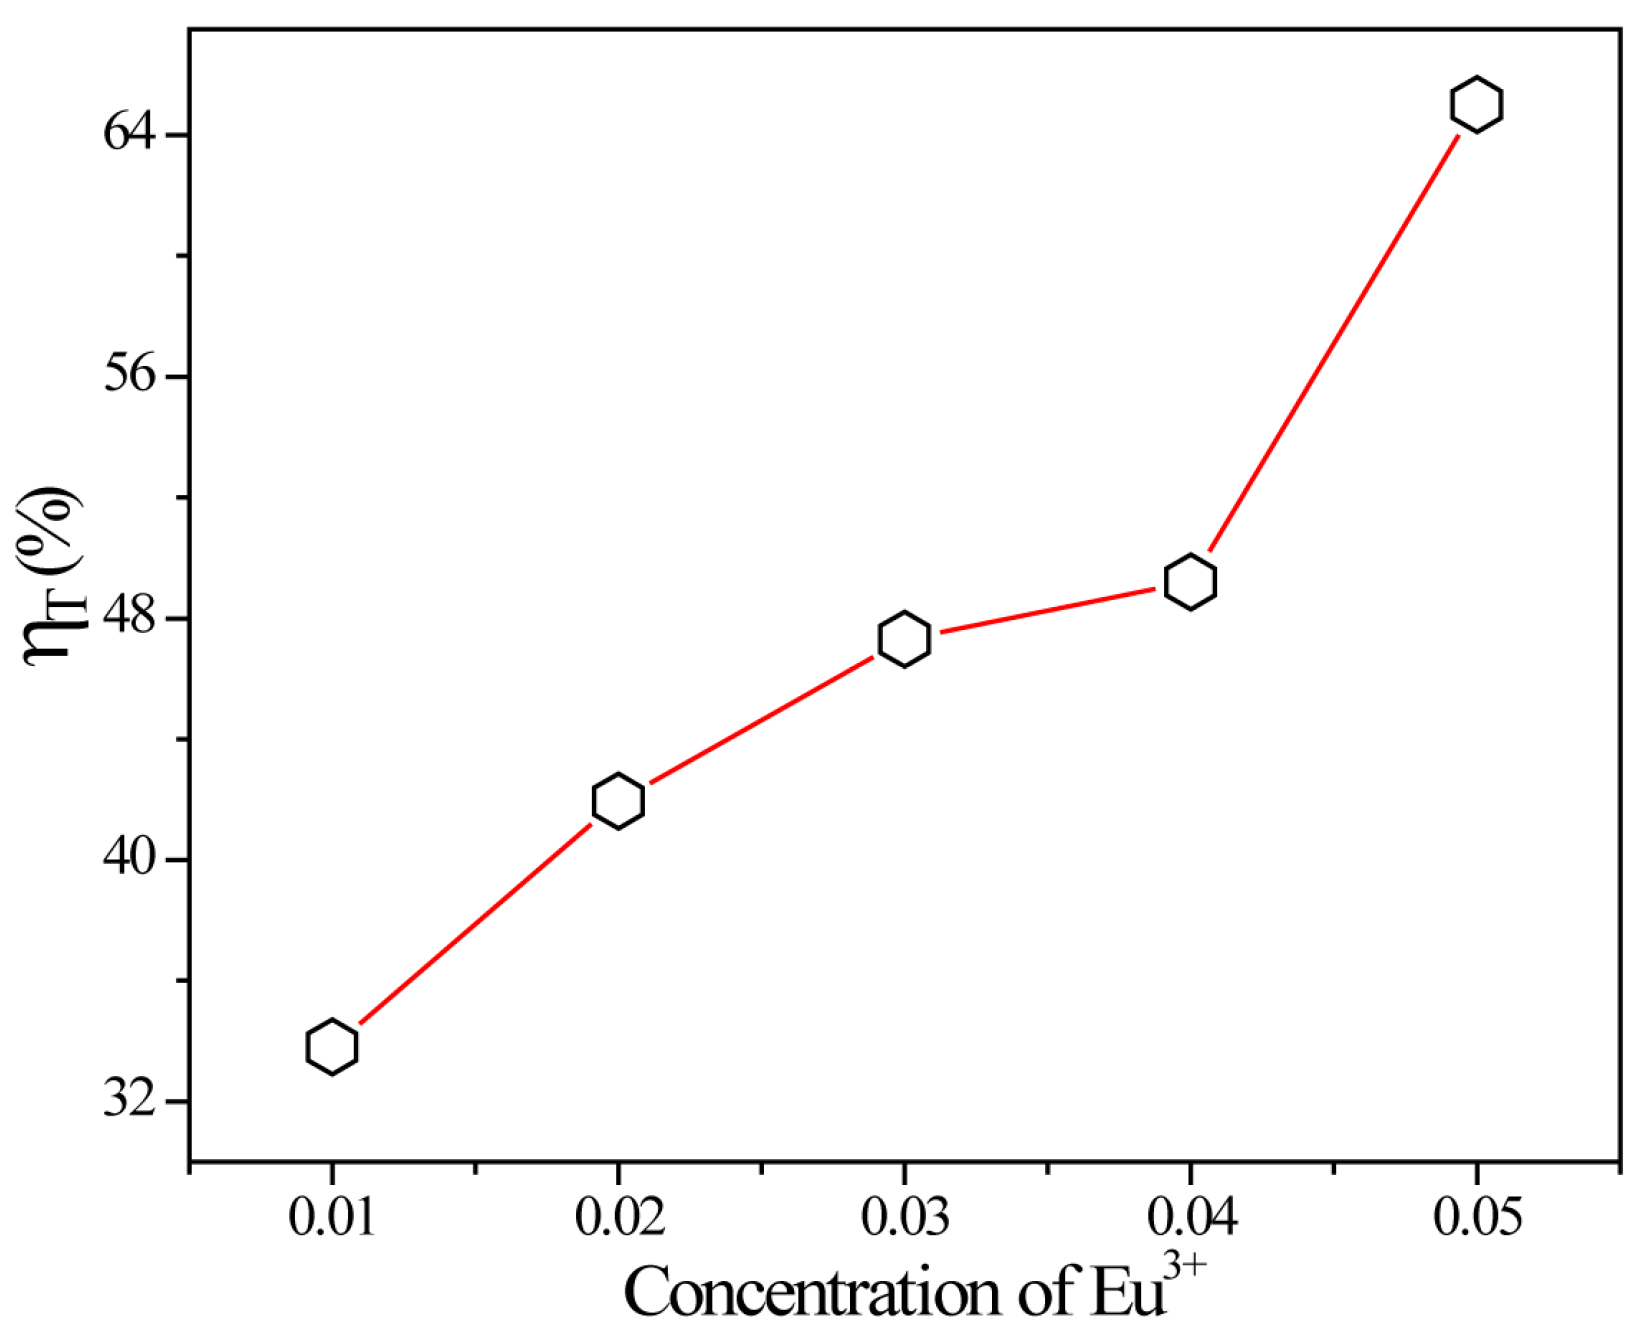
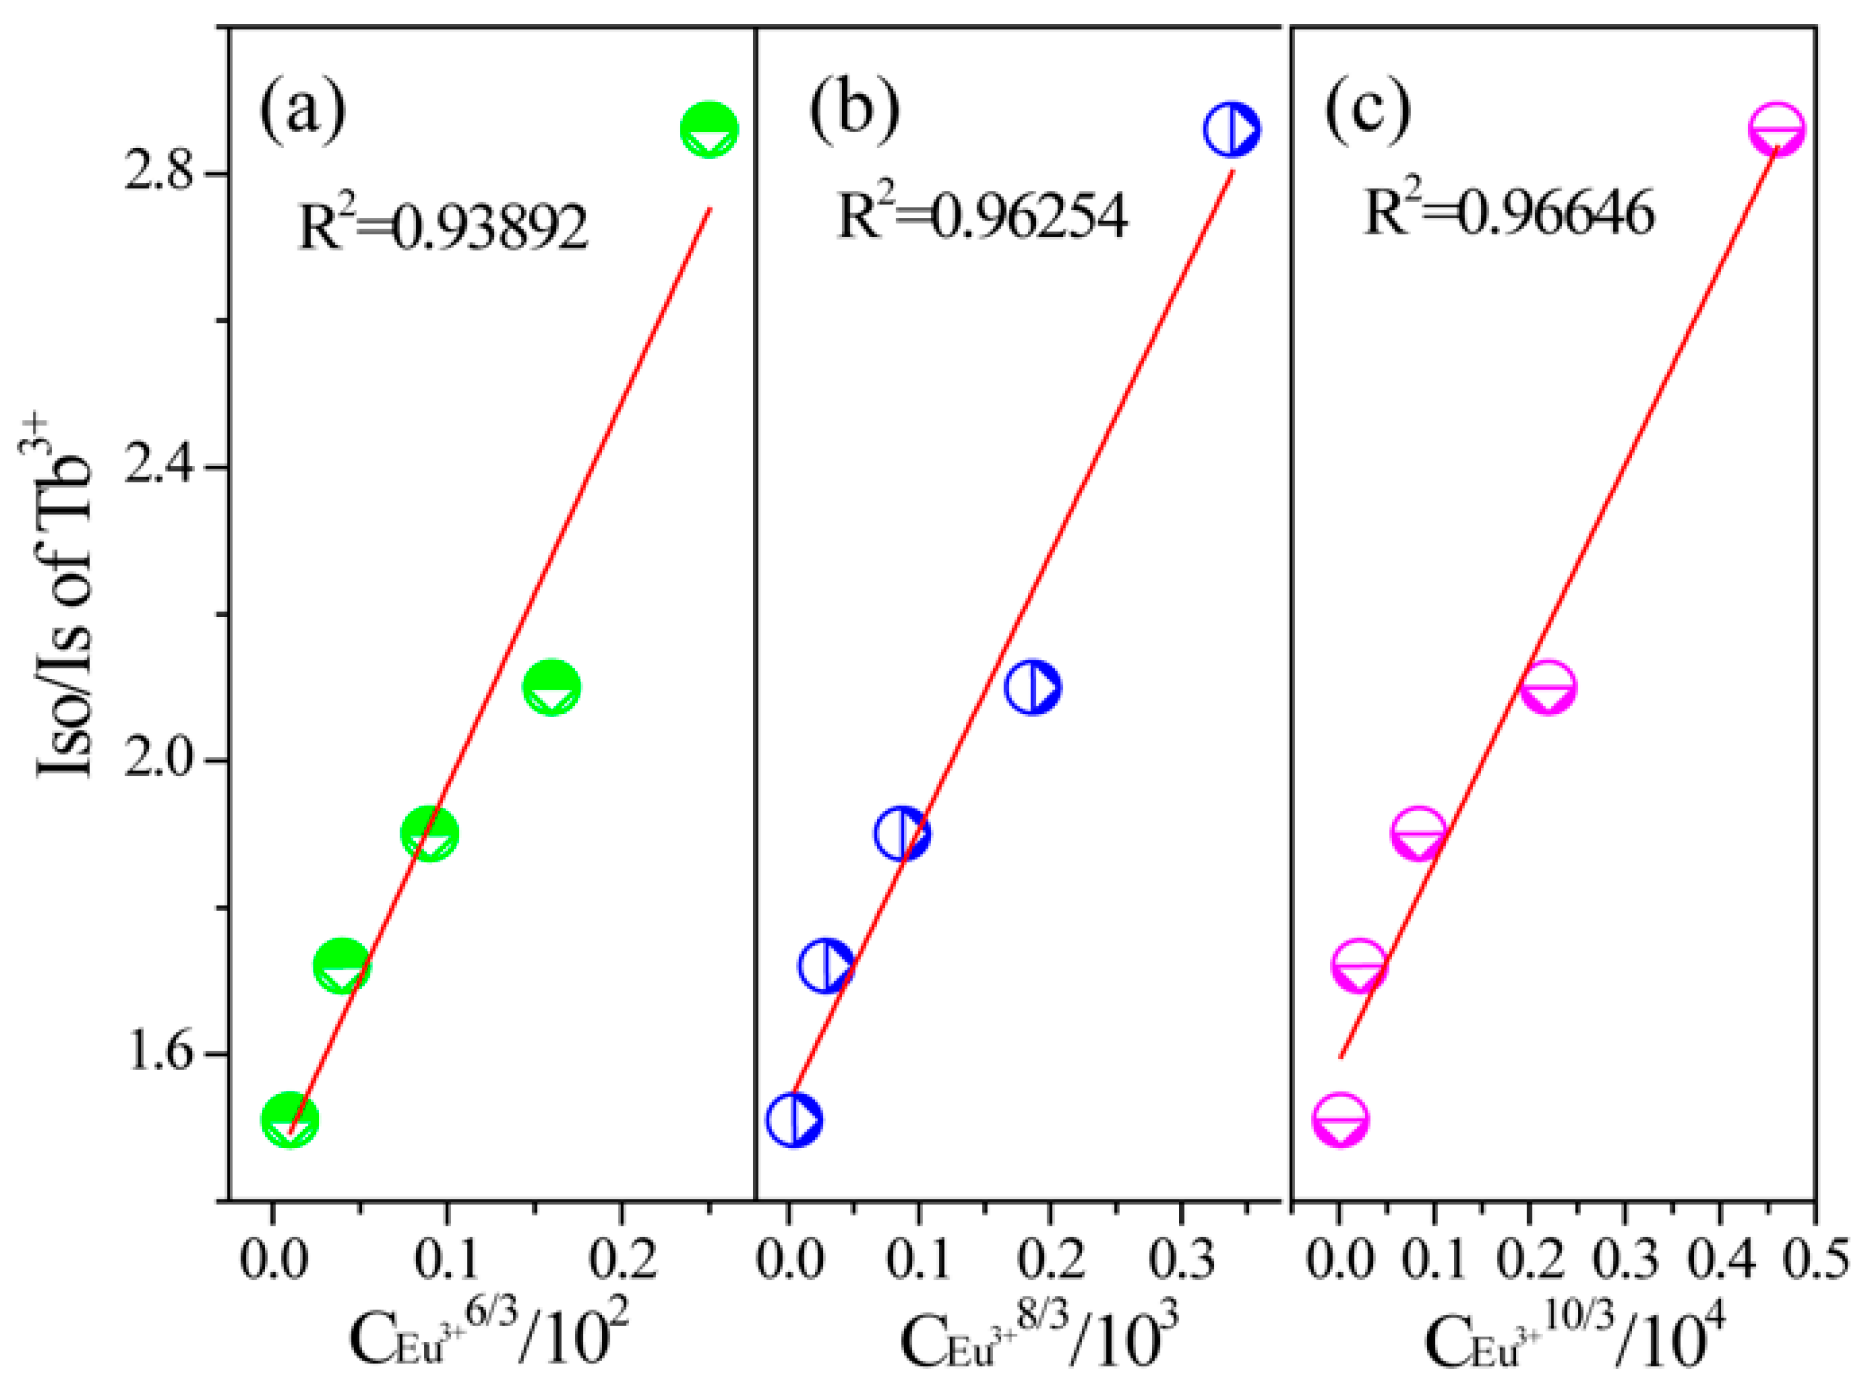
2.2. Photoluminescence and Energy Transfer

Figure 3a gives the excitation and emission spectra of SMSO:0.08Tb3+ phosphor. The excitation spectrum monitored at 545 nm shows a broad band ranging from 200 to 250 nm with the maximum at 229 nm, which originated from 4f-5d spin-allowed transition of Tb3+. Other weak absorption bands in the region of 250 to 350 nm are ascribed to 4f-4f spin-forbidden transitions. When excited at 229 nm, the emission spectrum composes of both 5D37FJ (J = 3, 4 and 5) and 5D47FJ (J = 3, 4, 5 and 6) transitions. It can be observed that there is no other important change for Tb3+ emission except for the luminescence intensity under different excitation conditions.
Figure 3b displays the emission spectra of SMSO:xTb3+samples with different Tb3+ concentration under excitation of 229 nm. The inset shows the change of luminescence intensity of Tb3+ according to different Tb3+doping concentration. It can be seen that luminescence intensity of SMSO:xTb3+ samples increases gradually with increasing Tb3+ content from 0 to 8 mol %, and then decreases when the concentration of Tb3+ is enhanced over 8 mol %. It is due to the concentration quenching effect, which is assigned to non-irradiative energy transfer between adjacent Tb3+ ions. For investigating the concentration quenching mechanism, it is necessary to calculate the critical distance (Rc) between Tb3+ ions. According to concentration quenching theory, Rc was determined by [21,22]:
R c = 2 [ 3 V 4 π X c N ] 1/3
where V corresponds to the volume of unit cell, N is the number of host cations in the unit cell, and Xc is the critical concentration of dopant ions. In this paper, V = 331.34 Å3, N = 2 and Xc is 0.08 for Tb3+ doped SMSO phosphor, as a consequence, Rc was calculated to be 7.9 Å. Generally, non-radiative energy transfer was occurred due to exchange interaction, radiation re-absorption, and electric multipolar interactions [23]. For SMSO:xTb3+ samples, Rc was calculated to be 7.9 Å. As a consequence, we can speculate that exchange interaction is weak in this sample since exchange interaction occurred when Rc less than 5 Å [24]. Also, radiation re-absorption plays no role in Tb3+ concentration quenching process because of poor overlap between Tb3+ excitation and emission spectra. In consequence, electric multipolar interaction is major in Tb3+ concentration quenching. According to Dexter’s energy transfer theory, the concentration quenching mechanism for SMSO:xTb3+ phosphors was calculated by the follow equation [25]:
I/C = k1/β × Cs/3
where I is the emission intensity of activator, C is the related concentration of Tb3+, k1 and β are constants for each interaction under the same excitation wavelength in SMSO matrix, and s represents the different electric multipolar interactions which is that when s are equal to 6, 8 and 10, corresponding to dipole–diople (d–d), diople−quadrupole (d–q), and quadrupole–quadrupole (q–q) interacitions, respectively [26]. Figure 4 gives the linear relationship of log(I/C) versus log(C) in SMSO:Tb3+ phosphor. The value of s was calculated to be 5.66 (blue emission) and 5.31 (green emission), indicating that d-d interaction is major concentration quenching mechanism for SMSO:Tb3+ phosphor.
Figure 5 exhibits the excitation and emission spectra of SMSO:0.10Eu3+ sample and simple energy level transitions of Eu3+, respectively. Broad excitation band from 200 to 450 nm was observed monitored at 616 nm. The strongest peak at about 270 nm is ascribed to Eu3+−O2− charge transfer transition (CTB) from negative oxygen 2p orbit to the empty 4f orbit of Eu3+, which is easy to influence by host environment [27]. Other narrow absorption peaks in the regionof 300 to 450 nm at 363, 382, 394, and 467 nm are attributed to 7F05D4, 7F05G4, 7F05L6, and 7F05D2 transitions, respectively. Under excited at 270 nm, SMAO:0.10Eu3+ phosphor represents a series of narrow emission lines ranging from 500 to 750 nm at about 579, 592, 616, 654, and 705 nm, which corresponding to 5D07FJ (J = 0, 1, 2, 3, and 4) transitions. And we can find that the position of emission peak don’t occur obvious migration under different excitation wavelength.
The important spectra overlap of Tb3+ emission and Eu3+ excitation bands was observed from Figures 3b and 5, indicating that there may exist energy transfer from Tb3+ to Eu3+. In consequence, Tb3+ was introduced into SMSO:Eu3+ phosphor to improve the red emission of Eu3+. Figure 6 gives the excitation and emission spectra of SMSO:0.08Tb3+, 0.04Eu3+ phosphor. Excited at 229 nm, as-prepared sample not only displays Tb3+ characteristic emissions in blue and green bands, but also gives a strong red emission band with the center at 616 nm from Eu3+. Monitoring at 545 nm emission from Tb3+, excitation spectrum shows similar profiles with Tb3+ single-doped SMSO sample. Monitored at 616 nm emission from Eu3+, the excitation spectrum consists of Tb3+ absorption peak at 229 nm, Eu3+−O2− charge transfer band at 270 nm as well as other sharp emission lines from Eu3+, which gives direct evidence of energy transfer from Tb3+→Eu3+.
The emission spectra of SMSO:0.08Tb3+, yEu3+ phosphors with fixed Tb3+ concentration and changed Eu3+ concentration were reveled in Figure 7a. We can observe that the emission intensities of Tb3+ decrease gradually while the luminescence intensities of Eu3+ increase monotonously with increasing Eu3+ doping content, which can be observed intuitively from Figure 7b. The result shows that energy transfer process occurs from Tb3+ to Eu3+ ions in SMSO:Tb3+, Eu3+ phosphors. The luminescence intensity of Eu3+ was improved 2 times compared with Eu3+ single-doped sample.
To further confirm energy transfer behavior from Tb3+ to Eu3+, luminescence lifetimes of Tb3+ 5D47F5 transition at 545 nm were measured in SMSO:0.08Tb3+, yEu3+ samples under the excitation of 229 nm UV light. As demonstrated in Figure 8, the fluorescent decay curves are described distinctly with increasing Eu3+ doping concentration. Therefore, the luminescence lifetimes of Tb3+ revealed double-exponential types in all samples. The luminescence curves can be matched well with double-exponential expression:
I(t) = I0 + A1exp(−t1) + A2exp(−t2)
where I and I0 represents the luminescence intensity at time t and 0, A1 and A2 are constants, t represents the time, and τ1 and τ2 represents the luminescence lifetimes for the exponential composition. As a function of these parameters, the average luminescence lifetimes (τ) was determined as follow equation:
τ = (A1τ12 + A2τ22)/(A1τ1 + A2τ2)
For SMSO:0.08Tb3+, yEu3+ phosphors, average lifetimes of Tb3+ emission under excitation of 229 nm were calculated to be 32.58, 24.48, 18.19, 12.09,9.21 and 7.59 µs when Eu3+ concentration were 0, 0.01, 0.02, 0.03, 0.04 and 0.05, respectively, indicating that energy transfer occurred from Tb3+ to Eu3+, as prospective.
Moreover, the energy transfer efficiency (η) from Tb3+ to Eu3+ in SMSO:0.08Tb3+, yEu3+ matrixwas calculated by the expression as follow [28]:
ηET = 1 − IS/IS0
where ηET represents the energy transfer efficiency, IS and IS0 represent the corresponding luminescence intensities of Tb3+ in the presence and absence of the Eu3+, respectively. Figure 9 reveals the energy transfer efficiency from Tb3+ to Eu3+ in SMSO:0.08Tb3+, yEu3+ samples excited at 229 nm based on different Eu3+ concentration. It can be seen that ηET increases monotonously within corporation Tb3+ into SMSO:Eu3+ sample, which can reach the maximum value of 65%. Therefore, the energy transfer from Tb3+ to Eu3+ ions is efficient to improve Eu3+ luminescence.
According to the Commission International De L’Eclairage 1931 chromaticity coordinates, the CIE chromaticity diagram of Tb3+ and Eu3+ single-doped or co-doped SMSO samples were portrayed in Figure 10 and corresponding values were summarized in Table 2. Under excitation of 229 nm, SMSO:0.08Tb3+ displays intense blue-green emission, while SMSO:0.10Eu3+ sample gives bright red emission excited at 270 nm. Furthermore, we can observe that the emission color was varied from blue to white, eventually to red-orange light with enhancing Eu3+ doping concentration from 0.01 to 0.05 in Tb3+ and Eu3+ co-doped phosphors. It is due to energy transfer from Tb3+ to Eu3+ ions. And CIE chromaticity coordinate of SMSO:0.08Tb3+, 0.04Eu3+ sample is close to standard white light.
As revealed above, critical distance Rc was calculated to be 6.7 Å as a function of Equation (1) for SMSO:0.08Tb3+, yEu3+ samples, in which the different Xc was contributed to critical content (Xc was total concentration of Tb3+ and Eu3+ ions, Xc = 0.13). The result shows that electric multipole interaction plays an important role in energy transfer process from Tb3+ to Eu3+. On account of Dexter’s energy transfer mechanism for multipolar interaction and Reisfeld’s approximation, the following expression can be given:
IS0/ISCθ/3
where IS0 and IS are the luminescence intensity of sensitizer without and with activator. C represents the doping concentration of Tb3+ and Eu3+ ion. The value for θ = 6, 8 and 10 corresponding to dipole-dipole, dipole-quadrupole, and quadrupole-quadrupole interactions. The linear relation of IS0/IS and Cθ/3 are revealed in Figure 11. R2 value was calculated to be 0.96646 when θ = 10 for SMSO:0.08Tb3+, yEu3+ samples, demonstrating that the energy transfer from Tb3+→Eu3+ was evaluated to be a quadrupole-quadrupole interaction.

3. Materials and Methods

3.1. Sample Preparation

A series of Sr2MgSi2O7:Tb3+, Eu3+ phosphors were prepared by high temperature solid state reaction in air atmosphere at 1300 °C. SrCO3 (A.R.), MgO (A.R.), SiO2 (A.R.), Tb4O7 (99.99%), and Eu2O3 (99.99%) were used as raw materials. They were weighed according to desired composition and mixed thoroughly in ball mill with appropriate ethanol for 4 h, then the powder samples were moved to culture dish to dry for 1.0 h at 60 °C. After that, they were transferred into ceramic crucible and calcined in high temperature tubular furnace at 1300 °C for 3 h. The final samples were obtained by regrinding for 3 min.

3.2. Measurements and Characterization

Bruker D8 Focus diffractmeter (voltage 40 kV and current 40 mA) at a scanning rate of 10 deg/min over the 2θ range from 10° to 50° with graphite monochromatized CuKα radiation (λ = 0.15405 nm) was used to record XRD patterns of SMSO:Tb3+, Eu3+ samples. F-4600 device (FL-Spectorphotomet) with a 150 W xenon lamp light source was used to measure the excitation and emission spectra. Structure refinement of SMSO, SMSO:Tb3+, SMSO:Eu3+ and SMSO:Tb3+, Eu3+sampleswere performed by GSAS (General Structure Analysis System) program with radiation at a 0.01°(2θ)/0.1 s scanning step. UV-vis diffuse reflectance spectra were measured using a UV–Vis spectrophotometer (TU–1901).

4. Conclusions

In summary, a series of Tb3+ and Eu3+ doped SMSO phosphors were prepares by high temperature solid-state reaction at 1300°C for 3 h. The characteristic emissions of Tb3+ (blue, 5D37F3 and green, 5D47F5) and Eu3+ (red, 5D07F2) were observed in SMSO:Tb3+ and SMSO:Eu3+ samples, respectively. For the SMSO:Tb3+, Eu3+ sample, efficient energy transfer was observed from Tb3+ to Eu3+, which is deduced by the spectra overlap of Tb3+ emission and Eu3+ excitation. This was further proved by the emission spectra and decay curves of Tb3+ in the SMSO:Tb3+, Eu3+ sample. The corresponding energy transfer mechanism was demonstrated to be a quadrupole-quadrupole interaction. The emission color was tuned from green to white, up to the red region, by adjusting the concentration ratio of Tb3+ and Eu3+ in SMSO:Tb3+, Eu3+ phosphors. All results indicate that SMSO:Tb3+, Eu3+ is a promising single-component white light emission phosphor.

Acknowledgments

This work was supported by the National Natural Science Foundation of Young (Grant No. 130696) and the Science and Technology Development Plan of Shandong Province, China (2014GNC110013).

Author Contributions

Minhong Li conceived and designed the experiments and wrote the manuscript; Zhihan Deng performed the experiments; Lili Wang and Weiguang Ran analyzed the data; Chunyan Ren contributed reagents/materials/analysis tools; Jinsheng Shi revised the paper.

Conflicts of Interest

The authors declare no conflict of interest.

References

  1. Li, W.; Wang, J.; Zhang, H.; Liu, Y.; Lei, B.; Zhuang, J.; Cui, J.; Peng, M.; Zhu, Y. Tunable emissioncolor and mixed valence state via the modified activator site in the AlN-doped Sr3SiO5:Euphosphor. RSC Adv. 2016, 6, 33076–33082. [Google Scholar] [CrossRef]
  2. Zhang, Z.; Tang, W. Tunable Blue-Red Emission and Energy-Transfer Properties of Mg3(PO4)2:Eu2+, Mn2+ Phosphors. Eur. J. Inorg. Chem. 2015, 2015, 3940–3948. [Google Scholar] [CrossRef]
  3. Ran, W.G.; Wang, L.L.; Liang, H.B.; Guo, Y.; Kang, W.K.; Qu, D.; Shi, J.S.; Su, L.H. Luminescence properties and energy transfer of CdWO4:Sm3+,Bi3+,M+ (M = Li, Na, K) phosphors for white LEDs. Ceram. Int. 2015, 41, 4301–4307. [Google Scholar]
  4. Yang, P.; Yu, X.; Yu, H.; Jiang, T.; Xu, X.; Yang, Z.; Zhou, D.; Song, Z.; Yang, Y.; Zhao, Z.; et al. Ca2Al2SiO7:Bi3+, Eu3+, Tb3+: A potential single-phased tunable-color-emitting phosphor. J. Lumin. 2013, 135, 206–210. [Google Scholar] [CrossRef]
  5. Wang, L.; Noh, H.M.; Moon, B.K.; Park, S.H.; Kim, K.H.; Shi, J.S.; Jeong, J.H. Dual-Mode Luminescence with Broad Near UV and Blue Excitation Band from Sr2CaMoO6:Sm3+ Phosphor for White LEDs. J. Phys. Chem. C 2015, 119, 15517–15525. [Google Scholar] [CrossRef]
  6. Li, G.; Tian, Y.; Zhao, Y.; Lin, J. Recent progress in luminescence tuning of Ce3+ and Eu2+ activated phosphors for pc-WLEDs. Chem. Soc. Rev. 2015, 44, 8688–8713. [Google Scholar] [CrossRef] [PubMed]
  7. Sun, W.; Jia, Y.; Pang, R.; Li, H.; Ma, T.; Li, D.; Fu, J.; Zhang, S.; Jiang, L.; Li, C. Sr9Mg1.5(PO4)7:Eu2+: A Novel Broadband Orange-Yellow-Emitting Phosphor for Blue Light-Excited Warm White LEDs. Appl. Mater. Interface 2015, 7, 25219–25226. [Google Scholar] [CrossRef] [PubMed]
  8. Li, K.; Lian, H.; Shang, M.; Lin, J. A novel greenish yellow-orange red Ba3Y4O9:Bi3+, Eu3+ phosphor with efficient energy transfer for UV-LEDs. Dalton. Trans. 2015, 44, 20542–20550. [Google Scholar] [CrossRef] [PubMed]
  9. Ji, H.; Wang, L.; Molokeev, M.S.; Hirosaki, N.; Huang, Z.; Xia, Z.; Kate, O.M.; Liu, L.; Xie, R. New garnet structure phosphors, Lu3−xYxMgAl3SiO12:Ce3+ (x = 0–3), developed by solid solution design. J. Mater. Chem. C 2016, 4, 2359–2366. [Google Scholar] [CrossRef]
  10. Wang, C.; Xin, S.; Wang, X.; Zhu, G.; Wu, Q.; Wang, Y. Double substitution induced tunable photoluminescence in the Sr2Si5N8:Eu phosphor lattice. New J. Chem. 2015, 39, 6958–6964. [Google Scholar]
  11. Huang, C.H.; Chen, Y.C.; Kuo, T.W.; Chen, T.M. Novel green-emitting Na2CaPO4F:Eu2+ phosphors for near-ultraviolet white light-emitting diodes. J. Lumin. 2011, 131, 1346–1349. [Google Scholar] [CrossRef]
  12. Zhou, X.; Zhang, Z.; Wang, Y. Ce3+and Tb3+singly- and co-doped MgGd4Si3O13 for ultraviolet light emitting diodes and field emission displays. J. Mater. Chem. C 2015, 3, 3676–3683. [Google Scholar] [CrossRef]
  13. Zhou, H.; Jin, Y.; Jiang, M.; Wang, Q.; Jiang, X. A single-phased tunable emission phosphor MgY2Si3O10:Eu3+, Bi3+ with efficient energy transfer for white LEDs. Dalton. Trans. 2015, 44, 1102–1109. [Google Scholar] [CrossRef] [PubMed]
  14. Chen, J.; Liu, Y.; Fang, M.; Huang, Z. Luminescence properties and energy transfer of Eu/Mn coactivated Mg2Al4Si5O18 as a potential phosphor for white-light LEDs. Inorg. Chem. 2014, 53, 11396–11403. [Google Scholar] [CrossRef] [PubMed]
  15. Zhang, X.; Zhou, L.; Pang, Q.; Shi, J.; Gong, M. Tunable Luminescence and Ce3+→Tb3+→Eu3+ EnergyTransfer of Broadband-Excited and Narrow Line Red Emitting Y2SiO5:Ce3+, Tb3+, Eu3+ Phosphor. J. Phys. Chem. C 2014, 118, 7591–7598. [Google Scholar] [CrossRef]
  16. Li, K.; Fan, J.; Shang, M.; Lian, H.; Lin, J. Sr2Y8(SiO4)6O2:Bi3+/Eu3+: A single-component white-emitting phosphor via energy transfer for UV w-LEDs. J. Mater. Chem. C 2015, 3, 9989–9998. [Google Scholar] [CrossRef]
  17. Kim, D.; Park, D.; Oh, N.; Kim, J.; Jeong, E.D.; Kim, S.J.; Kim, S.; Park, J.C. Luminescent properties of rare earth fully activated apatites, LiRE9(SiO4)6O2 (RE = Ce, Eu, and Tb): Site selective crystal field effect. Inorg. Chem. 2015, 54, 1325–1336. [Google Scholar] [CrossRef] [PubMed]
  18. Li, K.; Fan, J.; Mi, X.; Zhang, Y.; Lian, H.; Shang, M.; Lin, J. Tunable-color luminescence via energy transfer in NaCa13/18Mg5/18PO4:A (A = Eu2+/Tb3+/Mn2+, Dy3+) phosphors for solid state lighting. Inorg. Chem. 2014, 53, 12141–12150. [Google Scholar] [CrossRef] [PubMed]
  19. Li, M.; Ran, W.; Lv, Z.; Ren, C.; Jiang, H.; Li, W.; Shi, J. A strategy for developing deep-UV phosphor: Sr3AlO4F:Tb3+/Sm3+. J. Mater. Sci. Mater. Electron. 2015, 26, 9614–9623. [Google Scholar] [CrossRef]
  20. Wang, B.; Lin, H.; Xu, J.; Chen, H.; Wang, Y. CaMg2Al16O27:Mn4+ based red phosphor: A potential color converter for high-powered warm W-LED. Appl. Mater. Int. 2014, 6, 22905–22913. [Google Scholar] [CrossRef] [PubMed]
  21. Maheshwary, M.; Singh, B.P.; Singh, R.A. Color tuning in thermally stable Sm3+-activated CaWO4 nanophosphors. New. J. Chem. 2015, 39, 4494–4507. [Google Scholar] [CrossRef]
  22. Blasse, G. Energy Transfer in Oxidic Phosphors. Phys. Lett. 1968, 28, 444–445. [Google Scholar] [CrossRef]
  23. Li, K.; Shang, M.; Zhang, Y.; Fan, J.; Lian, H.; Lin, J. Photoluminescence properties of single-component white-emitting Ca9Bi(PO4)7:Ce3+, Tb3+, Mn2+ phosphors for UV LEDs. J. Mater. Chem. C 2015, 3, 7096–7104. [Google Scholar] [CrossRef]
  24. Huang, C.H.; Chiu, Y.C.; Yeh, Y.T.; Chan, T.S.; Chen, T.M. Eu2+ activated Sr8ZnSc(PO4)7: A novel near-ultraviolet converting yellow-emitting phosphor for white light-emitting diodes. Appl. Mater. Interface 2012, 4, 6661–6668. [Google Scholar] [CrossRef] [PubMed]
  25. Uitert, I.G.V. Characterization of Energy Transfer Interactions between Rare Earth Ions. J. Electrochem. Soc. Solid State Sci. 1967, 114, 1048–1053. [Google Scholar] [CrossRef]
  26. Chen, J.; Liu, Y.; Mei, L.; Liu, H.; Fang, M.; Huang, Z. Crystal structure and temperature-dependent luminescence characteristics of KMg4(PO4)3:Eu2+ phosphor for white light-emitting diodes. Sci. Rep. 2015, 5, 9673. [Google Scholar] [CrossRef] [PubMed]
  27. Zhou, H.; Wang, Q.; Jin, Y. Temperature dependence of energy transfer in tunable white light-emitting phosphor BaY2Si3O10:Bi3+, Eu3+ for near UV LEDs. J. Mater. Chem. C 2015, 3, 11151–11162. [Google Scholar] [CrossRef]
  28. Xu, M.; Wang, L.; Jia, D.; Zhao, H.; Setlur, A. Tuning the Color Emission of Sr2P2O7:Tb3+, Eu3+ Phosphors Based on Energy Transfer. J. Am. Ceram. Soc. 2015, 98, 1536–1541. [Google Scholar] [CrossRef]
Figure 1. XRD patterns of SMSO (Sr2MgSi2O7) host, SMSO:0.08Tb3+, SMSO:0.10Eu3+ and SMSO:0.08Tb3+, 0.04Eu3+ phosphors.
Materials 10 00227 g001
Figure 2. (a) Crystal structure of SMSO. Experimental (black crosses) and calculated (red solid line) XRD patterns and their difference (blue solid line) for (b) SMSO:0.08Tb3+; (c) SMSO:0.10Eu3+ and (d) SMSO:0,08Tb3+, 0.04 Eu3+ samples by the GSAS program. The short magenta vertical lines show the position of Bragg reflections of the calculated patterns.
Materials 10 00227 g002
Figure 3. (a) The excitation and emission spectra of SMSO:0.08Tb3+ sample; (b) The emission spectra of SMSO:xTb3+ (x = 0.02, 0.04, 0.06, 0.08, 0.10 and 0.15) samples.
Materials 10 00227 g003
Figure 4. Dependence of lg(I/C) on lg(C) for SMSO:xTb3+ phosphors. ((a) represents concentration of blue emission; (b) represents concentration of green emission; C represents the concentration of Tb3+).
Materials 10 00227 g004
Figure 5. The excitation and emission spectra of SMSO:0.10Eu3+ sample and simple energy level transitions of Eu3+. (Note: The all energy levels were not positioned in an energy level diagram due to electrons transitions.)
Materials 10 00227 g005
Figure 6. (a) The excitation spectrum of SMSO:Tb3+, Eu3+ phosphor monitored at 616 nm; (b) The excitation spectrum (red line) of SMSO:Tb3+, Eu3+ phosphor monitored at 545 nm and emission spectrum (blue line) of SMSO:Tb3+, Eu3+ phosphor excited at 229 nm.
Materials 10 00227 g006
Figure 7. (a) The emission spectra of SMSO:0.08Tb3+, yEu3+ (y176815 = 0.01, 0.02, 0.03, 0.04 and 0.05) phosphors excited at 229 nm; (b) The changing of luminescence intensities of Tb3+ and Eu3+ based on different Eu3+ concentration.
Materials 10 00227 g007
Figure 8. PL decay curves of Tb3+ in SMSO:0.08Tb3+, yEu3+ samples under 229 nm radiations.
Materials 10 00227 g008
Figure 9. Energy transfer efficiencies (ηT) from Tb3+ to Eu3+ in SMSO:0.08Tb3+, yEu3+ phosphors as a function of different Eu3+ concentration.
Materials 10 00227 g009
Figure 10. CIE chromaticity coordinates for SMSO:0.08Tb3+ (a1), SMSO:0.10Eu3+ (a2) and SMSO:0.08Tb3+, yEu3+ (b1–b5) phosphors.
Materials 10 00227 g010
Figure 11. Dependence of IS0/IS of Tb3+ on (a) CEu3+6/3; (b) CEu3+8/3; and (c) CEu3+10/3.
Materials 10 00227 g011
Table 1. Refinement, Crystallographic, and Structure. Parameters of the SMSO:0.08Tb3+, SMSO:0.10Eu3+, and SMSO:0.08Tb3+, 0.04Eu3+ samples.
FormulaSMSOSMSO:0.08TbSMSO:0.10EuSMSO:0.08Tb, 0.04Eu
Crystal SystemTetragonalTetragonalTetragonalTetragonal
Space GroupP-421m (113)P-421m (113)P-421m (113)P-421m (113)
a8.018.01118.01128.0108
b8.018.01118.01128.0108
c5.165.16675.16575.1650
v3331.34331.58331.53331.45
Z2222
Radiation Type-Cu−KαCu−KαCu−Kα
Wavelength/Å-1.54051.54051.5405
Profile Range/°-10°−90°10°−90°10°−90°
Rp/%-8.758.467.97
Rwp/%-11.9511.5110.9
χ2-3.5523.7214.157
Table 2. CIE chromaticity coordinates and color temperature for SMSO:0.08Tb3+, yEu3+ phosphors excited at 229 nm.
Sample No.SMSO:xTb3+, yEu3+CIE (x, y)CCT (K)
a1x = 0.08, y = 0 (0.2796, 0.4359)7191
a2x = 0, y = 0.10(0.5646, 0.3272)4937
b1x = 0.08, y = 0.01 (0.2424, 0.2137)164,473
b2x = 0.08, y = 0.02 (0.2682, 0.2263)31,313
b3x = 0.08, y = 0.03 (0.2943, 0.2337)13,267
b4x = 0.08, y = 0.04 (0.3271, 0.2644)5827
b5x = 0.08, y = 0.05 (0.3821, 0.2857)2768

