1. Introduction
Lithium-ion batteries are widely used in various types of electronic components, such as laptops, cameras and mobile phones, due to their high working voltage, high energy density, long service life, environmental protection, etc. In recent years, lithium-ion batteries have also been used to make large- and medium-sized energy storage devices [
1,
2], such as electric vehicle power, renewable energy sources, backup power for communication networks and military reserve power. However, the thermal runaway of lithium-ion batteries, which might lead to serious fires and explosions, caused by high interior temperature has been a major limitation for their further application.
Literature has focused on the chemical reactions of the internal substances, e.g., the positive and negative electrode and electrolyte and the adhesive agent and electrolyte, resulting in the reduction of thermal stability. Richard [
3] derived that the solid electrolyte interface (SEI) starts to decompose at 90–120 °C by using an accelerating rate calorimeter (ARC). Maleki [
4] used a differential scanning calorimeter (DSC) and observed that the SEI begins to decompose at about 100 °C. Jing [
5] found the reaction between EC/DEC (ethylene carbonate/diethyl carbonate is a kind of solvent in electrolyte of lithium-ion battery) and Li
0.86C
6 mainly undergoes two stages in his ARC experiential study. The first stage generates lithium carbonate alkyl ester when the temperature is between 90 °C and 243 °C. When the temperature is higher than 243 °C, Li
2CO
3 is yielded. Biensan [
6] studied the reaction between the Li
xC
6 and electrolyte with the DSC method. It was found that when the temperature was between 100 °C and 120 °C, the heat generation rate of the reaction was 350 J/g. Zhang [
7] found that when the temperature rises up to 130 °C, the electrolyte reacts with lithium carbon, resulting in an exothermicity of 41–44.26 J/g. MacNeil [
8] concluded that LiCoO
2 reacts with the electrolyte to cause 265 J/g heat, while Wang [
9] concluded that Li
0.5CoO
2 can react with the electrolyte to form a heat of 132 °C. Maleki [
10] found that Li
xC
6 began to react with polyvinylidene fluoride (PVDF) when the temperature rose to 210 °C. The reaction exothermicity reached a maximum value of 317 J/g at 287 °C. Kawamura [
11] discovered that DEC is easier to react with LiPF
6 and LiClO
4 than DMC (dimethyl carbonate is a common solvent in electrolyte). Gnanaraj [
12] studied the thermal stability between the electrolyte and different lithium salts (LiClO
4, LiPF
6, LiPF
3(CF
2CF
3)
3) by ARC, and found that the thermal stability of LiPF
6 is the worst. Sloop [
13] conducted an experiment on the stability of the electrolyte (LiPF
6/EC + DMC) at 85 °C. PF
5 (phosphorus pentafluoride) gas was found to preferentially react with the EC. Wang [
14] drew the conclusion that the electrolyte (LiPF
6/EC) has an exothermic peak at 212 °C, including the reaction heat of 355.4 J/g. Experiments by Chen [
15] showed that the electrolyte exothermic reaction began at 178 °C. He also found the thermal decomposition of the cathode material (Li
1-xCo
1/3Ni
1/3Mn
1/3O
2) started at 230 °C. Venkatachalapathy [
16] derived that the reaction heat of the positive electrode is 642 and 381 J/g for LiNi
0.8Co
0.2O
2 and Li
xCoO
2, respectively.
Moreover, the overcharging of the lithium-ion battery was also studied. The battery will explode when the charging current or voltage reaches a certain value. However, the effect of the thermal runaway of the lithium-ion battery exposed to a high-temperature environment has not been studied comprehensively. Randolph [
17] carried out a research on a 1000 mAh prismatic lithium ion battery. The battery was charged up to 12 V with a 1 C uniform charging current. The voltage rose to the upper limit rapidly after reaching 5.5 V, accompanied by 95% Li-ion deviated from the anode. The battery exploded when the temperature was higher than 376 °K. In addition, Kiton [
18] investigated a 100 Wh lithium-ion battery and charged it to 10 V with a 1 C constant current. According to the phenomenon that the current declined rapidly when the temperature reached 368 °K, the scholar speculated that the melting point lead diaphragm closed. Han [
19] charged a 6 A battery with 1 C current for 5 h, and it was found the explosion limit ranged from 105% to 150% of the charging capacity. Tobishima [
20] studied a 600 mA lithium-ion battery, and the investigation showed that the battery expanded but did not explode when charging current was 1 C or 1.5 C, while it would go off with a 2 C current.
Overall, basic research on the battery thermal runaway, mainly the internal exothermic reaction, and the safety performance of lithium-ion batteries, along with overcharge, high-rate charging [
21,
22], etc., are important causes of combustion and explosion. Researchers provide a reference for the design of the lithium-ion battery and power supply, providing a basis for future research. However, the current research still cannot fully explain lithium-ion battery explosions that occur in everyday life. Effects of a high-temperature environment on the thermal runaway are rarely done. Therefore, carrying out these experimental studies can provide a scientific understanding for lithium-ion batteries that can be applied to wider areas.
In this work, an experimental study of the thermal runaway of 18650 lithium-ion batteries was carried out through an electric heating and testing system to study the effects of heating power, SOC (State of Charge) and the charging–discharging process on the lithium-ion battery thermal runaway. Measurements of some characteristic parameters, such as critical values, were implemented during the tests to quantitatively estimate the thermal instability of the lithium-ion battery in a hot environment. According to the experimental results, relevant safety measures of lithium-ion batteries can be put forward, which is also of great significance to the prevention of related accidents.
2. Materials and Methods
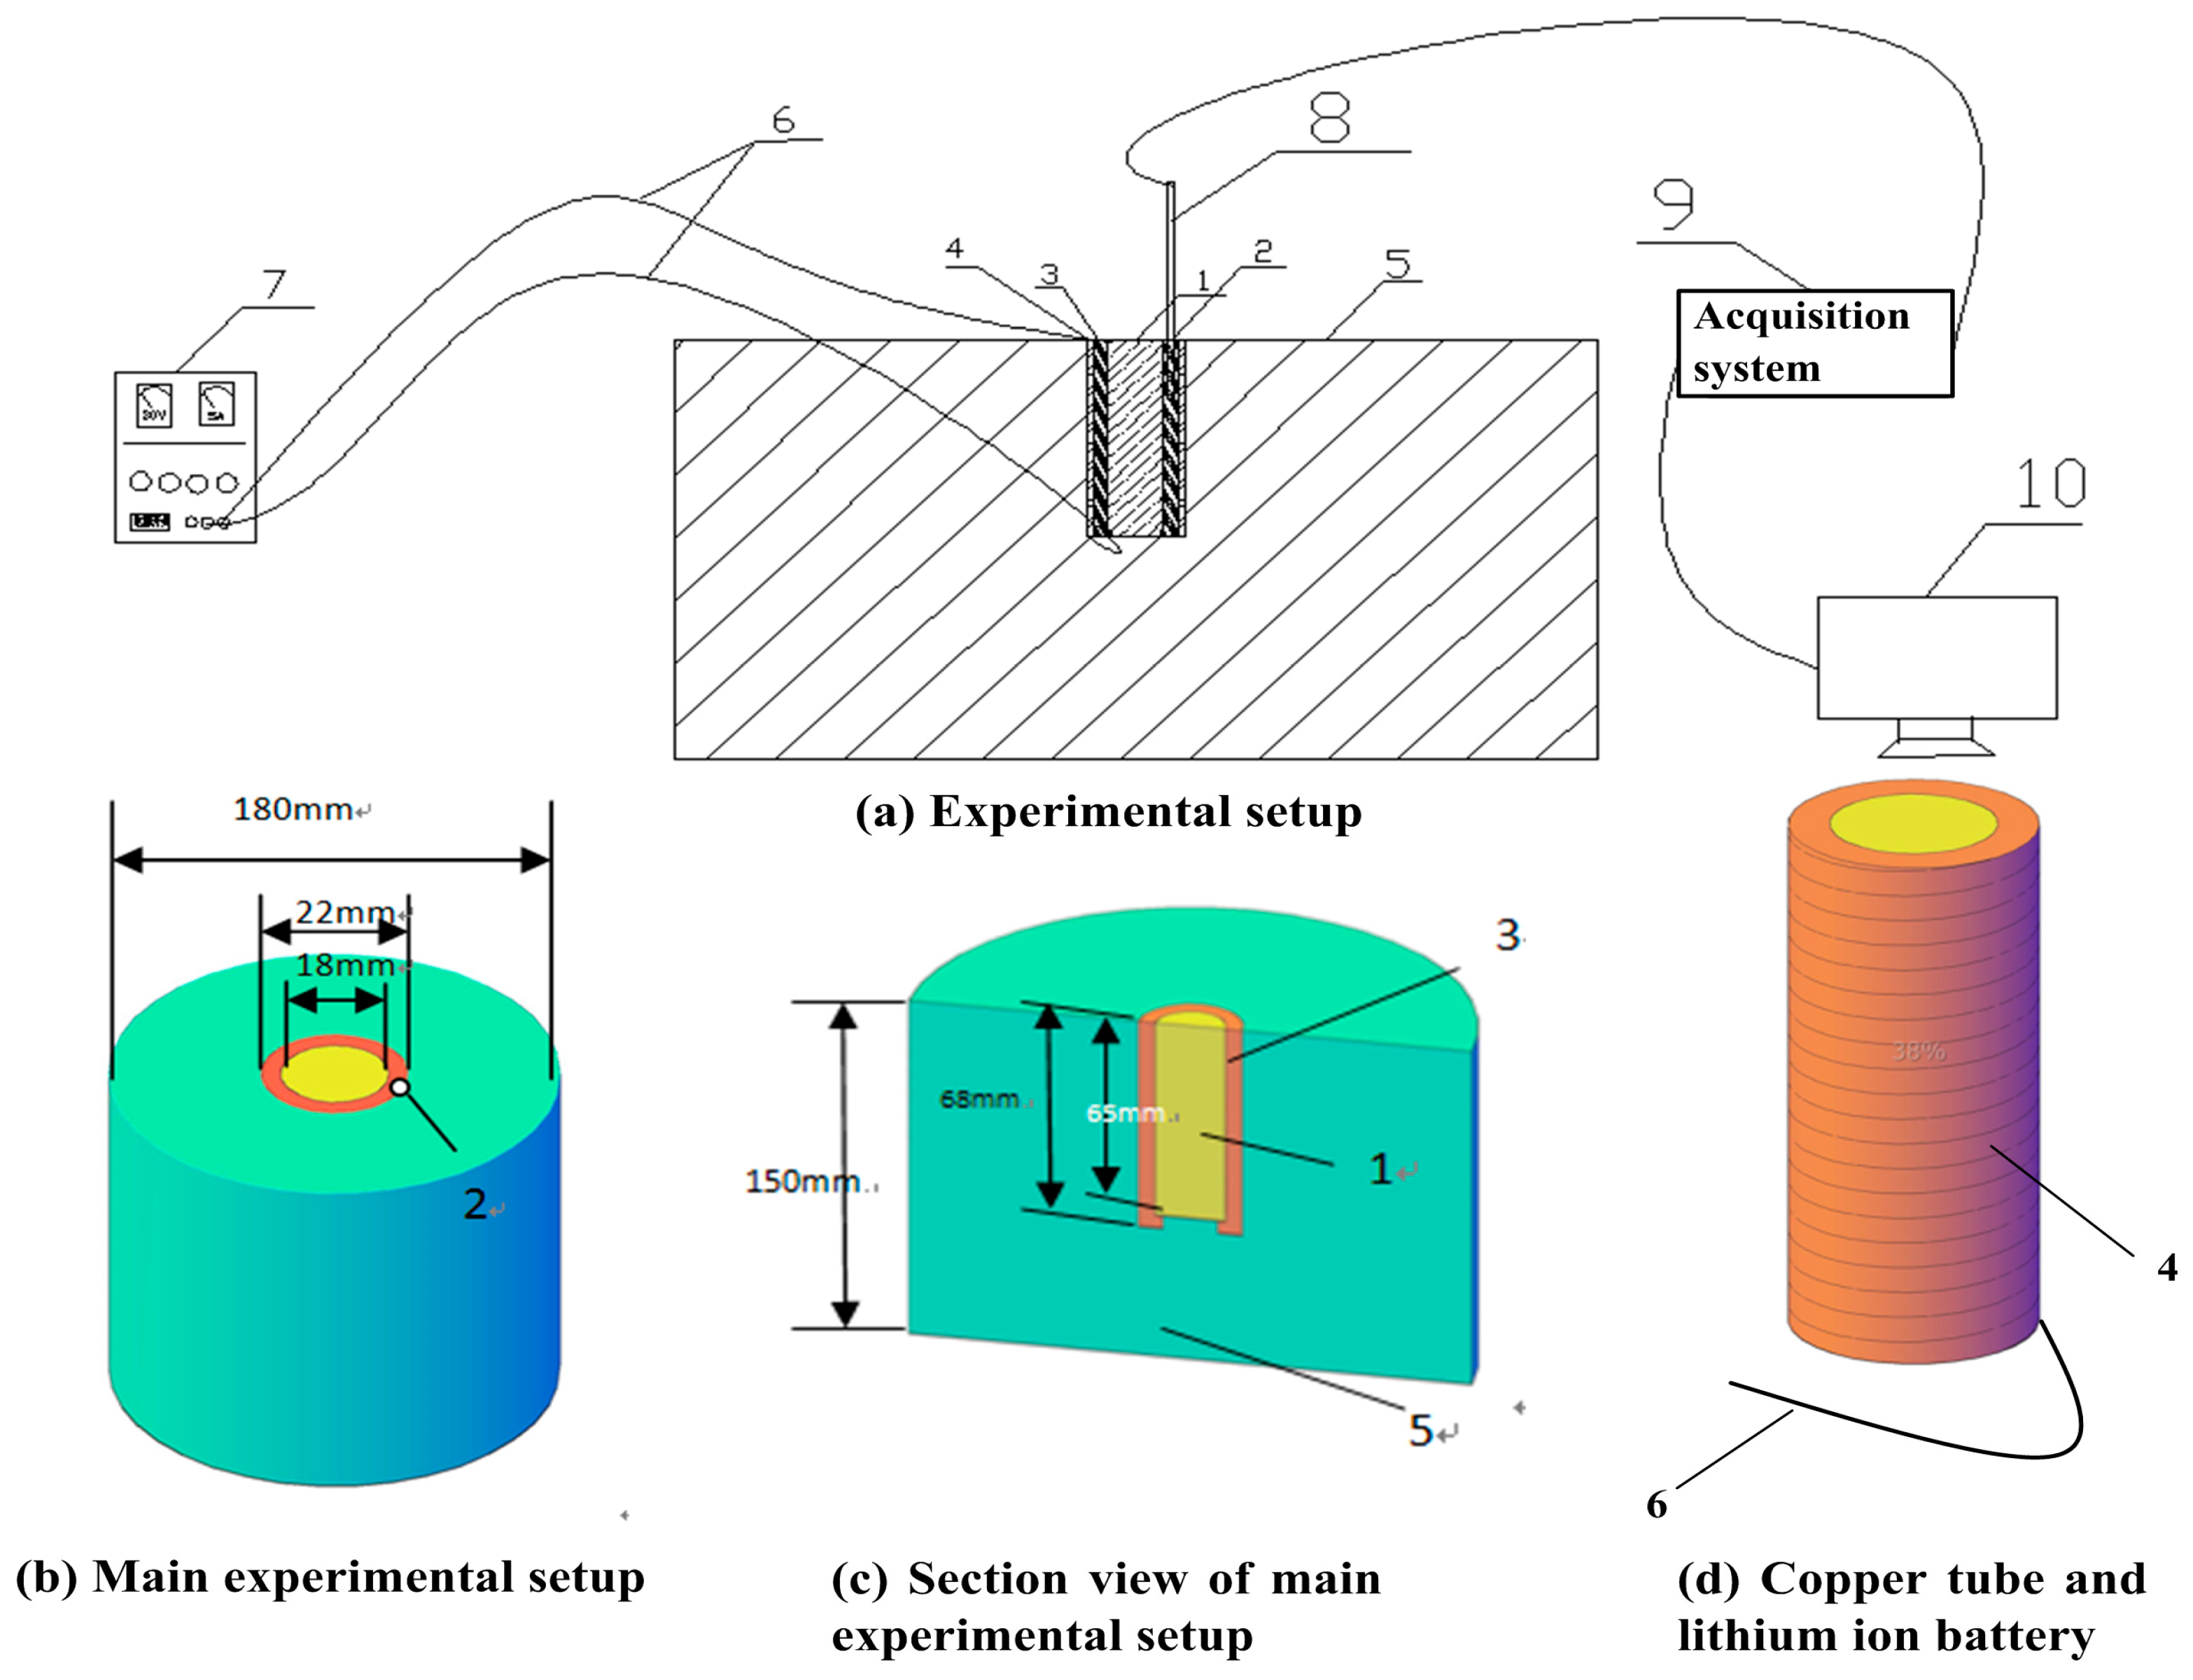
The experiments were conducted in room temperature, 25 °C, in quiescent air and the schematic diagram of the experimental setup is illustrated in
Figure 1. An 18650 SANYO lithium-ion battery (produced by SANYO Electric Co. Ltd. in Osaka, Japan) which employs lithium cobaltale (LiCoO
2) as the cathode and graphite as the anode (2600 mAh, 65 mm length and 18 mm diameter) was mounted in the center of a copper tube (69 mm length, 18 mm internal diameter, 22 mm external diameter), and a layer of heat-resistant tape was wrapped over the external surface of the copper tube. Electrolyte in SANYO lithium ion battery is a kind of organic aqueous solution which is mixed LiPF
6 as electrolyte salt with solvent mainly including EC. PVDF is used as the binder. Outside the tape, a set of heating wire (Cr
20Ni
80) was enwound tightly and uniformly to heat the copper tube during tests. Subsequently, another layer of heat-resistant tape was applied over the heating wire. Finally, the external surface of the tape, bottom of battery and the tube were wrapped by ceramic fiber to insulate the heat flux, as shown in
Figure 1. The thermal conductivity of the tape is relatively high, according to the product specification, and thus the thermal resistance can be neglected. Furthermore, the contact of thermal resistances between the layers of materials can also be ignored due to the fact that the layers were fixed so tight and no gap exists between the layers. One hole, 34 mm in depth and 2 mm in diameter, was drilled on the tube parallel to the axis of tube to fix the OMEGA K-thermocouple (produced by OMEGA Engineering Inc. in Norwalk, CT, USA). A stainless steel container, 150 mm high and 180 mm in diameter, was utilized to hold the ceramic fiber. The heating rate, namely the output power of the heating wire, was controlled by adjusting the voltage of a DC (direct current) regulated power supply. The charging and discharging electric currents were measured by DEWE-43 Data Acquisition Instrument (produced by Fluke Inc. in Everett, WA, USA). An acquisition system was used to obtain the real-time temperature of the battery at a frequency of 3 Hz during tests.
The experiments aimed to study the effects of heating power, SOC, charging and discharging process on thermal runaway of 18650 lithium ion batteries, and thus four scenarios were designed. Detailed information is listed in
Table 1. Each test was performed at least three times to guarantee the repeatability.
3. Results and Discussion
Although a battery is composed of solid and liquid materials as well as other components, it was treated as homogeneous substance in the thermal analysis. Furthermore, the dependence of the thermal parameters on temperature was also neglected for simplification due to the limited information available. For the cylindrical battery used in this study, the battery was heated on the lateral surface. The top and bottom surfaces were exposed to the ambient environment, and the heat loss by convection and radiation was much lower compared with the total net heat obtained. Thus, the heat loss and transfer in the axial direction were also ignored. The heat conservation equation in the battery can be expressed as:
where
ρ is the density,
C is the specific heat,
T is the temperature,
t is the time,
r is the spatial variable in the radius direction,
θ is the spatial variable in the angular direction,
Qchem is the heat generation rate by the chemical reaction,
QEOC is the entropy change, and
QP is the overpotential heat. Due to the geometrical symmetry of the battery, this equation can also be simplified as:
The heat generation rate by the chemical reaction can be expressed by:
where Δ
H is the reaction heat,
M is the mass of the reactant,
n is the reaction order,
A is the pre-exponential factor,
Ea is the activation energy and
R is the gas constant. The heat entropy change is described by the following equation:
where
I is the charge/discharge current. The overpotential heat
QP is described as the following equation:
where
Rη is the overpotential resistance. The boundary condition on the lateral surface is defined as:
where
is the heat flux on the surface and it can be calculated by:
where
P is the applied external power,
r0 is the radius of the battery and
h is the height of the battery. Obviously, it is difficult to derive the analytical solution, and most studies in the literature employed a numerical method to simulate the thermal runaway process.
3.1. Effect of the Heating Power
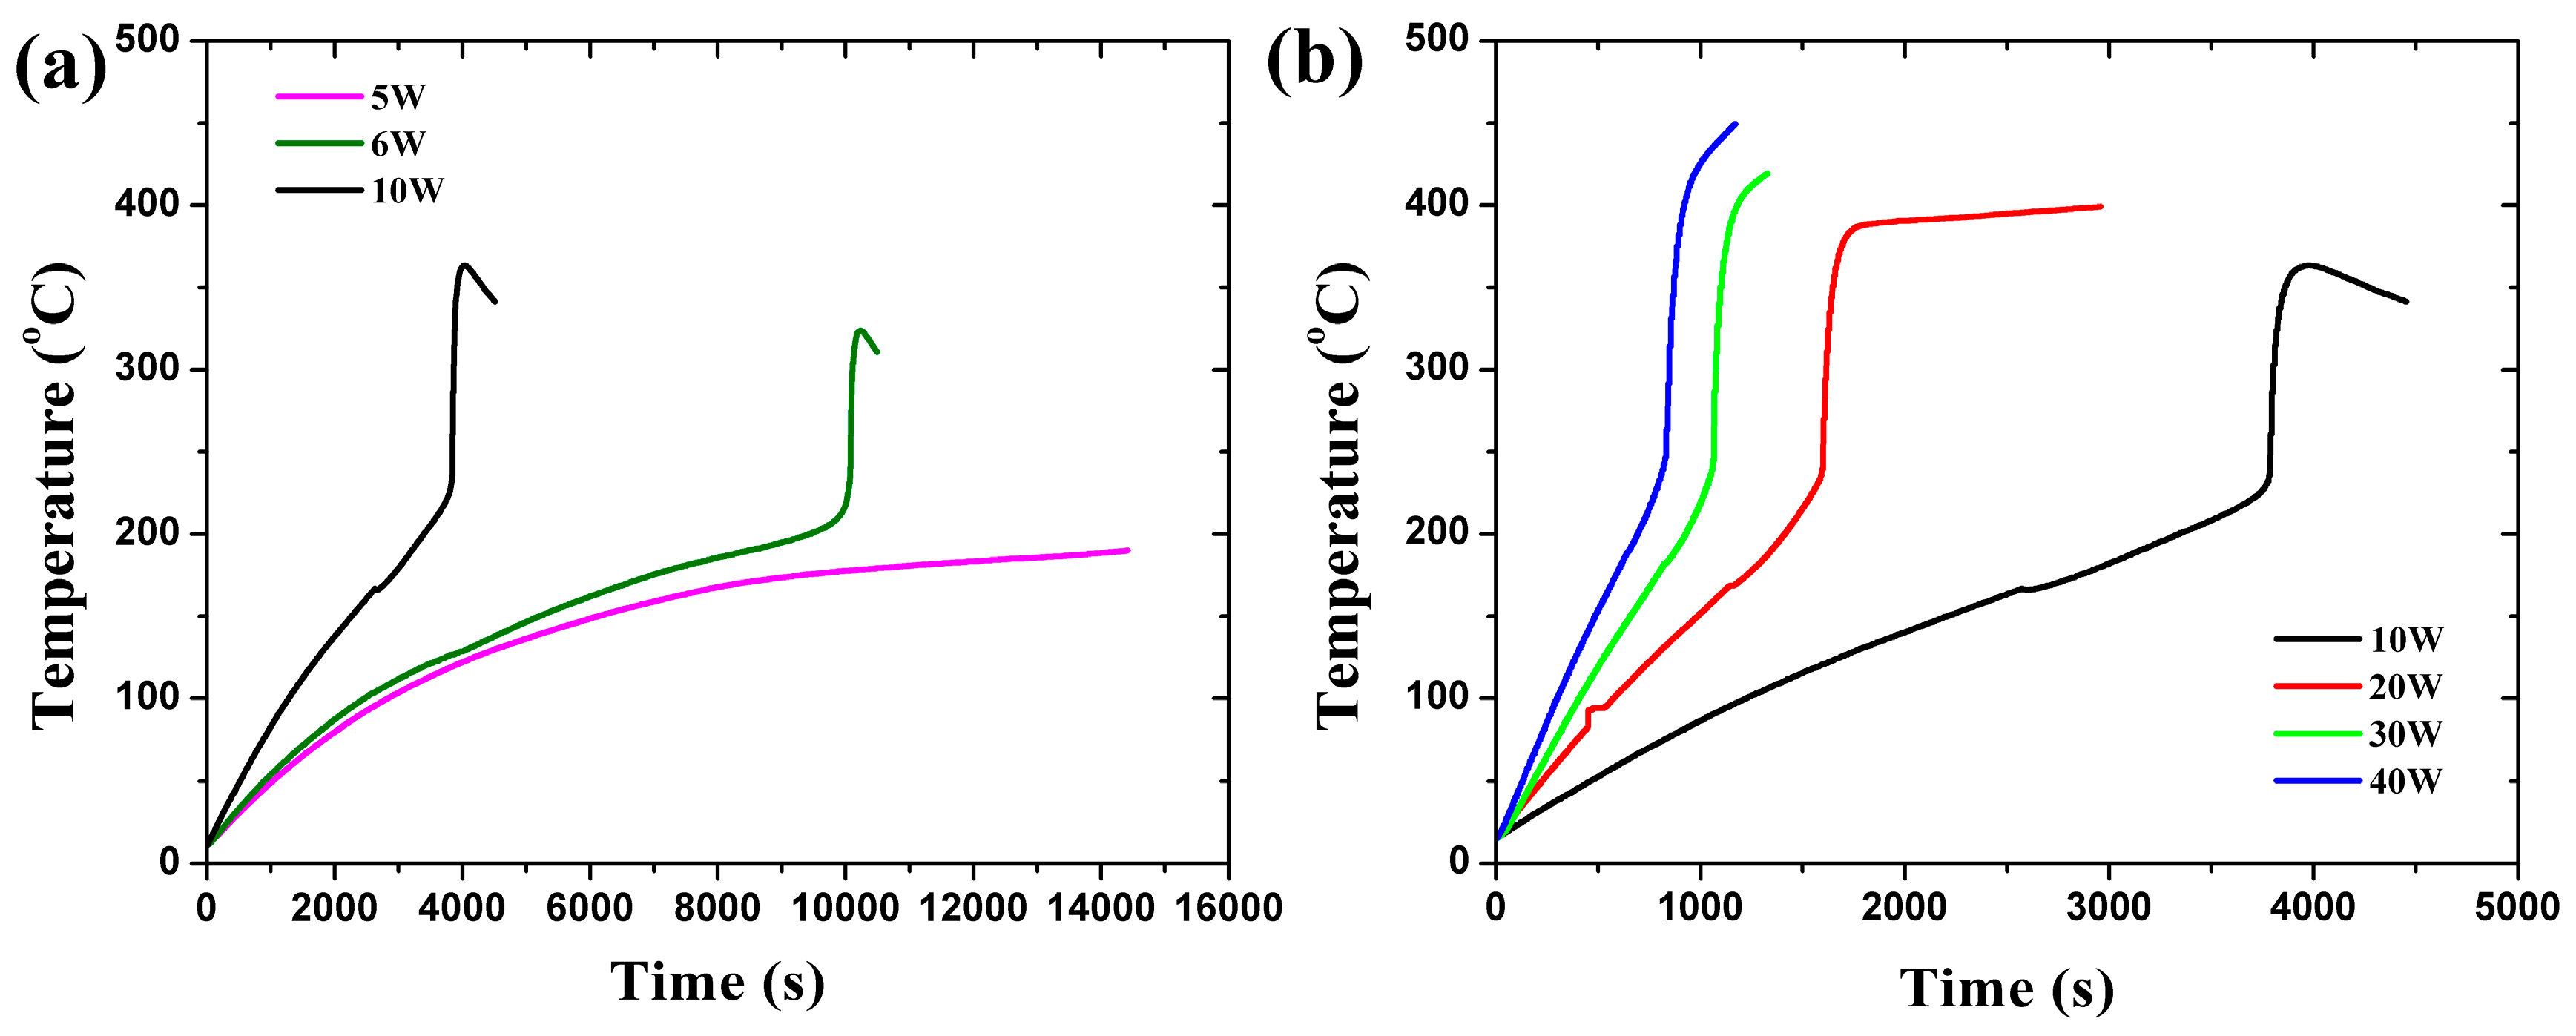
Figure 2 shows the temperature curves of the lithium-ion battery when constant heating powers of 5 W, 6 W, 10 W, 20 W, 30 W and 40 W are applied. The measured values during the tests are tabulated in
Table 2. At 5 W, no thermal runaway was observed due to relatively less heat being generated by the heating wire. For larger heating powers, the conducted heat always initiated the auto-acceleration and finally led to thermal runaway in the experiments. It can be concluded that 6 W is the critical heating power for a 40% SOC.
Inflexion points evidently exist for all curves in
Figure 2, indicating the occurrence of thermal runaway. It is assumed that thermal runaway takes place when a critical accumulated heat, contributed by the heating power and chemical reaction inside the battery, is achieved, namely:
Little discrepancy exists between the different curves in
Figure 2 and it is assumed that
. For a lower heating power, the temperature of the system is relatively low and the heat generated by chemical reaction is also low. Both the lower heating power and reaction rates result in a longer initial time of thermal runaway. When the heating power is lower than a critical value, such as 5 W in this study, the total input heat is lower than the heat loss on the top and bottom surface, and no thermal runaway is observed during the tests:
There is a descent at the end of each temperature profile for the 6 W and 10 W heating powers, while for larger heating powers the temperature increased continuously after the termination of thermal runaway. Under a lower heating rate, the heat generated by the heating wire was much larger than that of the reaction in the interior of the battery, and thus the heating power dominated the temperature of the system during the tests. The measured temperature declined at the end of the tests after the heating wire was turned off. However, for larger heating powers the heat generation rate of the intense reaction in the battery surpassed that of the heating wire. The measured temperature was controlled by the conduction heat flux transferred from the battery to the copper tube, and the temperature still increased with a relatively lower slope after the heating wire was switched off.
The relationship between the constant heating power and the initial temperature is illustrated in
Figure 3. The thermal runaway initial temperature increased with the heating power. This phenomenon was caused by the arrearage effect of the heat transfer from the heating wire to the interior of battery. Under a low heating power condition, the battery was heated slowly and the temperature gradient was small, while for a larger heating rate, a great temperature gradient existed in the system at the beginning of the thermal runaway, which means that the temperature of the copper tube, namely the measured temperature, was higher.
Table 2 shows that the mass loss of the lithium-ion battery without thermal runaway is 2.96 g. The reduced weight of the lithium-ion battery with thermal runaway is, on average, 5.4 g. Without thermal runaway, the decomposition reaction of the solid electrolyte interphase (SEI) layer does not occur, which yields little gas into the atmosphere. However, with thermal runaway, an intense internal reaction takes place in the lithium-ion battery, including the decomposition reaction of the Li
xC
6, binder and electrolyte, and the exothermic reaction between the Li
xC
6 and the electrolyte [
23]. These lead to large amounts of gas injected and a great decrease of mass.
3.2. Effect of SOC
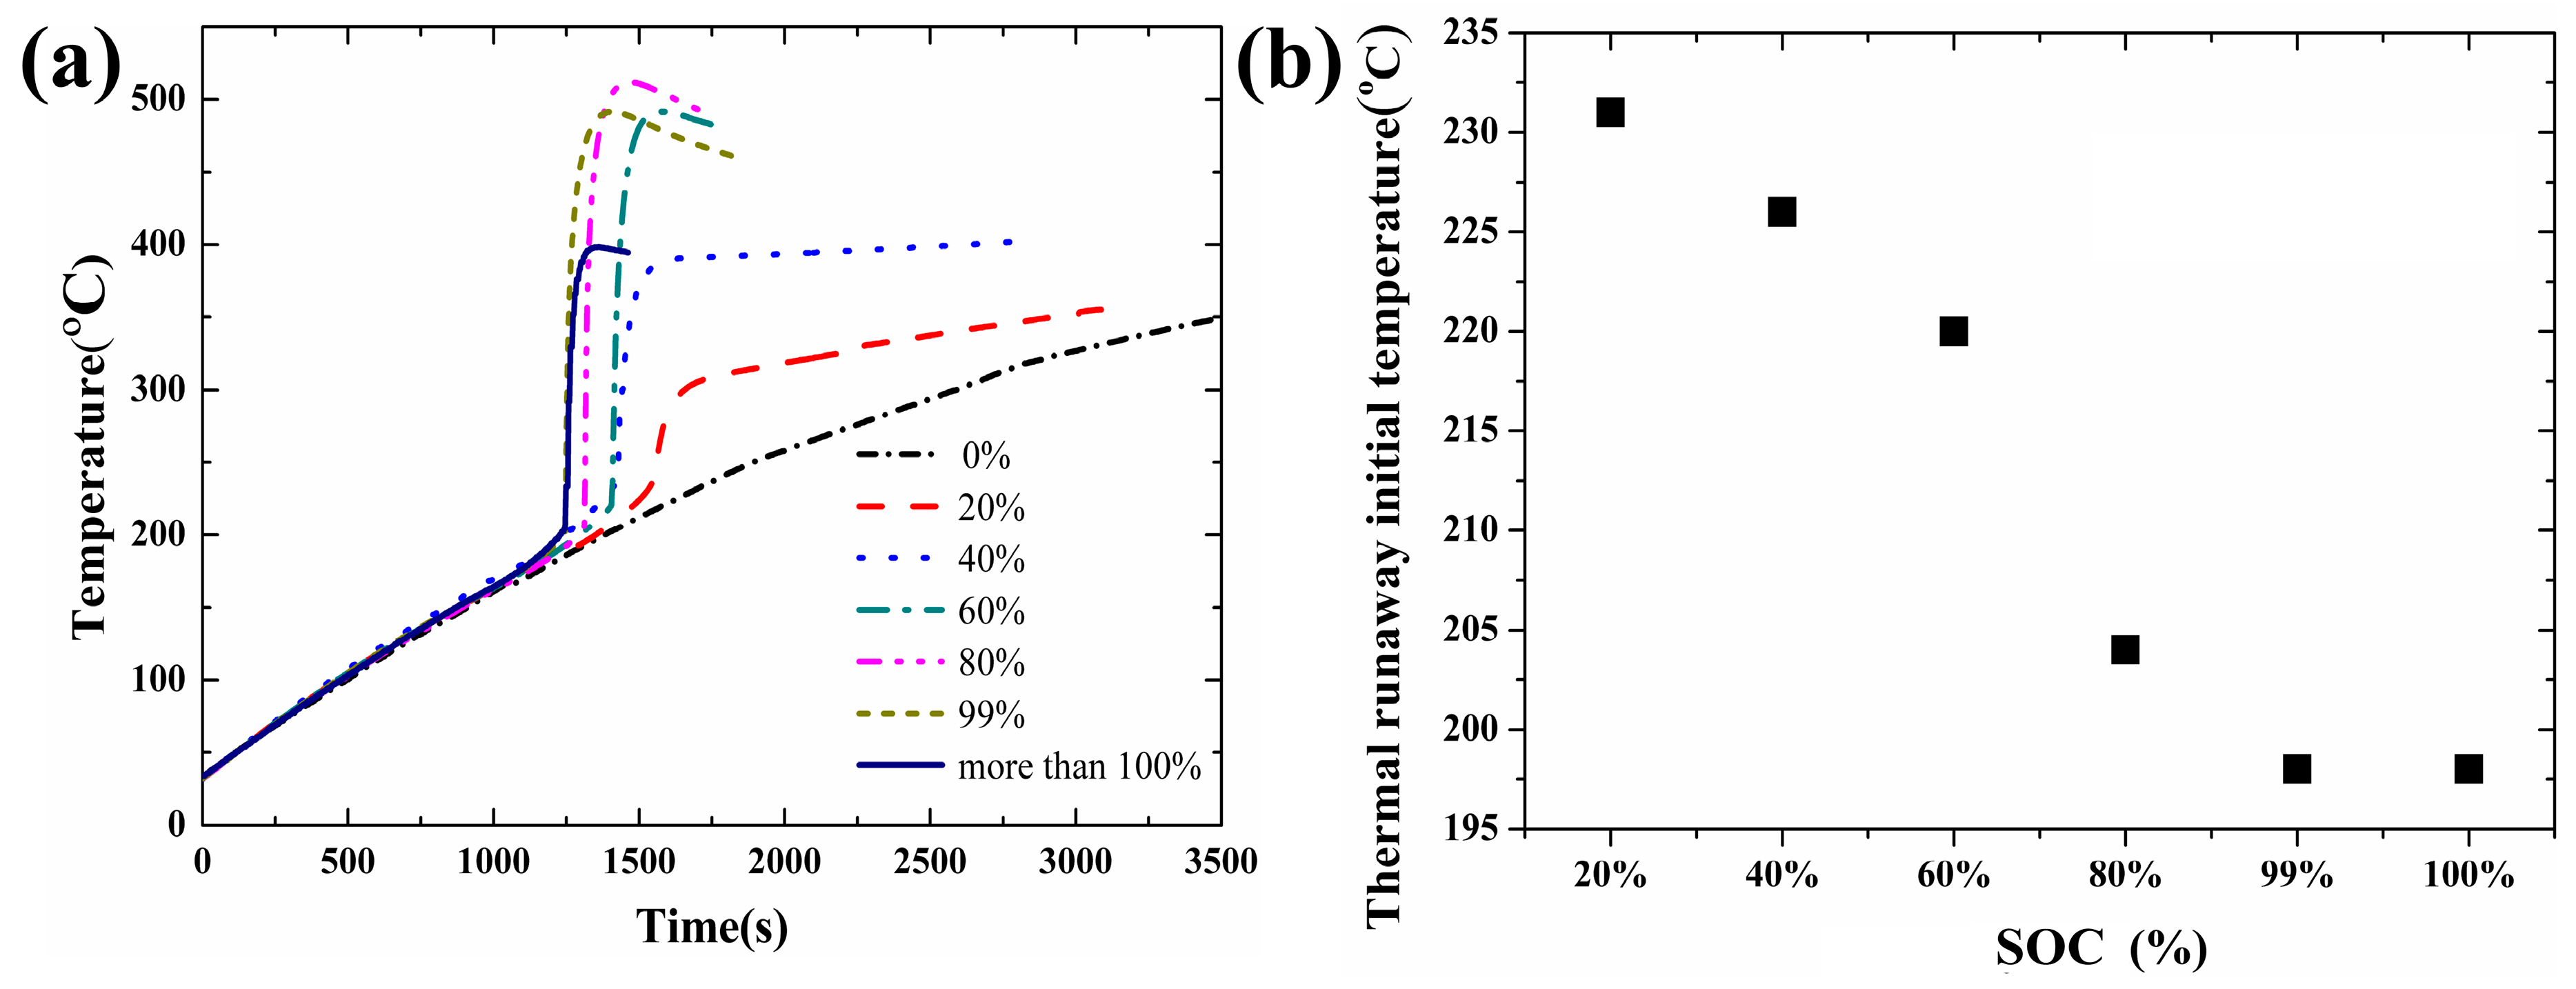
Figure 4a shows the measured temperature of the battery under a heating power of 20 W with the SOC varying from 0% to more than 100%. More than 100% means a 1 h overcharge. Similarly, the measured values are listed in
Table 3. No thermal runaway took place when the SOC was 0%. The main reason is that the negative electrode has no lithium ion to form Li
xC
6. The heat of the thermal runaway is mainly generated from the exothermic reaction between the Li
xC
6, binder and electrolyte [
6,
23].
The three primary functional components of a lithium-ion battery are the anode, cathode, and electrolyte. When a lithium-ion battery is charged, lithium ions move from its cathode to its anode, while electrons flow in through an external electrical circuit. The process is reversed during discharge. The more lithium the electrodes can take in, the more total energy the battery can store, and the longer it can last. The full cell reaction the battery used in this study is:
For higher SOC, more lithium is adsorbed by the electrodes and less reactant is left, which finally leads to a lower concentration of reactant. The reaction rate and heat generation rate both decline, which consequently results in a lower initial temperature of thermal runaway.
The relationship between the thermal runaway initial temperature and SOC is shown in
Figure 4b when the heating power is maintained at 20 W. In
Figure 4b, the thermal runaway initial temperature decreases with the increase of the SOC. It is well known that the negative electrode has more lithium ion to form Li
xC
6 at a higher SOC. With higher SOC, more sufficient reactions take place between the Li
xC
6, electrolyte and binder and provide more reaction heat. Thus, the thermal runaway occurs once the reaction heat accumulates to a critical value when the temperature of the copper tube, the initial temperature, is relatively low. Similarly,
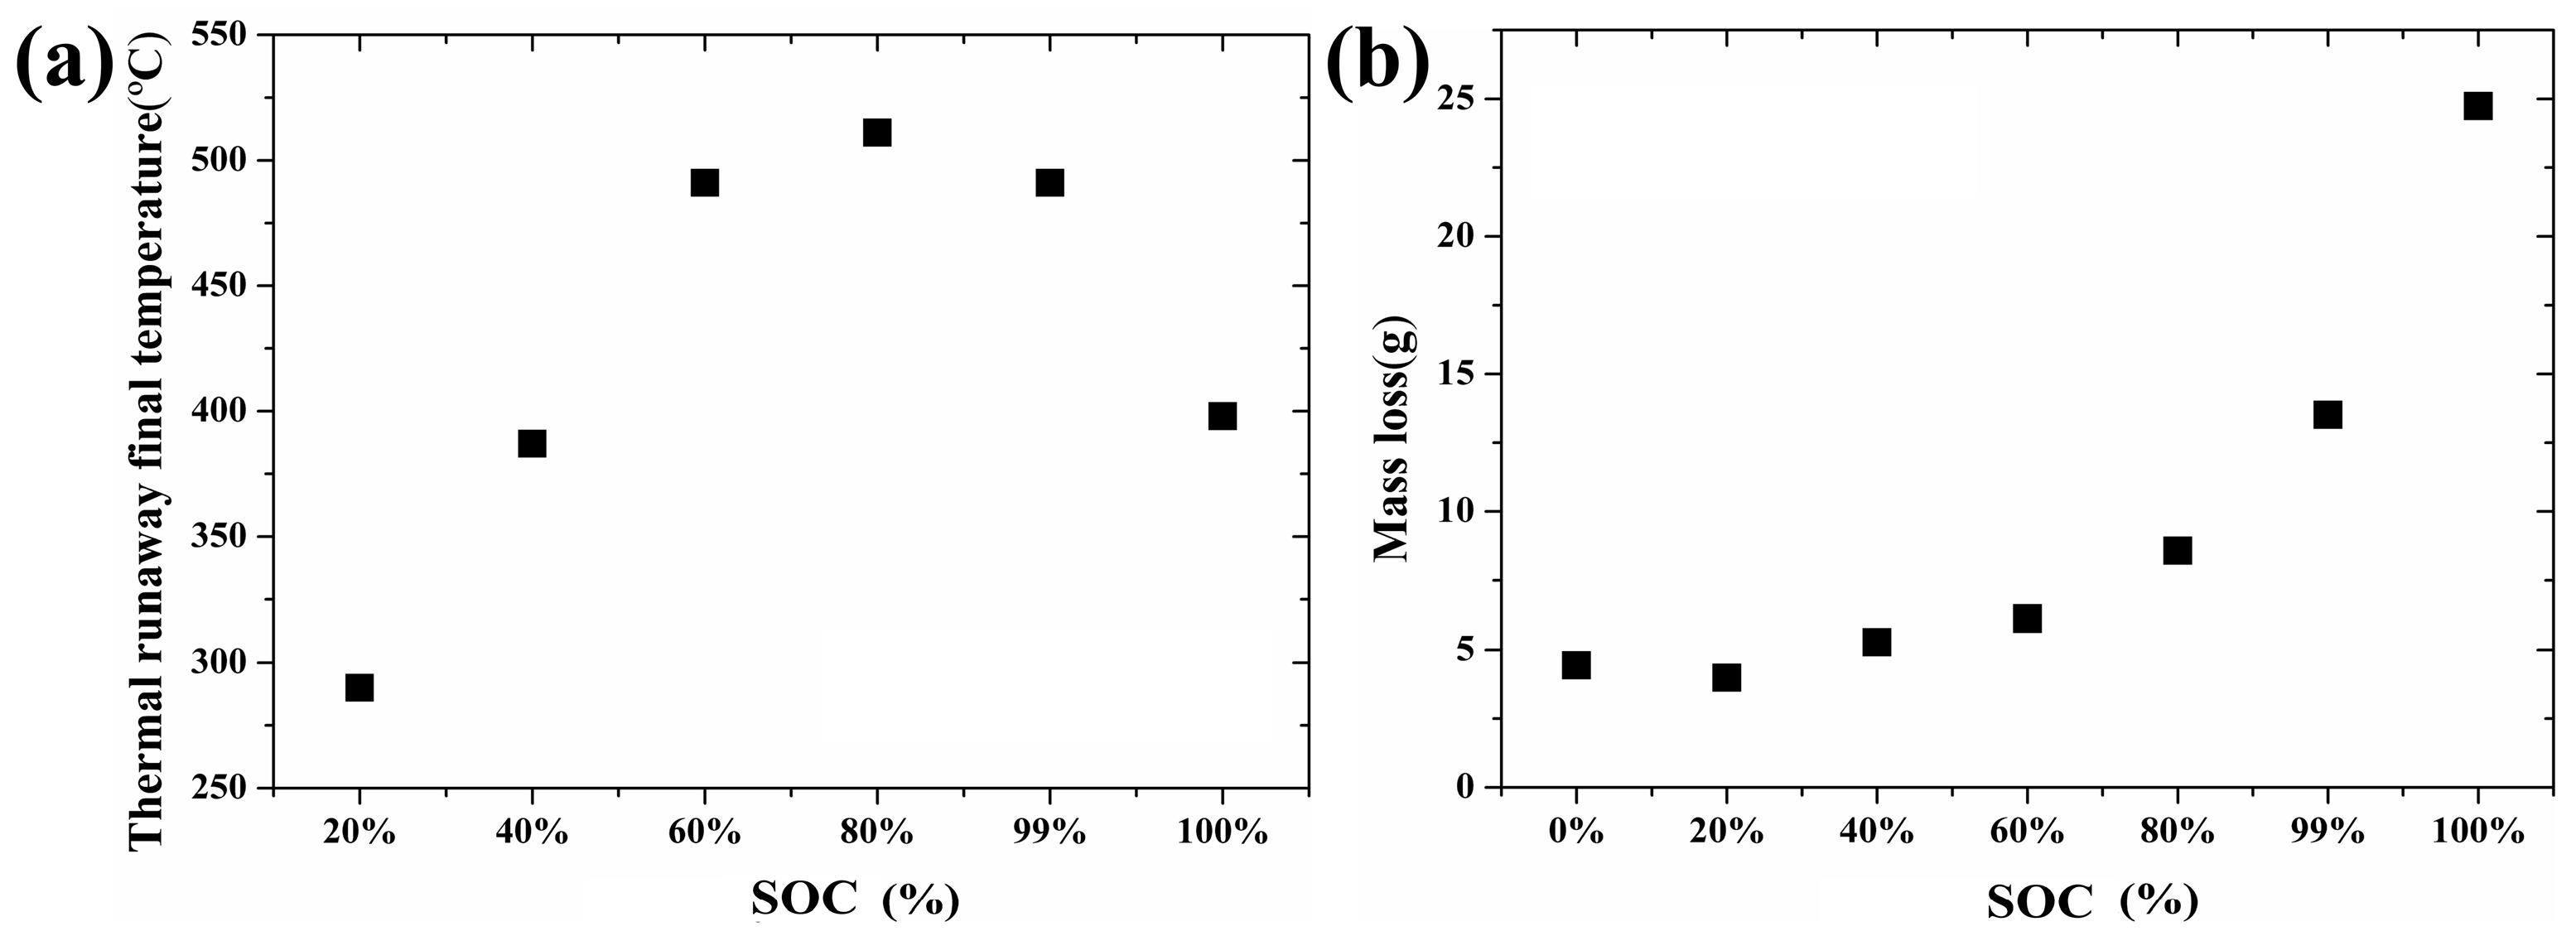
Figure 5a illustrates the correlation between the termination temperature and SOC when the heating power is maintained at 20 W. The thermal runaway final temperature increases first and then decreases with the increase of the SOC. As mentioned above, the higher the SOC is, the more sufficient the reaction that will take place [
10]. A more sufficient reaction will bring more heat and result in more radical interaction. However, when the SOC reached a certain level, the radical interaction led to mass ejection from the battery after thermal runaway. A large amount of heat was released from the battery, and the thermal runaway final temperature decreased when the SOC was greater than 80%.
The relationship between the mass loss and SOC is shown in
Figure 5b when the heating power is maintained at 20 W. Mass loss increases with the increase of the SOC. On the one hand, higher SOC, associated with a violent reaction, leads to more gas ejection during the thermal runaway. On the other hand, the leakage of the electrolyte contributes to the total mass loss.
3.3. Effect of Charging Process
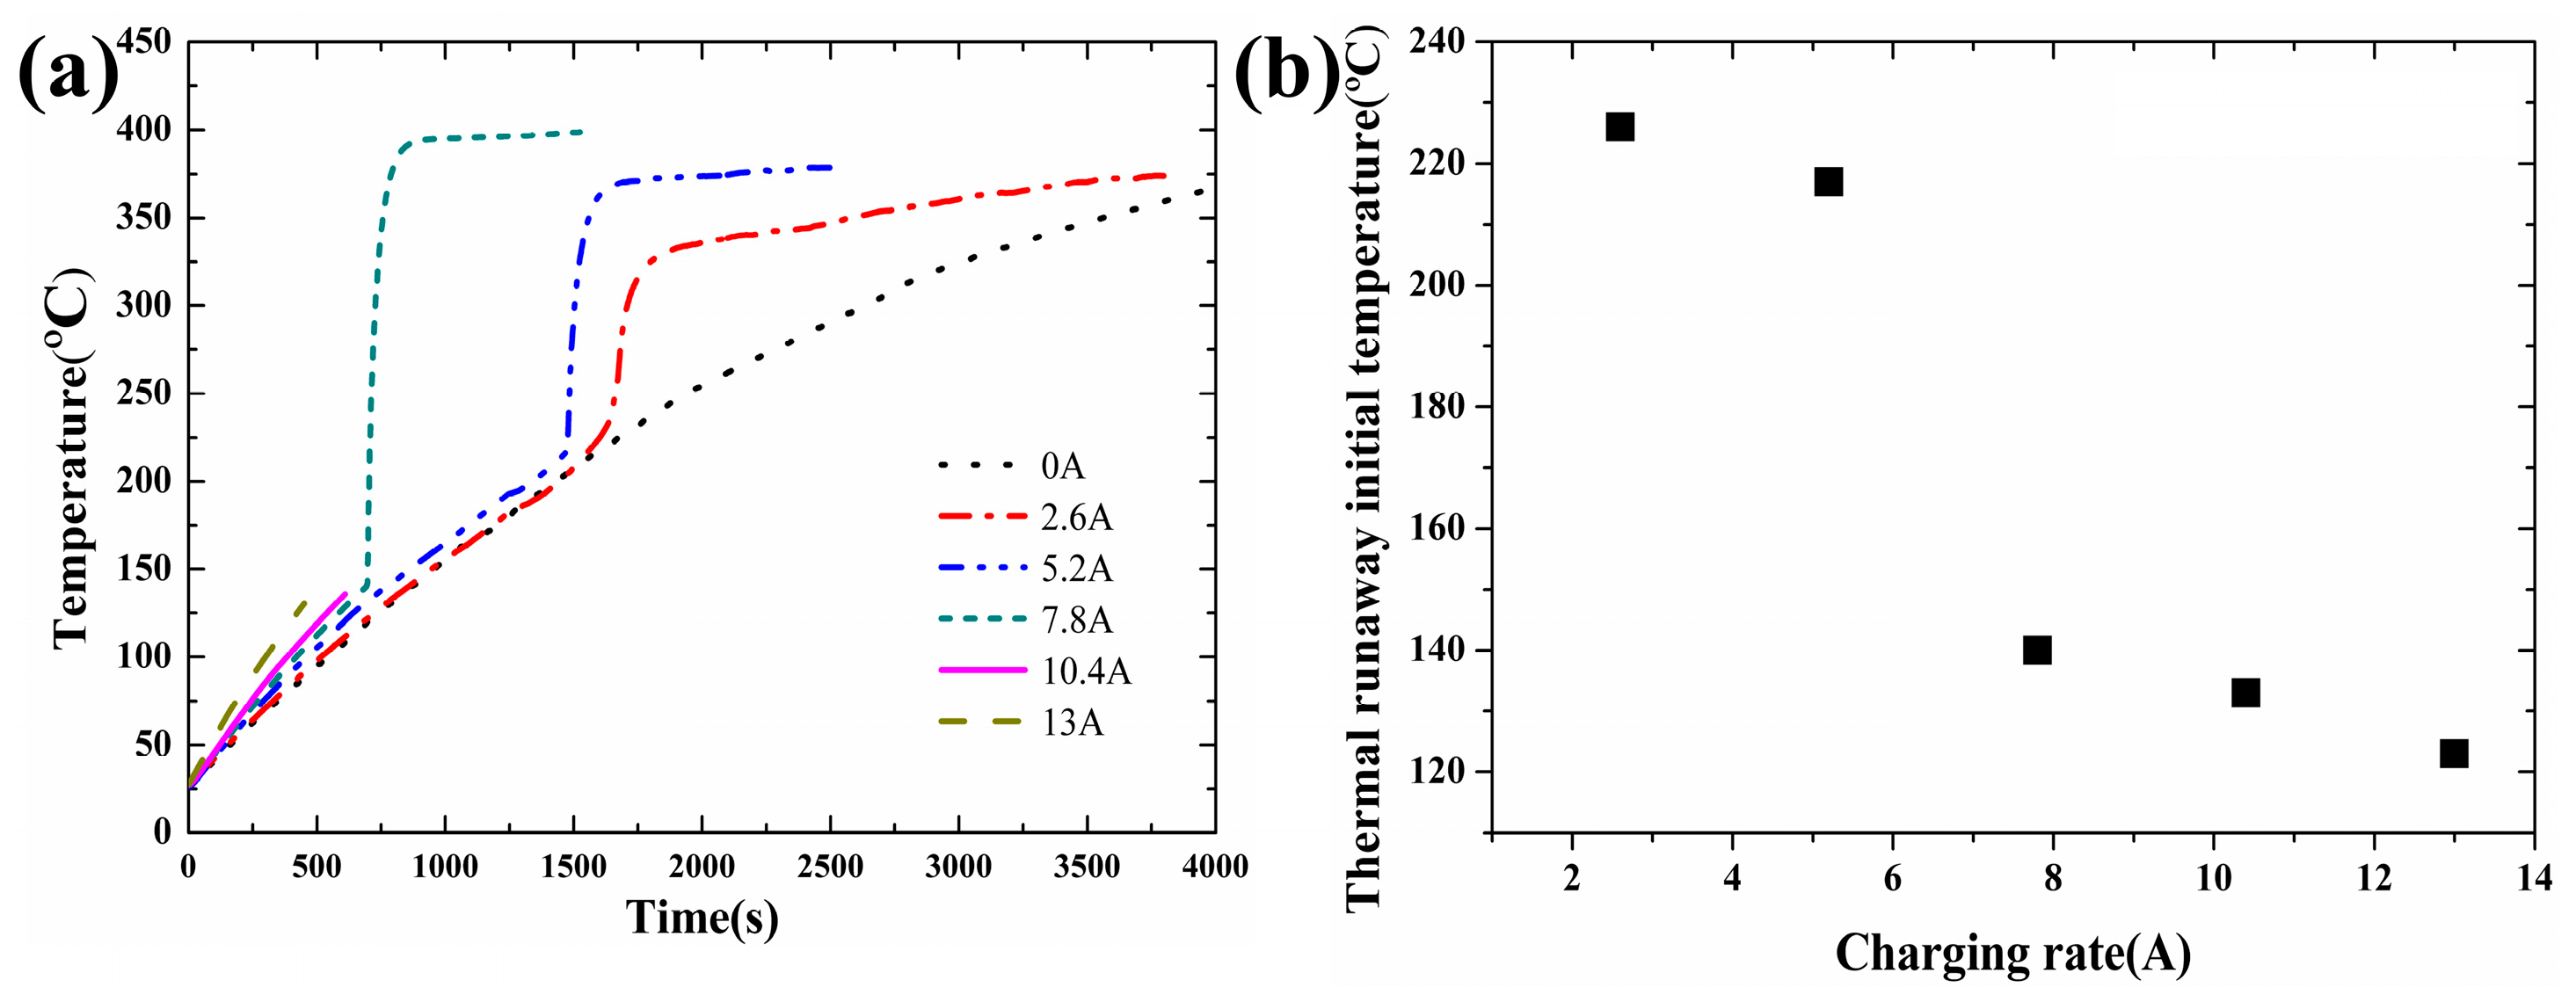
The temperature curves are shown in
Figure 6a when the heating power is maintained at 20 W with the charging current varying from 2.6 A to 13 A. The measured values during the tests are tabulated in
Table 4. No thermal runaway was observed when the charging current was 0 A. The main reason is that no exothermic reaction between the Li
xC
6, binder and electrolyte [
6,
23] took place and the heat transfer from the heating wire was not enough to initiate the thermal runaway.
The relationship between the thermal runaway initial temperature and the different charging current is shown in
Figure 6b when the heating power is maintained at 20 W. In
Figure 6, the thermal runaway occurred when the charging current was equal to or larger than 2.6 A. The thermal runaway initial temperature decreased with the charging current, which is caused by the fact that the heat produced by the electrolyte oxidation reaction is indirectly proportional to the square of the charging current [
20]. When the charging current is larger than 10.4 A, the internal material of the lithium-ion battery and shell are completely separated into two parts. When the charging current reaches a critical value, the interior of the lithium-ion battery reacts violently and releases large amounts of gas and energy in a short time. The internal material could be ejected from the lithium-ion battery by the high pressure.
As mentioned in
Section 3.2, the more lithium the electrodes can take in, the more total energy the battery can store, and the longer it can last. Similarly, for a larger charging rate, namely the charging current, more lithium is adsorbed by the electrodes and less reactant is left in the electrolyte, which also leads to a lower reaction rate and heat release rate. Thus the initial temperature decreases with the increasing SOC.
According to the charging current and time, the power of the initial thermal runaway can be calculated and is tabulated in the last column of
Table 4. For 10.4 A and 13 A, no measurement of mass loss was implemented due to explosion during the tests. The thermal runaway final temperature increases with the charging current in the range of 2.6 A to 10.4 A. It is mainly caused by the fact that a higher charging current leads to a higher power of the initial thermal runaway. This indicates that more Li
xC
6 is produced and a more intense reaction takes place between the Li
xC
6, electrolyte and binder, which provides more heat and results in a higher thermal runaway final temperature [
10].
3.4. Effect of Discharging Process
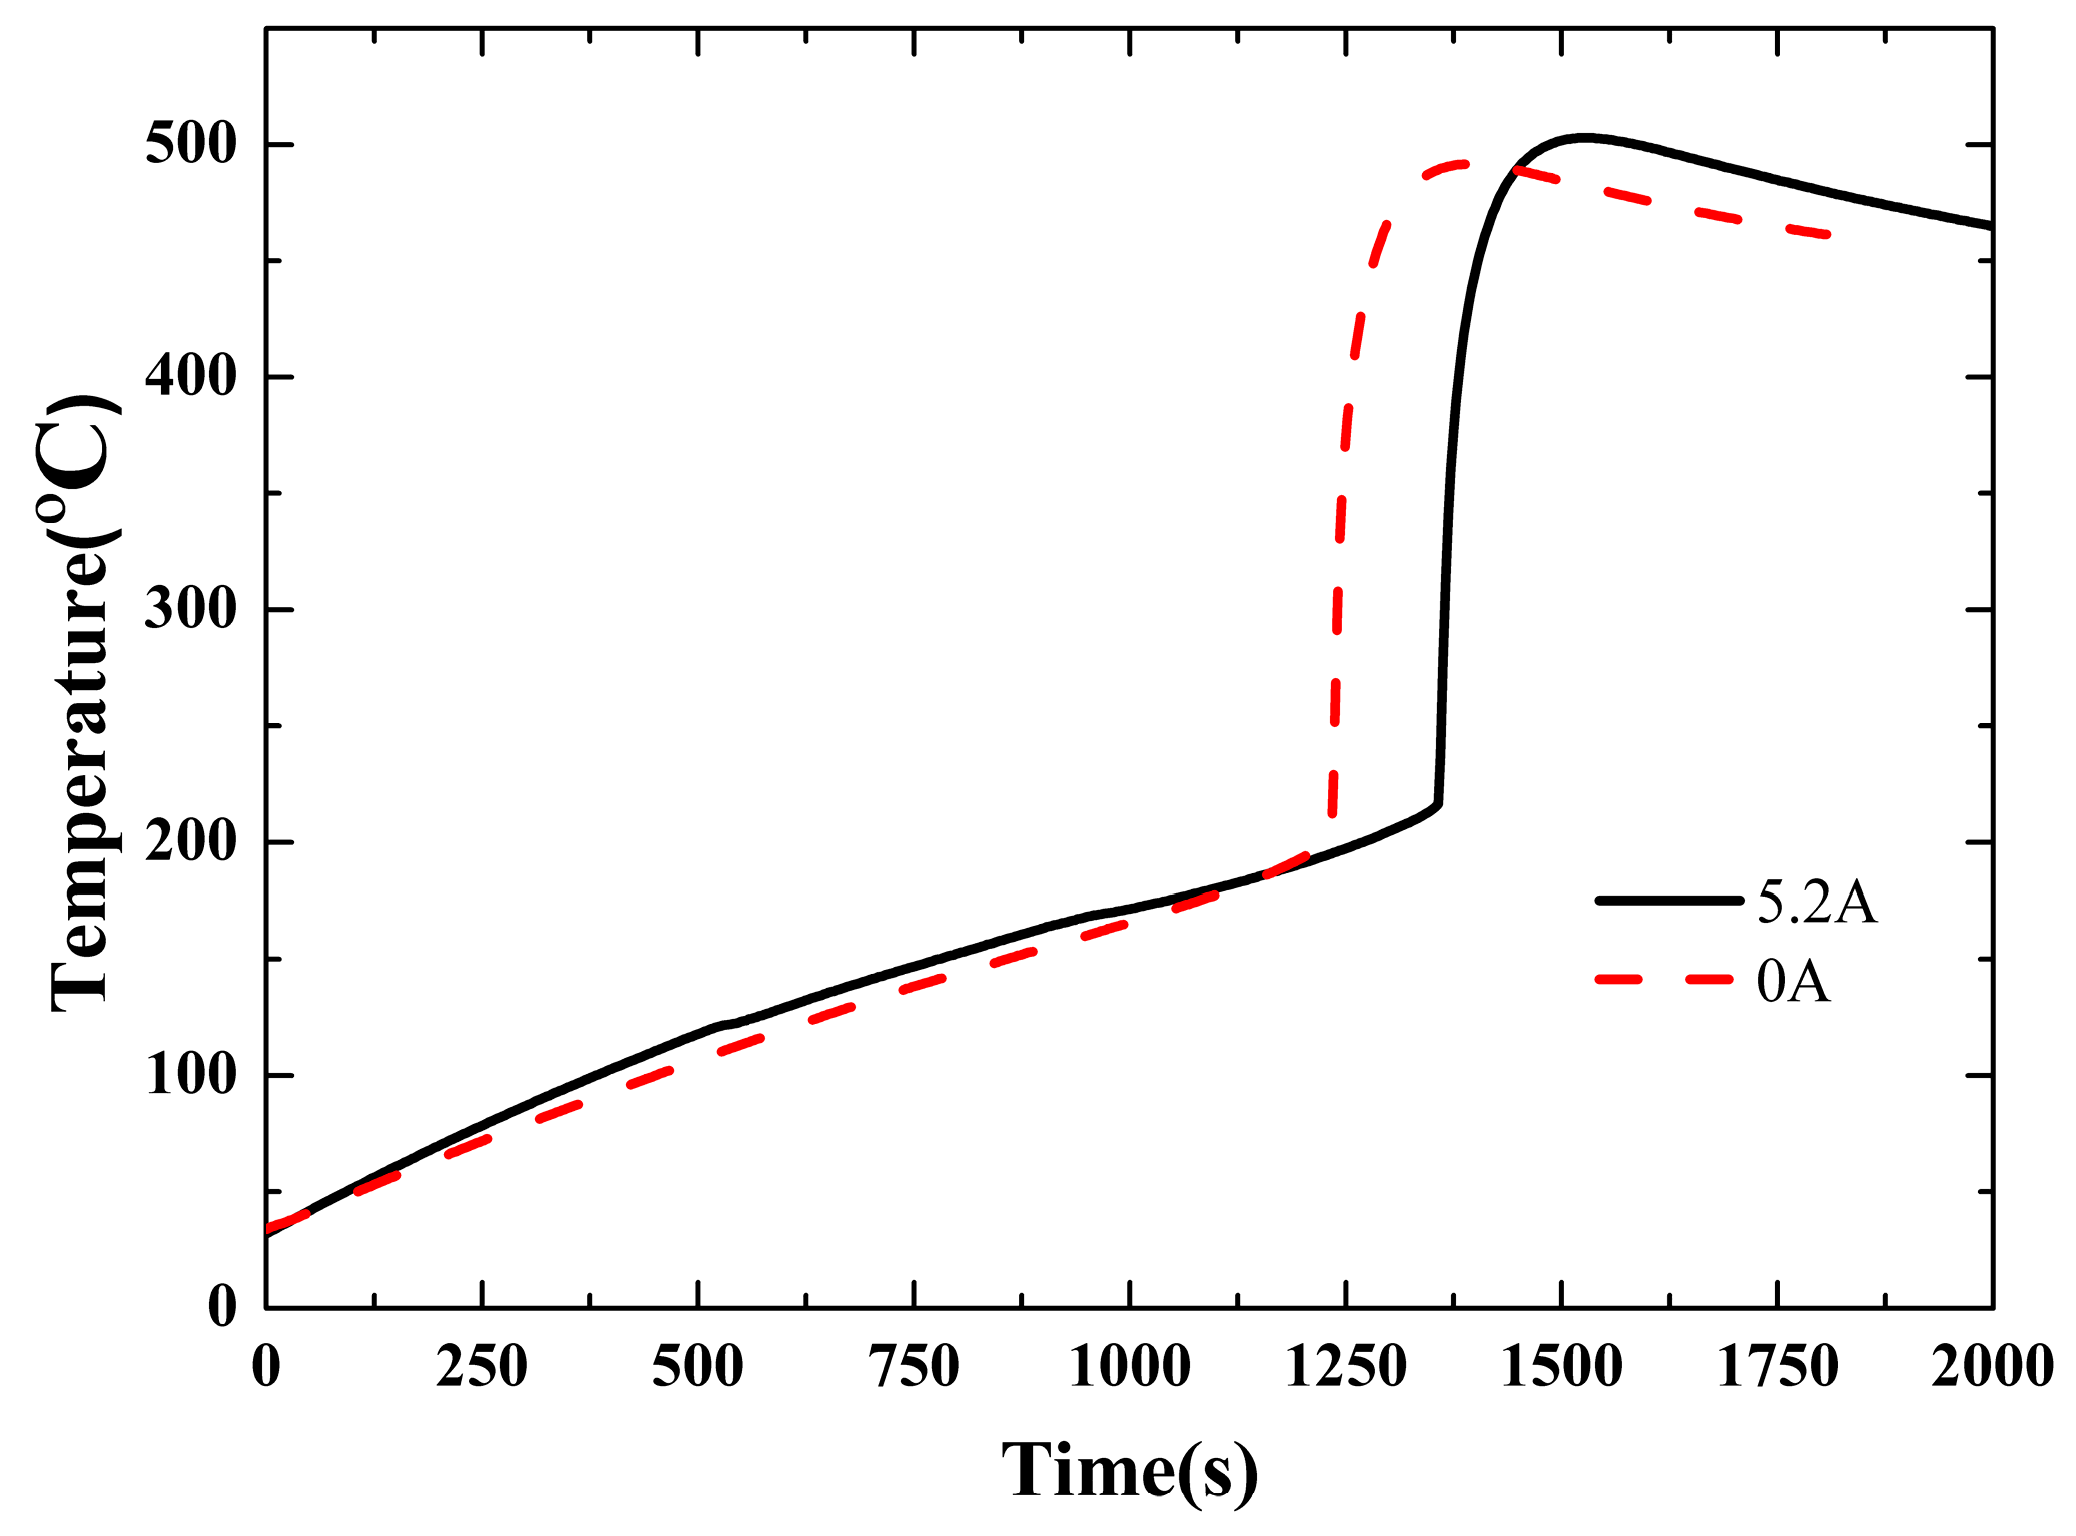
Figure 7 shows the temperature curves during 0 A and 5.2 A discharging tests with a 20 W heating power when the initial SOC is 100%. The measured values during the tests are tabulated in
Table 5. As the discharging continues, the SOC decreases from 100% to a critical value, 72% in this case, shown in
Table 5, and no discharging can be maintained below this level due to the high temperature. The corresponding time of the end of discharging was about 500 during the tests, as shown in
Table 5. Compared with the non-discharging battery, the temperature curve and temperature increase rate of the discharging battery surpassed the other one during the first 500 s. However, the temperature increase rate got lower than that of the non-discharging one after 500 s until the initiation of thermal runaway. During the early stage, the heat released by the discharging process and the heat transferred from the heating wire are both important. However, after 500 s, only thermal conduction dominates the heat transfer, and thus the increase rate turns lower due to the relatively higher temperature at 500 s.
It can be figured out from
Figure 7 and
Table 5 that the initial temperature of thermal runaway was relatively higher for discharge at 5.2 A. With the 5.2 A discharging process, the SOC decreased to 72% and thus led to a lower thermal runaway initial temperature, as shown in
Table 5. Based on the fact that no discharge can be maintained when the temperature of the system exceeds a criterion, a lower discharging current results in higher SOC at the termination of discharging and consequently leads to a relatively lower thermal runaway initial temperature and vice versa.
Furthermore, with a 5.2 A discharging current, Joule heat is produced by the current, namely Q = I2R. This portion of the heat also enhanced the total heat generation rate, and led to a higher initial temperature.


