
Rare Earth Element Yttrium Modified Mg-Al-Zn Alloy: Microstructure, Degradation Properties and Hardness


Abstract
:1. Introduction
2. Results and Discussion
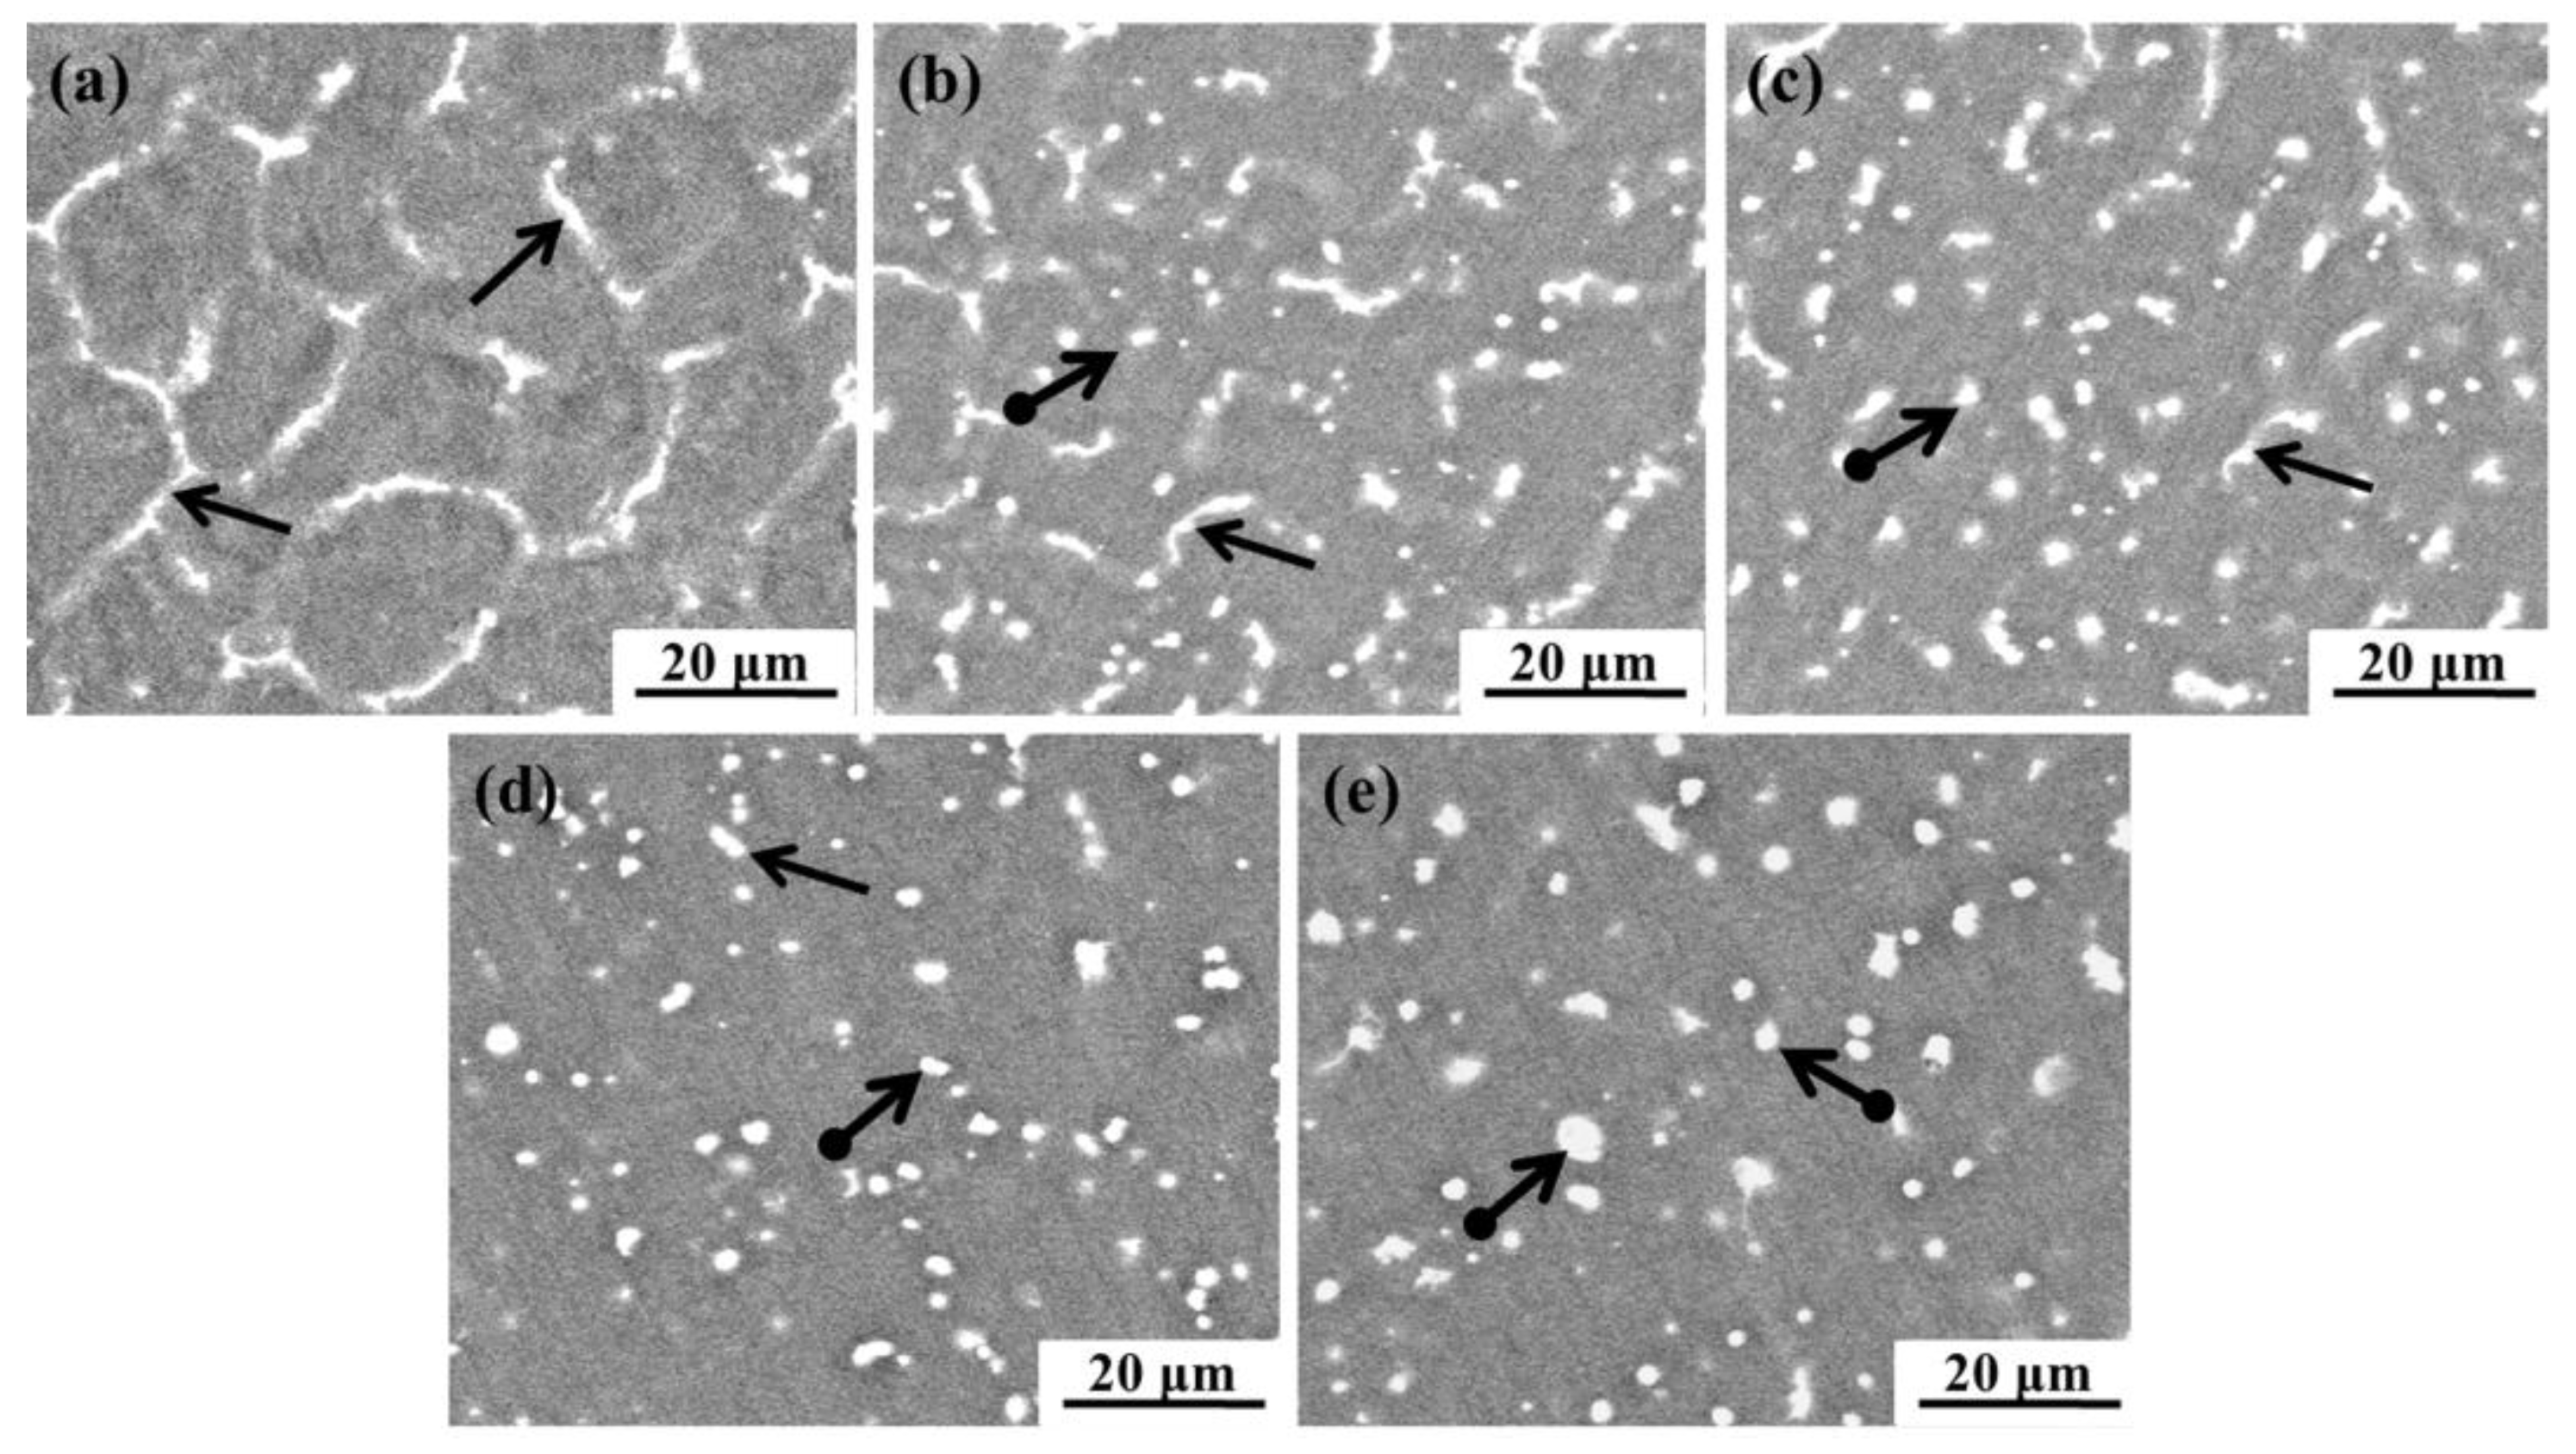
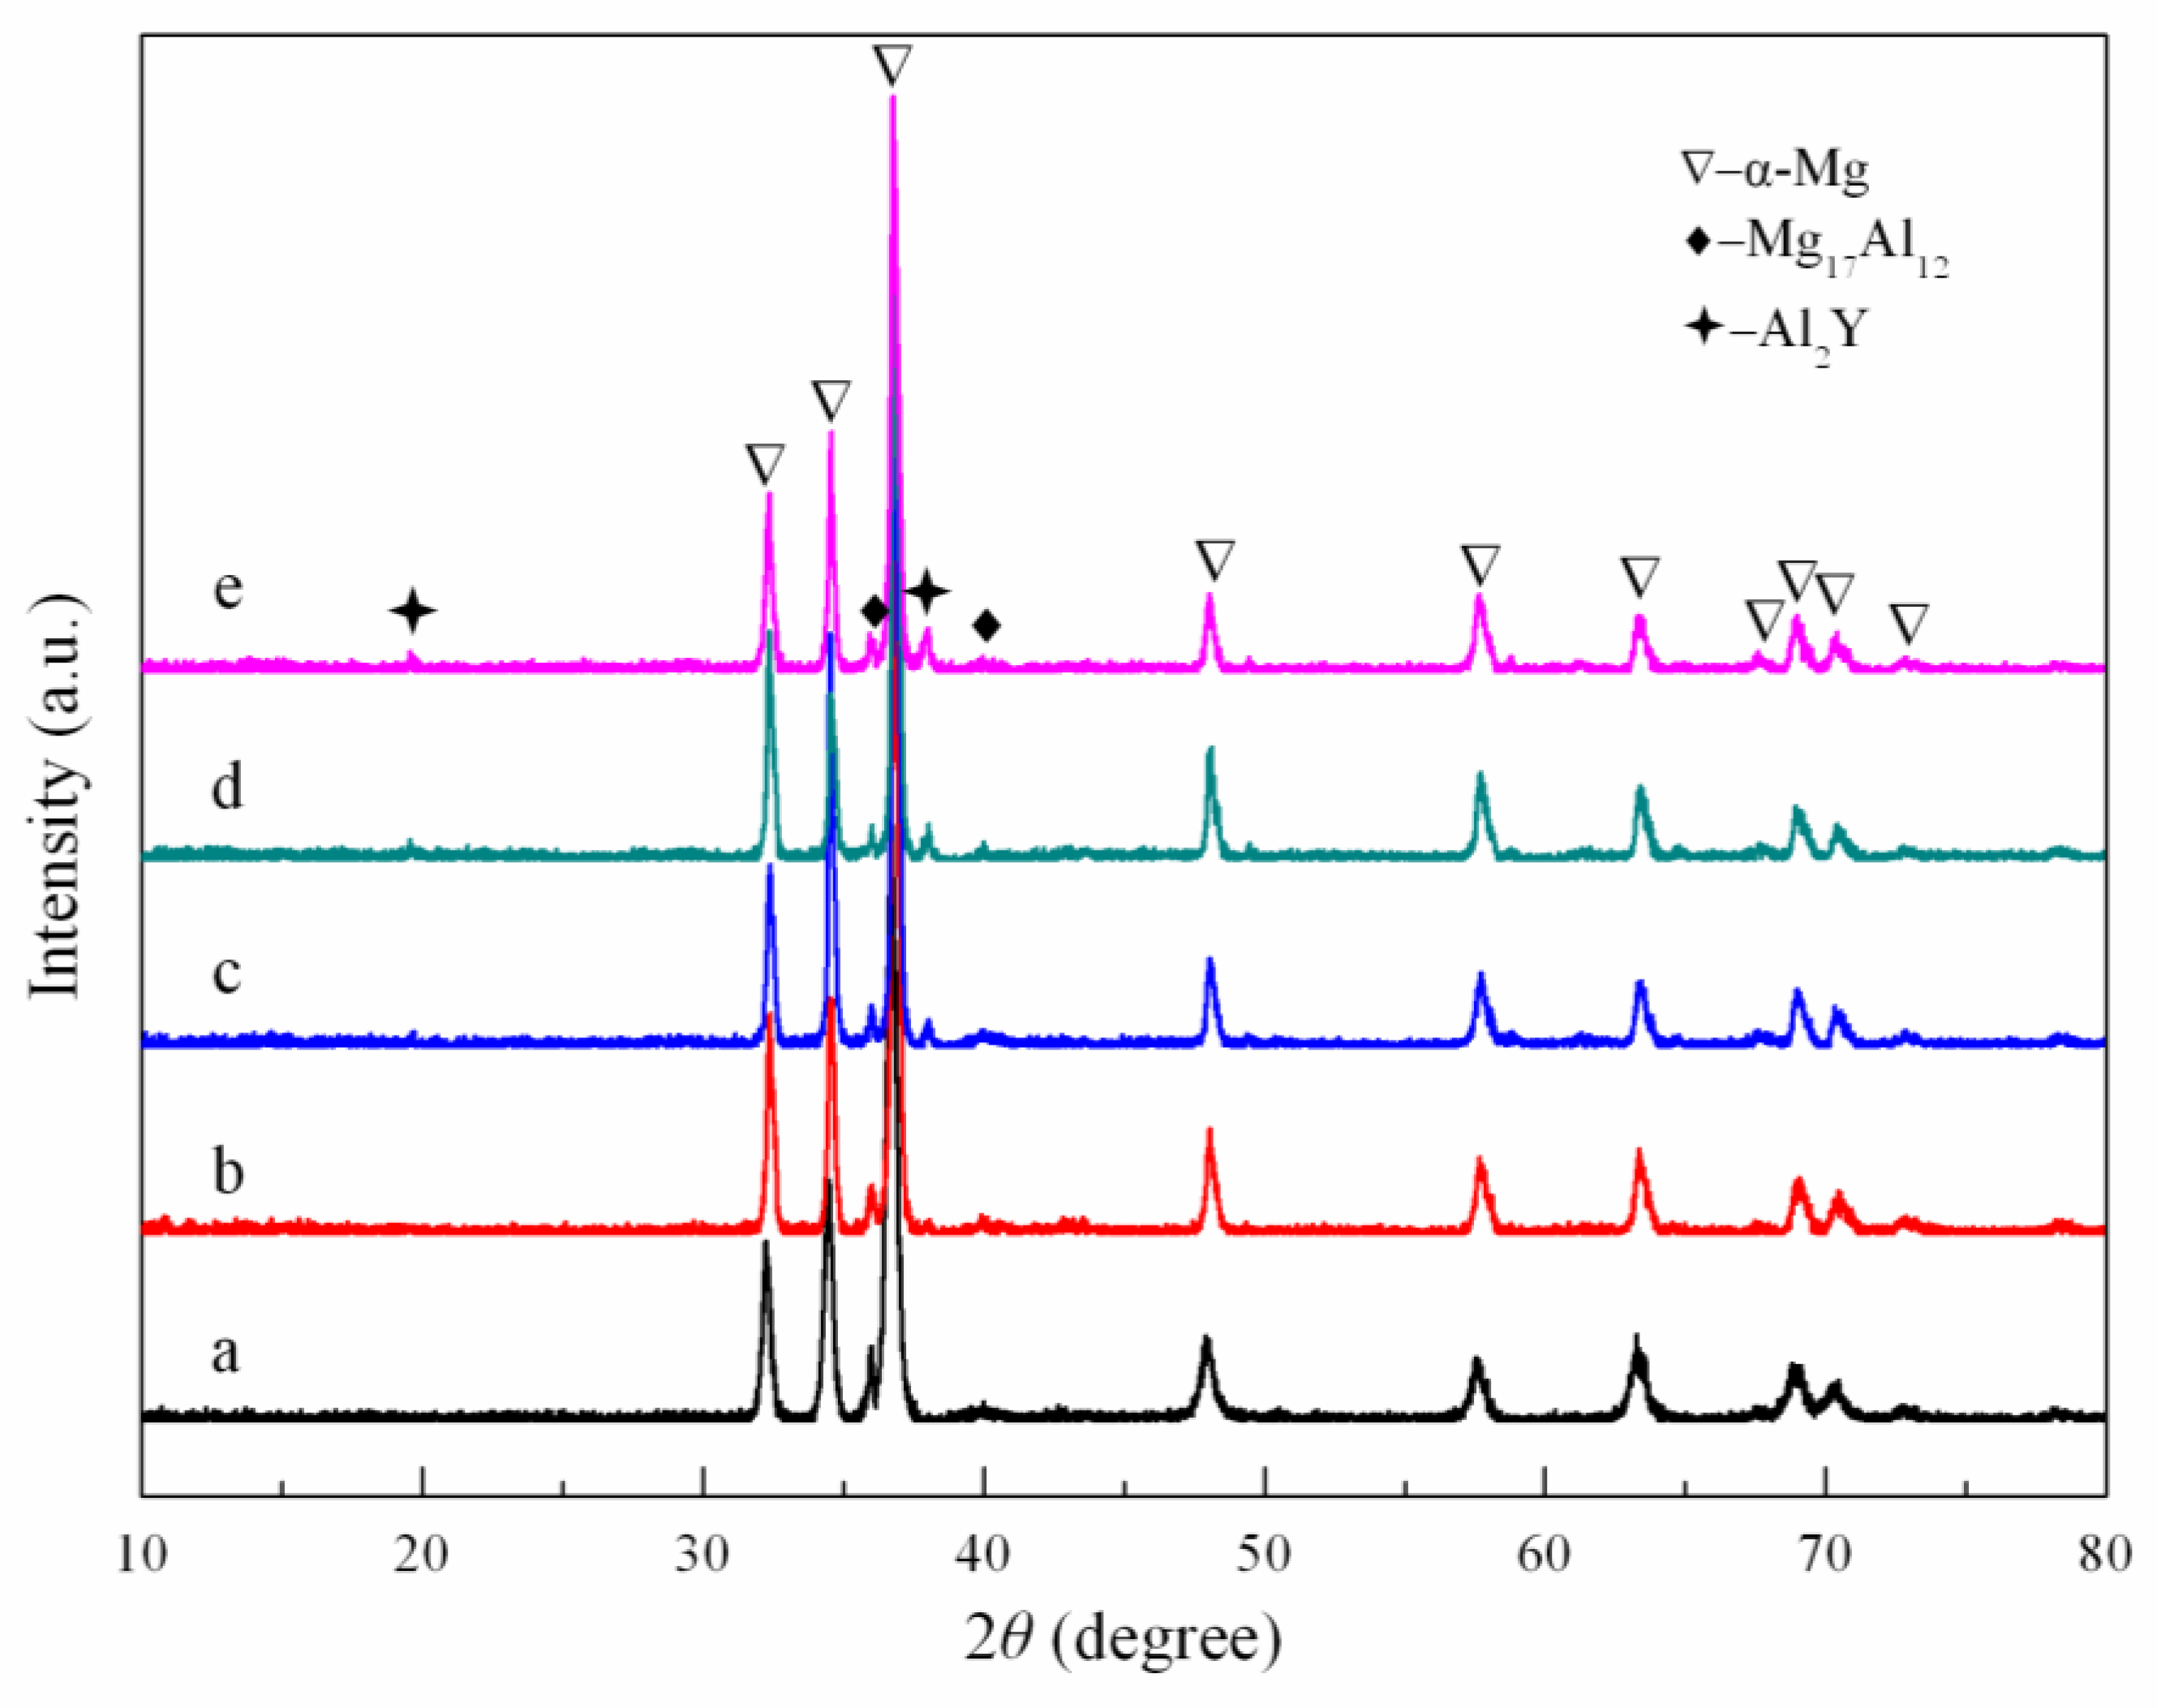
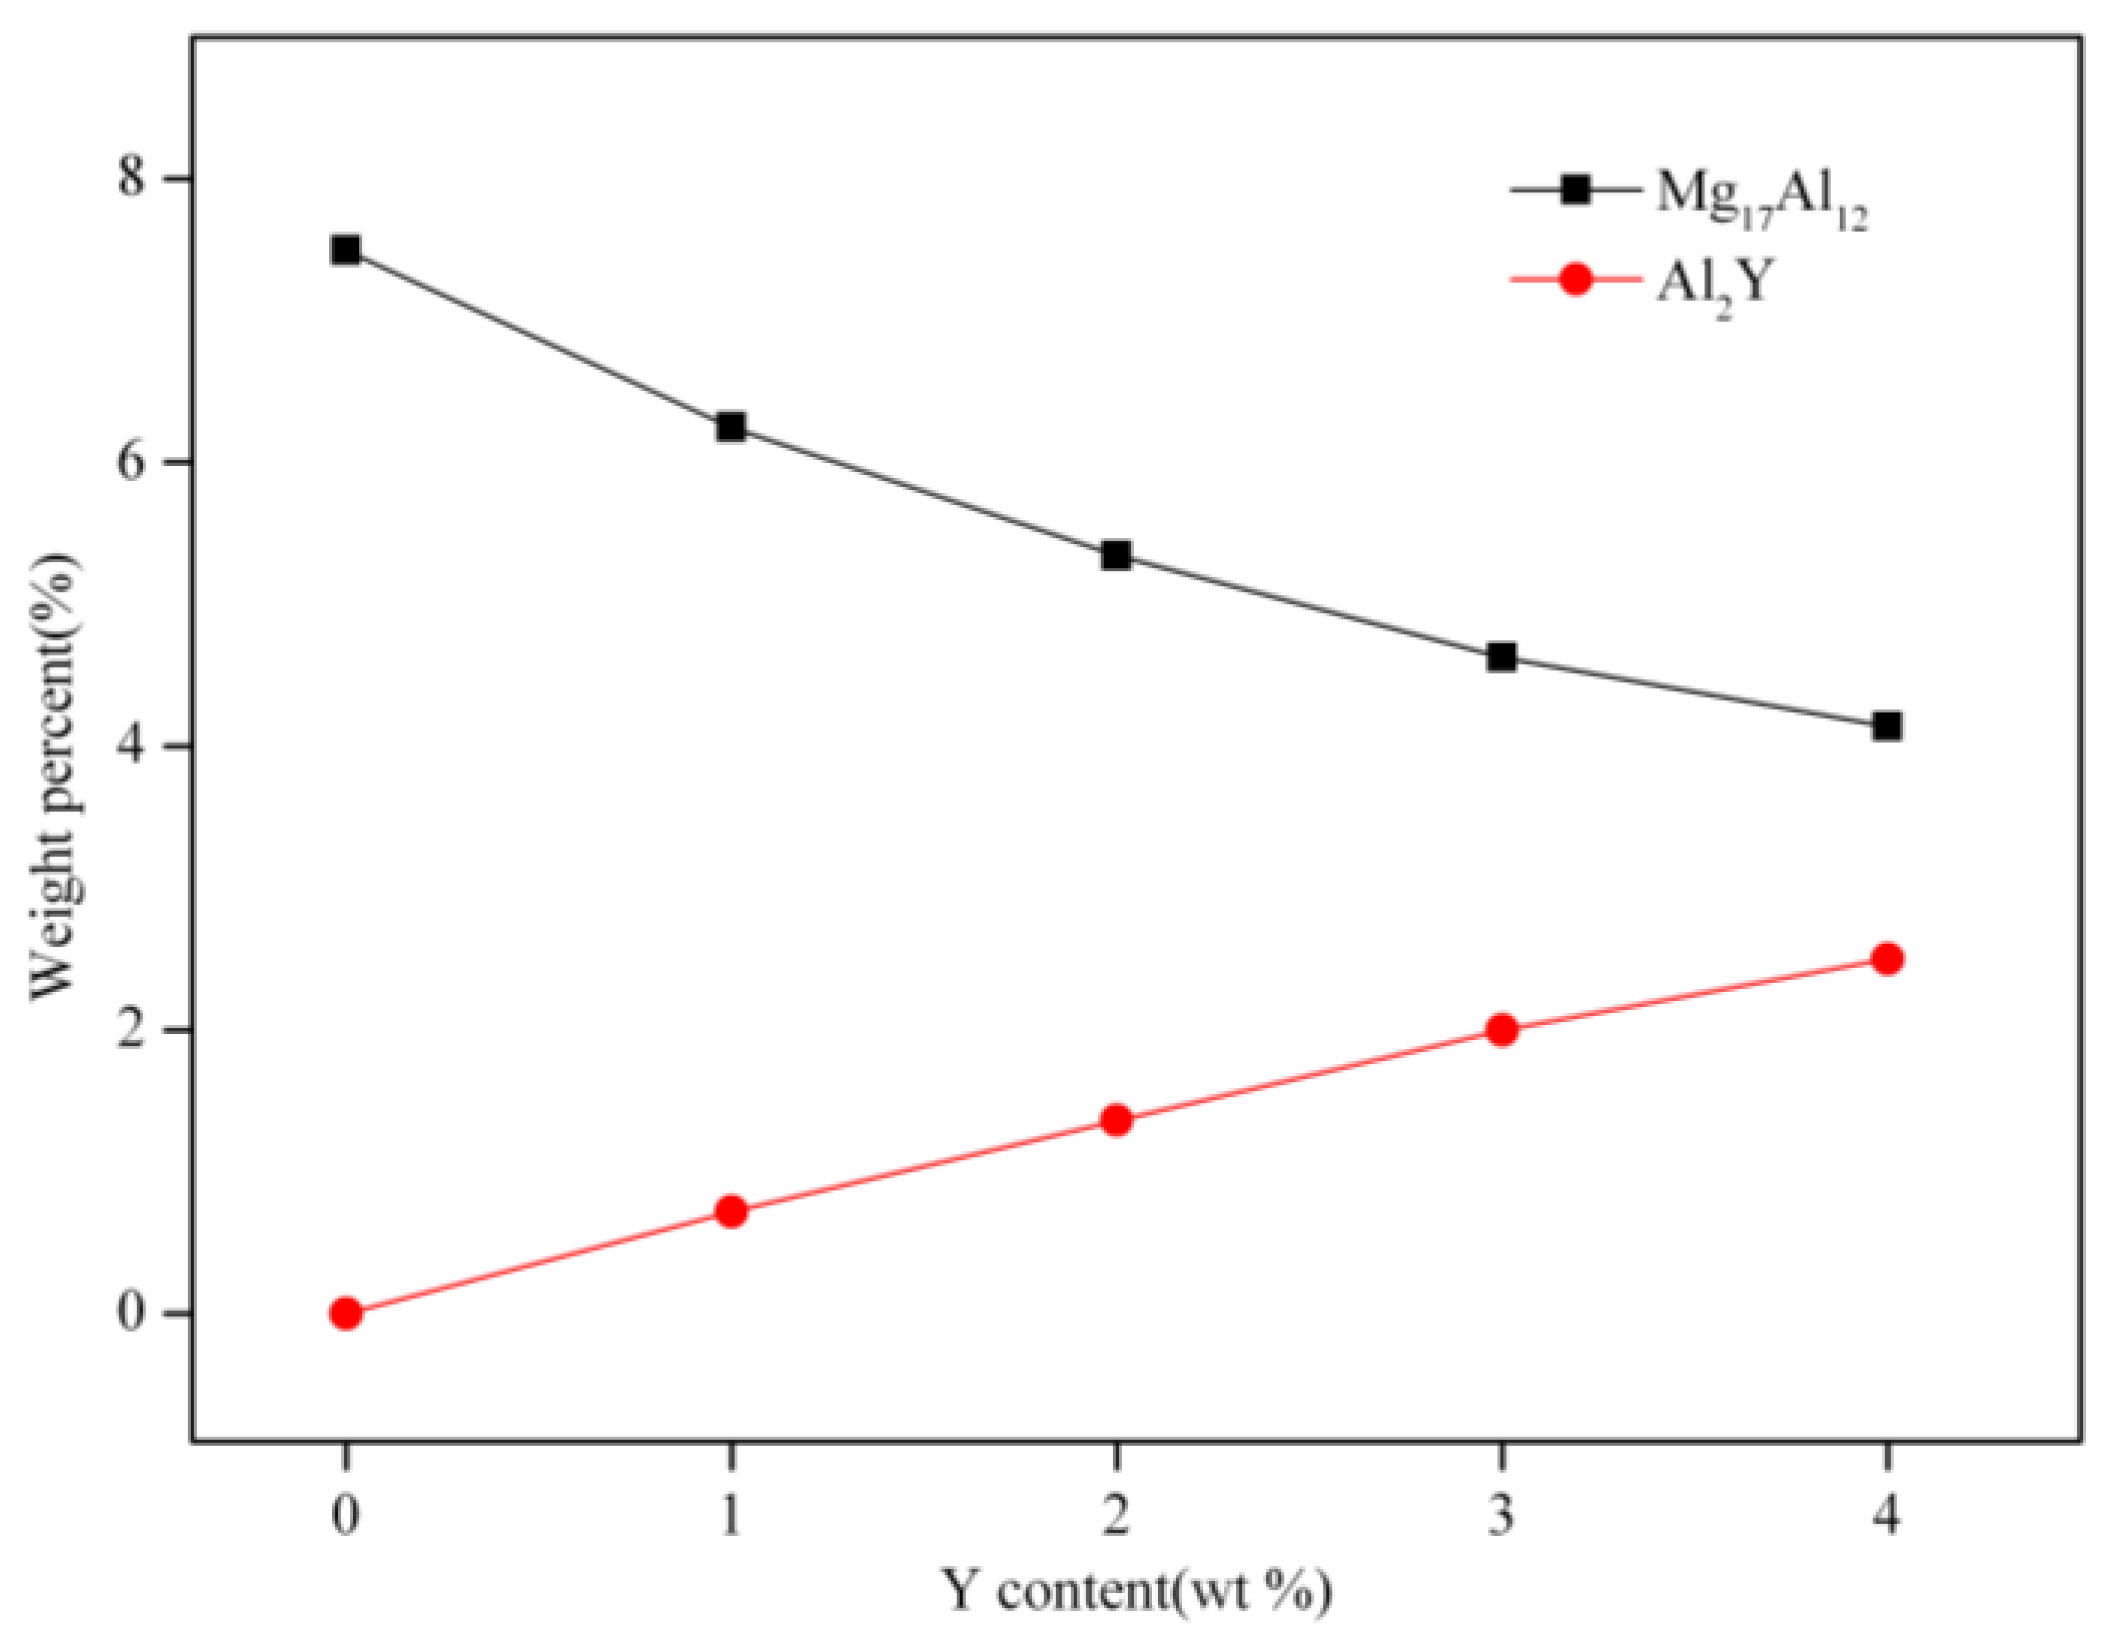
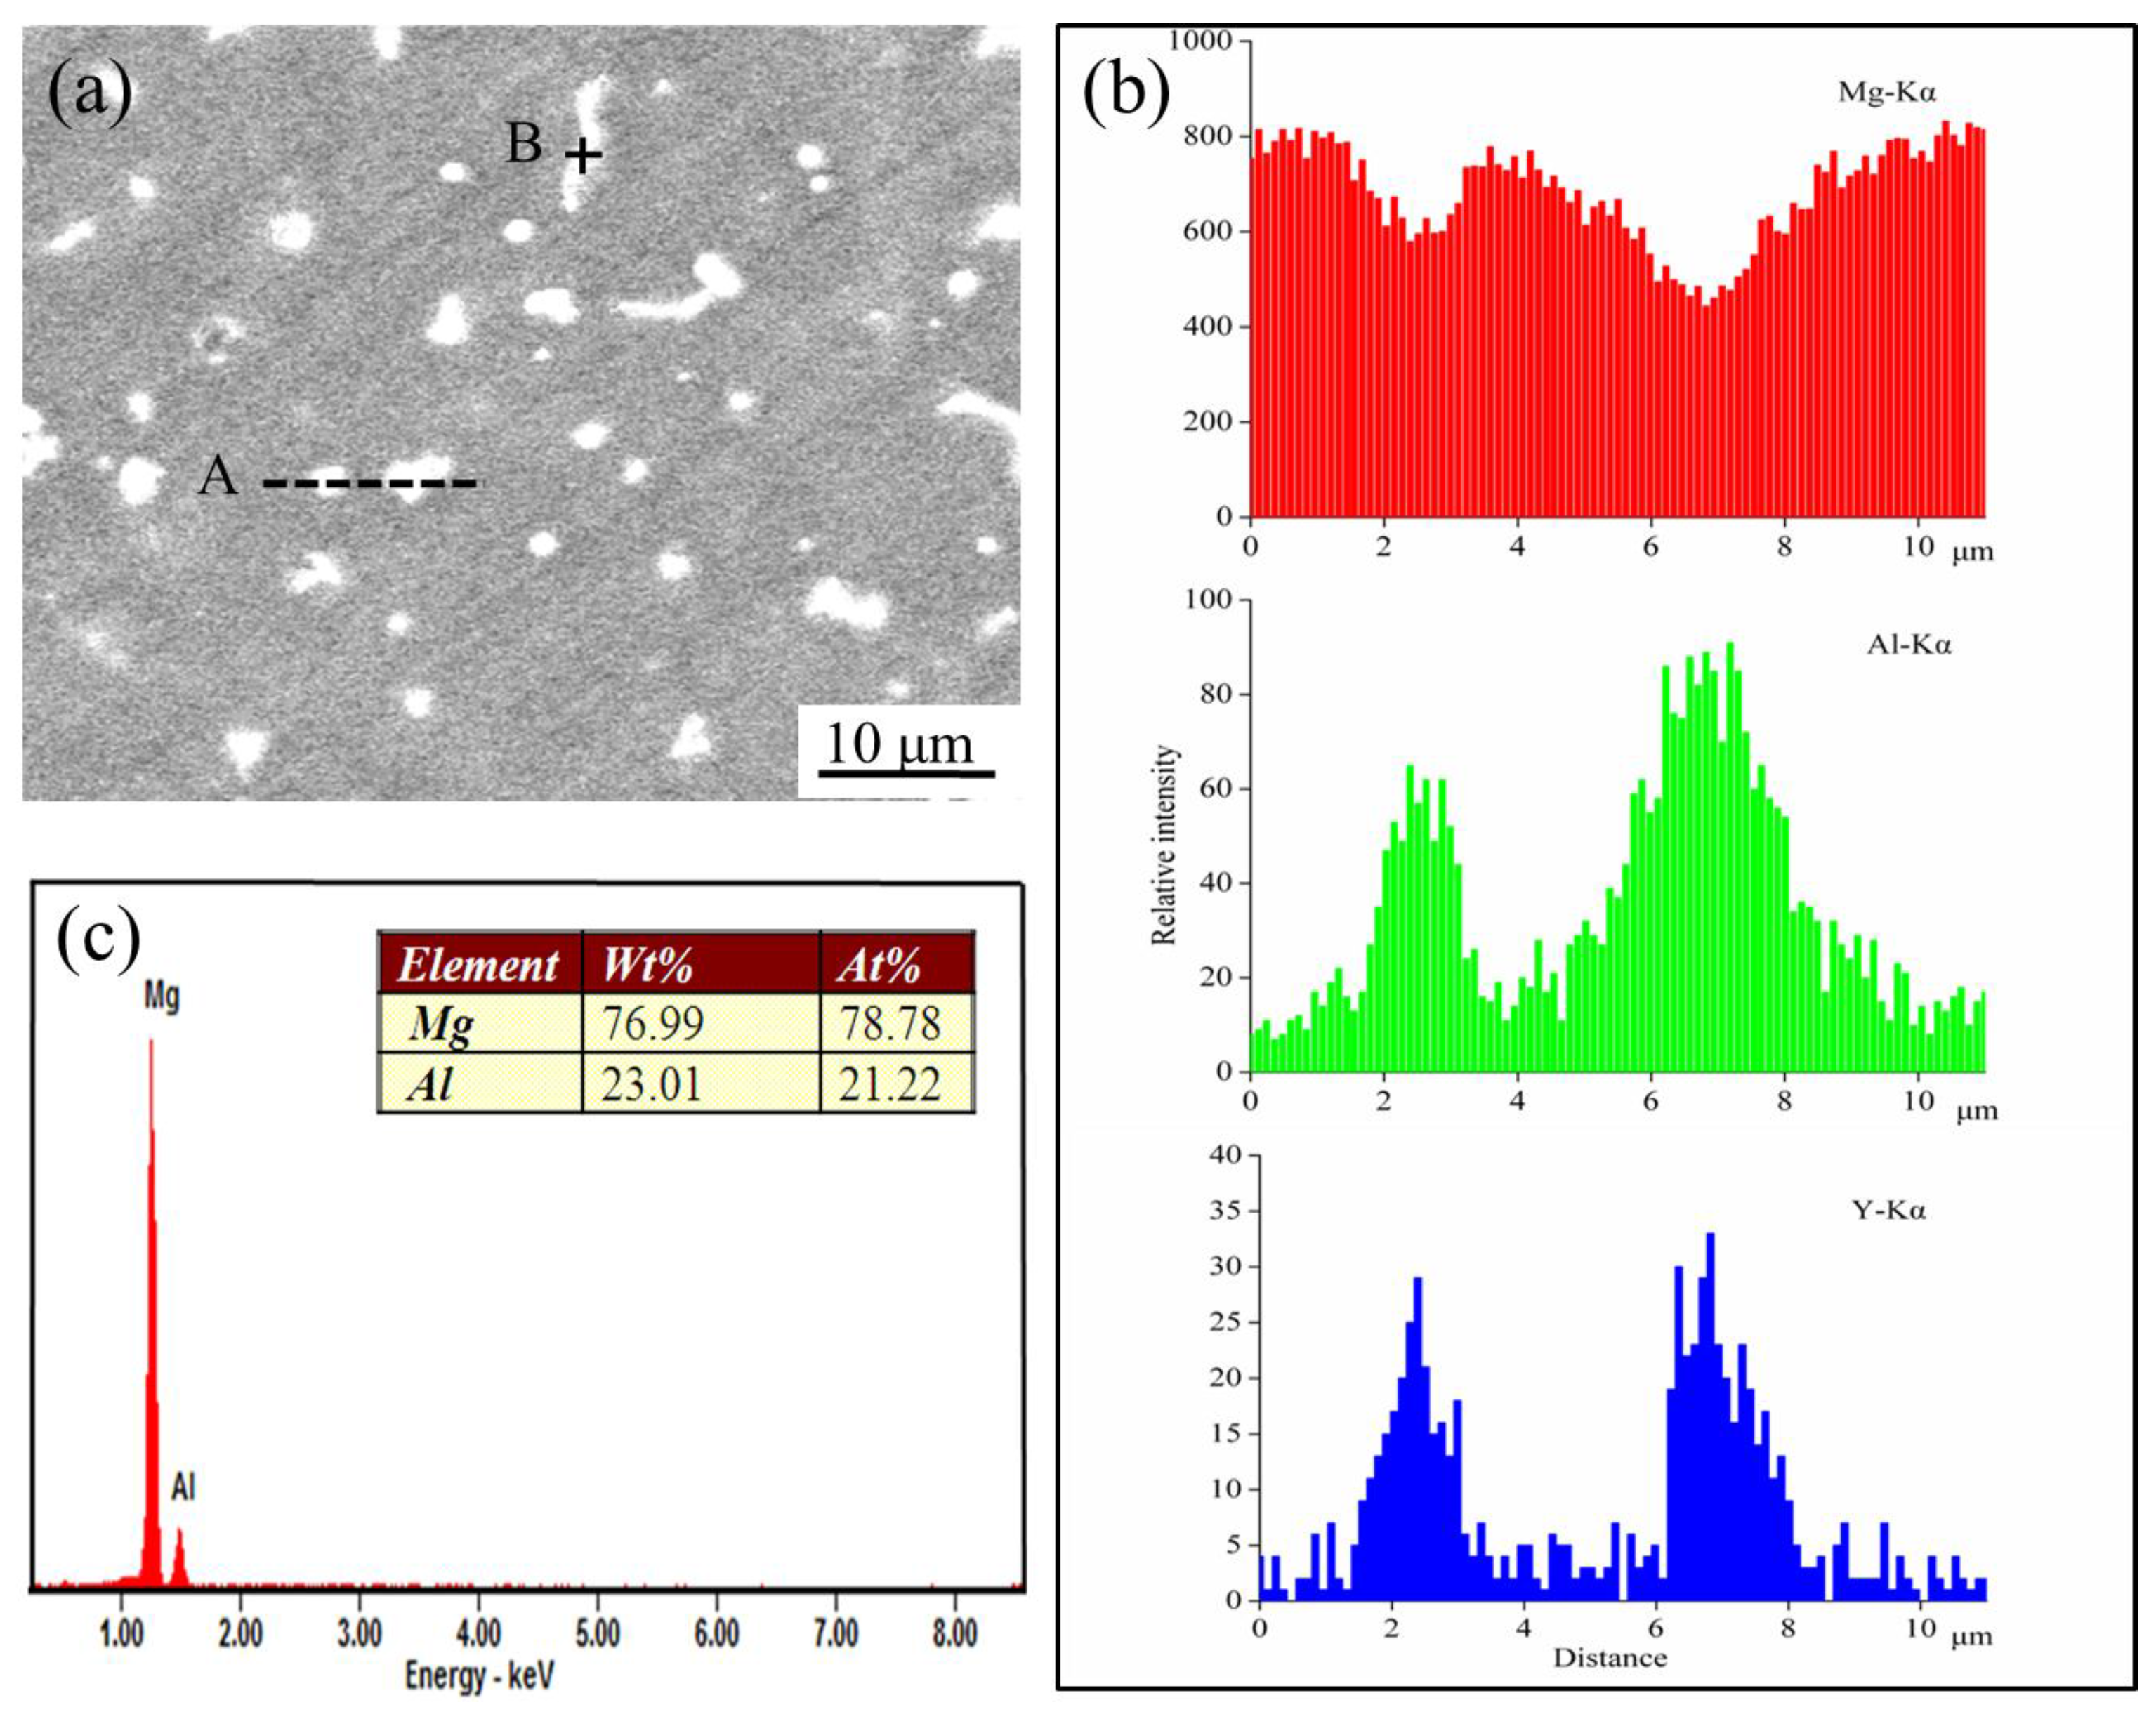
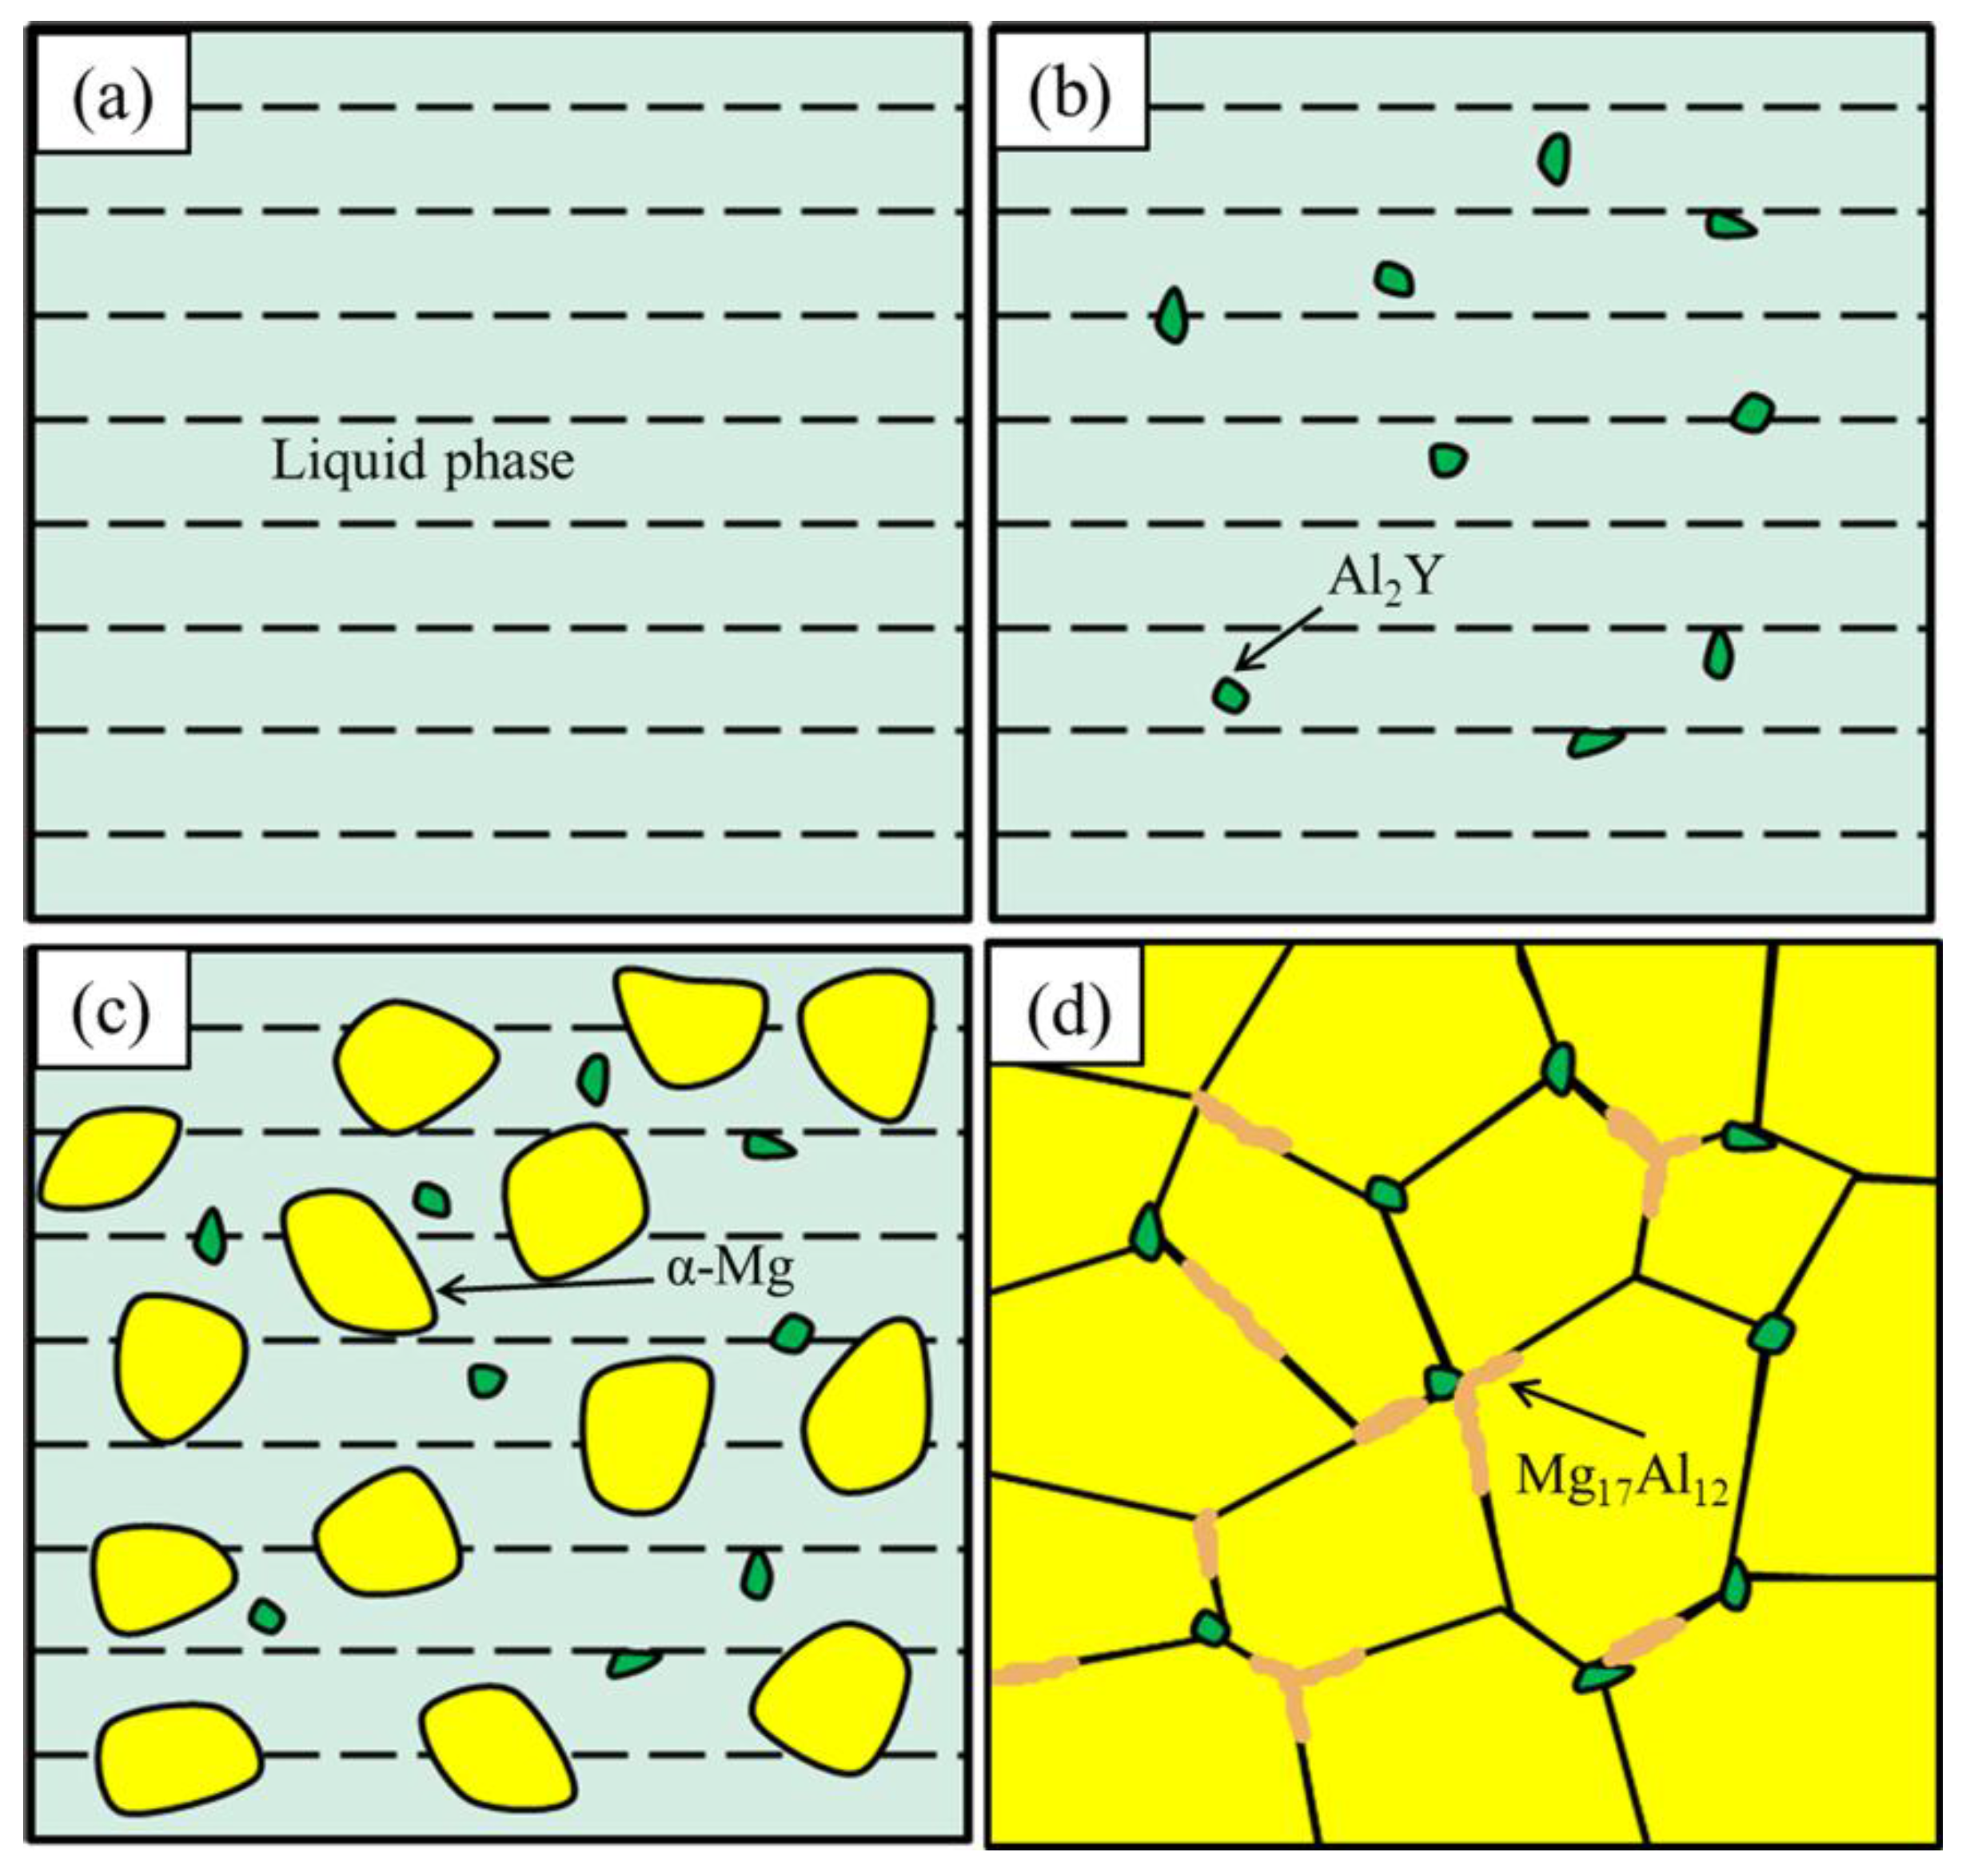
2.1. Microstructure
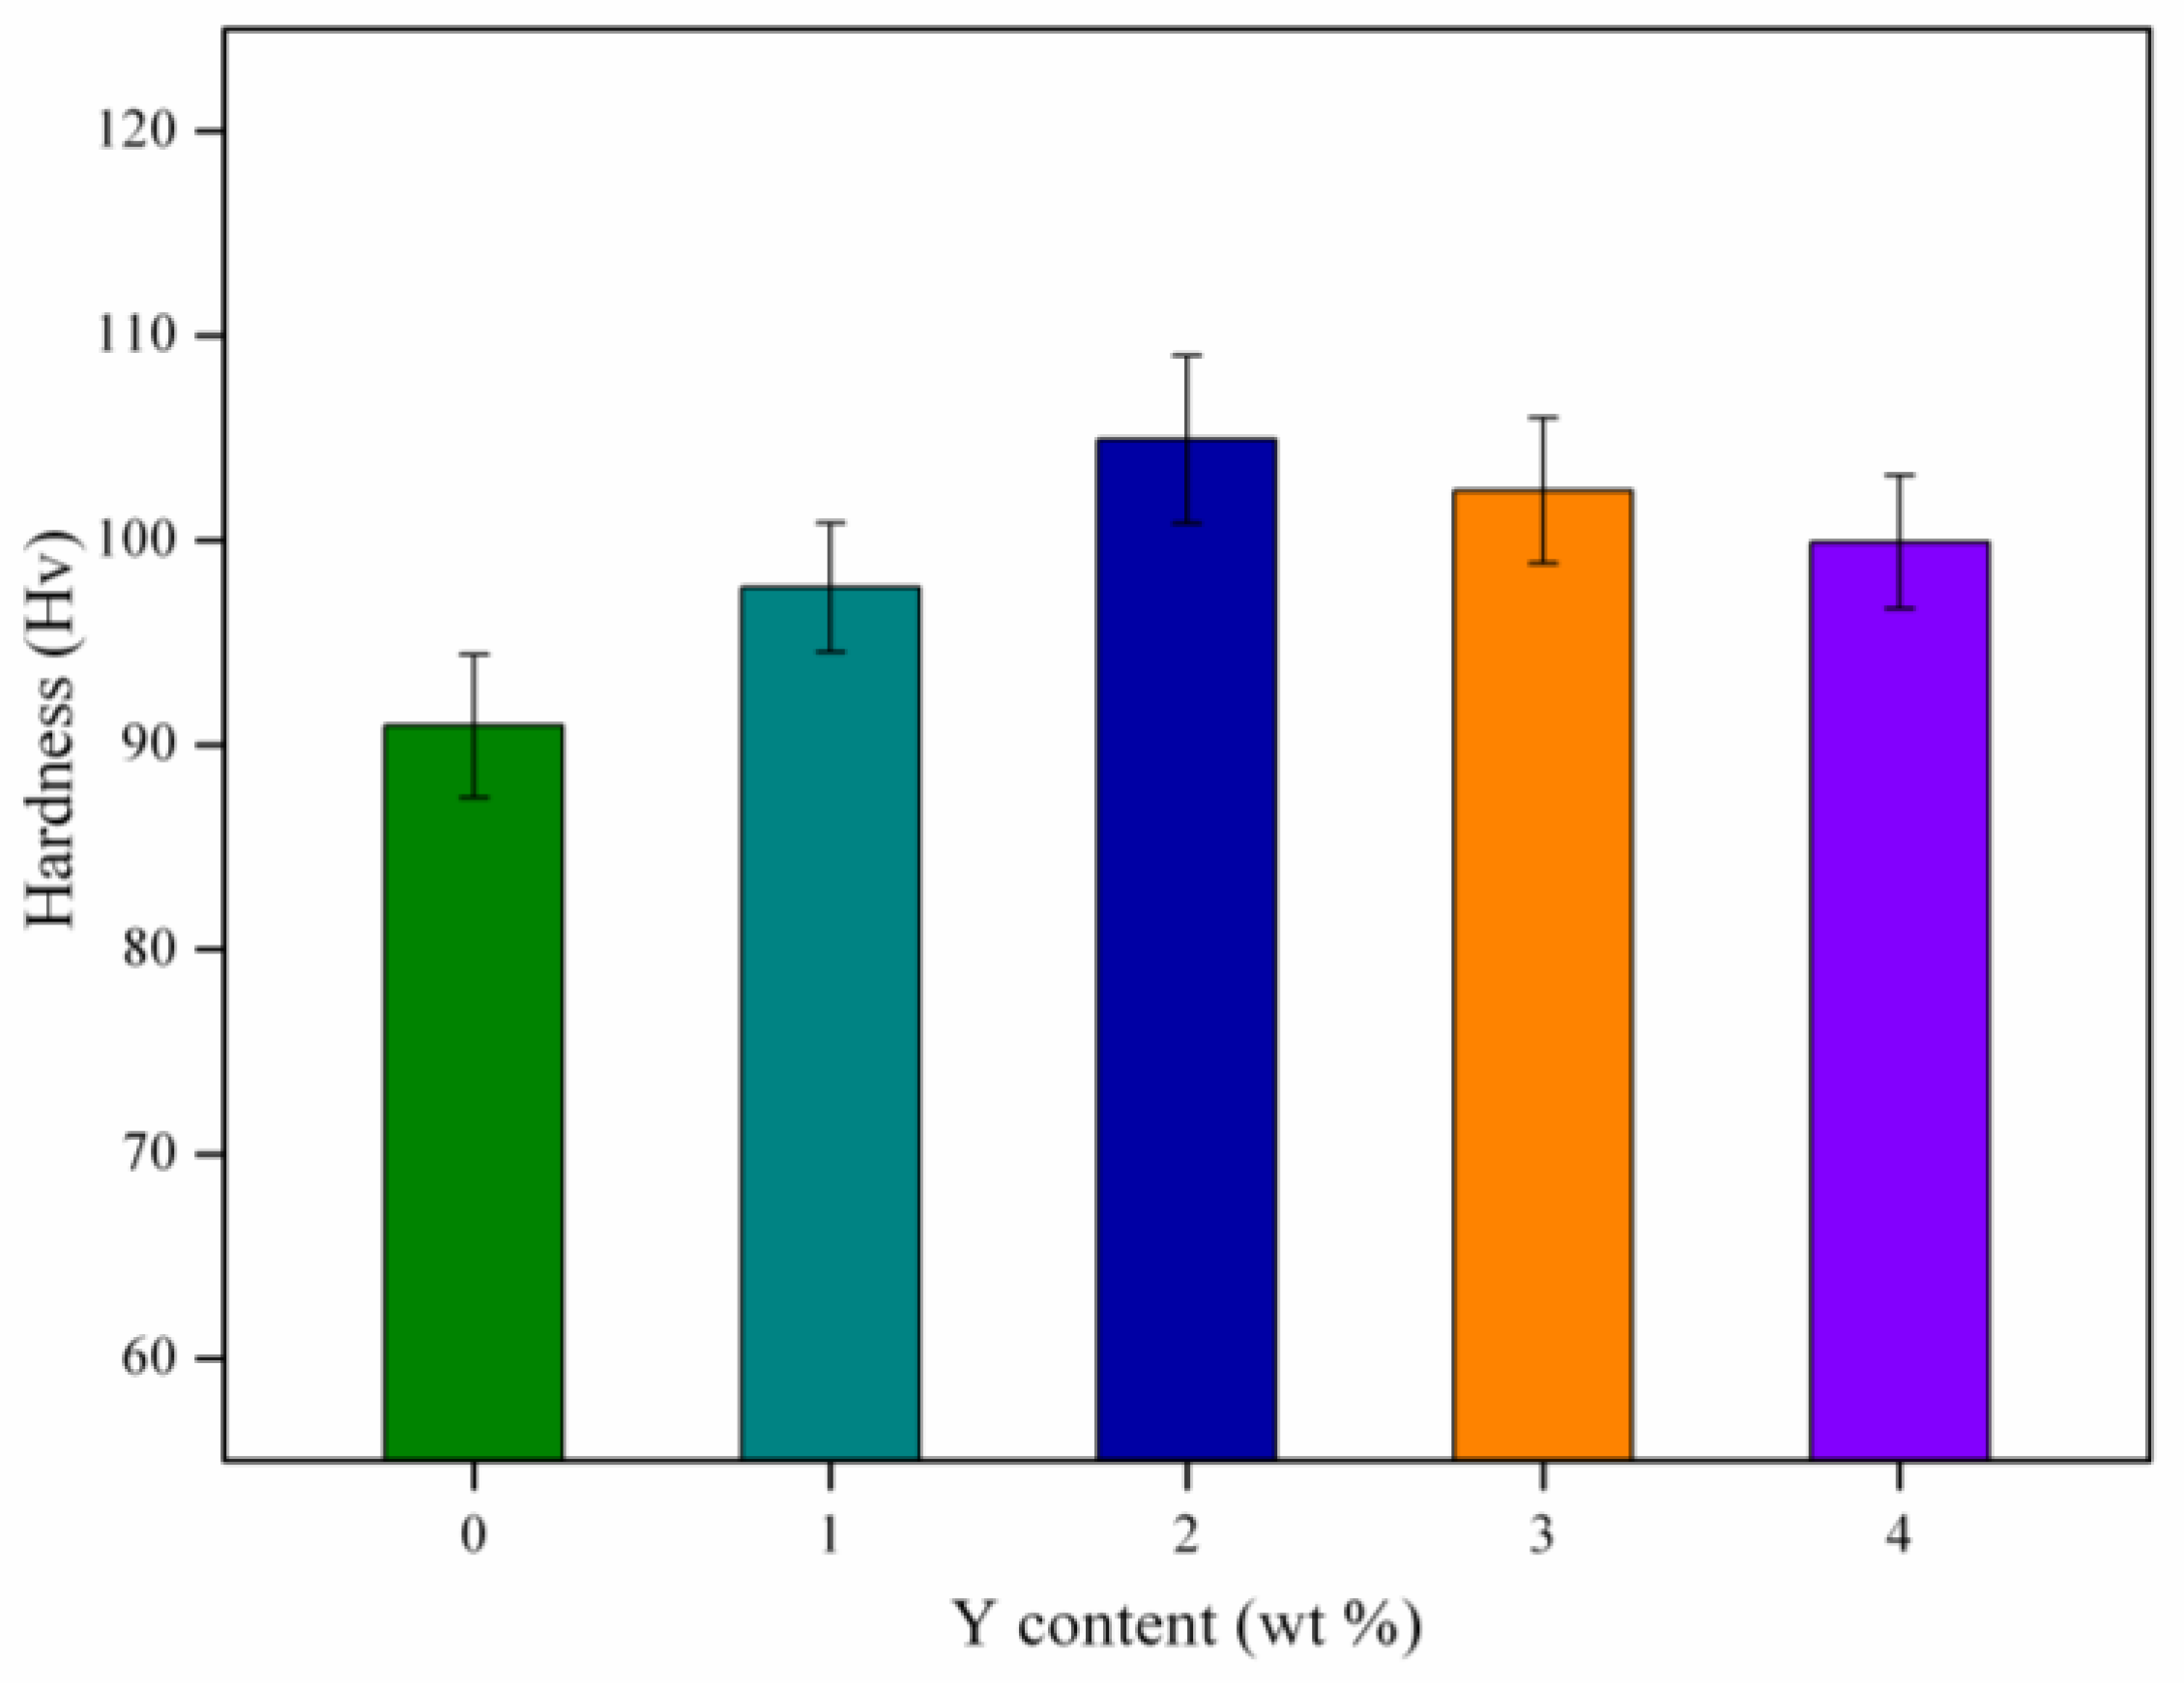
2.2. Hardness
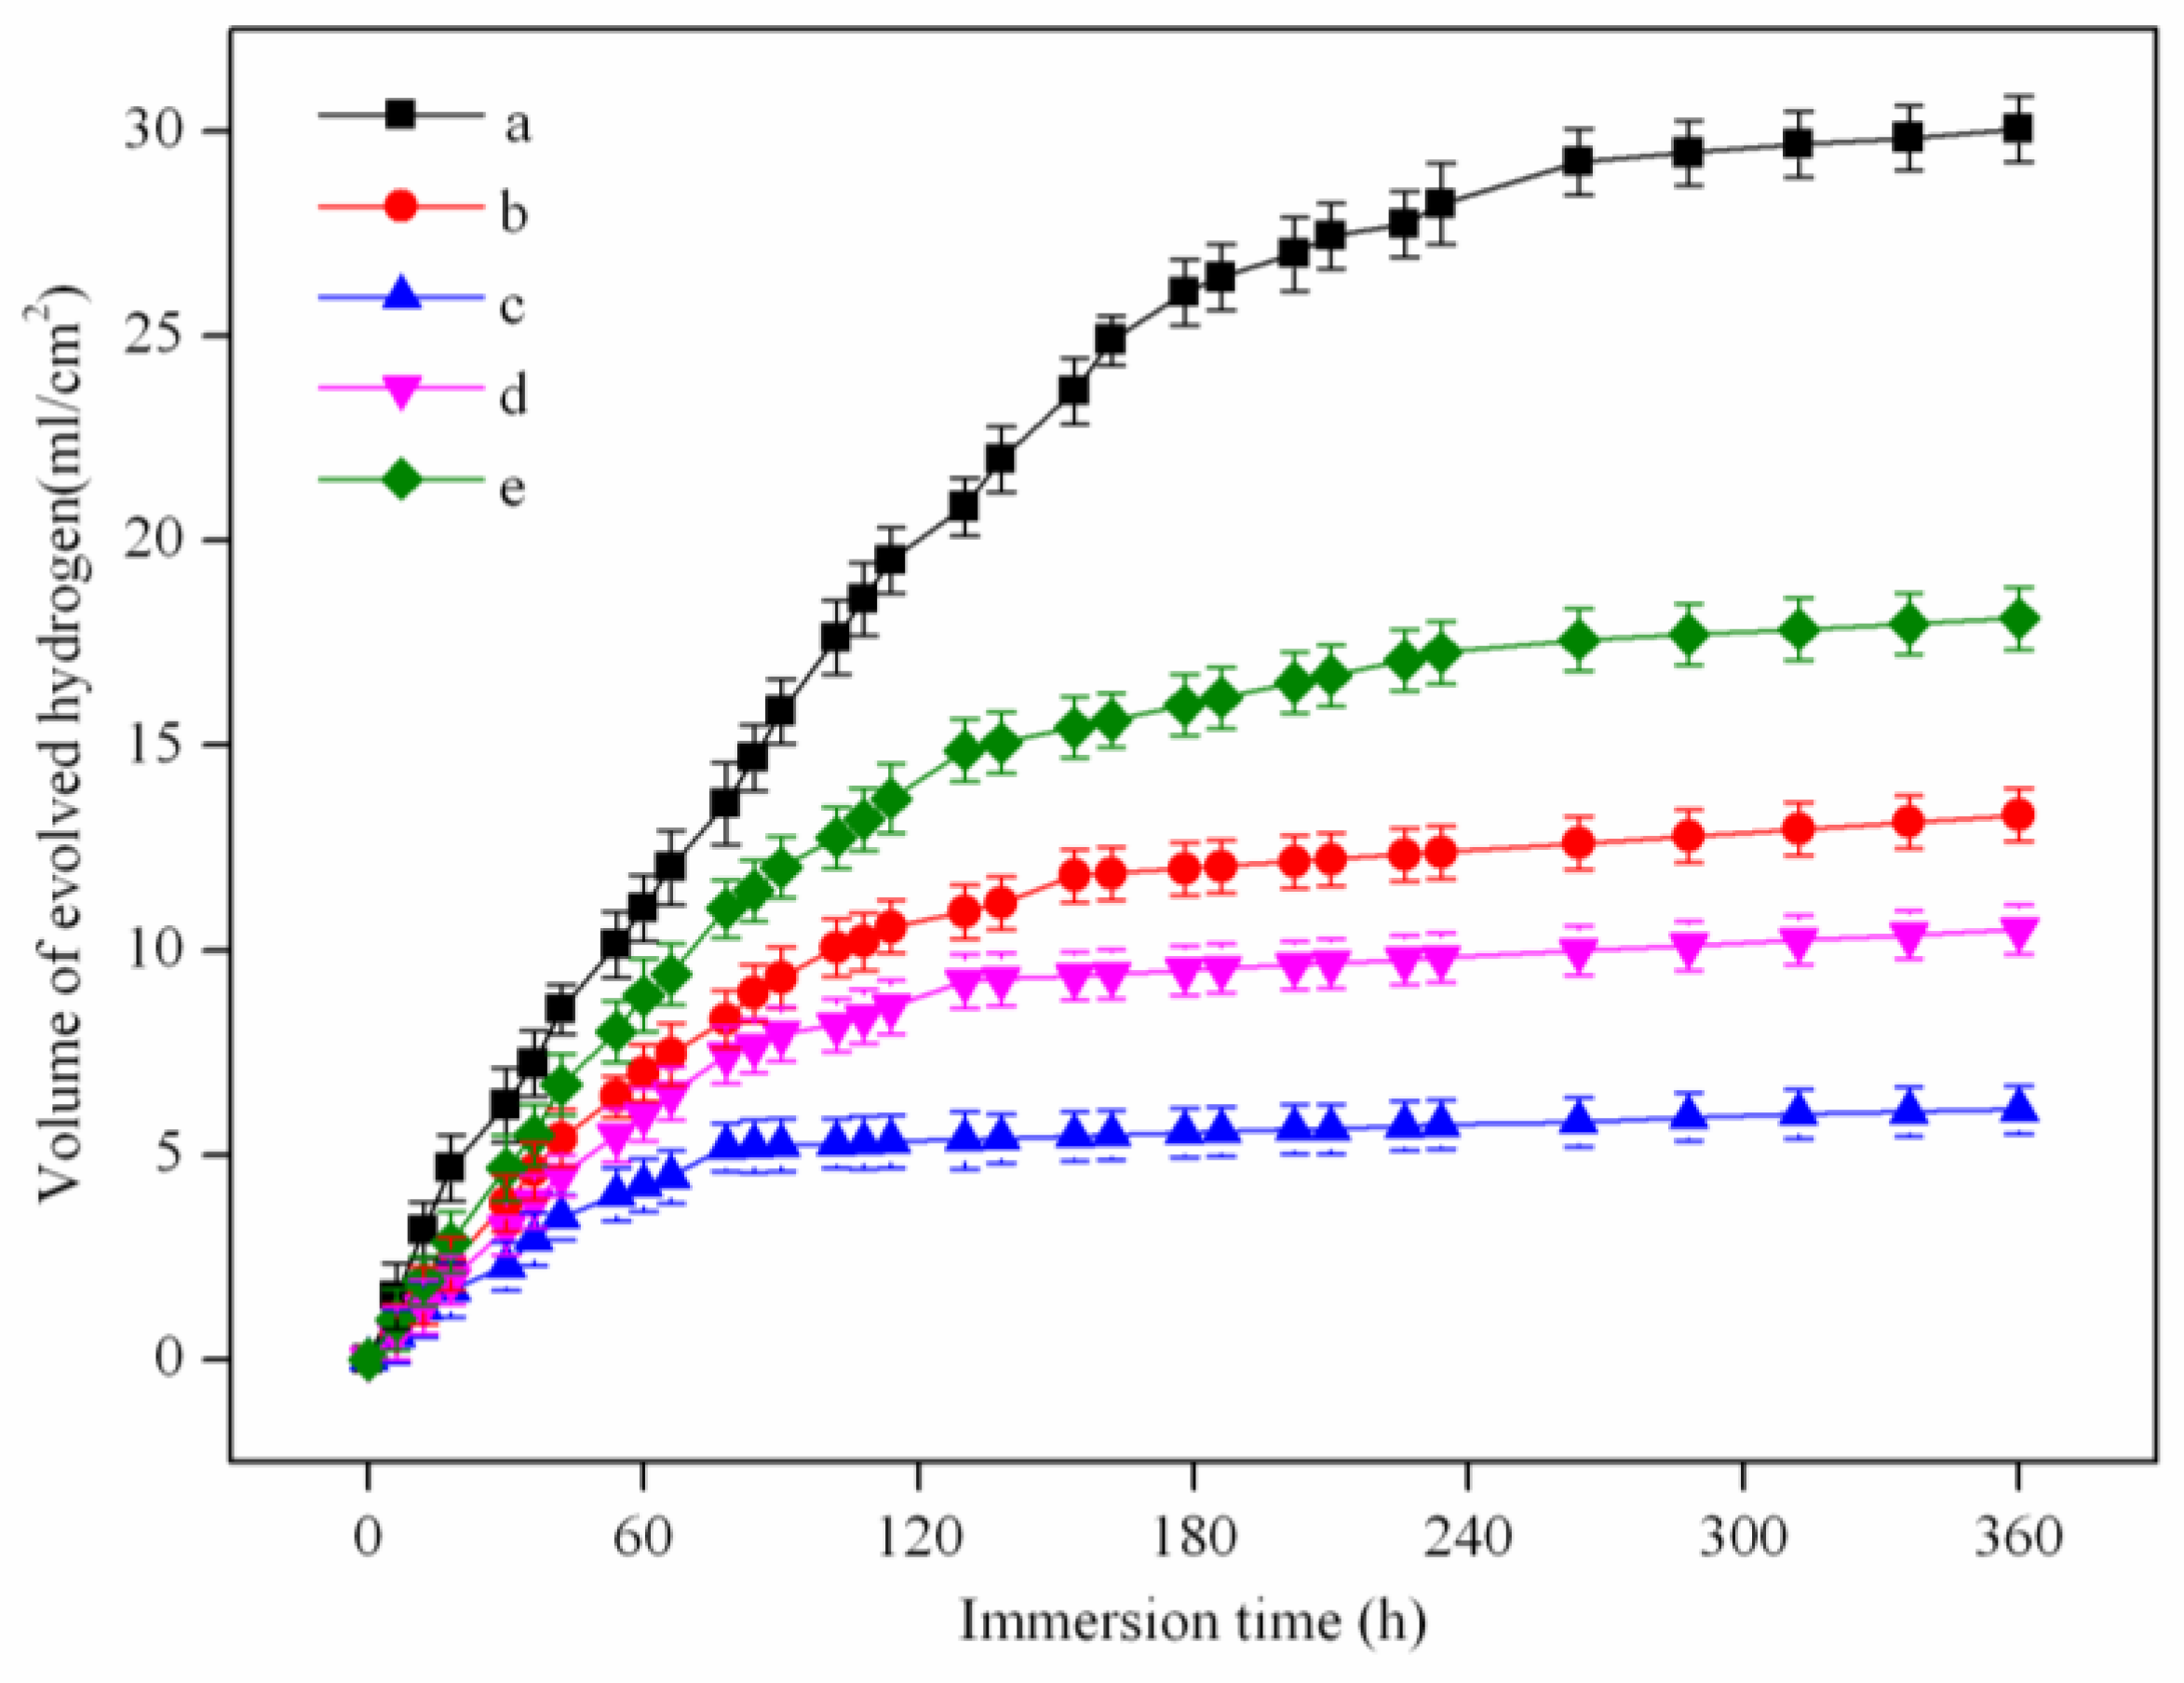
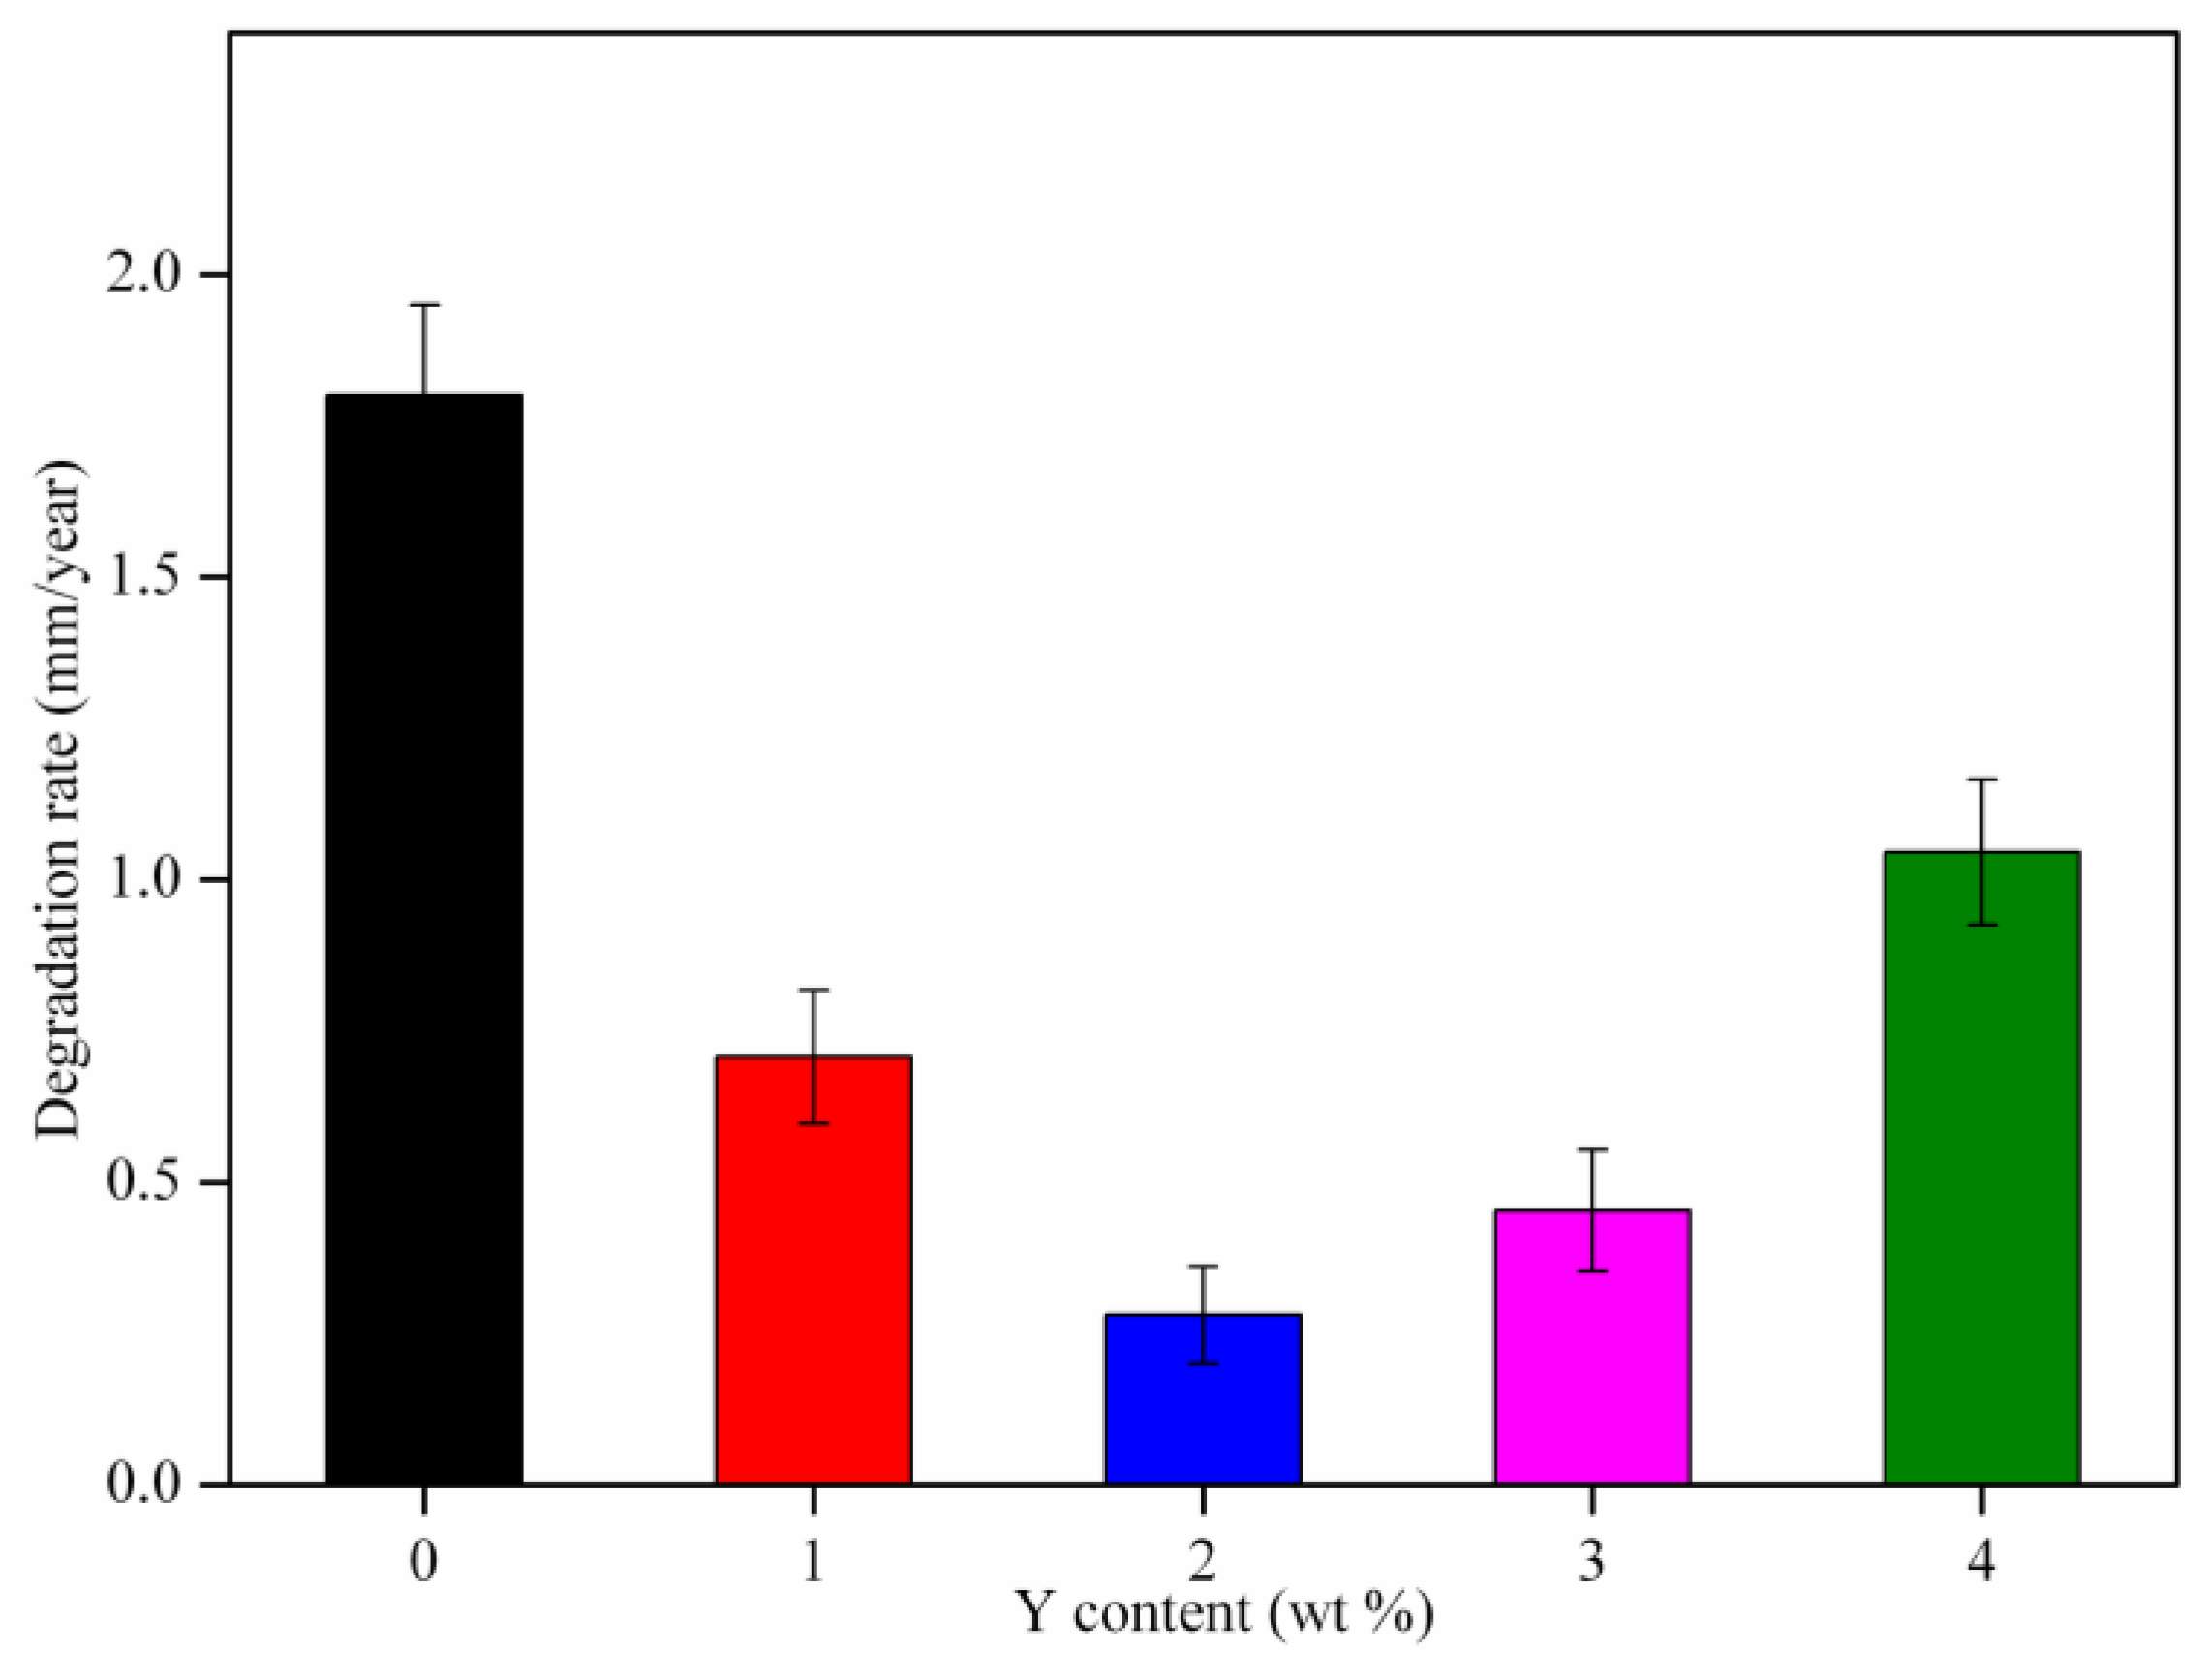
2.3. Degradation Properties
3. Experimental Procedure
3.1. Materials Preparation
3.2. Materials Characterization
3.3. Statistical Analysis
4. Conclusions
Acknowledgments
Author Contributions
Conflicts of Interest
References
- Doležal, P.; Zapletal, J.; Fintová, S.; Trojanová, Z.; Greger, M.; Roupcová, P.; Podrábský, T. Influence of processing techniques on microstructure and mechanical properties of a biodegradable Mg-3Zn-2Ca alloy. Materials 2016, 9, 880–894. [Google Scholar] [CrossRef]
- Razavi, M.; Fathi, M.H.; Meratian, M. Fabrication and characterization of magnesium-fluorapatite nanocomposite for biomedical applications. Mater. Charact. 2010, 61, 1363–1370. [Google Scholar] [CrossRef]
- Shuai, C.; Yang, Y.; Wu, P.; Lin, X.; Liu, Y.; Zhou, Y.; Feng, P.; Liu, X.; Peng, S. Laser rapid solidification improves corrosion behavior of Mg-Zn-Zr alloy. J. Alloy. Compd. 2017, 691, 961–969. [Google Scholar] [CrossRef]
- Tkacz, J.; Minda, J.; Fintová, S.; Wasserbauer, J. Comparison of electrochemical methods for the evaluation of cast AZ91 magnesium alloy. Materials 2016, 9, 925–938. [Google Scholar] [CrossRef]
- Anawati, A.; Asoh, H.; Ono, S. Effects of alloying element Ca on the corrosion behavior and bioactivity of anodic films formed on AM60 Mg alloys. Materials 2016, 10, 11–26. [Google Scholar] [CrossRef]
- Nidadavolu, E.; Feyerabend, F.; Ebel, T.; Willumeitrömer, R.; Dahms, M. On the determination of magnesium degradation rates under physiological conditions. Materials 2016, 9, 627–636. [Google Scholar] [CrossRef]
- Niknejad, S.; Liu, L.; Lee, M.Y.; Esmaeili, S.; Zhou, N.Y. Resistance spot welding of AZ series magnesium alloys: Effects of aluminum content on microstructure and mechanical properties. Mat. Sci. Eng. A 2014, 618, 323–334. [Google Scholar] [CrossRef]
- Guo, J.; Zhou, Y.; Liu, C.; Wu, Q.; Chen, X.; Lu, J. Wire Arc Additive manufacturing of AZ31 magnesium alloy: grain refinement by adjusting pulse frequency. Materials 2016, 9, 823–835. [Google Scholar] [CrossRef]
- Song, W.; Martin, H.J.; Hicks, A.; Seely, D.; Walton, C.A.; Ii, W.B.L.; Wang, P.T.; Horstemeyer, M.F. Corrosion behaviour of extruded AM30 magnesium alloy under salt-spray and immersion environments. Corros. Sci. 2014, 78, 353–368. [Google Scholar] [CrossRef]
- Jain, V.; Mishra, R.S. Superplastic behavior and microstructural stability of friction stir processed AZ91C alloy. J. Mater. Sci. 2013, 48, 2635–2646. [Google Scholar] [CrossRef]
- Yu, W.; Zhao, H.; Ding, Z.; Zhang, Z.; Sun, B.; Shen, J.; Chen, S.; Zhang, B.; Yang, K.; Liu, M. In vitro and in vivo evaluation of MgF2 coated AZ31 magnesium alloy porous scaffolds for bone regeneration. Coll. Surf. B: Biointerfaces 2017, 149, 330–340. [Google Scholar] [CrossRef] [PubMed]
- Sun, W.; Zhang, G.; Tan, L.; Yang, K.; Ai, H. The fluoride coated AZ31B magnesium alloy improves corrosion resistance and stimulates bone formation in rabbit model. Mat. Sci. Eng. C 2016, 63, 506–511. [Google Scholar] [CrossRef] [PubMed]
- Abidin, N.I.Z.; Martin, D.; Atrens, A. Corrosion of high purity Mg, AZ91, ZE41 and Mg2Zn0.2Mn in Hank’s solution at room temperature. Corros. Sci. 2011, 53, 862–872. [Google Scholar] [CrossRef]
- Cao, G.; Zhang, D.; Zhang, W.; Zhang, W. In vitro corrosion study of friction stir processed WE43 magnesium alloy in a simulated body fluid. Materials 2016, 9, 542–556. [Google Scholar] [CrossRef]
- Stulikova, I.; Smola, B. Mechanical properties and phase composition of potential biodegradable Mg-Zn-Mn-base alloys with addition of rare earth elements. Mater. Charact. 2010, 61, 952–958. [Google Scholar] [CrossRef]
- Levy, G.; Aghion, E. Effect of diffusion coating of Nd on the corrosion resistance of biodegradable Mg implants in simulated physiological electrolyte. Acta Biomater. 2013, 9, 8624–8630. [Google Scholar] [CrossRef] [PubMed]
- Srinivasan, A.; Huang, Y.; Mendis, C.L.; Blawert, C.; Kainer, K.U.; Hort, N. Investigations on microstructures, mechanical and corrosion properties of Mg-Gd-Zn alloys. Mat. Sci. Eng. A 2014, 595, 224–234. [Google Scholar] [CrossRef]
- He, W.; Zhang, E.; Yang, K. Effect of Y on the bio-corrosion behavior of extruded Mg-Zn-Mn alloy in Hank’s solution. Mat. Sci. Eng. C 2010, 30, 167–174. [Google Scholar] [CrossRef]
- Zhang, J.; Leng, Z.; Zhang, M.; Meng, J.; Wu, R. Effect of Ce on microstructure, mechanical properties and corrosion behavior of high-pressure die-cast Mg-4Al-based alloy. J. Alloy. Compd. 2011, 509, 1069–1078. [Google Scholar] [CrossRef]
- Liu, W.; Cao, F.; Chang, L.; Zhang, Z.; Zhang, J. Effect of rare earth element Ce and La on corrosion behavior of AM60 magnesium alloy. Corros. Sci. 2009, 51, 1334–1343. [Google Scholar] [CrossRef]
- Peng, Q.; Meng, J.; Li, Y.; Huang, Y.; Hort, N. Effect of yttrium addition on lattice parameter, Young’s modulus and vacancy of magnesium. Mat. Sci. Eng. A 2011, 528, 2106–2109. [Google Scholar] [CrossRef]
- Xin, Y.; Hu, T.; Chu, P.K. In vitro studies of biomedical magnesium alloys in a simulated physiological environment: a review. Acta Biomater. 2011, 7, 1452–1459. [Google Scholar] [CrossRef] [PubMed]
- Liu, M.; Schmutz, P.; Uggowitzer, P.J.; Song, G.; Atrens, A. The influence of yttrium (Y) on the corrosion of Mg-Y binary alloys. Corros. Sci. 2010, 52, 3687–3701. [Google Scholar] [CrossRef]
- Vlček, M.; Lukáč, F.; Kudrnová, H.; Smola, B.; Stulíková, I.; Luczak, M.; Szakács, G.; Hort, N.; Willumeit-Römer, R. Microhardness and in vitro corrosion of heat-treated Mg–Y–Ag biodegradable alloy. Materials 2017, 10, 55–66. [Google Scholar] [CrossRef]
- Qi, F.; Zhang, D.; Zhang, X.; Pan, F. Effect of Y addition on microstructure and mechanical properties of Mg-Zn-Mn alloy. Trans. Nonferr. Metal. Soc. China 2014, 24, 1352–1364. [Google Scholar] [CrossRef]
- Luo, T.; Yang, Y. Corrosion properties and corrosion evolution of as-cast AZ91 alloy with rare earth yttrium. Mater. Des. 2011, 32, 5043–5048. [Google Scholar] [CrossRef]
- Xie, D.; Zhao, J.; Qi, Y.; Yue, L.; Shen, L.; Xiao, M. Decreasing pores in a laser cladding layer with pulsed current. Chin. Opt. Lett. 2013, 11, 54–57. [Google Scholar]
- Wei, K.; Gao, M.; Wang, Z.; Zeng, X. Effect of energy input on formability, microstructure and mechanical properties of selective laser melted AZ91D magnesium alloy. Mater. Sci. Eng. A 2014, 611, 212–222. [Google Scholar] [CrossRef]
- Zhao, J.; Zhang, J.; Liu, W.; Wu, G.; Zhang, L. Effect of Y content on microstructure and mechanical properties of as-cast Mg-8Li-3Al-2Zn alloy with duplex structure. Mat. Sci. Eng. A 2016, 650, 240–247. [Google Scholar] [CrossRef]
- Dai, J.; Zhu, S.; Easton, M.A.; Zhang, M.; Qiu, D.; Wu, G.; Liu, W.; Ding, W. Heat treatment, microstructure and mechanical properties of a Mg-Gd-Y alloy grain-refined by Al additions. Mat. Sci. Eng. A 2013, 576, 298–305. [Google Scholar] [CrossRef]
- Wang, C.; Yu, Z.; Cui, Y.; Zhang, Y.; Yu, S.; Qu, G.; Gong, H. Processing of a novel Zn alloy micro-tube for biodegradable vascular stent application. J. Mater. Sci. Technol. 2016, 32, 925–929. [Google Scholar] [CrossRef]
- Zhou, W.; Shen, T.; Aung, N.N. Effect of heat treatment on corrosion behaviour of magnesium alloy AZ91D in simulated body fluid. Corros. Sci. 2010, 52, 1035–1041. [Google Scholar] [CrossRef]
- Zhang, J.; Wang, J.; Qiu, X.; Zhang, D.; Zheng, T.; Niu, X.; Tang, D.; Meng, J. Effect of Nd on the microstructure, mechanical properties and corrosion behavior of die-cast Mg-4Al-based alloy. J. Alloy. Compd. 2008, 509, 1069–1078. [Google Scholar] [CrossRef]
- Yang, Y.; Wu, P.; Lin, X.; Liu, Y.; Bian, H.; Zhou, Y.; Gao, C.; Shuai, C. System development, formability quality and microstructure evolution of selective laser-melted magnesium. Virtual Phys. Prototyp. 2016, 11, 1–9. [Google Scholar] [CrossRef]
- Gao, C.; Wei, P.; Feng, P.; Xiao, T.; Shuai, C.; Peng, S. Nano SiO2 and MgO improve the properties of porous β-TCP scaffolds via advanced manufacturing technology. Int. J. Mol. Sci. 2015, 16, 6818–6830. [Google Scholar] [CrossRef] [PubMed]
- Kokubo, T.; Takadama, H. How useful is SBF in predicting in vivo bone bioactivity? Biomaterials 2006, 27, 2907–2915. [Google Scholar] [CrossRef] [PubMed]

© 2017 by the authors. Licensee MDPI, Basel, Switzerland. This article is an open access article distributed under the terms and conditions of the Creative Commons Attribution (CC BY) license (http://creativecommons.org/licenses/by/4.0/).
Share and Cite
Liu, L.; Yuan, F.; Zhao, M.; Gao, C.; Feng, P.; Yang, Y.; Yang, S.; Shuai, C. Rare Earth Element Yttrium Modified Mg-Al-Zn Alloy: Microstructure, Degradation Properties and Hardness. Materials 2017, 10, 477. https://doi.org/10.3390/ma10050477
Liu L, Yuan F, Zhao M, Gao C, Feng P, Yang Y, Yang S, Shuai C. Rare Earth Element Yttrium Modified Mg-Al-Zn Alloy: Microstructure, Degradation Properties and Hardness. Materials. 2017; 10(5):477. https://doi.org/10.3390/ma10050477
Chicago/Turabian StyleLiu, Long, Fulai Yuan, Mingchun Zhao, Chengde Gao, Pei Feng, Youwen Yang, Sheng Yang, and Cijun Shuai. 2017. "Rare Earth Element Yttrium Modified Mg-Al-Zn Alloy: Microstructure, Degradation Properties and Hardness" Materials 10, no. 5: 477. https://doi.org/10.3390/ma10050477