Improved Photo-Ignition of Carbon Nanotubes/Ferrocene Using a Lipophilic Porphyrin under White Power LED Irradiation

 and
and
Abstract
:1. Introduction
2. Materials and Methods
2.1. Sample Preparation
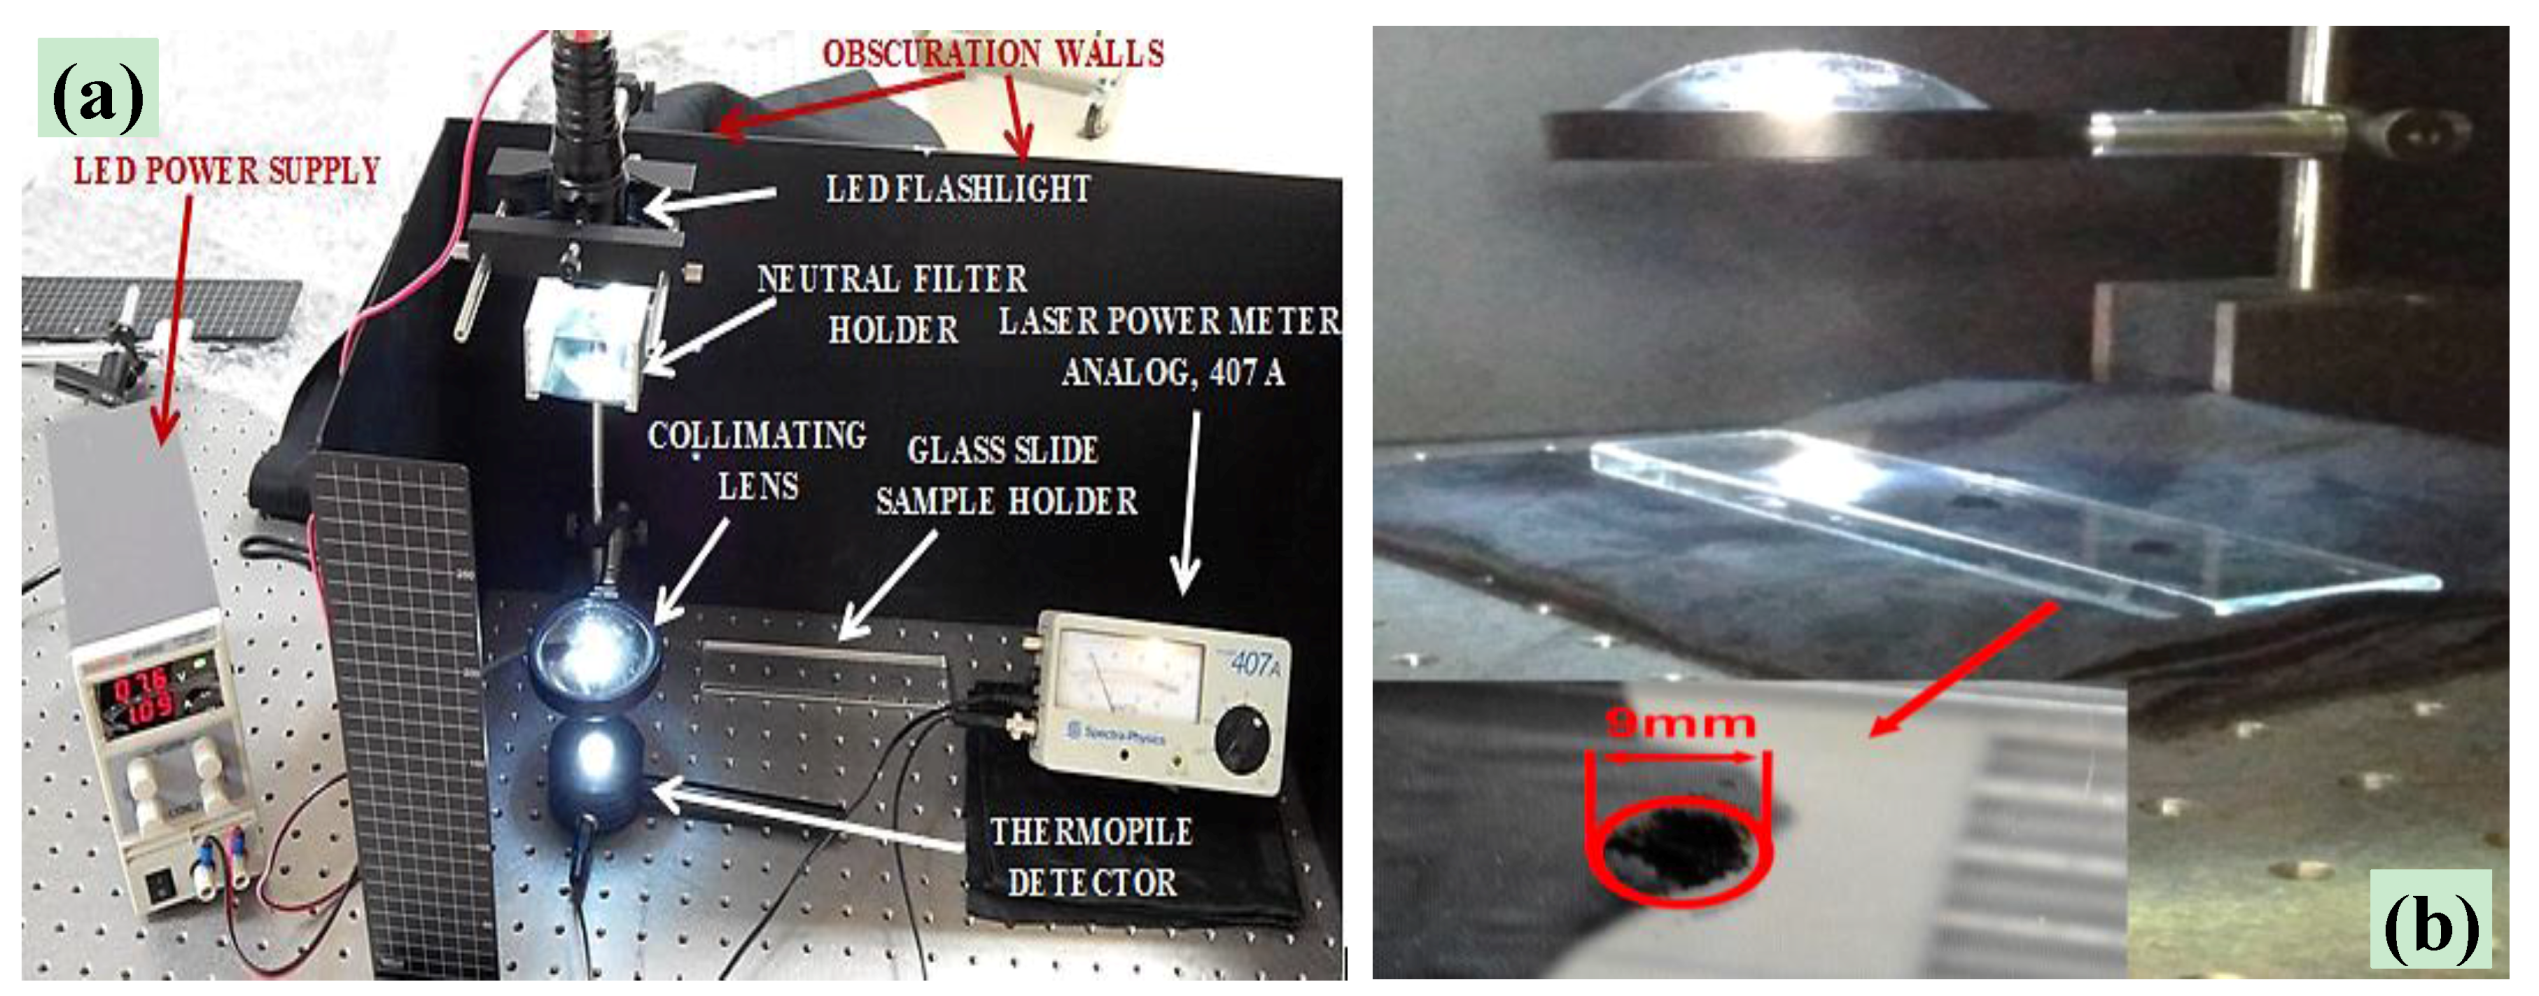
2.1.1. Experimental Setup for Ignition Tests Using Continuous-Emission LED
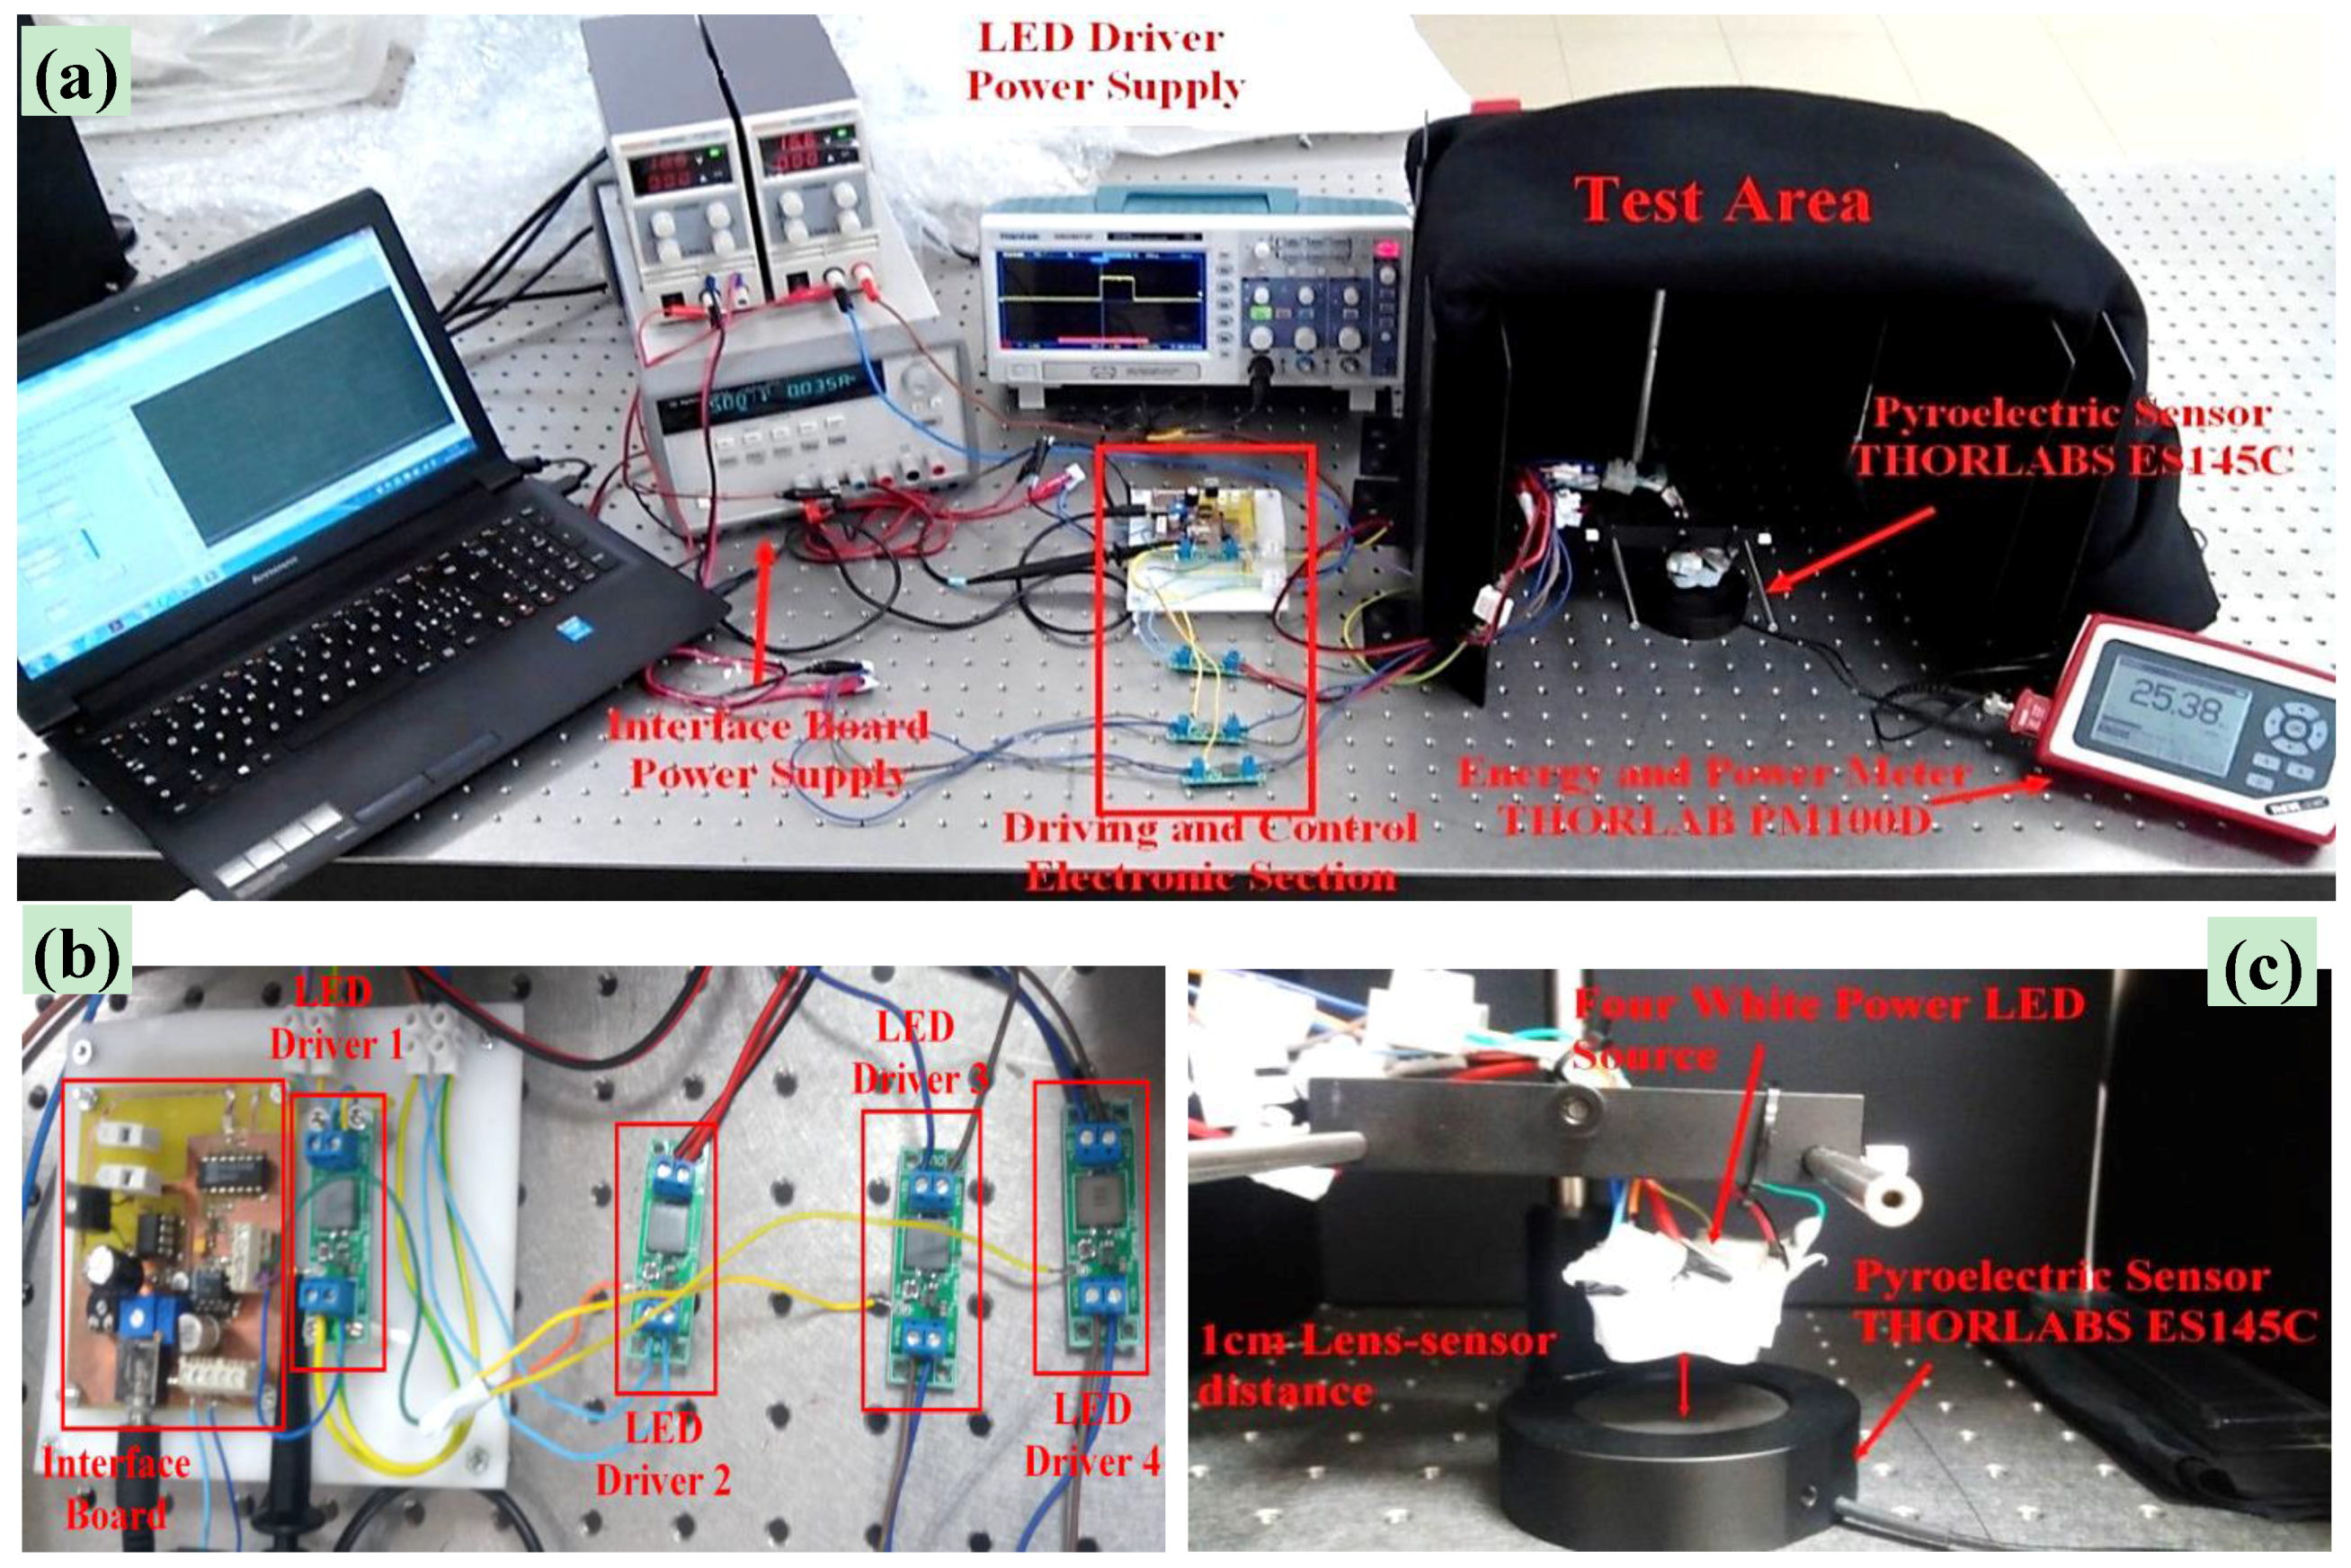
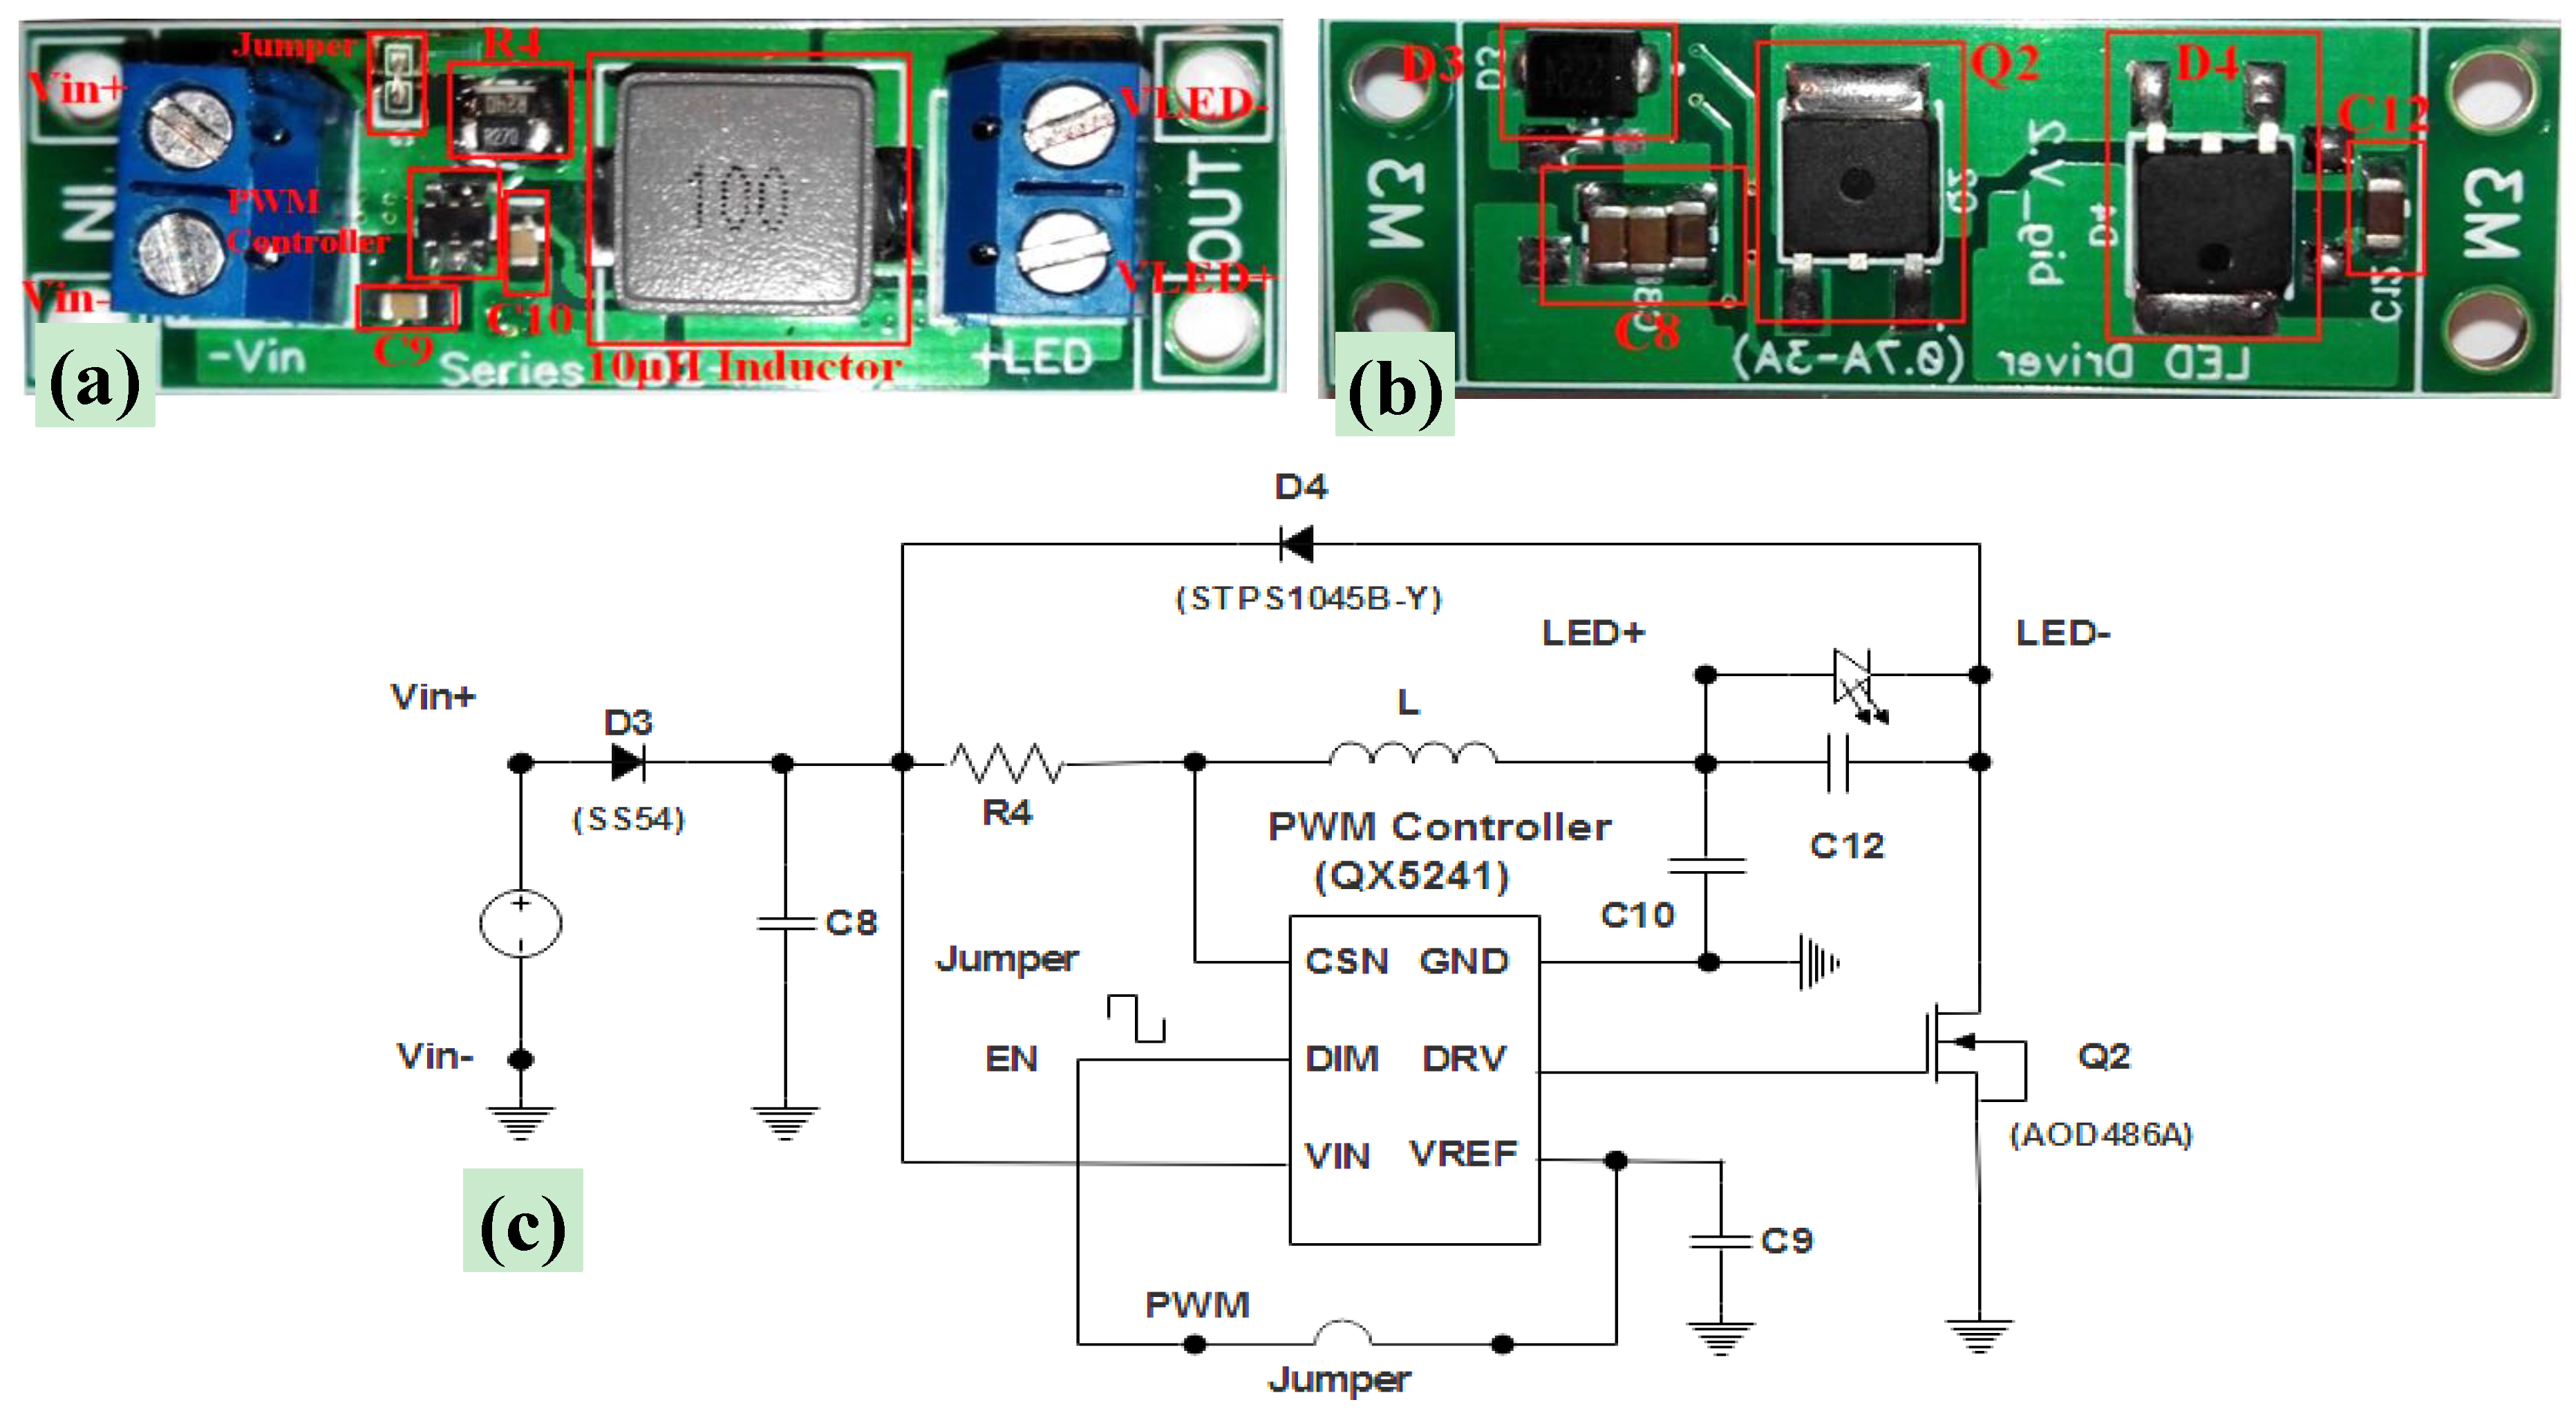
2.1.2. Experimental Setup for Photo-Ignition Tests Using a Pulsed LED Source
3. Results
3.1. Results of Ignition Tests Using the Continuous-Emission LED Source
3.2. Results of Ignition Tests of IG-MWCNTs/FeCp2 Using Pulsed LED Source
4. Discussion
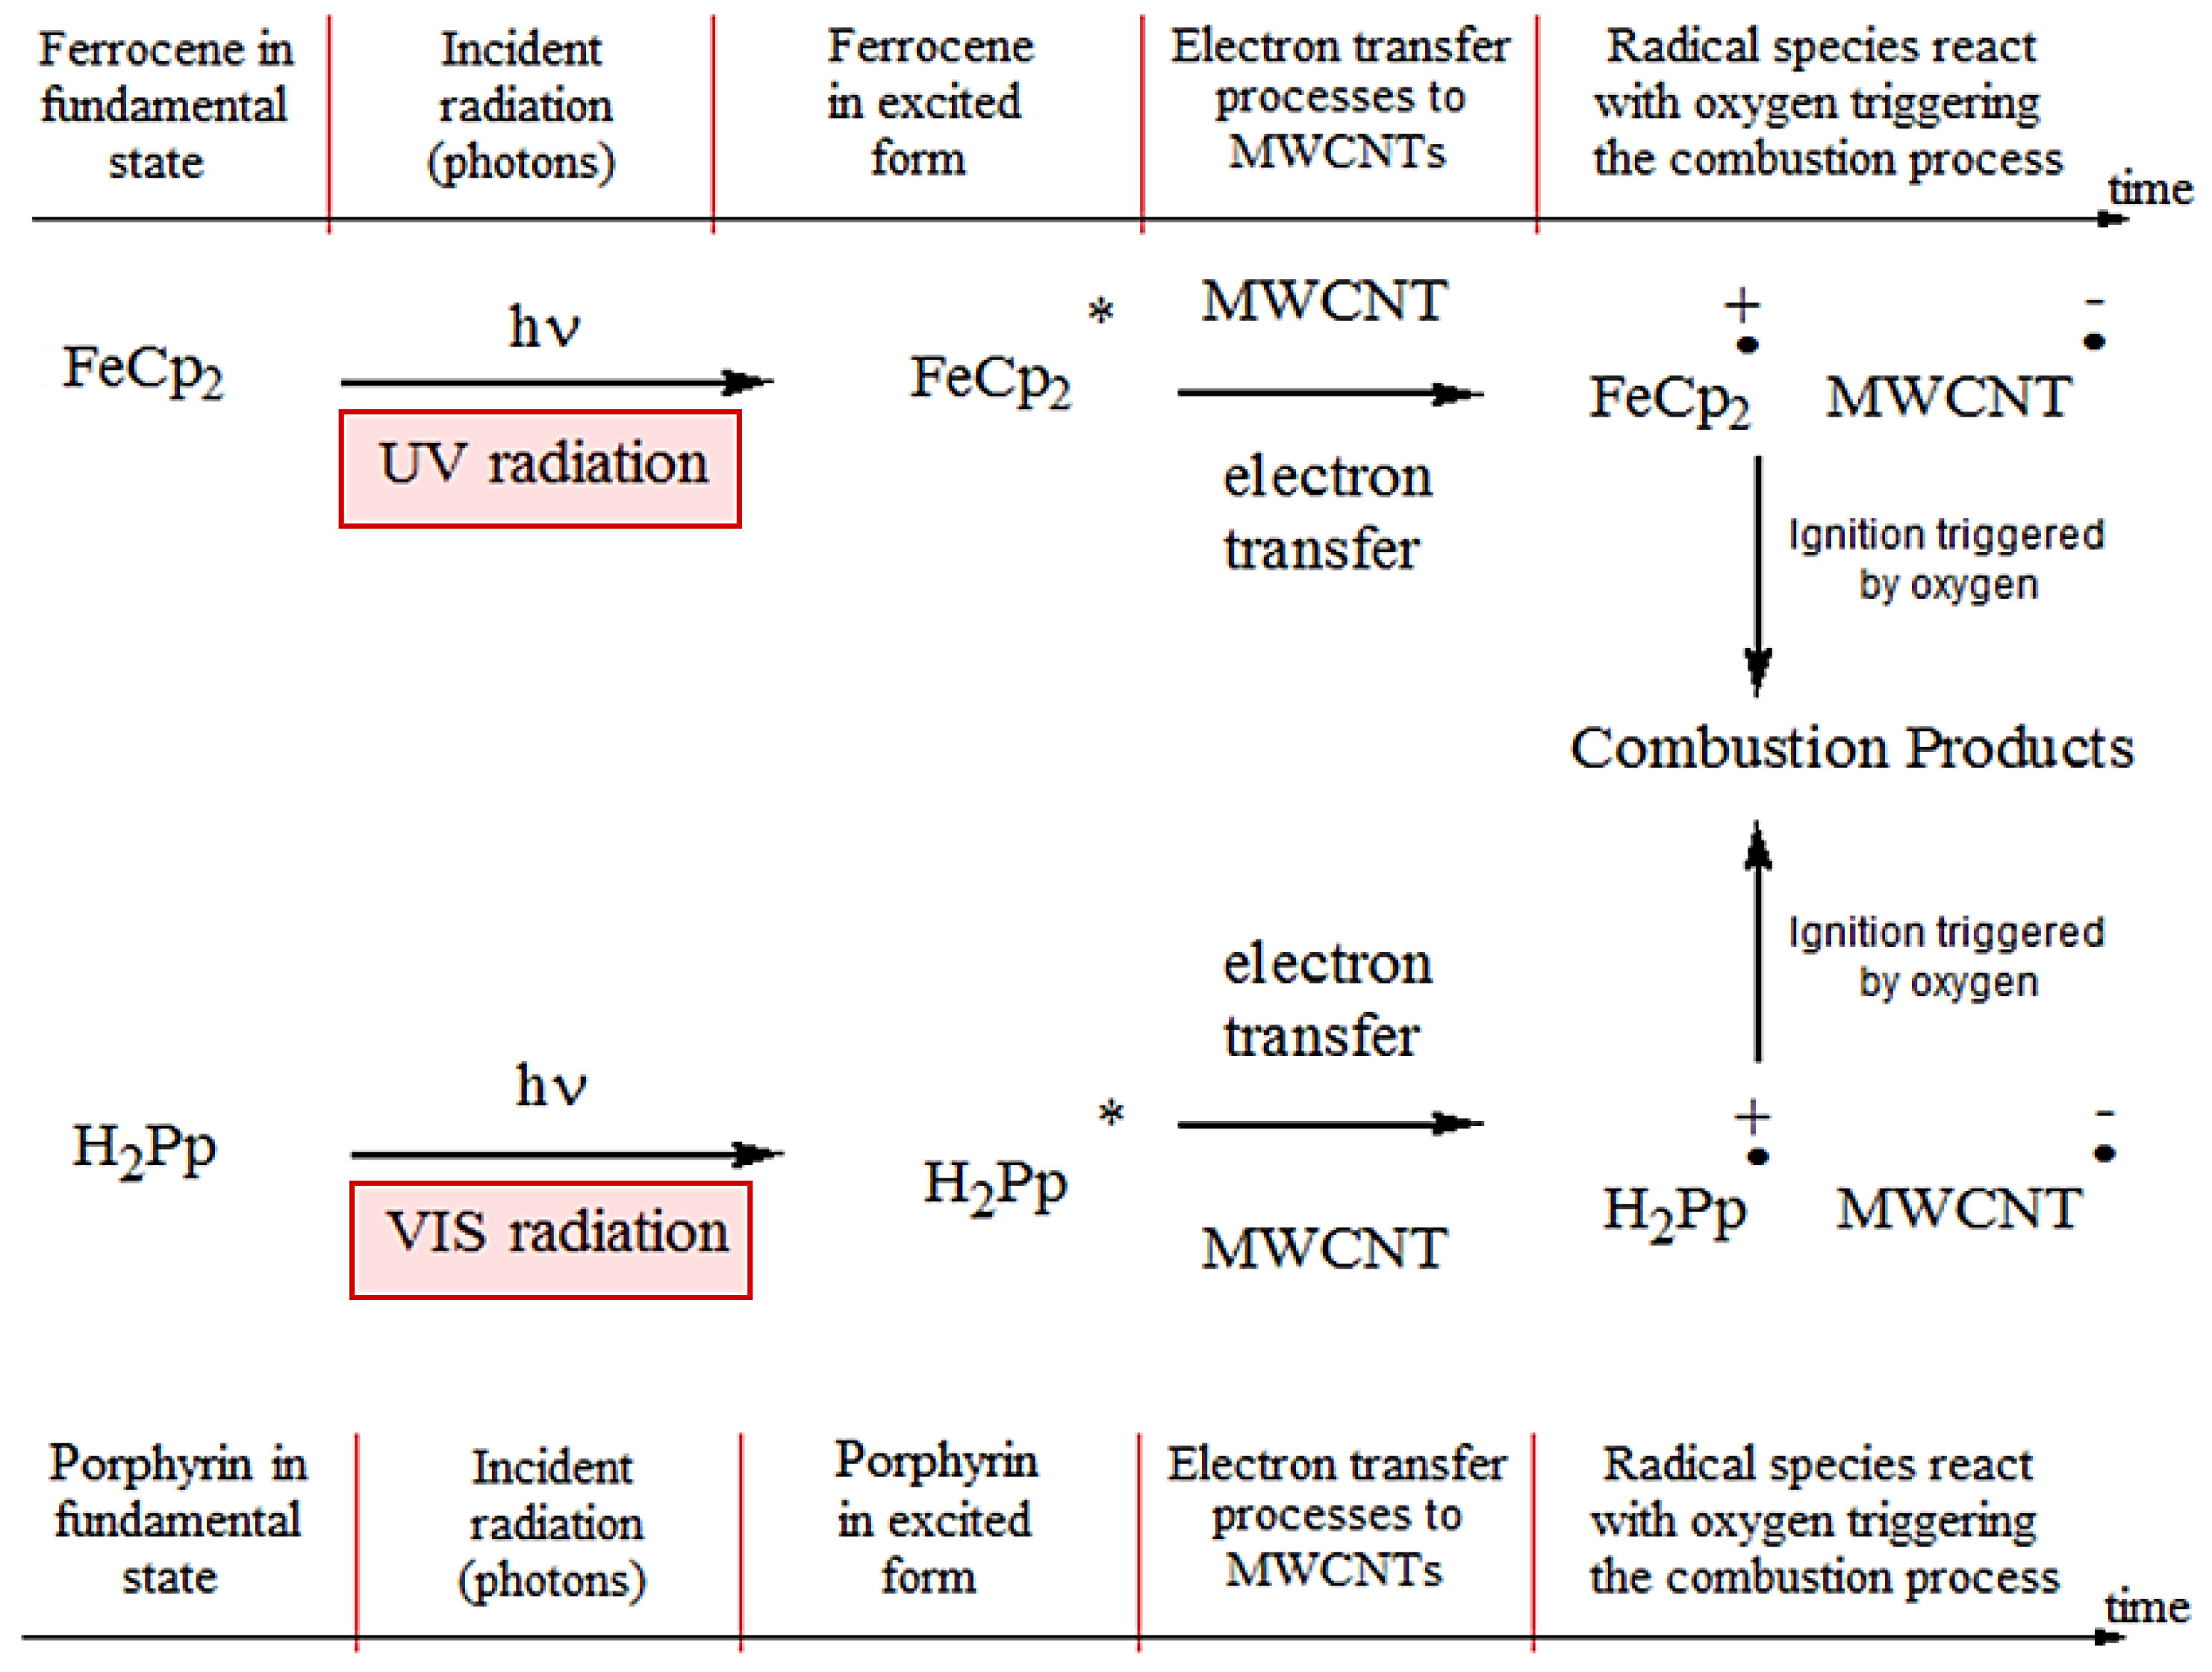
4.1. Photo-Ignition Mechanism of IG-MWCNTs/FeCp2 Samples Enriched with Porphyrin
4.2. Sample Preparation of MWCNTs/FeCp2 Mixture Enriched with Porphyrin
4.3. Ignition Tests of IG-MWCNTs/FeCp2 Mixtures Enriched with Porphyrin
5. Conclusions
Author Contributions
Conflicts of Interest
References
- Ajayan, P.M.; Terrone, M.; de la Guardia, A. Nanotubes in a Flash-Ignition and Reconstruction. Science 2002, 296, 705. [Google Scholar] [CrossRef] [PubMed]
- Ajayan, P.M.; Ganapathiraman, R.; de la Guardia, A. Method of Transforming Carbon Nanotubes. U.S. Patent 7,217,404, 15 May 2007. [Google Scholar]
- Smits, J.; Wincheski, B.; Namkung, M.; Crooks, R.; Louie, R. Response of Fe powder, purified and as-produced HiPco single-walled carbon nanotubes to flash exposure. Mater. Sci. Eng. A 2003, 358, 384–389. [Google Scholar] [CrossRef]
- Kumar, M.; Rawat, N.; Santhanam, K.S.V. Effect of nanostructure on the thermal oxidation of atomized iron. Rochester Inst. Technol. 2006. RIT Scholar Works. Available online: http://scholarworks.rit.edu/other/599 (accessed on February 2014). [CrossRef]
- Sysoev, N.N.; Osipov, A.I.; Uvarov, A.V.; Kosichkin, O.A. Flash ignition of a carbon nanotube. Moscow Univ. Phys. Bull. 2011, 66, 492–494. [Google Scholar] [CrossRef]
- Visconti, P.; Primiceri, P.; Longo, D.; Strafella, L.; Carlucci, P.; Lomascolo, M.; Cretì, A.; Mele, G. Photo-ignition process of multiwall carbon nanotubes and ferrocene by continuous wave Xe lamp illumination. Beilstein J. Nanotechol. 2017, 8, 134–144. [Google Scholar] [CrossRef] [PubMed]
- Braidy, N.; Botton, G.A.; Adronov, A. Oxidation of Fe Nanoparticles Embedded in Single-Walled Carbon Nanotubes by Exposure to a Bright Flash of White Light. Nano Lett. 2002, 2, 1277–1280. [Google Scholar] [CrossRef]
- Tseng, S.; Tai, N.; Hsu, W.; Chen, L.; Wang, J.; Chiu, C. Ignition of carbon nanotubes using a photoflash. Carbon 2007, 45, 958–964. [Google Scholar] [CrossRef]
- Ohkura, Y.; Rao, P.M.; Zheng, X. Flash ignition of Al nanoparticles: Mechanism and applications. Combust. Flame 2011, 158, 2544–2548. [Google Scholar]
- Chehroudi, B.; Badakhshan, A.; Danczyk, S.; Morgan, C. Ignition Characteristics of Single Walled Carbon Nanotubes (SWCNTs) Utilizing a Camera Flash for Distributed Ignition of Liquid Sprays. In Proceedings of the Joint Army-Navy-NASA-Air Force (JANNAF) Propulsion Meeting (JPM), Orlando, FL, USA, 8–12 December 2008. [Google Scholar]
- Chehroudi, B. Minimum ignition energy of the light-activated ignition of single-walled carbon nanotubes (SWCNTs). Combust. Flame 2012, 159, 753–756. [Google Scholar] [CrossRef]
- Chehroudi, B. Nanotechnology and Applied Combustion: Use of Nanostructured Materials for Light-Activated Distributed Ignition of Fuels with Propulsion Applications. Recent Pat. Space Technol. 2011, 1, 107–122. [Google Scholar] [CrossRef]
- Badakhshan, A.; Danczyk, S. Ignition of Nanoparticles by a Compact Camera Flash; Air Force Research Laboratory (AFMC): Arlington, VA, USA, 2014. [Google Scholar]
- Visconti, P.; Primiceri, P.; Tramis, R.; Longo, D.; Strafella, L.; Carlucci, A.P. Programmable driving boards of Xenon flash lamps for photo-Ignition process of Carbon Nanotubes added to Air/Methane fuel mixture. In Proceedings of the IEEE 16th International Conference on Bioinformatics and Bioengineering (BIBE), Florence, Italy, 31 October–2 November 2016; pp. 1–6. [Google Scholar]
- Primiceri, P.; Visconti, P.; Longo, D.; Tramis, R.; Carlucci, A.P. Design and testing of user-configurable driving boards of pulsed Xenon lamps with adjustable flash duration and brightness for Carbon-Nanotubes photo-induced ignition. J. Eng. Appl. Sci. 2016, 11, 12336–12342. [Google Scholar]
- Carlucci, A.P.; Visconti, P.; Primiceri, P.; Strafella, L.; Ficarella, A.; Laforgia, D. Photo-Induced Ignition of Different Gaseous Fuels Using Carbon Nanotubes Mixed with Metal Nanoparticles as Ignitor Agents. Combust. Sci. Technol. 2016, 189, 937–953. [Google Scholar] [CrossRef]
- Visconti, P.; Primiceri, P.; Strafella, L.; Lay-Ekuakille, A.; Carlucci, A.P. Photo-Induced combustion of Gaseous Fuels using Carbon Nanotubes as Ignitor Agents: Driving and measuring systems, Characterizations. In Proceedings of the IEEE International Instrumentation and Measurement Technology Conference (I2MTC), Torino, Italy, 22–25 May 2017; pp. 1–5. [Google Scholar]
- Carlucci, A.P.; Ciccarella, G.; Strafella, L. Multiwalled Carbon Nanotubes (MWCNTs) as Ignition Agents for Air/Methane Mixtures. IEEE Trans. Nanotechnol. 2016, 15, 699–704. [Google Scholar] [CrossRef]
- Carlucci, A.P.; Strafella, L. Air-methane Mixture Ignition with Multi-Walled Carbon NanoTubes (MWCNTs) and Comparison with Spark Ignition. Energy Procedia 2015, 82, 915–920. [Google Scholar] [CrossRef]
- Danczyk, S.A.; Chehroudi, B. An Innovative Ignition Method Using SWCNTs and a Camera Flash; Air Force Research Laboratory (AFMC): Arlington, VA, USA, 2005. [Google Scholar]
- Chehroudi, B.; Vaghjiani, G.L.; Ketsdever, A.D. Method for Distributed Ignition of Fuels by Light Sources. U.S. Patent 7, 517,215, 14 April 2009. [Google Scholar]
- Finigan, D.J.; Dohm, B.D.; Mockelman, J.A.; Oehlschlaeger, M.A. Deflagration-to-detonation transition via the distributed photo ignition of carbon nanotubes suspended in fuel/oxidizer mixtures. Combust. Flame 2012, 159, 1314–1320. [Google Scholar] [CrossRef]
- Chehroudi, B. Activation and Control of Autoignition in HCCI Engines Using Volumetrically-Distributed Ignition of As-Produced Single-Walled Carbon Nanotubes. In Proceedings of the SAE 2012 International Powertrains, Fuels and Lubricants Meeting, Malmo, Sweden, 18–20 September 2012. [Google Scholar]
- Berkowitz, A.M.; Oehlschlaeger, M.A. The photo-induced ignition of quiescent ethylene/air mixtures containing suspended carbon nanotubes. Proc. Combus. Inst. 2011, 33, 3359–3366. [Google Scholar] [CrossRef]
- Mele, G.; Del Sole, R.; Vasapollo, G.; Marc, G.; Garcıa-Lopez, E.; Palmisano, L.; Coronado, J.M.; Hernandez-Alonso, M.D.; Malitesta, C.; Guascito, M.R. TRMC, XPS, and EPR Characterizations of Polycrystalline TiO2 Porphyrin Impregnated Powders and Their Catalytic Activity for 4-Nitrophenol Photodegradation in Aqueous Suspension. J. Phys. Chem. B 2005, 109, 12347–12352. [Google Scholar] [CrossRef] [PubMed]
- Guldi, D.M.; Taieb, H.; Rahman, G.M.A.; Tagmatarchis, N.; Prato, M. Novel Photoactive Single-Walled Carbon Nanotube–Porphyrin Polymer Wraps: Efficient and Long-Lived Intracomplex Charge Separation. Adv. Mater 2005, 17, 871–875. [Google Scholar] [CrossRef]
- Attanasi, O.A.; Del Sole, R.; Filippone, P.; Mazzetto, S.E.; Mele, G.; Vasapollo, G. Synthesis of novel lipophilic porphyrin-cardanol derivatives. J. Porphyr. Phthalocyanines 2004, 8, 1276–1284. [Google Scholar] [CrossRef]
- Soliman, E.; Kandil, U.; Reda Taha, M. Improved Strength and Toughness of Carbon Woven Fabric Composites with Functionalized MWCNTs. Materials 2014, 7, 4640–4657. [Google Scholar] [CrossRef] [PubMed]
- Hanelt, S.; Friedrich, J.F.; Meyer-Plath, A. UV Spectrometric Indirect Analysis of Brominated MWCNTs with UV Active Thiols and an Alkene-Reaction Kinetics, Quantification and Differentiation of Adsorbed Bromine and Oxygen. Materials 2013, 6, 3035–3063. [Google Scholar] [CrossRef] [PubMed]
- Meng, L.; Fu, C.; Lu, Q. Advanced technology for functionalization of carbon nanotubes. Prog. Nat. Sci. 2009, 19, 801–810. [Google Scholar] [CrossRef]
- Hirsch, A. Functionalization of Single-Walled Carbon Nanotubes. Angew. Chem. Int. Ed. 2002, 41, 1853–1859. [Google Scholar] [CrossRef]
- Rahman, G.M.A.; Guldi, D.M.; Campidelli, S.; Prato, M.J. Electronically interacting single wall carbon nanotube-porphyrin nanohybrids. Mater. Chem. 2006, 16, 62–65. [Google Scholar] [CrossRef]
- Zhong, Q.; Diev, V.V.; Roberts, S.T.; Antunez, P.D.; Brutchey, R.L.; Bradforth, S.E.; Thompson, M.E. Fused Porphyrin-Single-Walled Carbon Nanotube Hybrids: Efficient Formation and Photophysical Characterization. ACS Nano 2013, 7, 3466–3475. [Google Scholar] [CrossRef] [PubMed]
- Oliver, I.T.; Rawlinson, W.A. The absorption spectra of porphyrin a and derivatives. Biochem. J. 1955, 61, 641–646. [Google Scholar] [CrossRef] [PubMed]
- Kadish, K.M.; Smith, K.M.; Guilard, R. Intramolecular Photoinduced Electronic-Transfer Reactions of Porphyrins. In The Porphyrin Handbook: Electronic Transfer; Kadish, K., Guilard, R., Smith, K.M., Eds.; Elsevier Inc.: Amsterdam, The Netherlands, 2003; Volume 8, pp. 115–185. [Google Scholar]
- Mele, G.; Del Sole, R.; Vasapollo, G.; Lopez, E.G.; Palmisano, L.; Mazzetto, S.E.; Attanasi, O.A.; Filippone, P. Polycrystalline TiO2 impregnated with cardanol-based porphyrins for the photocatalytic degradation of 4-nitrophenol. Green Chem. 2004, 6, 604–608. [Google Scholar] [CrossRef]
- Mele, G.; Vasapollo, G. Fine Chemicals and New Hybrid Materials from Cardanol. Mini Rev. Org. Chem. 2008, 5, 243–253. [Google Scholar] [CrossRef]
- Attanasi, O.A.; Del Sole, R.; Filippone, P.; Ianne, R.; Mazzetto, S.E.; Mele, G.; Vasapollo, G. Synthesis of Fullerene-Cardanol Derivatives. Synlett 2004, 5, 799–802. [Google Scholar]
- Mele, G.; Li, J.; Margapoti, E.; Martina, F.; Vasapollo, G. Synthesis of novel porphyrins cardanol based via cross metathesis. Catal. Today 2009, 140, 37–43. [Google Scholar] [CrossRef]
- Ribeiro, V.G.P.; Marcelo, A.M.P.; da Silva, K.T.; da Silva, F.L.F.; Mota, J.P.F.; do Nascimento, J.P.C.; Sombra, A.S.B.; da Silva Clemente, C.; Mele, G.; Carbone, L.; et al. New ZnO@Cardanol Porphyrin Composite Nanomaterials with Enhanced Photocatalytic Capability under Solar Light Irradiation. Materials 2017, 10, 1114. [Google Scholar] [CrossRef] [PubMed]
- Primiceri, P.; de Fazio, R.; Strafella, L.; Carlucci, P.; Visconti, P. Photo-induced ignition phenomenon of Carbon nanotubes by Xenon pulsed light: Ignition tests analysis, automotive and new potential applications, future developments. J. Appl. Res. Technol. 2017, 15, 609–623. [Google Scholar] [CrossRef]


| Weight Ratio of the Sample | Ferrocene Percentage by Weight | |
|---|---|---|
| MWCNTs | Ferrocene | |
| 5 | 1 | ≈16.7% |
| 4 | 1 | 20% |
| 3 | 1 | 25% |
| 2 | 1 | ≈33% |
| 1 | 1 | 50% |
| 1 | 2 | ≈67% |
| 1 | 3 | 75% |
| 1 | 4 | 80% |
| Weight Ratios | LED Source | XENON Lamp | Percentage Difference (%) | |||
|---|---|---|---|---|---|---|
| HPMWCNTs | Ferrocene | Luminous Power (Illumination Area 0.64 cm2) (mW) | Luminous Power Density (mW/cm2) | Luminous Power (Illum. Area 0.634cm2) (mW) | Luminous Power Density (mW/cm2) | |
| 4 | 1 | 260 (OD = 0.1 filter) | 406 | 435 | 684 | −41 |
| 3 | 1 | 240 1 (OD = 0.1 filter) | 375 | 360 | 566 | −34 |
| 2 | 1 | 210 (OD = 0.2 filter) | 328 | 290 | 456 | −28 |
| 1 | 1 | 210 (OD = 0.2 filter) | 328 | 275 | 432 | −24 |
| 1 | 2 | 210 (OD = 0.2 filter) | 328 | 250 | 393 | −17 |
| 1 | 3 | 170 (OD = 0.1 + 0.2 filters) | 266 | 240 | 377 | −30 |
| 1 | 4 | 180 (OD = 0.3 filter) | 281 | 270 | 425 | −33 |
| Weight Ratios | LED Source | XENON Lamp | Percentage Difference (%) | |||
|---|---|---|---|---|---|---|
| HPMWCNTs | Ferrocene | Luminous Power (Illumination Area 0.64 cm2) (mW) | Luminous Power Density (mW/cm2) | Luminous Power (Illum. Area 0.634 cm2) (mW) | Luminous Power Density (mW/cm2) | |
| 5 | 1 | 340 (without neutral filter) | 531 | - | - | - |
| 4 | 1 | 260 (OD = 0.1 filter) | 406 | 260 | 406 | 0 |
| 3 | 1 | 260 (OD = 0.1 filter) | 406 | 240 | 375 | +8 |
| 2 | 1 | 210 (OD = 0.1 filter) | 328 | 210 | 328 | 0 |
| 1 | 1 | 190 (OD = 0.2 filter) 1 | 297 | 210 | 328 | −10 |
| 1 | 2 | 190 (OD = 0.2, ∆t = 933 ms)1 | 297 | 210 | 328 | −10 |
| 1 | 3 | 190 (OD = 0.2, ∆t = 1.166 s) 1 | 297 | 170 | 266 | +10 |
| 1 | 4 | 190 (OD = 0.2, ∆t = 1.133 s) 1 | 297 | 180 | 281 | +5 |
| Weight Ratios | Energy (Illumination Area 0.64 cm2) (mJ) | Energy Density (mJ/cm2) | |
|---|---|---|---|
| IG-MWCNTs | Ferrocene | ||
| 5 | 1 | 260.4 | 406.9 |
| 4 | 1 | 192.4 | 300.7 |
| 3 | 1 | 181.2 | 283.1 |
| 2 | 1 | 170.0 | 265.6 |
| 1 | 1 | 215.2 | 336.3 |
| 1 | 2 | 249.2 | 389.4 |
| 1 | 3 | 283.2 | 442.5 |
| 1 | 4 | 351.2 | 548.8 |
| HPMWCNTs | Ferrocene | LED Source | XENON Lamp | Percentage Difference (%) | |
|---|---|---|---|---|---|
| Minimum Pulse Duration (ms) | Energy Density (mJ/cm2) | Energy Density (mJ/cm2) | |||
| 5 | 1 | 170 | 411.9 | - | - |
| 4 | 1 | 110 | 266.67 | 51.36 1–121.49 2 | +119 |
| 3 | 1 | 120 | 290.47 | 58.75 1–139.00 2 | +109 |
| 2 | 1 | 110 | 266.67 | 54.63 1–129.25 2 | +106 |
| 1 | 1 | 150 | 361.90 | 64.83 1–153.39 2 | +135 |
| 1 | 2 | 160 | 385.71 | 69.74 1–165.00 2 | +133% |
| 1 | 3 | 190 | 459.52 | 88.75 1– 209.99 2 | +119% |
| 1 | 3 | 240 | 554.76 | 87.96 1–208.11 2 | +166% |
| Measure Condition 1 | Absorption λmax/nm (Soret and Q Bands) 1 | Emission Spectrum Peaks |
|---|---|---|
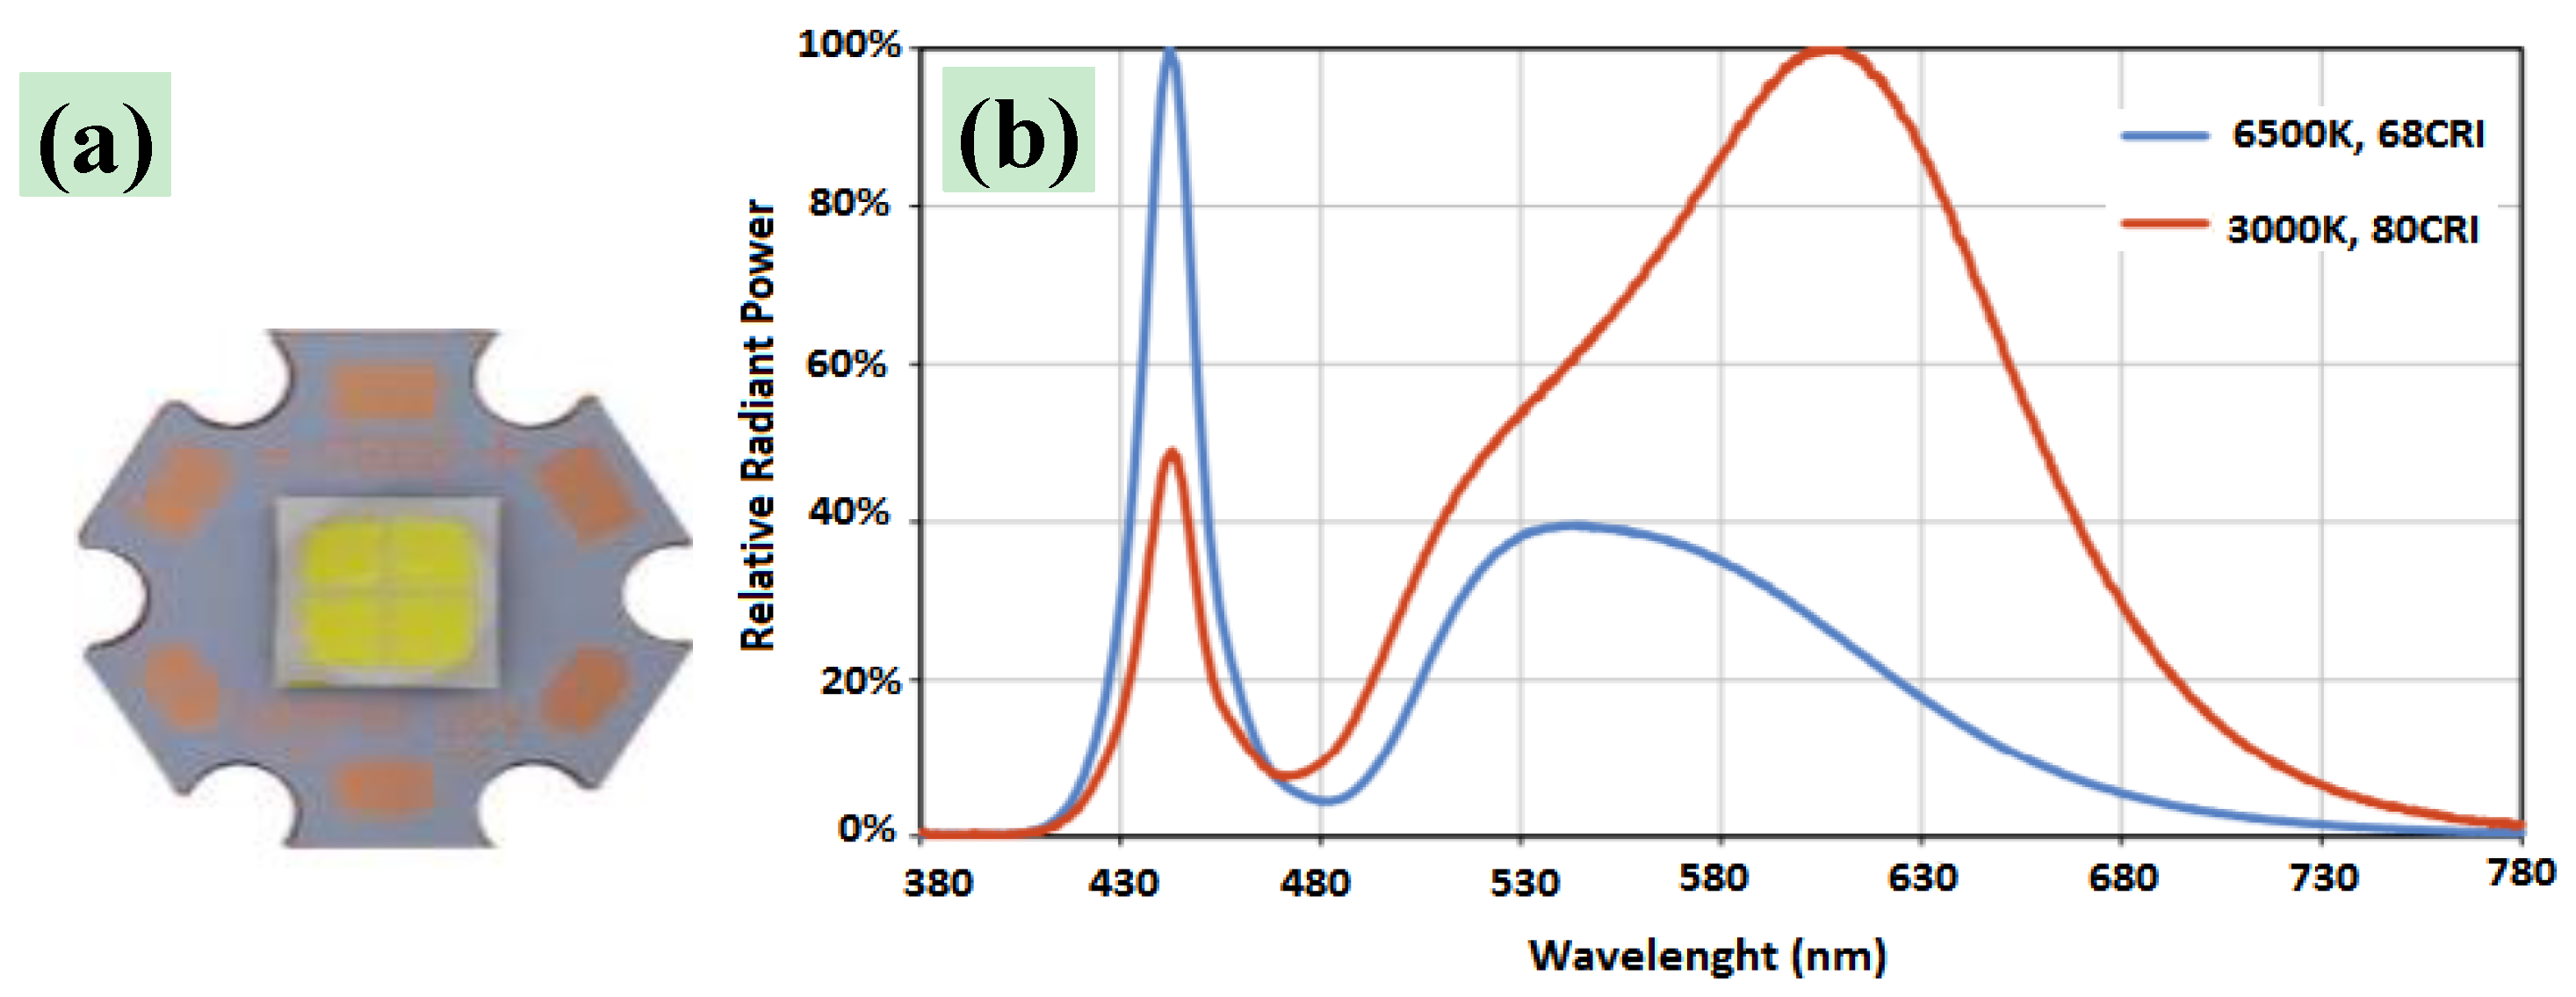
| H2Pp | CREE XHP70 LED | |
| Solution in CH2Cl2 | 421, 515, 555, 593, 649 | - |
| DRS in powder | 396, 519, 558, 596, 651 | 420–560 |
| DRS on semiconductor | 440, 523, 562, 609, 652 | - |
| Weight Ratio 1 | IG-MWCNTs (mg) | FeCp2 (mg) | Porphyrin | |
|---|---|---|---|---|
| (mg) | (%) | |||
| 5:1 | 16.67 | 3.33 | 3 | 13.0 |
| 4:1 | 16 | 4 | 3 | 13.0 |
| 3:1 | 15 | 5 | 3 | 13.0 |
| 2:1 | 13.33 | 6.67 | 3 | 13.0 |
| 1:1 | 10 | 10 | 3 | 13.0 |
| 1:2 | 6.67 | 13.33 | 3 | 13.0 |
| 1:3 | 5 | 15 | 3 | 13.0 |
| 1:4 | 4 | 16 | 3 | 13.0 |
| 2:1 | 13.33 | 6.67 | 8 | 28.6 |
| IGMWCNTs | FeCp2 | Without Porphyrin | With Porphyrin | Percentage Difference (%) |
|---|---|---|---|---|
| Energy (mJ/cm2) | Energy (mJ/cm2) | |||
| 5 | 1 | 406.9 | 351.8 | −13 |
| 4 | 1 | 338.4 | 270.5 | −20 |
| 3 | 1 | 297.8 | 189.3 | −36 |
| 2 | 1 | 284.1 | 152.9 | −46 |
| 1 | 1 | 306.1 | 262.5 | −14 |
| 1 | 2 | 382.5 | 356.1 | −7 |
| 1 | 3 | 436.4 | 346.8 | −20 |
| 1 | 4 | 546.6 | 481.0 | −12 |
© 2018 by the authors. Licensee MDPI, Basel, Switzerland. This article is an open access article distributed under the terms and conditions of the Creative Commons Attribution (CC BY) license (http://creativecommons.org/licenses/by/4.0/).
Share and Cite
Visconti, P.; Primiceri, P.; De Fazio, R.; De Fazio, R.; Mazzetto, S.E.; Mele, G.; Carlucci, A.P. Improved Photo-Ignition of Carbon Nanotubes/Ferrocene Using a Lipophilic Porphyrin under White Power LED Irradiation. Materials 2018, 11, 127. https://doi.org/10.3390/ma11010127
Visconti P, Primiceri P, De Fazio R, De Fazio R, Mazzetto SE, Mele G, Carlucci AP. Improved Photo-Ignition of Carbon Nanotubes/Ferrocene Using a Lipophilic Porphyrin under White Power LED Irradiation. Materials. 2018; 11(1):127. https://doi.org/10.3390/ma11010127
Chicago/Turabian StyleVisconti, Paolo, Patrizio Primiceri, Roberto De Fazio, Roberto De Fazio, Selma Elaine Mazzetto, Giuseppe Mele, and Antonio Paolo Carlucci. 2018. "Improved Photo-Ignition of Carbon Nanotubes/Ferrocene Using a Lipophilic Porphyrin under White Power LED Irradiation" Materials 11, no. 1: 127. https://doi.org/10.3390/ma11010127