Boosted Visible-Light Photodegradation of Methylene Blue by V and Co Co-Doped TiO2
by
 ,
,
Tianping Lv
†, 
Jianhong Zhao
†,
Mingpeng Chen
,
Kaiyuan Shen
,
Dongming Zhang
,
Jin Zhang
,
Genlin Zhang
* and
Qingju Liu
* School of Materials Science and Engineering, Yunnan Key Laboratory for Micro/nano Materials & Technology, Yunnan University, Kunming 650091, China
*
Authors to whom correspondence should be addressed.
†
These authors contributed equally to this work.
Materials 2018, 11(10), 1946; https://doi.org/10.3390/ma11101946
Submission received: 1 September 2018
/
Revised: 2 October 2018
/
Accepted: 8 October 2018
/
Published: 11 October 2018
(This article belongs to the Special Issue Supported Metal and Metal Oxide Catalysts by Sol-Gel Chemistry: Synthesis and Applications)
Abstract
:In this work, TiO2 photocatalysts, co-doped with transition metal ions vanadium (V) and cobalt (Co) ((V,Co)–TiO2), were synthesized by the sol–gel method. The synthesized photocatalysts were characterized by X-ray diffraction (XRD), transmission electron microscopy (TEM), X-ray photoelectron spectroscopy (XPS), nitrogen adsorption and desorption measurement, UV-Vis absorption and photoluminescence spectrum (PL) spectra. The results show that V and Co co-doping has significant effects on sample average crystalline grain size, absorption spectrum, recombination efficiency of photo-induced electron-hole pairs (EHPs), and photocatalytic degradation efficiency of methylene blue (MB). (V,Co)–TiO2 photocatalyst exhibits an obvious red shift of the absorption edge to 475 nm. Photocatalytic degradation rate of (V,Co)–TiO2 sample for MB in 60 min is 92.12% under a Xe lamp with a cut-off filter (λ > 400 nm), which is significantly higher than 56.55% of P25 under the same conditions. The first principles calculation results show that V and Co ions doping introduces several impurity energy levels, which can modulate the location of the valence band and conduction band. An obvious lattice distortion is produced in the meantime, resulting in the decrease in photo-generated EHP recombination. Thus, (V,Co)–TiO2 photocatalyst performance is significantly improved.
1. Introduction
The environment pollution, especially water contaminant, has become a serious problem to be urgently overcome. TiO2 semiconductor photocatalysis is a kind of pollution treatment technology with great potential, and has been extensively investigated because TiO2 photocatalyst is of high photocatalytic activity, inexpensive, and non-toxic and can convert organic pollutants into inorganic substances consuming only solar energy [1,2,3]. However, owing to the relative wide band gap (~3.2 eV), TiO2 can just be excited under ultraviolet light with a wavelength of less than 387 nm, which restricts its application [4]. At the same time, the easy recombination of photo-generated EHPs always results in a low photo-quantum yield value of TiO2.
To solve this key problem, researchers have utilized a variety of effective methods to modify TiO2, including dye-sensitizing [5], noble metal loading [6,7], semiconductor mixing [8,9,10], and ion doping [11,12,13]. Among them, ion doping has been extensively reported as a promising modification method. It is generally believed that ion doping can induce lattice defects [14], make the absorption edges exhibit a red shift [15], and reduce the recombination rate of photo-generated EPHs [16], which further improve the photocatalytic efficiency of material. The dopants mainly include transition metals [17], rare earth metals [18], non-metals [19], and so on. The V-doped TiO2 catalytic synthesized by Lin et al. [20] requires 8 h for visible light degradation of MB to reach 90%. Rahimi et al. [21] synthesized Co–TiO2 by a sol–gel method and the degradation efficiency of MB was 70% at 3 h under a 300 W tungsten lamp. Chen et al. [22] reported that cobalt- and vanadium-codoped TiO2 thin films degradation MB by 75% under UV-light for 24 h. The degradation efficiency of our synthesized (V,Co)–TiO2 sample for MB in 60 min was 92.12% under a Xe lamp (λ > 400 nm) with a cut-off filter.
Transition metal ions usually occupy the lattice Ti site and incorporate into the lattice [22]. Amirsalehi and Askari [23] reported that doping cobalt and vanadium affected the crystal growth. This is because the accumulation of cobalt and vanadium ions or the oxygen vacancies generated at the grain boundaries limits the contact of grains and destroys the conventional conditions. The Co-doped TiO2 one-dimensional nanostructures were synthesized by a simple solvothermal method reported by De et al. [24]. XPS clearly shows that Ti4+ ions are replaced by Co2+ ions, demonstrating that Co is incorporated into TiO2 lattice to form oxygen vacancies, which greatly changes its optical properties. Through theoretical calculation shows that the impurity level position of V–TiO2 is above the valence band maximum (VBM) as well as Co–TiO2 is below the conduction band minimum (CBM), which is conducive to the absorption spectrum (Sabs) red shift. Here, a (V,Co)–TiO2 sample was prepared and further studied for its properties. (V,Co)–TiO2 photocatalysts with boosted visible-light response were synthesized and further studied for their properties. Simultaneously, the theoretical calculation results were analyzed, and the trend of the changes was found to be in good agreement with the experimental results.
2. Materials and Methods
2.1. Materials
The tetrabutyl titanate (Ti(OC4H9)4), nitric acid (HNO3), ammonium vanadate (NH4VO3), cobalt nitrate (Co(NO3)2), acetylacetone, acetone, and absolute ethanol were purchased from Sinopharm Chemical Reagent Co., Ltd. (Shanghai, China). P25 photocatalyst were purchased from Evonik Degussa, Essen, Germany. All reagents were of analytical grade and used without further purification. Deionized (DI) water and hydrolytic inhibitor (a mixture of acetylacetone, acetone, and absolute ethanol) were prepared by our group.
2.2. Preparation of Photocatalysts
The (V,Co)–TiO2 photocatalyst was synthesized through the sol–gel process as follows: A certain amount of tetrabutyl titanate and hydrolytic inhibitor was slowly added into 75 mL of deionized water under vigorous stirring at 60 °C, and the white suspension was adjusted by 2.5 M HNO3 until pH 1.5, labeled as Solution A. A certain amount of NH4VO3 and Co(NO3)2 was dissolved wholly in 5 mL of deionized water and labeled as Solution B. Solution B was added to Solution A dropwise, and the fresh solution was strongly stirred for 5–10 h to from collosol. Finally, after being aged, dried, annealed (the calcination process was carried out based on the following processes: heating from room temperature to 500 °C, following by calcining for 2 h before furnace cooling), and ground, the powder of (V,Co)–TiO2 photocatalyst was obtained.
2.3. Characterization of Photocatalysts
X-ray diffraction (XRD) was characterized on a D/max-2300 diffractometer (Rigaku, Tokyo, Japan) with Cu Kα1 radiation (λ = 1.54056 Å) operating at 35 kV and at angles range from 10° to 90° (2θ). Morphology analysis was identified by transmission electron microscopy (TEM) on JEM-2100 microscope (JEOL, Akishima, Japan, 200 kV). X-ray photoelectron spectroscopy (XPS) measurements were performed on a K-Alpha+ spectrometer (Thermo Fisher Scientific, Waltham, MA, USA, 1486.6 eV) with an Al Kα excitation. N2 adsorption and desorption measurements were measured on a Quadrasorb-evo equipment (Quantachrome, Boynton Beach, FL, USA) to evaluate the texture of synthesized nanoparticles through the sorption system, and the sample degassed temperature is 300 °C. The Sabs response characteristics of the nanoparticles were measured on a UV-Vis spectrophotometer (UV2550, Shimadzu, Kyoto, Japan). In order to research the recombination of photo-generated EHPs of the synthesized nanoparticles, photoluminescence spectrum (PL) was obtained by an FL4500 fluorescence spectrophotometer (Shimadzu, Kyoto, Japan).
2.4. Photocatalytic Performance of Photocatalysts
The methylene blue (MB) dye is chosen to evaluate the photocatalytic property of the as-synthesized nanoparticles. A total of 0.2 g of photocatalyst was dispersed in 50 mL of a 0.01 g/L MB solution and mixed homogeneously by stirring. The light irradiation is from a Xe lamp (λ > 400 nm) with a cut-off filter. Before irradiation, the solution was stirred in the dark for 30 min to completely achieve adsorption–desorption equilibrium, and the suspension was then taken out. During irradiation, 4 mL of the suspension was transferred to a centrifuge at an interval of 10 min and centrifuged at 3500 r/min for 30 min. The absorbance value of the MB solution was then measured by a 722 N spectrophotometer at 664 nm and the degradation rate (η) of the MB solution is described by the following equation:
where A0 is the absorbance value of solution after 30 min of dark reaction, and At is the absorbance value of solution after t min of irradiation.
3. Results and Discussion
The orthogonal experiment of photocatalytic degradation rate of MB is presented in Figure S1. According to the orthogonal experimental results, V-doped TiO2 with a molar ratio of n(V):n(Ti) = 0.3%, Co-doped TiO2 with a molar ratio of n(Co):n(Ti) = 0.1%, and V and Co co-doped TiO2 with a molar ratio of n(V):n(Ti) = 0.3% and n(Co):n(Ti) = 0.1% prepared at pH 1.5 and sintered at 500 °C show the best photocatalytic activity, the percentage of degradation is 87.91%, 78.75%, and 92.12%, respectively. Therefore, the V–TiO2, Co–TiO2, (V,Co)–TiO2 photocatalysts discussed below are prepared at above conditions.
3.1. Morphology and Structure
Figure 1 depicts the XRD patterns of pure TiO2, V–TiO2, Co–TiO2, and (V,Co)–TiO2 nanoparticles heat-treated at 500 °C. It is obvious that the XRD pattern of pure TiO2 can be assigned to the anatase TiO2 (JCPDS No. 73-1764) and rutile TiO2 (JCPDS No. 73-1765). Pure TiO2 exhibits several diffraction peaks at 25.4°, 37.9°, 48.18°, and 55.24°, corresponding to (101), (004), (200), and (211) planes of anatase phase, and 27.48°, 36.12°, 54.38°, and 62.96°, corresponding to (110), (101), (211), and (002) crystal planes of the rutile phase. In addition, all diffraction peaks of the V–TiO2, Co–TiO2, and (V,Co)–TiO2 samples can be matched with the anatase and rutile phases of pure TiO2, but the peak intensity substantially changes. The diffraction pattern shows a sharp peak indicating excellent crystallinity. As shown in Figure 1, the (V,Co)–TiO2 sample has the strongest XRD diffraction peak, demonstrating that it has better crystallinity than other samples.
Table 1 is the phase content in the sample calculated according to the Quantitative formula:
where IA and IR are the intensity of XRD peaks of the anatase (101) and rutile (110) planes, respectively [25]. It can be seen from Table 1 that the content of the rutile phase in the Co–TiO2 sample increases compared to the pure TiO2 prepared under the same conditions, while the rutile phase content of the V–TiO2 sample decreases. This indicates that V doping can inhibit the transformation of TiO2 from the anatase phase to the rutile phase. However, when V and Co are co-doped, the rutile phase content is less than that of pure TiO2 and Co–TiO2 photocatalyst, and more than that of V–TiO2 photocatalyst.
The morphology of TiO2, V–TiO2, Co–TiO2, and (V,Co)–TiO2 samples are shown in Figure 2. The TEM shows that the samples consist of sphere-like homogeneous particles with the average diameter of 20 nm, but they significantly agglomerated. Clear lattice fringes can be seen from high-resolution transmission electron microscopy (HRTEM) images of TiO2 (Figure 2b), V–TiO2 (Figure 2d), Co–TiO2 (Figure 2f), and (V,Co)–TiO2 (Figure 2h) samples, showing outstanding crystallinity, which are composed of rutile and anatase phases. Figure 2b demonstrates the lattice planes of anatase (101) with d-spacing of 0.352 nm and rutile (110) with d-spacing of 0.325 nm of pure TiO2. Compared to pure TiO2, the lattice spacing of the doped samples changes, which indicates that V and Co ions have been doped into TiO2 crystal lattice and can cause lattice distortion.
The TiO2, V–TiO2, Co–TiO2, and (V,Co)–TiO2 samples are further measured by XPS. Figure 3 exhibits the XPS spectra of Ti 2p characteristic peaks. For pure TiO2, two characteristic peaks located at 457 and 462.78 eV could be assigned to Ti 2p3/2 and Ti 2p1/2, respectively. The position of the Ti 2p characteristic peak of V–TiO2 and Co–TiO2 is obviously changed. In particular, the Ti 2p3/2 and Ti 2p1/2 peak of (V,Co)–TiO2 sample are shifted towards higher binding energy to 458.18 and 464.08 eV, respectively. Because the Pauling electronegativity of Ti4+ (1.54) is smaller than that of V4+ (1.63) and Co2+ (1.88), the electron of Ti4+ will transfer to V4+ and Co2+, resulting in the electron number decreasing in Ti4+, and subsequently increases the binding energy [26]. At the same time, the Ti 2p binding energies of (V,Co)–TiO2 increase, indicating that some Ti atoms are substituted by V and Co ions in the lattice, which may produce more V–O–Ti, Co–O–Ti, and V–O–Co structures [27].
The nitrogen adsorption–desorption isotherm was performed to determine the specific surface area and porous structure of TiO2, V–TiO2, Co–TiO2, and (V,Co)–TiO2 samples, and the relevant results are shown in Figure 4. We can observe that the isotherm of four samples exhibits a type IV shape with an H3 hysteresis loop in the region of 0.4–0.8 p/p0, according to the IUPAC classification [28]. This indicates that the as-synthesized sample is a mesoporous material, and this desorption hysteresis phenomenon is related to the shape and size of the pore. It can be seen from the pore size distribution diagram of Figure 4b that pure TiO2 photocatalyst has a wide pore size distribution, which is disadvantageous for the adsorption property of MB. The (V,Co)–TiO2 photocatalyst has a narrow pore size distribution, which makes it easier to capture MB and helps to increase adsorption property for MB and photocatalytic reaction, thereby improving its photocatalytic degradation efficiency [29]. As can be seen from Table 2, the samples differ in physical properties. (V,Co)–TiO2 sample has the smallest pore size, but its specific surface area (SBET) and pore volume are smaller than that of pure TiO2. This indicates that the performance of (V,Co)–TiO2 photocatalyst does not entirely depend on specific surface area, pore volume, and pore size.
3.2. Optical Property
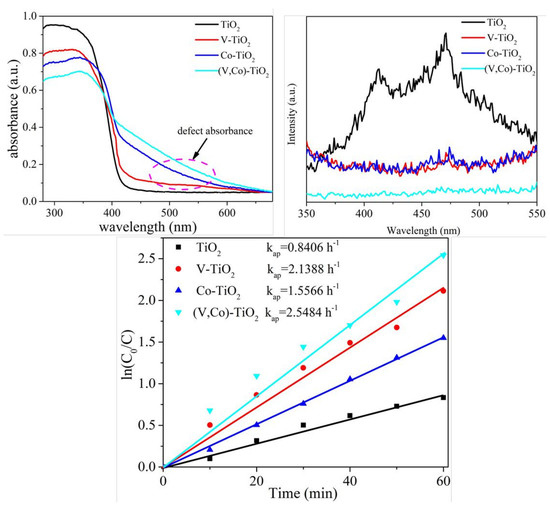
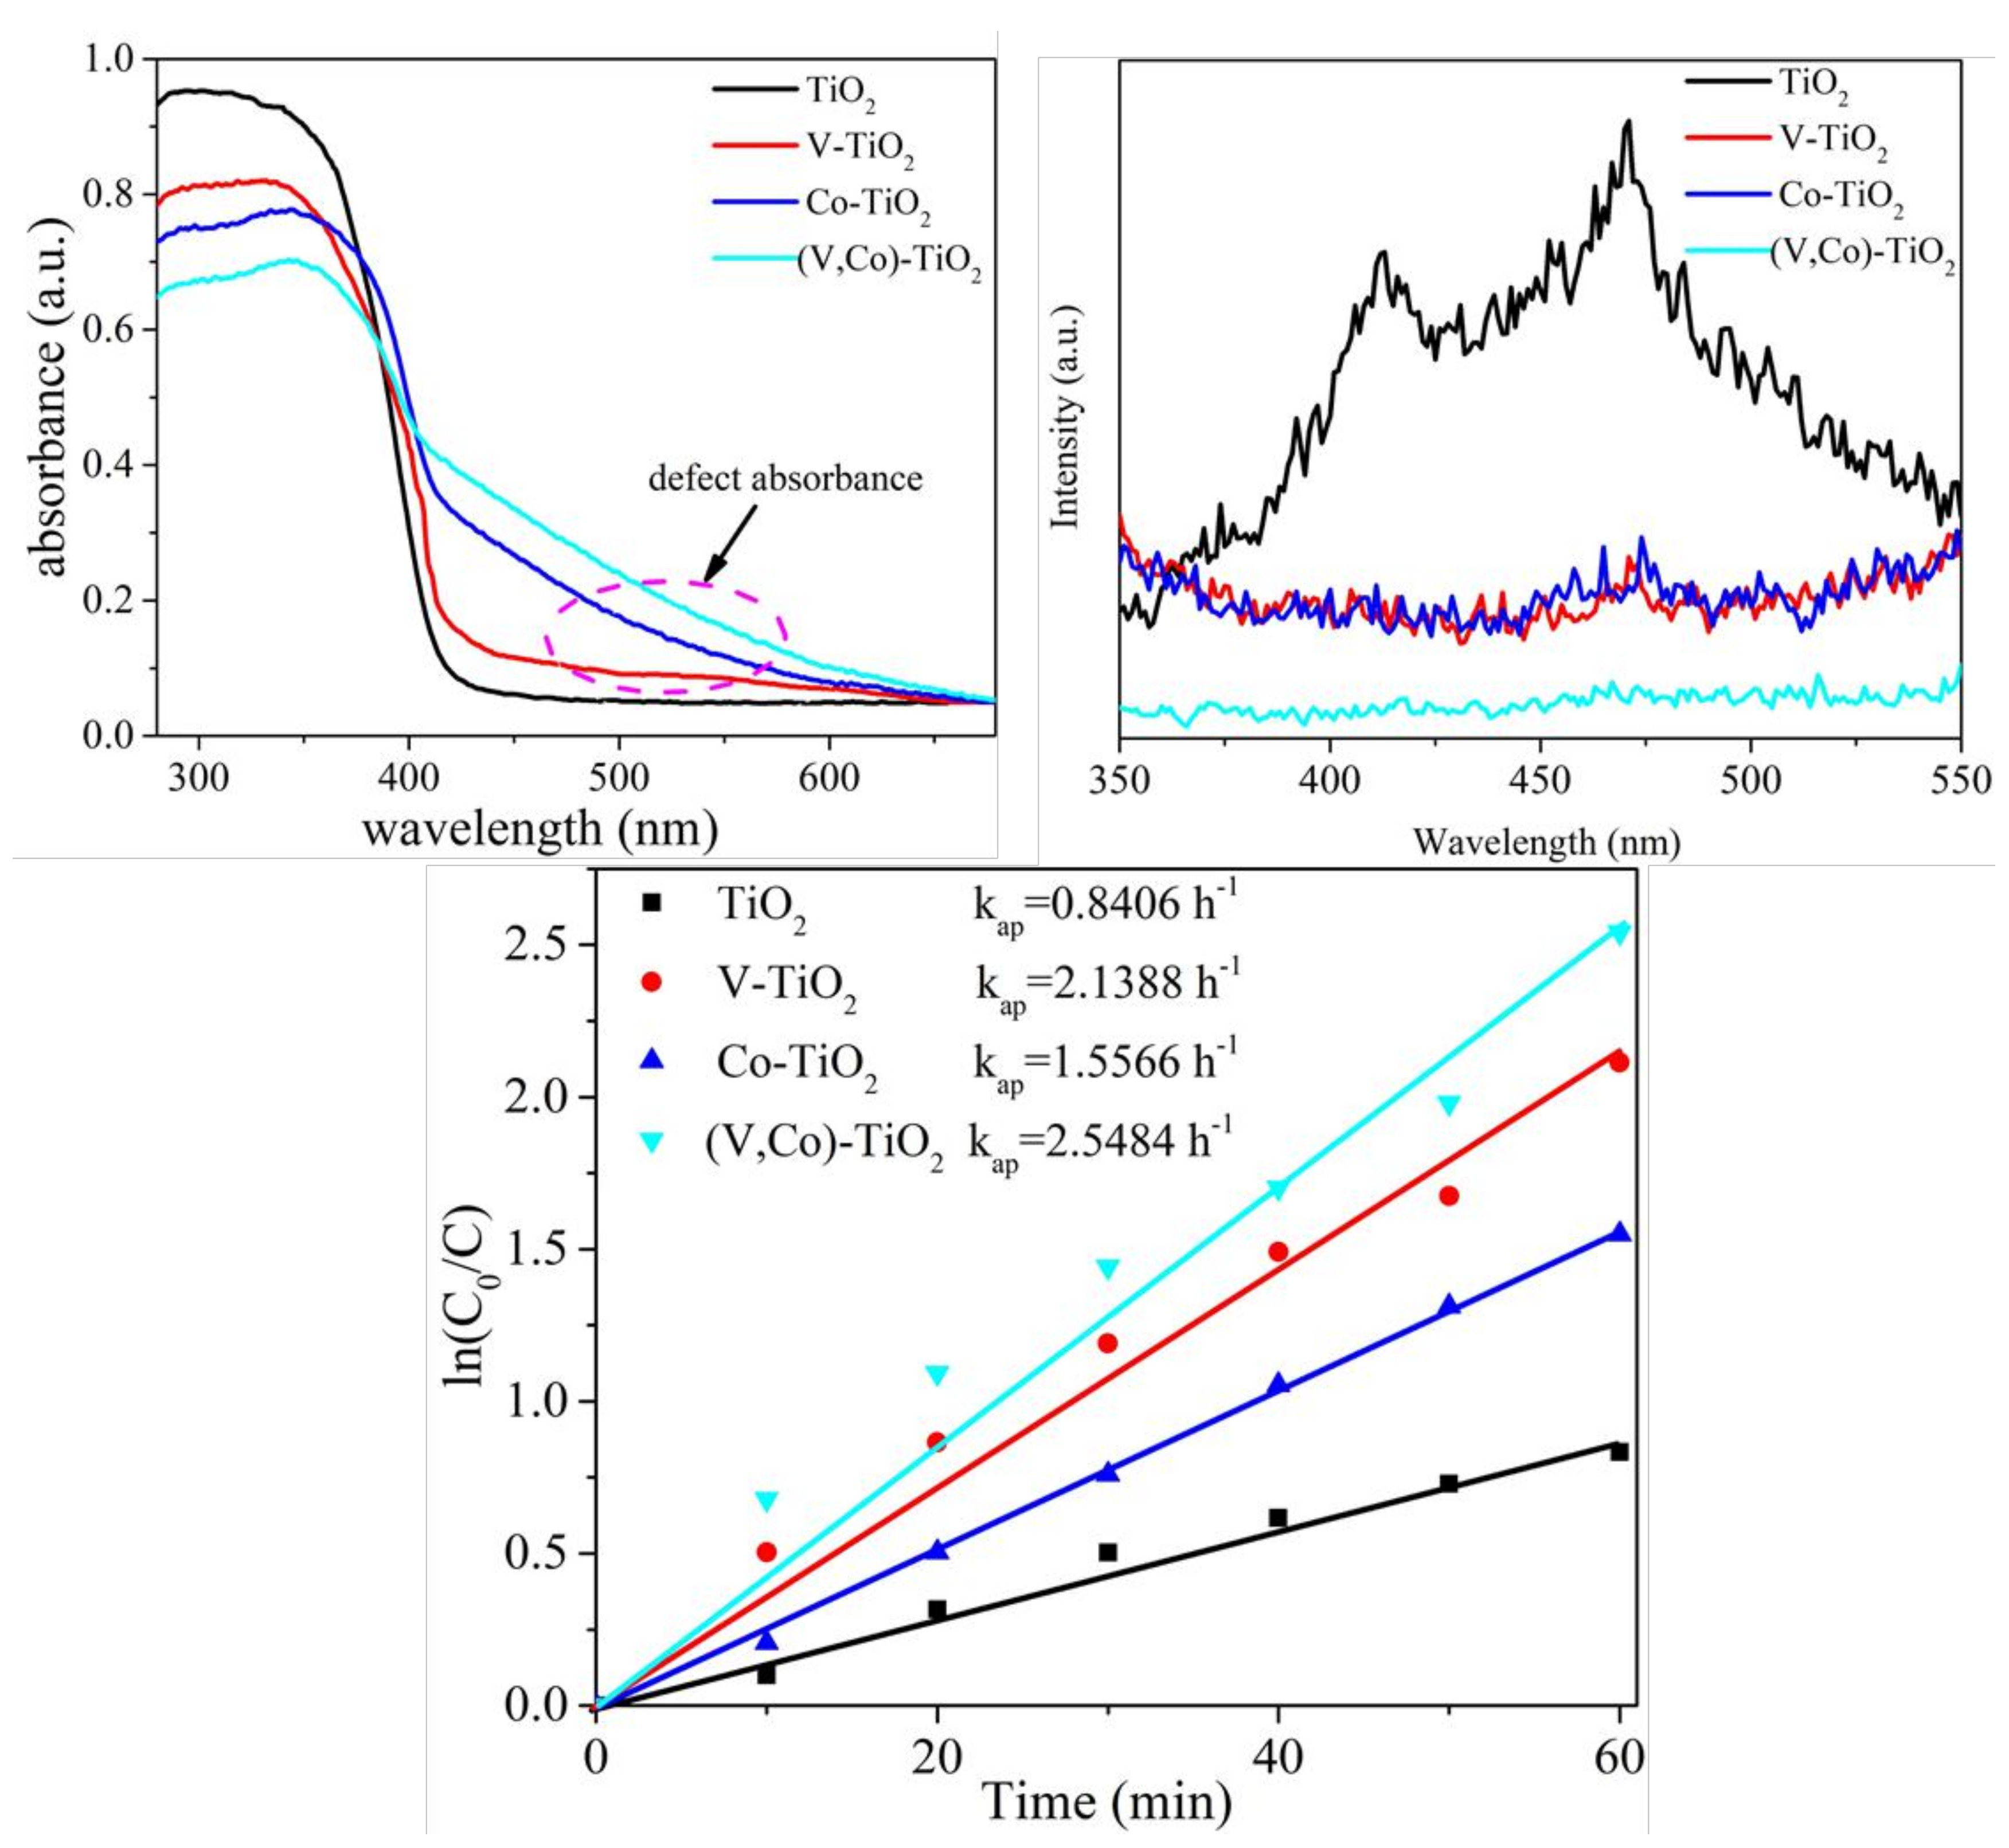
Figure 5 presents the optical Sabs of TiO2, V–TiO2, Co–TiO2, and (V,Co)–TiO2 samples in the range of 300–700 nm. Compared with TiO2, all the Sabs of the V–TiO2, Co–TiO2, and (V,Co)–TiO2 samples show a red shift, and the red shift is more obvious for the (V,Co)–TiO2 sample, moving from 405 to 475 nm. The energy required to make electrons transition from a valence band to a conduction band decreases, and the absorption of visible light increases [30]. From the marked circle of Figure 5, it was detected that the doped TiO2 showed a clear band tailing. Because the absorption of electrons from the defect state always leads to light absorption, the intensity of the band tailing can directly reflect the number of defect states [31]. It can be seen that (V,Co)–TiO2 has more defect states. Tauc plots can determine the band gap energy of TiO2 and doped TiO2 samples. The band gap value of TiO2 is 3.01 eV, with the doping of V and Co ions, the band gap decreased to 2.91 eV (V–TiO2), 2.77 (Co–TiO2), and 2.56 eV ((V,Co)–TiO2), which is in agreement with the trend of theoretically calculated band gap values.
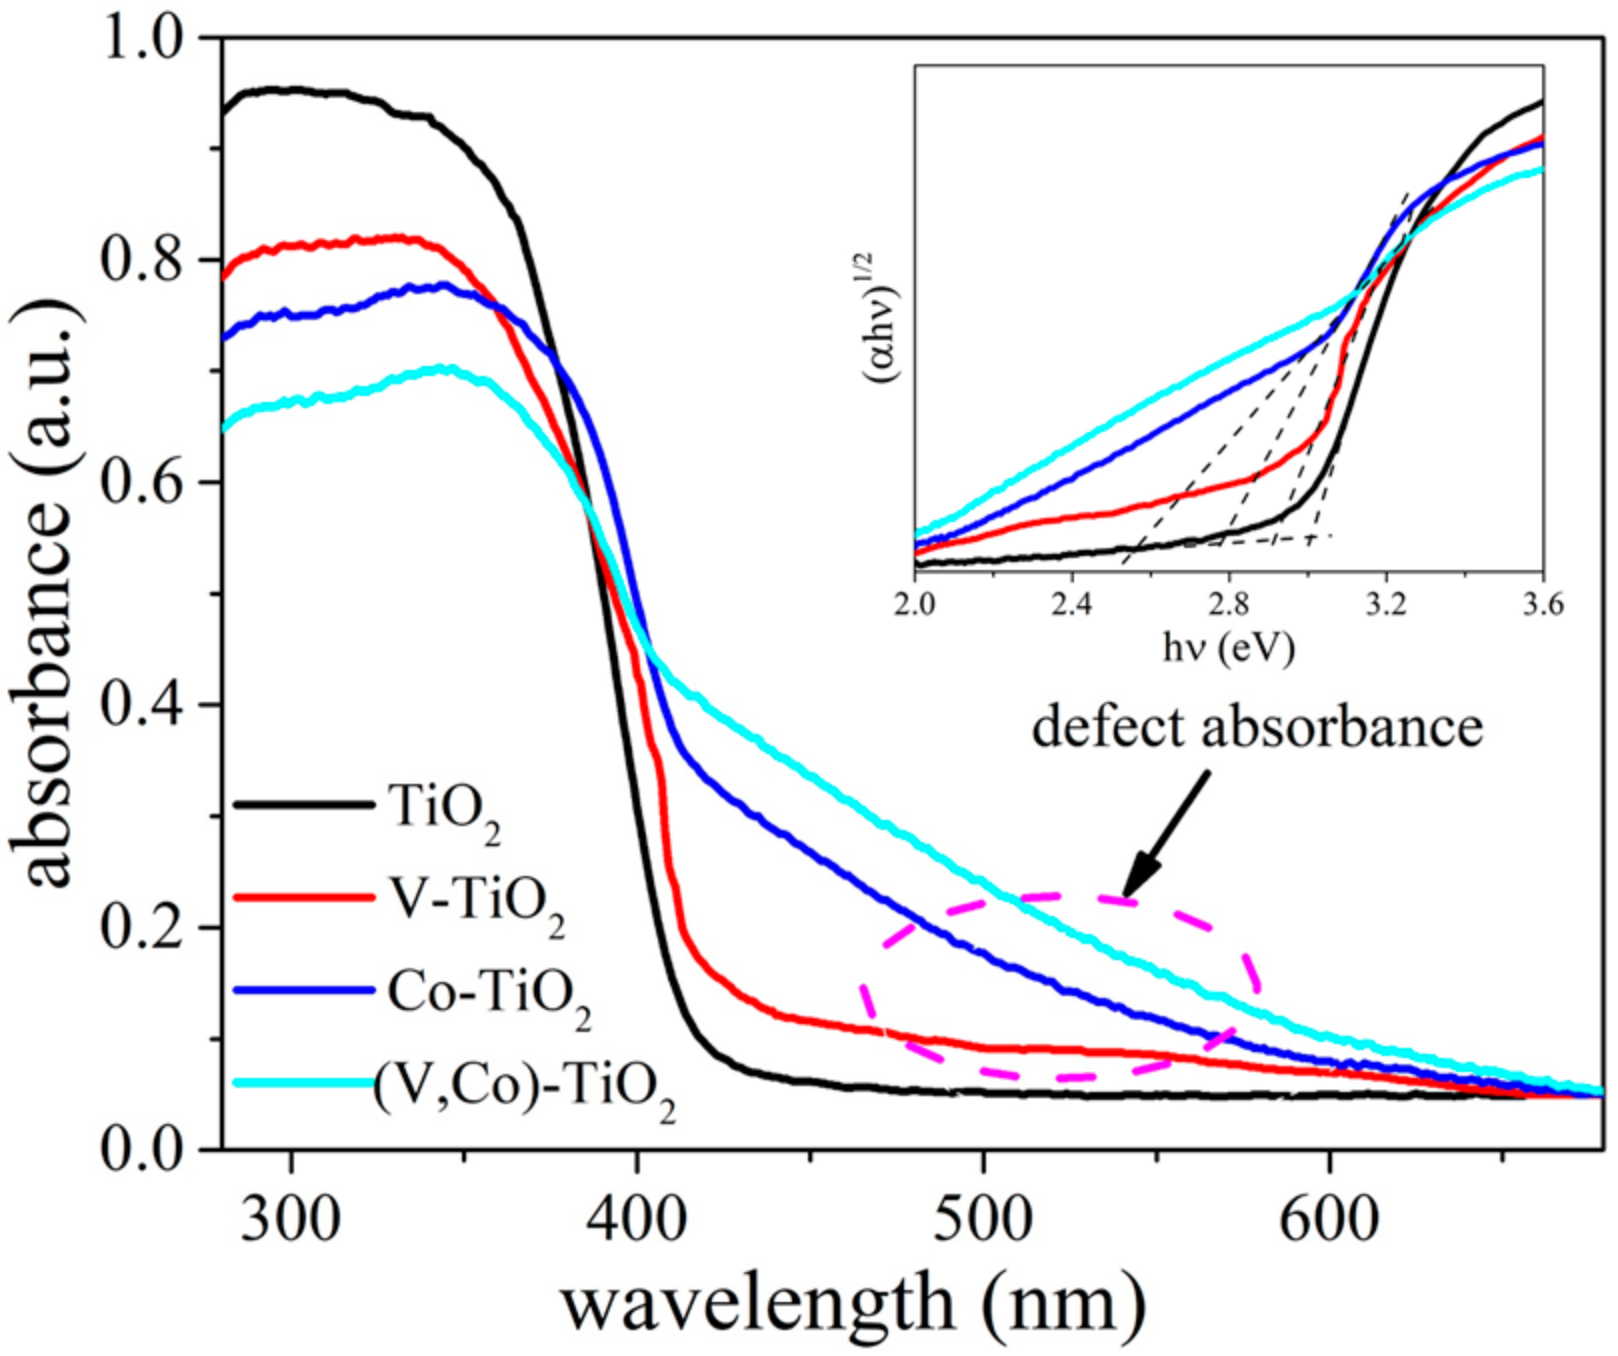
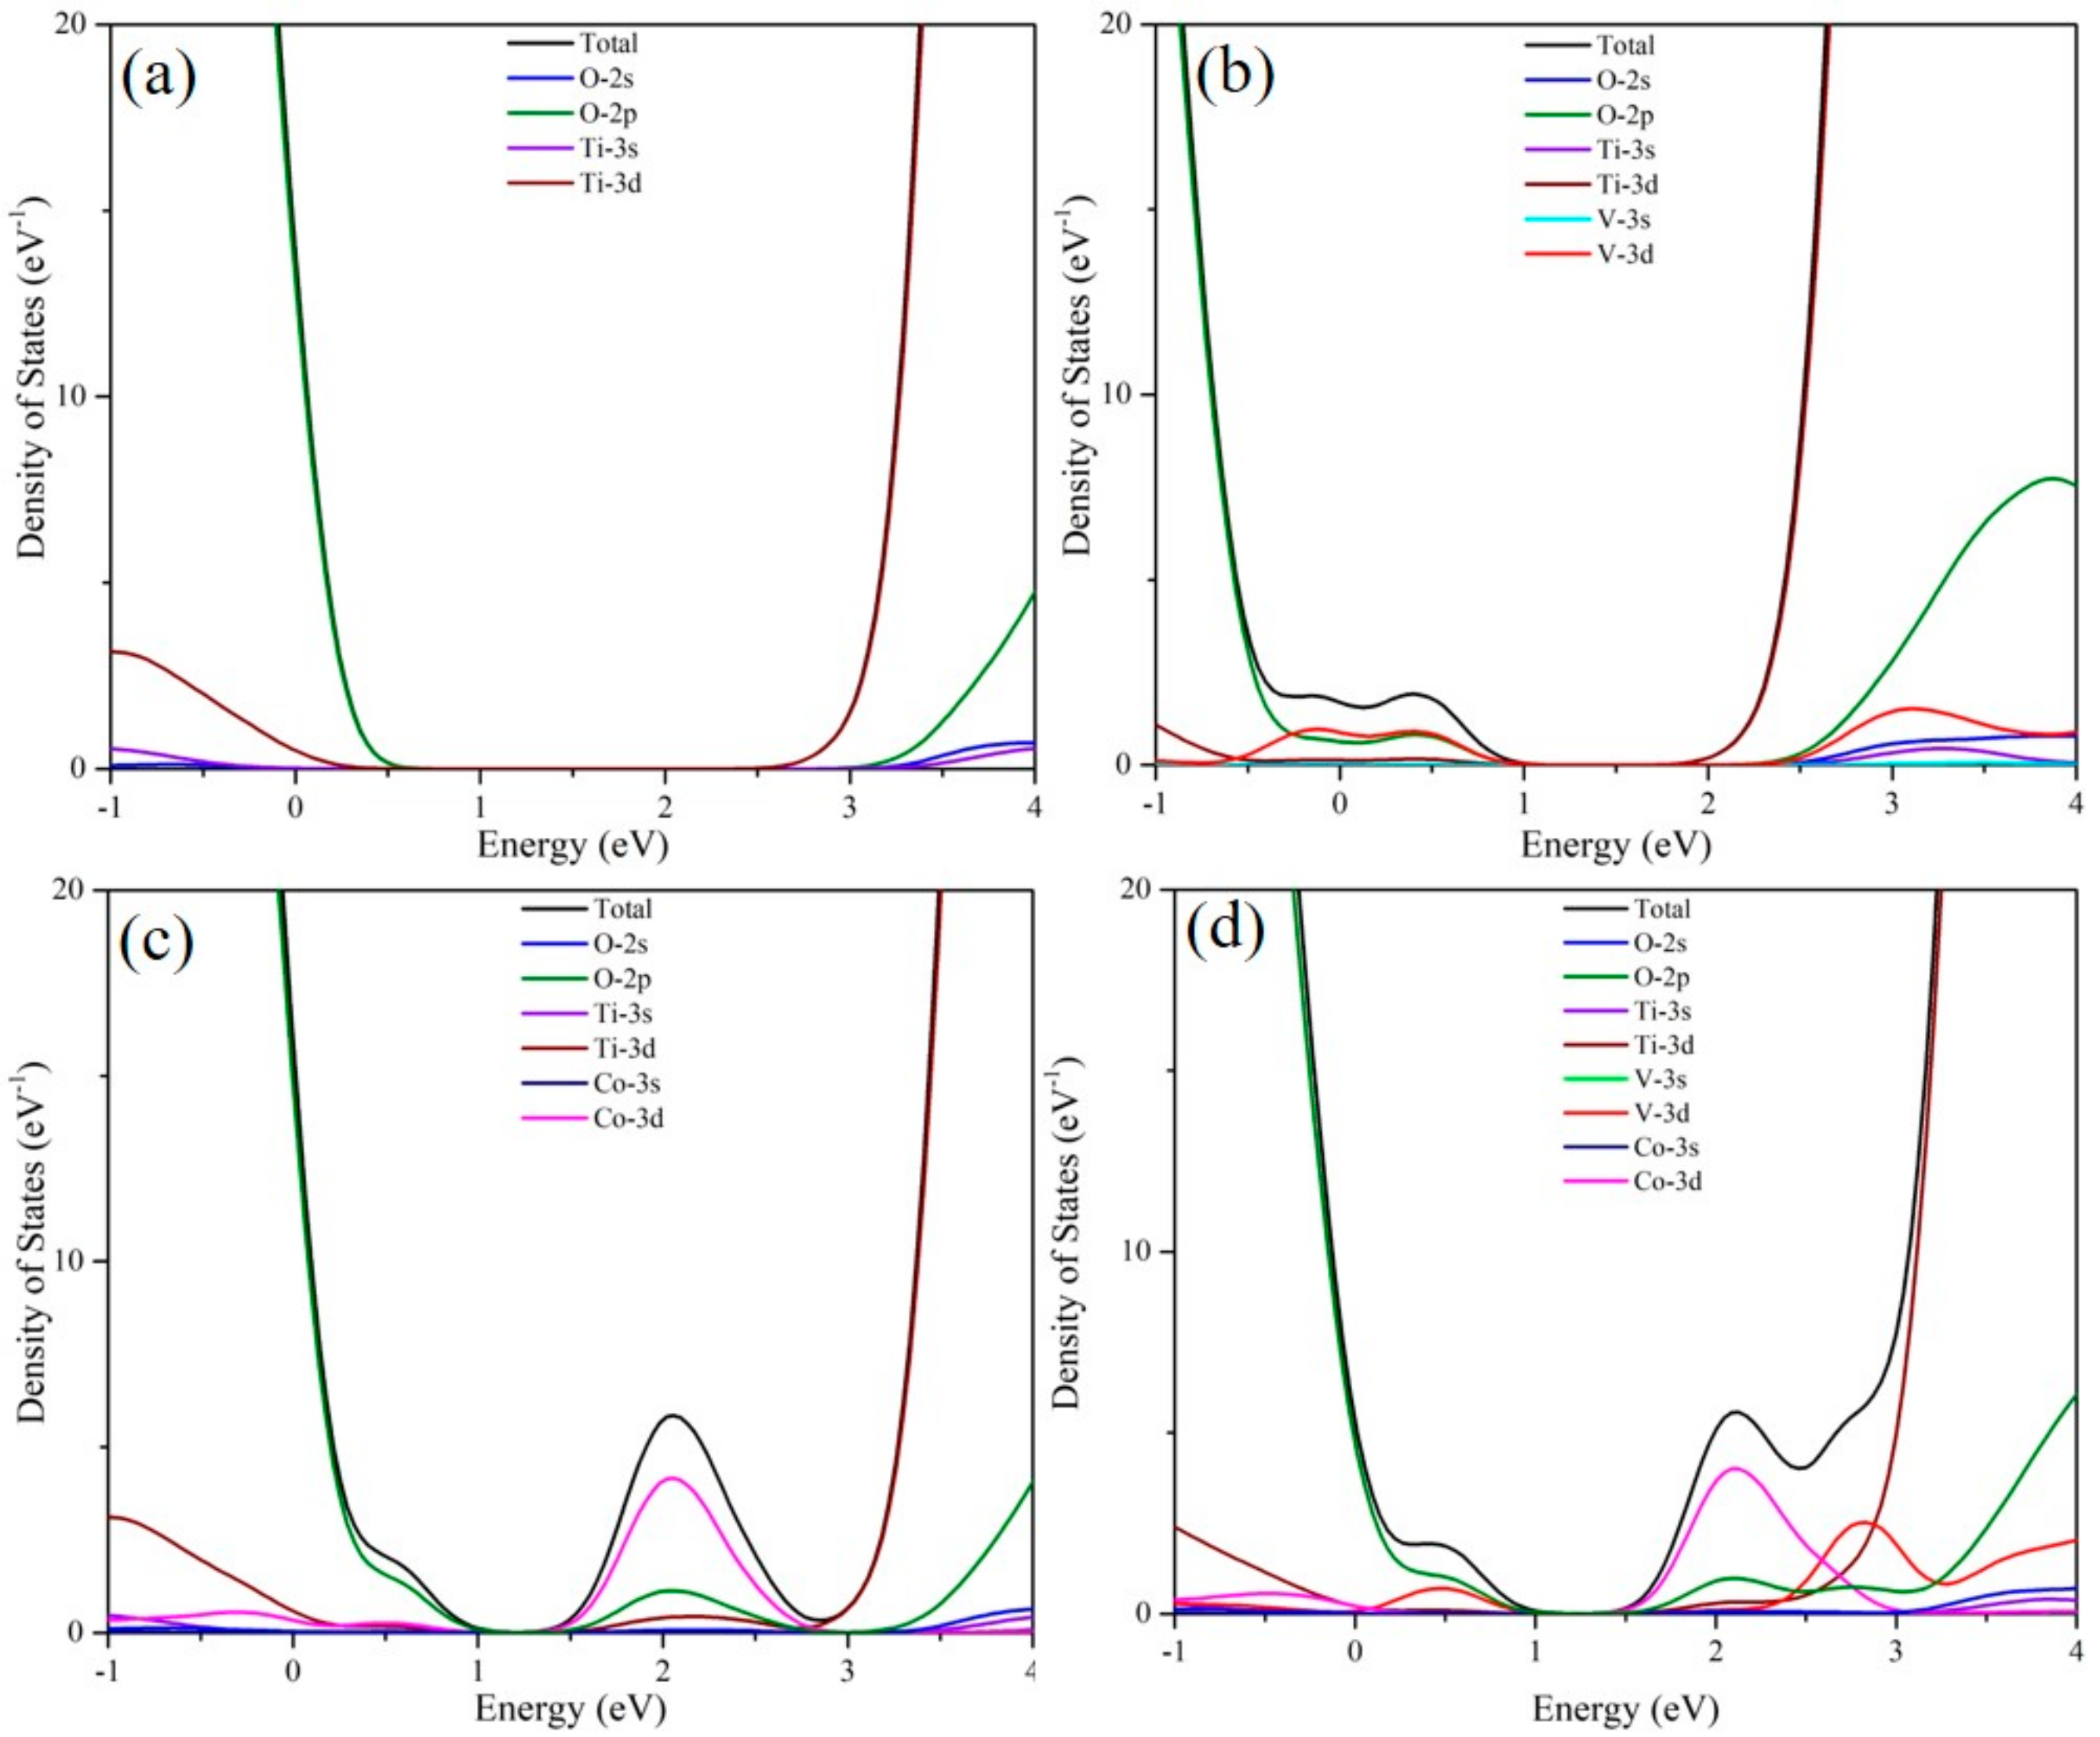
To investigate the effect of doping V and Co ions on the electronic structure of anatase TiO2, a set of density functional theory (DFT) calculations were carried out. Figure 6 and Figure 7 represent the energy band structure and density of states (DOS) of four TiO2 photocatalytic systems, respectively. The calculations in this paper were completed by cambridge sequential total energy package (CASTEP) module in Materials Studio software (version: MS6.0), using the generalized gradient approximation (GGA) method under the framework of density functional theory. The plane wave cut-off energy set was 400 eV. For obtaining an accurate electronic structure, the GGA + U (U = 5 eV) method is used to overcome the disadvantages of GGA [32]. In the Brillouin zone, the k-points grid sampling was set to 2 × 2 × 2. The convergence parameter settings were as follows: 5.0 × 10⁻⁵ eV/atom for maximum energy tolerance, 0.10 eV/Å for maximum force tolerance, 0.20 GPa for maximum stress tolerance, and 5.0 × 10⁻³ Å for maximum displacement tolerance. Figure 6a illustrates that the band gap of pure TiO2 is calculated to be 3.00 eV, which is very close to the experimental result. The band gaps of doping TiO2 are smaller than that of pure TiO2, in terms of V–TiO2 (2.85 eV), Co–TiO2 (2.68 eV), and (V,Co)–TiO2 (2.59 eV). The impurity levels of V–TiO2 and Co–TiO2 locate between the forbidden bands, and the band gaps are reduced after doping, leading to an Sabs red shift. Meanwhile, multiple impurity levels are induced in the forbidden band, which can facilitate the absorption of visible light by the TiO2 photocatalyst [33]. However, the excessive doping concentration will produce more recombination center for the EHPs. Compared with V–TiO2 and Co–TiO2, the impurity levels in (V,Co)–TiO2 are closer to CBM and VBM. Notably, the band gap of (V,Co)–TiO2 is significantly smaller than that of V–TiO2 and Co–TiO2, and the dipole moment of (V,Co)–TiO2 (3.412 Debye) is significantly larger than that of V–TiO2 (0.041 Debye) and Co–TiO2 (0.042 Debye), which not only contributes to the absorption of visible light but also prevents the recombination of the EHPs. In addition, the impurity level above the Fermi level can capture photo-generated electrons, further reducing the EHP recombination and improve the photocatalytic efficiency [34].
For investigating the recombination of the EHPs, PL spectra of pure TiO2, V–TiO2, Co–TiO2, and (V,Co)–TiO2 samples were carried out in Figure 8. Since the PL emission is the result of the recombination of the excited EHPs, the lower the PL intensity of the sample, the lower the recombination rate [35]. Compared to the PL spectra of pure TiO2, the fluorescence intensity of (V,Co)–TiO2 sample is significantly weaker, indicating that (V,Co)–TiO2 can effectively inhibit the recombination of the EHPs. Due to the V and Co ions doping, the lattice of TiO2 is distorted, so that the positive and negative charge centers of the titanium octahedron [TiO6] do not coincide and the internal dipole moment is generated. The local electric field generated by the internal dipole moment causes the EHPs to be effectively separated [36]. The photoluminescence intensity of (V,Co)–TiO2 nanoparticles is weaker than that of V–TiO2 and Co–TiO2 sample. As a result, the lattice distortion of TiO2 is changed after co-doping of V and Co ions, resulting in a larger internal dipole moment and a further decrease in the recombination rate of photo-generated carriers, thereby facilitating the separation process of charges.
3.3. Photocatalytic Property
Photocatalytic degradation rate of MB is presented in Figure 9. It is observed that pure TiO2, V–TiO2, and Co–TiO2 samples exhibit a better photocatalytic efficiency than that of P25. The rate of the (V,Co)–TiO2 photocatalyst for photocatalytic degradation of MB for 60 min under a Xe lamp (λ > 400 nm) with a cut-off filter is 92.12%, which is significantly better than 56.55% of the P25 photocatalyst, the V–TiO2 and Co–TiO2 samples. The Mn/TiO2-WACF photocatalytic composite material synthesized by Ma et al. [37] requires 200 min for visible light degradation of MB to reach 90%. Shang et al. [38] prepared ZnO–Ag–TiO2 NTAs photocatalytic materials by the one-step anodization method. Its photodegradation efficiency for MB in 120 min was 86%. The rate of (V,Co)–TiO2 photocatalyst for photocatalytic degradation of MB for 60 min under visible-light is 92.12%, which is significantly better than that of the Mn/TiO2–WACF and ZnO–Ag–TiO2 NTAs photocatalysts. According to the previous analysis, the photocatalytic degradation rate of the (V,Co)–TiO2 is improved for the following two reasons. First, the Sabs of (V,Co)–TiO2 is red-shifted, and the absorption of visible light is enhanced. Secondly, the lattice distortion that occurs after the co-doping of V and Co ions produce a stronger internal dipole moment, which effectively separates the EHPs, so the photocatalytic degradation property of the (V,Co)–TiO2 is better than that of the other two samples.
It is known that photocatalytic reaction follows the classical Langmuir–Hinshelwood kinetic model. As shown in Figure 10, the kinetics of the MB photodegradation by P25, TiO2, V–TiO2, Co–TiO2, and (V,Co)–TiO2 photocatalysts are fitted by the pseudo-first-order kinetic equation [39]:
where C0 is the initial concentration value, and C is the concentration of MB after light irradiating at t min, kap is the first-order apparent efficiency constant, determined by the slope of the line, and indicates the photocatalytic activity of the photocatalyst. Obviously, for these three photocatalysts, the rate constants of TiO2, V–TiO2, Co–TiO2, and (V,Co)–TiO2 are 1.0586 h−1, 2.1388 h−1, 1.5566 h−1, and 2.5484 h−1, respectively, which are 1.2, 2.5, 1.8, and 3.0 times higher than that of P25 (0.8406 h−1). It can be seen that the (V,Co)–TiO2 photocatalyst has the maximum rate constant for photodegradation of MB, and the highest degradation efficiency in the reactions.
In summary, we have rationally designed and implemented the preparation of (V,Co)–TiO2 photocatalyst and achieved efficient visible-light response. This is due to the fact that vanadium and cobalt ions replace the lattice sites of titanium, resulting in lattice distortion of TiO2. The doping of vanadium and cobalt ions can narrow the band gap of (V,Co)–TiO2 photocatalyst, reduce the recombination rate of photo-generated electron-hole pairs, and red-shift the absorption band edge, thereby enhancing its absorption of visible-light and improving its photocatalytic performance in the visible region.
4. Conclusions
(V,Co)–TiO2 photocatalyst was successfully synthesized through a simple sol–gel method, proper doping amount of V and Co can reduce recombination probability of photo-generated EHPs, and makes absorption band edge red shift, enhanced absorption of visible light and improved photocatalytic activity. Compared with TiO2 (405 nm), all the Sabs of the V–TiO2 (426 nm), Co–TiO2 (447 nm) and (V,Co)–TiO2 (475 nm) samples show red-shift. The red-shift of absorption band edge of (V,Co)–TiO2 is the largest, of which the band gap is the narrowest, photo-generated electron-hole pairs have lowest recombination rate, and extend the lifetime of photo-generated carriers, thus increase photocatalytic efficiency. Photocatalytic degradation rate of MB in 60 min is 92.12% under a Xe lamp (λ > 400 nm) with a cut-off filter, which is significantly higher than 56.55% of P25 under the same time conditions. The theoretical calculation results show that the band gap of (V,Co)–TiO2 photocatalytic system is significantly reduced, and the impurity level is generated between the band gaps, which is beneficial to red shift of the absorption band edge, and thus greatly improve the photocatalytic performance.
Supplementary Materials
The following are available online at https://www.mdpi.com/1996-1944/11/10/1946/s1, Figure S1: degradation percentage of MB by V and Co doped TiO2 samples prepared at pH 1.5 and sintered at 500 °C. (a) V–TiO2 of different doping quantities, (b) Co–TiO2 of different doping quantities, (c) (V, Co)–TiO2 of different doping quantities, Figure S2: five recyclable visible-light catalytic degradation experiments using (V, Co)–TiO2 photocatalyst in 0.01g L−1 MB solution.
Author Contributions
Conceptualization, T.L. and J.Z. (Jianhong Zhao); Methodology, J.Z. (Jianhong Zhao); Software, T.L.; Validation, J.Z. (Jin Zhang), G.Z. and Q.L.; Formal Analysis, M.C.; Investigation, K.S.; Resources, Q.L.; Data Curation, D.Z.; Writing—Original Draft Preparation, T.L.; Writing—Review and Editing, J.Z. (Jianhong Zhao); Visualization, M.C.; Supervision, Q.L.; Project Administration, G.Z.; Funding Acquisition, Q.L.
Funding
This research was funded by National Natural Science Foundation of China (No. 51562038).
Acknowledgments
This work was supported by National Natural Science Foundation of China (No. 51562038).
Conflicts of Interest
The authors declare no conflict of interest.
References
- Lachheb, H.; Puzenat, E.; Houas, A.; Ksibiet, M.; Elimame, E.; Guillard, C.; Herrmann, J.M. Photocatalytic degradation of various types of dyes (Alizarin S, Crocein Orange G, Methyl Red, Congo Red, Methylene Blue) in water by UV-irradiated titania. Appl. Catal. B Environ. 2002, 39, 75–90. [Google Scholar] [CrossRef]
- Khataee, A.R.; Vatanpour, V.; Ghadim, A.R.A. Decolorization of C.I. Acid Blue 9 solution by UV/Nano-TiO2, fenton, fenton-like, electro-fenton and electrocoagulation processes: A comparative study. J. Hazard. Mater. 2002, 161, 1225–1233. [Google Scholar] [CrossRef] [PubMed]
- Yang, T.T.; Peng, J.M.; Zheng, Y.; He, X.; Hou, Y.D.; Wu, L.; Fu, X.Z. Enhanced photocatalytic ozonation degradation of organic pollutants by ZnO modified TiO2 nanocomposites. Appl. Catal. B Environ. 2018, 221, 223–234. [Google Scholar] [CrossRef]
- Chen, H.H.; Nanayakkara, C.E.; Grassian, V.H. Titanium dioxide photocatalysis in atmospheric chemistry. Chem. Rev. 2012, 112, 5919–5948. [Google Scholar] [CrossRef] [PubMed]
- Zyoud, A.; Zaatar, N.; Saadeddin, I.; Helal, M.H.; Campet, G.; Hakim, M.; Park, D.; Hilal, H.S. Alternative natural dyes in water purification: Anthocyaninas TiO2-sensitizer in methyl orange photo-degradation. Solid State Sci. 2011, 13, 1268–1275. [Google Scholar] [CrossRef]
- Lin, X.X.; Rong, F.; Fu, D.G.; Yuan, C.W. Enhanced photocatalytic activity of fluorine doped TiO2 by loaded with Ag for degradation of organic pollutants. Powder Technol. 2012, 219, 173–178. [Google Scholar] [CrossRef]
- Pakdel, E.; Daoud, A.D.; Afrin, T.; Sun, L.; Wang, X.G. Self-cleaning wool: Effect of noble metals and silica on visible-light-induced functionalities of nano TiO2 colloid. J. Text. Inst. 2015, 106, 1348–1361. [Google Scholar] [CrossRef]
- Chu, H.P.; Lei, W.Y.; Liu, X.J.; Li, J.L.; Zheng, W.; Zhu, G.; Li, C.; Pan, L.K.; Sun, C.Q. Synergetic effect of TiO2 as co-catalyst for enhanced visible light photocatalytic reduction of Cr(VI) on MoSe2. Appl. Catal. A Gen. 2016, 521, 19–25. [Google Scholar] [CrossRef]
- Pakdel, E.; Daoud, A.D.; Seyedin, S.; Wang, J.F.; Razal, J.M.; Sun, L.; Wang, X.G. Tunable photocatalytic selectivity of TiO2/SiO2 nanocomposites: Effect of silica and isolation approach. Colloid Surf. A 2018, 522, 130–141. [Google Scholar] [CrossRef]
- Liu, D.; Zhang, M.W.; Xie, W.J.; Sun, L.; Chen, Y.; Lei, W.W. Porous BN/TiO2 hybrid nanosheets as highly efficient visible-light-driven photocatalysts. Appl. Catal. B Environ. 2017, 207, 72–78. [Google Scholar] [CrossRef]
- Feilizadeh, M.; Mul, G.; Vossoughi, M. E. coli inactivation by visible light irradiation using a Fe-Cd/TiO2 photocatalyst: Statistical analysis and optimization of operating parameters. Appl. Catal. B Environ. 2015, 168–169, 441–447. [Google Scholar] [CrossRef]
- Janisch, R.; Gopal, P.; Spaldin, N.A. Transition metal-doped TiO2 and ZnO-present status of the field. J. Phys. Condens. Matter 2005, 17, R657–R689. [Google Scholar] [CrossRef]
- Chen, Y.; Wu, Q.; Zhou, C.; Jin, Q.T. Enhanced photocatalytic activity of La and N co-doped TiO2/diatomite composite. Powder Technol. 2017, 322, 296–300. [Google Scholar] [CrossRef]
- Quan, X.J.; Zhao, Q.H.; Tan, H.Q.; Sang, X.M.; Wang, F.Q.; Dai, Y. Comparative study of lanthanide oxide doped titanium dioxide photocatalysts prepared by coprecipitation and sol-gel process. Mater. Chem. Phys. 2009, 114, 90–98. [Google Scholar] [CrossRef]
- Zhou, W.F.; Liu, Q.J.; Zhu, Z.Q.; Zhang, J. Preparation and properties of vanadium-doped TiO2 photocatalysts. J. Phys. D Appl. Phys. 2010, 43, 035301. [Google Scholar] [CrossRef]
- Rauf, M.A.; Meetani, M.A.; Hisaindee, S. An overview on the photocatalytic degradation of azo dyes in the presence of TiO2 doped with selective transition metals. Desalination 2011, 276, 13–27. [Google Scholar] [CrossRef]
- Qi, K.H.; Fei, B.; Xin, J.H. Visible light-active iron-doped anatase nanocrystallites and their self-cleaning property. Thin Solid Films 2011, 519, 2438–2444. [Google Scholar] [CrossRef]
- Bingham, S.; Daoud, W.A. Recent advances in making nano-sized TiO2 visible-light active through rare-earth metal doping. J. Mater. Chem. 2011, 21, 2041–2050. [Google Scholar] [CrossRef]
- Vaiano, V.; Sacco, O.; Sannino, D.; Ciambelli, P. Nanostructured N-doped TiO2 coated on glass spheres for the photocatalytic removal of organic dyes under UV or visible light irradiation. Appl. Catal. B Environ. 2015, 170–171, 153–161. [Google Scholar] [CrossRef]
- Lin, W.C.; Lin, Y.J. Effect of Vanandium (IV)-Doping the Visible Light-Induced Catalytic of Titanium Dioxide Catalysts for Methylene Blue Degradation. Environ. Eng. Sci. 2012, 29, 447–452. [Google Scholar] [CrossRef] [PubMed]
- Rahimi, R.; Fard, E.H.; Saadati, S.; Rabbani, M. Degradation of methylene blue via Co-TiO2 nano powders modified by meso-tetra (carboxyphenyl) porphyrin. J. Sol-Gel Sci. Technol. 2012, 62, 351–357. [Google Scholar] [CrossRef]
- Chen, W.F.; Koshy, P.; Sorrell, C.C. Effect of intervalence charge transfer on photocatalytic performance of cobalt- and vanadium-codoped TiO2 thin films. Int. J. Hydrogen Energy 2015, 40, 16215–16229. [Google Scholar] [CrossRef]
- Amirsalehi, M.; Askari, M. Infulence of vanadium, cobalt-codoping on electrochemical performance of titanium dioxide bronze nanobelts used as lithium ion battery anodes. J. Mater. Sci. Mater. Electr. 2018, 29, 13068–13076. [Google Scholar] [CrossRef]
- Das, K.; Sharma, S.N.; Kumar, M.; De, S.K. Morphology dependent luminescence properties of Co doped TiO2 nanostructures. J. Phys. Chem. C 2009, 113, 14783–14792. [Google Scholar] [CrossRef]
- Du, P.; Bueno-López, A.; Verbaas, M.; Almeida, A.R.; Makkee, M.; Moulijn, J.A.; Mul, G. The effect of surface OH-population on the photocatalytic activity of rare earth-doped P25-TiO2 in methylene blue degradation. J. Catal. 2008, 260, 75–80. [Google Scholar] [CrossRef]
- Pan, L.; Zou, J.J.; Zhang, X.W.; Wang, L. Photoisomerization of norbornadiene to quadricyclane using transition metal doped TiO2. Ind. Eng. Chem. Res. 2012, 49, 8526–8531. [Google Scholar] [CrossRef]
- Niu, J.F.; Yao, B.H.; Chen, Y.Q.; Peng, C.; Yu, X.J.; Zhang, J.; Bai, G.H. Enhanced photocatalytic activity of nitrogen doped TiO2 photocatalysts sensitized by metallo Co, Ni-porphyrins. Appl. Surf. Sci. 2013, 271, 39–44. [Google Scholar] [CrossRef]
- Xiang, Q.J.; Yu, J.G.; Wang, W.G.; Jaroniec, M. Nitrogen self-doped nanosized TiO2 sheets with exposed {001} facets for enhanced visible-light photocatalytic activity. Chem. Commun. 2011, 47, 6906–6908. [Google Scholar] [CrossRef] [PubMed]
- Nguyen, T.B.; Hwang, M.J.; Ryu, K.S. High adsorption capacity of V-doped TiO2 for decolorization of methylene blue. Appl. Surf. Sci. 2012, 258, 7299–7305. [Google Scholar] [CrossRef]
- Lu, D.Z.; Chai, W.Q.; Yang, M.C.; Fang, P.F.; Wu, W.H.; Zhao, B.; Xiong, R.Y.; Wang, H.M. Visible light induced photocatalytic removal of Cr(VI) over TiO2-based nanosheets loaded with surface-enriched CoOx nanoparticles and its synergism with phenol oxidation. Appl. Catal. B Environ. 2016, 190, 44–65. [Google Scholar] [CrossRef]
- Gao, L.J.; Li, Y.G.; Ren, J.B.; Wang, S.F.; Wang, R.N.; Fu, G.S.; Hu, Y. Passivation of defect states in anatase TiO2 hollow spheres with Mg doping: Realizing efficient photocatalytic overall water splitting. Appl. Catal. B Environ. 2017, 202, 127–133. [Google Scholar] [CrossRef]
- Anisimov, V.I.; Korotin, M.A.; Zaanen, J.; Andersen, O.K. Spin bags, polarons, and impurity potentials in La2−xSrxCuO4 from first principles. Phys. Rev. Lett. 1992, 68, 345–348. [Google Scholar] [CrossRef] [PubMed]
- Liu, Q.L.; Zhao, Z.Y.; Liu, Q.J. Synergistic effects of nonmetal co-doping with sulfur in anatase TiO2: A DFT + U study. Phys. Chem. Chem. Phys. 2015, 17, 3426–3434. [Google Scholar] [CrossRef] [PubMed]
- Liu, Q.L.; Zhao, Z.Y.; Liu, Q.J. Analysis of sulfur modification mechanism for anatase and rutile TiO2 by different doping modes based on GGA + U calculations. RSC Adv. 2014, 4, 32100–32107. [Google Scholar] [CrossRef]
- Cong, Y.; Zhang, J.L.; Chen, F.; Anpo, M.; He, D.N. Preparation, photocatalytic activity, and mechanism of nano-TiO2 Co-doped with nitrogen and Iron (III). J. Phys. Chem. C 2007, 111, 10618–10623. [Google Scholar] [CrossRef]
- Liu, Q.L.; Zhao, Z.Y.; Liu, Q.J. Impact of sulfur-, tantalum-, or co-doping on the electronic structure of anatase titanium dioxide: A systematic density functional theory investigation. Mater. Sci. Semicon. Proc. 2015, 33, 94–102. [Google Scholar] [CrossRef]
- Ma, X.J.; Zhou, W.R.; Chen, Y. Structure and photocatalytic properties of Mn-doped TiO2 loaded on wood-based activated carbon fiber composites. Materials 2017, 10, 631. [Google Scholar]
- Shang, F.M.; Chen, S.Y.; Liang, J.; Liu, C.S. The Photocatalytic properties and mechanistic study of ZnO, Ag multiphase Co-composited TiO2 nanotube arrays film prepared by one-step anodization method. J. Electrochem. Soc. 2018, 165, D258–D265. [Google Scholar] [CrossRef]
- Wang, F.L.; Feng, Y.P.; Chen, P.; Wang, Y.F.; Su, Y.H.; Zhang, Q.X.; Zeng, Y.Q.; Xie, Z.J.; Liu, H.J.; Lv, W.Y.; et al. Photocatalytic degradation of fluoroquinolone antibiotics using ordered mesoporous g-C3N4 under simulated sunlight irradiation: Kinetics, mechanism, and antibacterial activity elimination. Appl. Catal. B Environ. 2018, 227, 114–122. [Google Scholar] [CrossRef]
Figure 1.
XRD patterns of TiO2, V–TiO2, Co–TiO2, and (V,Co)–TiO2 samples.

Figure 2.
TEM (a,c,e,g) and HRTEM (b,d,f,h) images of the TiO2, V–TiO2, Co–TiO2, and (V,Co)–TiO2 samples.
Figure 2.
TEM (a,c,e,g) and HRTEM (b,d,f,h) images of the TiO2, V–TiO2, Co–TiO2, and (V,Co)–TiO2 samples.

Figure 3.
Ti 2p XPS spectra of TiO2, V–TiO2, Co–TiO2, and (V,Co)–TiO2 samples.

Figure 4.
Nitrogen adsorption–desorption isotherm (a) and the corresponding pore size distribution (b) for TiO2, V–TiO2, Co–TiO2, and (V,Co)–TiO2 samples.
Figure 4.
Nitrogen adsorption–desorption isotherm (a) and the corresponding pore size distribution (b) for TiO2, V–TiO2, Co–TiO2, and (V,Co)–TiO2 samples.

Figure 5.
UV-Vis spectra of TiO2, V–TiO2, Co–TiO2, and (V,Co)–TiO2 samples, inset displays the corresponding Tauc plots, as well as the band gap values.
Figure 5.
UV-Vis spectra of TiO2, V–TiO2, Co–TiO2, and (V,Co)–TiO2 samples, inset displays the corresponding Tauc plots, as well as the band gap values.

Figure 6.
The band structures of (a) TiO2, (b) V–TiO2, (c) Co–TiO2, and (d) (V,Co)–TiO2.

Figure 7.
The DOS of (a) TiO2, (b) V–TiO2, (c) Co–TiO2, and (d) (V,Co)–TiO2.

Figure 8.
PL spectra of TiO2, V–TiO2, Co–TiO2, and (V,Co)–TiO2 samples.

Figure 9.
Degradation rate of MB over the P25, TiO2, V–TiO2, Co–TiO2, and (V,Co)–TiO2 samples and without the catalyst samples.
Figure 9.
Degradation rate of MB over the P25, TiO2, V–TiO2, Co–TiO2, and (V,Co)–TiO2 samples and without the catalyst samples.

Figure 10.
The kinetics of MB photocatalytic degradation over the P25, TiO2, V–TiO2, Co–TiO2, and (V,Co)–TiO2 samples.
Figure 10.
The kinetics of MB photocatalytic degradation over the P25, TiO2, V–TiO2, Co–TiO2, and (V,Co)–TiO2 samples.


Table 1.
Anatase and rutile content of TiO2, V–TiO2, Co–TiO2, and (V,Co)–TiO2 samples.
| Samples with Different Doping Element | TiO2 | V–TiO2 | Co–TiO2 | (V,Co)–TiO2 |
|---|---|---|---|---|
| Anatase content (%) | 64.07 | 78.62 | 47.07 | 70.05 |
| Rutile content (%) | 35.93 | 21.38 | 52.93 | 29.95 |
Table 2.
SBET, pore volume, and average pore size of TiO2, V–TiO2, Co–TiO2, and (V,Co)–TiO2 samples.
Table 2.
SBET, pore volume, and average pore size of TiO2, V–TiO2, Co–TiO2, and (V,Co)–TiO2 samples.
| Sample | SBET (m2 g−1) | Pore Volume (cm3 g−1) | Average Pore Diameter (nm) |
|---|---|---|---|
| V–TiO2 | 35.270 | 0.056 | 7.4 |
| Co–TiO2 | 22.812 | 0.033 | 6.5 |
| (V,Co)–TiO2 | 40.865 | 0.051 | 5.5 |
| TiO2 | 61.314 | 0.093 | 6.4 |
© 2018 by the authors. Licensee MDPI, Basel, Switzerland. This article is an open access article distributed under the terms and conditions of the Creative Commons Attribution (CC BY) license (http://creativecommons.org/licenses/by/4.0/).
Share and Cite
MDPI and ACS Style
Lv, T.; Zhao, J.; Chen, M.; Shen, K.; Zhang, D.; Zhang, J.; Zhang, G.; Liu, Q. Boosted Visible-Light Photodegradation of Methylene Blue by V and Co Co-Doped TiO2. Materials 2018, 11, 1946. https://doi.org/10.3390/ma11101946
AMA Style
Lv T, Zhao J, Chen M, Shen K, Zhang D, Zhang J, Zhang G, Liu Q. Boosted Visible-Light Photodegradation of Methylene Blue by V and Co Co-Doped TiO2. Materials. 2018; 11(10):1946. https://doi.org/10.3390/ma11101946
Chicago/Turabian StyleLv, Tianping, Jianhong Zhao, Mingpeng Chen, Kaiyuan Shen, Dongming Zhang, Jin Zhang, Genlin Zhang, and Qingju Liu. 2018. "Boosted Visible-Light Photodegradation of Methylene Blue by V and Co Co-Doped TiO2" Materials 11, no. 10: 1946. https://doi.org/10.3390/ma11101946
Note that from the first issue of 2016, this journal uses article numbers instead of page numbers. See further details here.