Dual-Emission Fluorescent Microspheres for the Detection of Biothiols and Hg2+

School of Material Science and Engineering, University of Jinan, Jinan 250000, China
*
Author to whom correspondence should be addressed.
Materials 2018, 11(11), 2232; https://doi.org/10.3390/ma11112232
Submission received: 25 September 2018
/
Revised: 7 November 2018
/
Accepted: 7 November 2018
/
Published: 9 November 2018
(This article belongs to the Special Issue Selected Papers from IEEE ICKII 2018)
Abstract
:Dual-emission nanosensor for Hg2+ detection was prepared by coupling CA-AEAPMS on the surface of RBS-doped modified silica microspheres. The CA-AEAPMS was synthesized by using N-(β-aminoethyl)-γ-aminopropyl methyldimethoxysilane (AEAPMS) and citric acid as the main raw material. The obtained nanosensor showed characteristic fluorescence emissions of Rhodamine B (red) and CA-AEAPMS (blue) under a single excitation wavelength (360 nm). Upon binding to Hg2+, only the fluorescence of CA-AEAPMS was quenched, resulting in the ratiometric fluorescence response of the dual-emission silica microspheres. This ratiometric nanosensor exhibited good selectivity to Hg2+ over other metal ions, because of the amide groups on the surface of CA-AEAPMS serving as the Hg2+ recognition sites. The ratio of F450/F580 linearly decreased with the increasing of Hg2+ concentration in the range of 0 to 3 × 10⁻⁶ M, and a detection limit was as low as 97 nM was achieved. Then, the addition of three thiol-containing amino acids (Cys, Hcy, GSH) to the quenched fluorescence solution with Hg2+ can restore the fluorescence, and the detection limits of the three biothiols (Cys, Hcy, GSH) are 0.133 μM, 0.086 μM, and 0.123 μM, respectively.
1. Introduction
Mercury is a kind of cumulative harmful metal element known for its excessive toxicity it derives from its high affinity for thiol groups in enzymes and proteins, leading to cell dysfunction and subsequent physical illness. It usually enters the body through the atmosphere and water. Excessive mercury often cause poisoning or various incurable diseases [1,2,3,4,5].
Cysteine (Cys), homocysteine (Hcy), reduced glutathione (GSH), and other biothiols, as the most small bio-thiol molecules in the cell, play important roles in human physiological activities [6,7,8], including intracellular redox reactions, foreign body metabolism, signal transduction, and gene regulation, etc. Reduced glutathione plays a key role in cell growth and redox balance maintaining normal cell function. Abnormal cystine concentrations often lead to diseases such as cancer, Alzheimer’s disease, and cardiovascular disease [9,10,11].
Detection and quantification of mercury ions and biothiols such as Cys, Hcy, GSH in biological and environmental samples contribute to monitoring and preventing disease [9,10,11]. Therefore, it is highly desirable to develop relatively inexpensive and reliable methods to detect them. On the other hand, ratiometric fluorescent probes have important applications in ion detection because of their high sensitivity, good selectivity, convenient synthesis, low cost, and wide application range [12,13,14]. Ratiometric fluorescent probes often comprise two kinds of fluorescent substances at different emission wavelengths, thus eliminating the influence of the external environment on the test results, making the results more reliable [15,16,17,18,19,20].
In this paper, dual-emission fluorescent microspheres were prepared using amide-based fluorescent small molecules (CA-AEAPMS) synthesized in our laboratory [21] and RBS (RB-APTES) [22]. A variety of ions were detected using prepared dual-emission fluorescent SiO2 microspheres, and it was found that they can applied to detect Hg2+ and Cys, Hcy, and GSH quickly and sensitively. The detection of Hg2+ is based on its quenching effect on small fluorescent molecules, while the detection of biothiol is due to the interaction of biothiol with Hg2+ over the small fluorescent molecules and the removal of Hg2+ from the surface of the fluorescent microspheres [5], so that the fluorescence of the system can be recovered.
2. Materials and Methods
2.1. Reagents and Materials
N-(β-aminoethyl)-γ-aminopropyl methyl-dimethoxysilane (AEAPMS), anhydrous citric acid (CA), aminopropyltriethoxysilane (APTES), thionyl chloride rhodamine B, tetrahydrofuran, and TEOS and other reagents were purchased from Aladdin (Shanghai, China). Ethanol was purchased from Daliang Town Industrial Park (Tianjin, China). Ammonia was purchased from Kermel (Tianjin, China). Deionized water was used throughout all the experiments.
Fluorescence measurements were performed on a Fluoromax-4 fluorescence spectrometer. Low temperature reaction was recorded in a low-temperature reaction bath DHJF-4005, ultrasonic dispersion in an ultrasound machine KQ3200DB, and centrifugation in a TG16G high-speed centrifuge.
2.2. Preparation of RBS-Doped Silica Microspheres
First, RB-APTES (RBS) was synthesized according to the procedure reported elsewhere [22]. A total of 0.48 g of RB was dissolved in 15 mL of chloroform with stirring the solution and heating to the boiling point of chloroform (61 °C). Next, 0.233 mL of APTES was added to react for 30 min. The obtained product was heated to 70 °C and rotary evaporation crystallization was needed to obtain RBS (RB-APTES) for the next use. Next, 50 mL of absolute ethanol, 2.5 mL of deionized water, and 1.5 mL of ammonia was added to the beaker and stirred for 30 min at room temperature to mix evenly. 1 mL of TEOS (ethyl silicate) and 0.05 g of RBS were slowly added dropwise to the above solution, and the polyethylene film was sealed after the dropwise addition. The mixture was stirred for 6 h, and then was purified by centrifugal washing and drying to obtain RBS-doped fluorescent SiO2 microspheres.
2.3. Preparation of CA-AEAPMS Coated Dual-Emission Silica Microspheres
Next, 0.5 g of anhydrous citric acid was dissolved in 20 mL of tetrahydrofuran, then 0.7 mL of dichlorosulfoxide was added drop-by-drop and the mixture was stirred for 12 h at −5 °C. The resulting product was washed three times with azeotropic purification of hexane and tetrahydrofuran to remove excess dichlorosulfoxide to obtain CA-CL (citric acid chloride). Then, 0.1 g of RBS-doped SiO2 microspheres was dissolved in 50 mL of absolute ethanol. After 5 mL of deionized water, 2 mL of ammonia were added, and the solution was stirred at room temperature for 10 min, then 0.5 mL TEOS was added. After stirring for 30 min, 0.05 mL of AEAPMS was added and stirred for 12 h at room temperature, then centrifuged, washed, and dried to obtain surface-modified fluorescent SiO2 microspheres. The obtained microspheres were ultrasonically dispersed in 50 mL of tetrahydrofuran for 1 h, then added an appropriate amount of CA-CL. The CA-CL reacted with the AEAPMS attached to the surface of the microspheres to form CA-AEAPMS [21]. The mixture was stirred for 6 h, and then was purified by centrifugal washing and drying. The dried fluorescent microspheres were placed in an oven and heated at 115 °C for 2 h to obtain dual-emission fluorescent SiO2 microspheres with overall blue fluorescence.
2.4. Fluorescence Assay of Hg2+
The fluorescence detection was performed in deionized water. Typically, 1.25 mg of dual-emission silica microspheres was redispersed into 5.0 mL of deionized water, which was used as the working solution of ratiometric nanosensor. Hg2+ was added directly to the nanosensor solution and detected on a Fluoromax-4 fluorescence spectrometer. The excitation wavelength for fluorescence measurements was 360 nm.
2.5. Selectivity and Interference Testing
The stock solutions of perchlorate salts (FeCl3·6H2O, HgCl2, CuCl2·2H2O, CoCl3·6H2O, AlCl3, CaCl2, NiCl2·6H2O, ZnCl2, NaCl, KCl, MgCl2, BaCl2, AgCl) were prepared in ultrapure water at the concentration of 10.0 mM. Stock solutions (10 mM) of various anions ions (Br−, I−, CO32−,) were prepared by dissolving their sodium salts in deionized water.
3. Results and Discussion
3.1. Preparation and Characterization of the Dual-Emission Silica Microspheres
The preparation and sensing mechanism of the ratiometric nanosensor are shown in Scheme 1. First, RBS-doped silica microspheres (red) were prepared by using RBS and TEOS by a Stöber method. A thin layer of silica was then coated over the red silica core. There is a spectral overlap between the emission of CA-AEAPMS and the absorption of RBS, and the presence of a silicon shell can effectively isolate the two phosphors from fluorescence resonance energy transfer (FRET) as much as possible. Lastly, CA-CL was reacted with the amino group on the surface of the RBS-doped silica microspheres to form CA-AEAPMS (citric amide). The obtained silica microspheres showed two emission peaks at 450 nm and 580 nm due to the CA-AEAPMS emission and RBS emission.
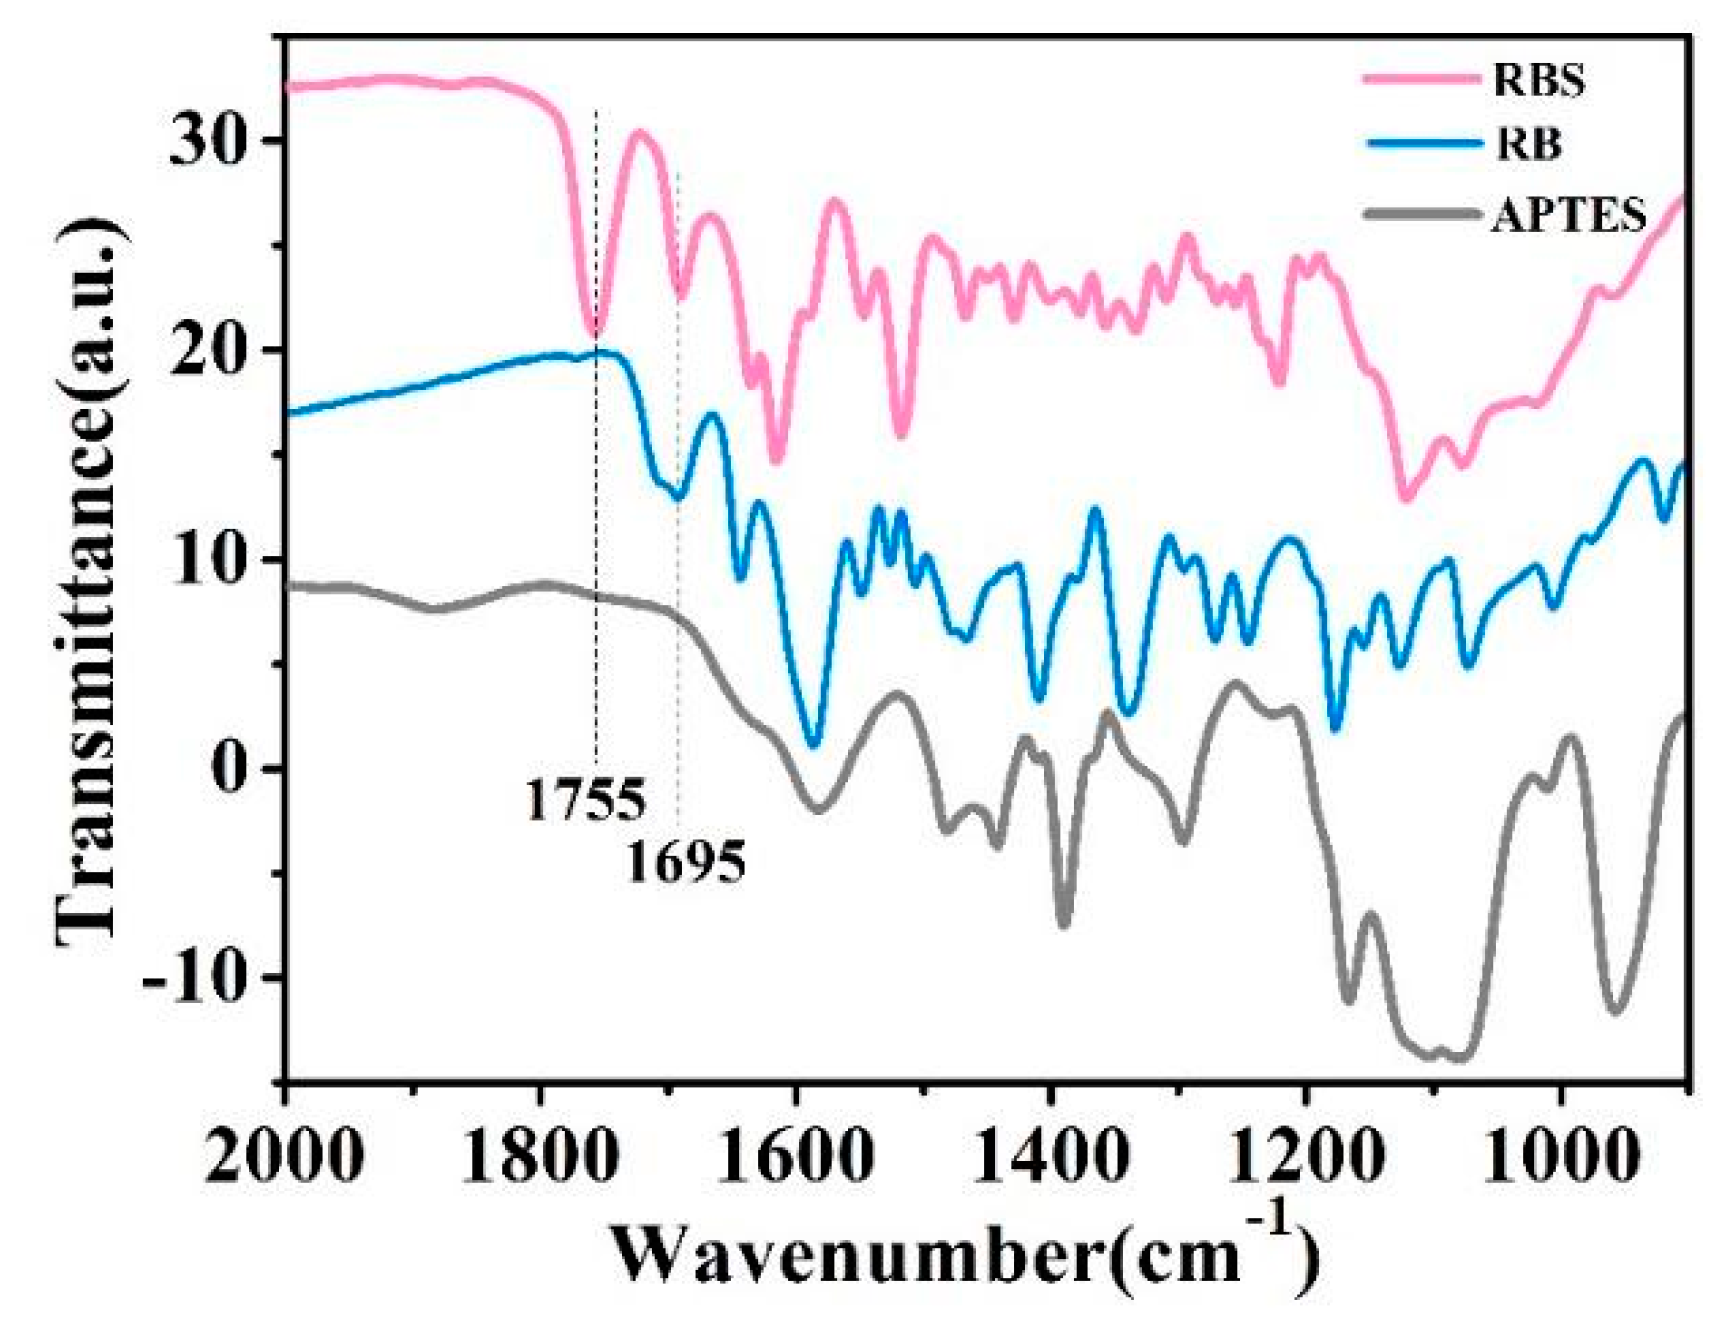
Firstly, the organic dye RBS was structurally characterized. It can be seen from the comparison of the FTIR spectrum in Figure 1 that the carbonyl stretching vibration peak of RB at 1695 cm−1 was converted to 1755 cm−1 after condensation with APTES, which indicates a change of the COOH group of RB to CONH in the product. The 1H NMR spectrum of RBS shown in Figure 2 also illustrates the successful synthesis of RBS.
The SEM results showed that the average diameter of the RBS-doped silica microspheres was about 160 nm (Figure 3a). After the silica microspheres were coated with CA-AEAPMS, the average diameter of the silica microspheres increased to about 200 nm (Figure 3b), suggesting the successful coating of CA-AEAPMS on the surface of RBS-doped silica microspheres.
Thermogravimetric analysis (TGA) in Figure 4 showed that the total weight loss of SiO2 microspheres was about 12% at 35–230 °C; the total weight loss of RBS-doped silica microspheres at 35–800 °C was about 16%; the total weight loss of dual-emission fluorescent microspheres at 35–800 °C was about 28%. The weight loss during heating is basically divided into two stages. The weight loss before 100 °C is mainly the evaporation of water molecules and residual solvents adsorbed on the surface of the microspheres, and the weight loss is less, about 7%. After 100 °C, it is mainly decomposition of doped RBS. The additional 4% weight loss detected by the red fluorescent microspheres can be attributed to the thermal degradation of the organic fluorescent dye RBS in the silica matrix, and the additional 12% weight loss of dual-emission fluorescent microspheres can be attributed to thermal degradation of CA-AEAPMS on the surface of silica.
Figure 5a shows that the prepared RBS-doped silica microspheres have two excitation wavelengths, λex = 360 nm and λex = 560 nm, of which the optimal excitation wavelength λex = 560 nm, and when excited using 360 nm and 560 nm excitation, the wavelengths are all λem = 580 nm [22]. And the absorption peak is around 360 nm. As shown in Figure 5b, the optimal excitation wavelength of CA-AEAPMS is 360 nm, which is consistent with the absorption peak. The emission wavelength at the 360 nm is 450 nm [21]. The fluorescence spectra and absorption spectrum of the dual-emission silica microspheres were shown in Figure 3c. A well-resolved dual emission spectrum was displayed at a single excitation wavelength (360 nm) (Figure 5c, blue line), where CA-AEAPMS emission peak is 450 nm and RBS emission peak is 580 nm, which demonstrated that the CA-AEAPMS was successfully coupled onto the RBS-doped silica microspheres. When dual-emitting fluorescent microspheres were excited with wavelength ranges of 280 nm to 540 nm, the wavelength dependence of the dual-emitting fluorescent microspheres in Figure 5d was obtained. The emission peaks at 450 nm and 580 nm were obtained with the change of excitation wavelength. Thus, we can achieve the control of color of the dual-emitting fluorescent microspheres through adjusting the intensity ratio of two emission peak.
3.2. Fluorescence Detection of Hg2+ and Biothiols Using the Dual-Emission Silica Microspheres
In order to evaluate the selectivity of dual-emission microspheres to Hg2+, the fluorescence intensity ratio (F450/F585) of dual-emission microspheres in the presence of other metal ions and several common anions was compared, such as Fe3+, Hg2+, Cu2+, Co3+, Al3+, Ca2+, Ni2+, Zn2+, Br−, I−, Na+, and K+ were studied under the same conditions. Figure 6 (green bars) shows the fluorescence of the dual-emission fluorescent microspheres is quenched by Hg2+ and Fe3+, and the quenching effect of mercury ions is particularly obvious. In the presence of other ions, the ratio of F450/F585 did not show a significant change compared to the original dual-emission microspheres, indicating good selectivity of the dual-emission microspheres for Hg2+. On this basis, the Hg2+ competitive experiment was carried out, as shown in Figure 6 (red bars), the ratios of F450/F585 decreased greatly, indicating that the presence of these ions have negligible interference with Hg2+ detection and further demonstrated the high specificity of the dual-emission microspheres for Hg2+. Because of the presence of large amount of amino groups on the surface of CA-AEAPMS, Hg2+ can selectively bind to CA-AEAPMS resulting in quenching of the blue fluorescence, and the red fluorescence of the RBS-doped silica core is still present, thereby achieving a ratio of fluorescence response to Hg2+.
We investigated the response of the prepared dual-emission fluorescent microspheres toward different concentrations of Hg2+. The result was shown in Figure 7a. In the absence of Hg2+, two emission peaks at 450 and 580 nm were observed at 360 nm excitation due to the emission of CA-AEAPMS on the surface and the emission of RBS in the core of the silica microspheres, respectively. As the concentration of Hg2+ increases, the blue fluorescence at 450 nm decreased significantly in the range of 0–120 μM, indicating that the fluorescence of CA-AEAPMS was statically quenched by Hg2+, which is due to the complex formed between Hg2+ and amide group [18,19,20] of CA-AEAPMS. The red fluorescence at 580 nm was also found decreased as the concentration of Hg2+ increases, but the degree of reduction is much smaller than that of blue fluorescence.
Figure 7b shows the response of the fluorescence intensity ratio (F450/F585) versus Hg2+ concentration. The ratio of F450/F585 gradually decreased as the concentration of Hg2+ increases, we found that the fluorescence quenching in this system follows the Stern–Volmer equation:
I0/I = 1 + KSV [Q]
In the Stern–Volmer curve shown in Figure 5b, Hg2+ is not suitable for linear calibration over the entire concentration range of 0 to 120 μM. In contrast, Hg2+ can be fitted in the range of I0/I and Hg2+ concentrations ranging from 0 to 30 μM. A linear calibration plot of quantitative analysis with a linear regression equation of I0/I = −0.039 [Hg2+] + 2.031 (μM) (correlation coefficient R2 = 0.99394, n = 7). The higher concentration of Hg2+ deviates from the linearity based on 3δ/m (δ is the standard deviation of the double-emitting fluorescent microsphere signal (n = 7), m is the slope of the linear calibration chart), and the detection limit is 97 nM. Comparison of the present sensor with other existing Hg2+ sensitive probes based on silica was presented in Table 1 [23,24,25,26,27,28]. The results showed the detection limits of our present sensor were comparable and even better than those of other sensors, and the advantage of ratiometric detection is greater.
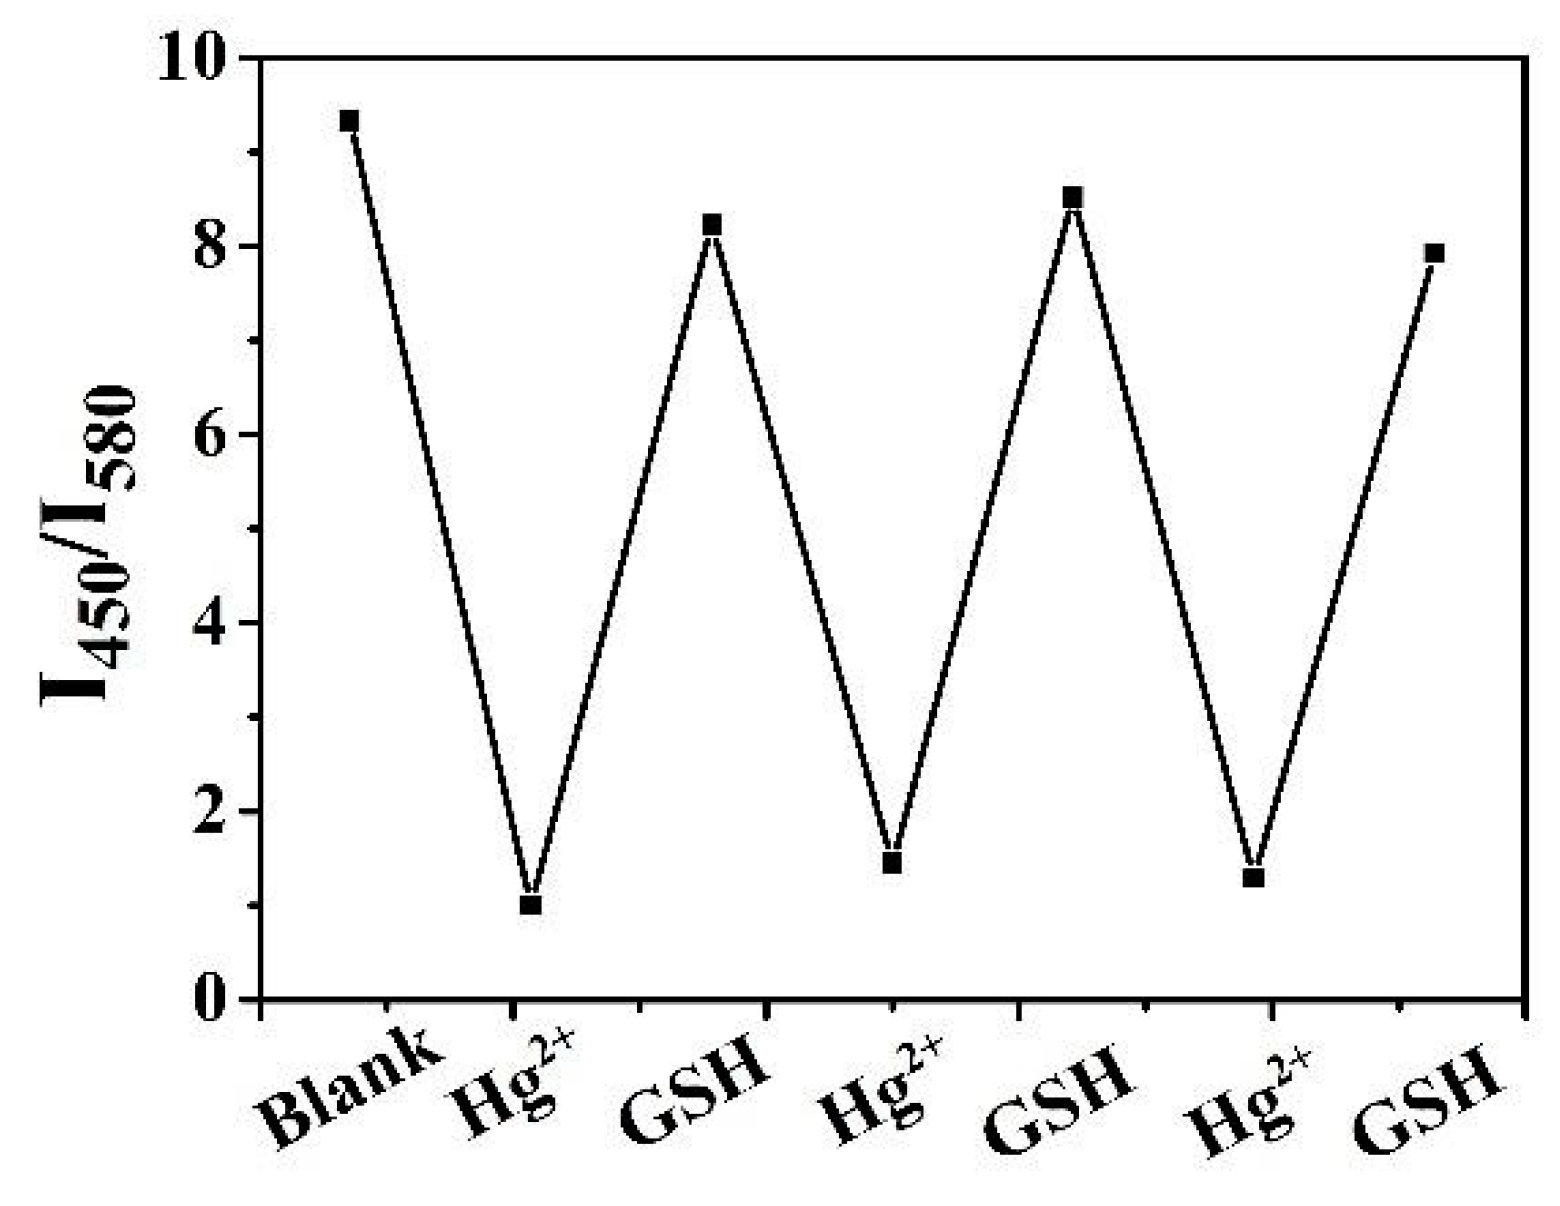
After the addition of Hg2+, the fluorescence was obviously quenched, then Cys, GSH, and Hcy were added to measure the fluorescence intensity of the solution, which are shown in Figure 8a–c. Hg2+ has high ability to bind to sulfhydryl groups in enzymes and proteins, nevertheless there is strong affinity between thiol groups and Hg2+. Therefore, three biothiols can separate Hg2+ from complexes with small molecules to restore fluorescence [5]. It can be seen that as the concentrations of Cys, GSH, and Hcy increase from 0 to 60 μM, the fluorescence intensity of the dual-emission microspheres gradually recovers, which obeys the Stern–Volmer equation. As shown in Figure 8d, the linear regression equation of Cys at 0–25 μM is I0/I = 0.011 [Cys] + 1.354 (μM) (correlation coefficient R2 = 0.99017, n = 6). From Figure 8e, the linear regression equation for GSH at 0–35 μM is I0/I = 0.017 [GSH] + 1.321 (μM) (correlation coefficient R2 = 0.99275, n = 8). In Figure 8f, the linear regression equation for Hcy at 0–25 μM is I0/I = 0.007 [Hcy] + 1.207 (μM) (correlation coefficient R2 = 0.99629, n = 6). At higher concentrations of Cys, Hcy, GSH, and linearity deviation, based on 3δ/m (δ is the standard deviation of the dual-emission fluorescent microsphere signal, m is the slope of the linear calibration chart), Cys, Hcy, GSH detection limits are 0.133 μM, 0.086 μ M, and 0.123 μM, respectively. In general, dual-emission fluorescent microspheres have high sensitivity to Cys, Hcy, and GSH detection. On the basis of this, the microspheres were tested for reusability, and GSH was selected as the removal agent for Hg. As shown in Figure 9, after adding Hg2+ (60 μM), the ratio of F450/F585 was reduced to the initial 78%, and then the same amount of GSH was added, the fluorescence intensity ratio was almost restored to the initial value. Then the solution was centrifuged and washed for cycle detection. The fluorescence of the dual-emission microspheres after three cycles shows excellent reversibility.
4. Conclusions
In summary, a ratiometric fluorescent nanosensor for the detection of Hg2+ and three biothiols has been designed and prepared by coupling CA-AEAPMS on RBS-doped silica microspheres. The obtained fluorescent microspheres exhibit characteristic emissions of RBS and CA-AEAPMS at excitation wavelength (360 nm), and can quench CA-AEAPMS emission when Hg2+ is combined, resulting in a ratio of fluorescence response of Hg2+ in aqueous solution. The selective experiments shows that this ratiometric fluorescence nanosensor is more selective for Hg2+ than other ions. The measurement of Hg2+ is sensitive and simple: the limit of detection down to 97 nM has been achieved and has excellent fluorescence reversibility. At the same time, the addition of three thiol-containing amino acids (Cys, Hcy, GSH) to the quenched fluorescence solution with Hg2+ can restore the fluorescence and detect them, and the detection limits of the three biothiols (Cys, Hcy, GSH) are 0.133 μM, 0.086 μM, and 0.123 μM, respectively.
Author Contributions
Formal analysis, H.Z.; Supervision, R.G.; Writing—original draft, J.W.; Writing—review & editing, R.G.
Funding
This research received no external funding. And The APC was funded by [SJG1110].
Conflicts of Interest
The authors declare no conflict of interest.
References
- Takeuchi, T.; Morikawa, N.; Matsumoto, H.; Shiraishi, Y. A pathological study of Minamata disease in Japan. Acta Neuropathol. 1962, 2, 40–57. [Google Scholar] [CrossRef]
- Mandal, S.; Banerjee, A.; Lohar, S.; Chattopadhyay, A.; Sarkar, B.; Mukhopadhyay, S.K.; Sahana, A.; Das, D. Selective sensing of Hg2+ using rhodamine-thiophene conjugate: Red light emission and visual detection of intracellular Hg2+ at nanomolar level. J. Hazard. Mater. 2013, 261, 198–205. [Google Scholar] [CrossRef] [PubMed]
- Grandjean, P.; Weihe, P.; White, R.F.; Debes, F. Cognitive performance of children prenatally exposed to safe levels of methylmercury. Environ. Res. 1998, 77, 165–172. [Google Scholar] [CrossRef] [PubMed]
- Carvalho, C.M.; Chew, E.H.; Hashemy, S.I.; Lu, J.; Holmgren, A. Inhibition of the human thioredoxin system a molecular mechanism of mercury toxicity. J. Biol. Chem. 2008, 283, 11913–11923. [Google Scholar] [CrossRef] [PubMed]
- Harada, M. Minamata disease: Methylmercury poisoning in Japan caused by environmetal pollution. Crit. Rev. Toxicol. 1995, 25, 1–24. [Google Scholar] [CrossRef] [PubMed]
- Yang, Y.; Huo, F.; Yin, C.; Zheng, A.; Chao, J.; Li, Y.; Nie, Z.; Martínez-Mánez, R.; Liu, D. Thiol–chromene click chemistry: A coumarin-based derivative and its use as regenerable thiol probe and in bioimaging applications. Biosens. Bioelectron. 2013, 47, 300–306. [Google Scholar] [CrossRef] [PubMed]
- Xu, J.; Yu, H.; Hu, Y.; Chen, M.; Shao, S. A gold nanoparticle-based fluorescence sensor for high sensitive and selective detection of thiols in living cells. Biosens. Bioelectron. 2016, 75, 1–7. [Google Scholar] [CrossRef] [PubMed]
- Paulsen, C.E.; Carroll, K.S. Cysteine-mediated redox signaling: Chemistry, biology, and tools for discovery. Chem. Rev. 2013, 113, 4633–4679. [Google Scholar] [CrossRef] [PubMed]
- Jung, H.S.; Chen, X.; Kim, J.S.; Yoon, J. Recent progress in luminescent and colorimetric chemosensors for detection of thiols. Chem. Soc. Rev. 2013, 42, 6019–6031. [Google Scholar] [CrossRef] [PubMed]
- Gao, X.; Li, X.; Li, L.; Zhou, J.; Ma, H. A simple fluorescent off–on probe for the discrimination of cysteine from glutathione. Chem. Commun. 2015, 51, 9388–9390. [Google Scholar] [CrossRef] [PubMed]
- Guo, Z.; Nam, S.; Park, S.; Yoon, J. A highly selective ratiometric near-infrared Fluorescent cyanine sensor for cysteine with remarkable shift and its application in bioimaging. Chem. Sci. 2012, 3, 2760–2765. [Google Scholar] [CrossRef]
- Li, H.; Fan, J.; Peng, X. Colourimetric and fluorescent probes for the optical detection of palladium ions. Chem. Soc. Rev. 2013, 42, 7943–7962. [Google Scholar] [CrossRef] [PubMed]
- Du, J.; Hu, M.; Fan, J.; Peng, X. Fluorescent chemodosimeters using mild chemical events for the detection of small anions and cations in biological and environmetal media. Chem. Soc. Rev. 2012, 41, 4511–4535. [Google Scholar] [CrossRef] [PubMed]
- Jun, M.E.; Roy, B.; Ahn, K.H. Turn-on fluorescent sensing with reactive probes. Chem. Commun. 2011, 47, 7583–7601. [Google Scholar] [CrossRef] [PubMed]
- Andina, D.; Leroux, J.C.; Luciani, P. Ratiometric fluorescent probes to detect reactive oxygen species. Chem.-Eur. J. 2017, 23, 13549–13573. [Google Scholar] [CrossRef] [PubMed]
- Wu, P.; Hou, X.; Xu, J.J.; Chen, H.Y. Ratiometric fluorescence, electrochemiluminescence, and photoelectrochemical chemo/biosensing based on semiconductor quantum dots. Nanoscale 2016, 8, 8427–8442. [Google Scholar] [CrossRef] [PubMed]
- Lee, M.H.; Kim, J.S.; Sessler, J.L. Small molecule-based ratiometric fluorescence probes for cations anions, and biomolecules. Chem. Soc. Rev. 2018, 44, 4185–4191. [Google Scholar] [CrossRef] [PubMed]
- Ermakova, E.; Michalak, J.; Meyer, M.; Arslanov, V.; Tsivadze, A.; Guilard, R.; Bessmertnykh-Lemeune, A. Colorimetric Hg2+ sensing in water: From molecules toward low-cost solid devices. Org. Lett. 2013, 15, 662–665. [Google Scholar] [CrossRef] [PubMed]
- Yang, Y.; Feng, Y.; Wang, Y.Z.; Qiu, F.Z. A novel ratiometric fluorescent probe for selective detection of Hg2+, Cr3+ and Al3+ and its bioimaging application in living cells. Sens. Actuators B 2017, 253, 1055–1062. [Google Scholar] [CrossRef]
- Yang, Y.; Shen, R.; Wang, Y.Z.; Qiu, F.Z.; Feng, Y. A selective turn-on fluorescent sensor for Hg (II) in living cells and tissues. Sens. Actuators B 2018, 255, 3479–3487. [Google Scholar] [CrossRef]
- Sun, L. Synthesis and Characterization of Polyamido-Based Fluorescent Small Molecules. Master’s Thesis, University of Jinan, Jinan, China, 2016. [Google Scholar]
- Nedelčev, T.; Račko, D.; Krupa, I. Preparation and characterization of a new derivative of rhodamine B with an alkoxysilane moiety. Dyes Pigment. 2008, 76, 550–556. [Google Scholar] [CrossRef]
- Guo, X.; Li, B.; Zhang, L.M.; Wang, Y.H. Highly selective fluorescent chemosensor for detecting Hg(II) in water based on pyrene functionalized core–shell structured mesoporous silica. J. Lumin. 2012, 132, 1729–1734. [Google Scholar] [CrossRef]
- Wang, Y.Y.; Tang, M.Y.; Shen, H.; Che, G.B.; Qiao, Y.; Liu, B.; Wang, L. Recyclable multifunctional magnetic mesoporous silica nanocomposite for ratiometric detection, rapid adsorption, and efficient removal of Hg(II). ACS Sustain. Chem. Eng. 2018, 6, 1744–1752. [Google Scholar] [CrossRef]
- Zarabadi-Poor, P.Z.; Badiei, A.; Yousefi, A.A.; Barroso-Flores, J. Selective optical sensing of Hg (II) in aqueous media by H-Acid/SBA-15: A combined experimental and theoretical study. J. Phys. Chem. 2013, 117, 9281–9289. [Google Scholar] [CrossRef]
- Zhang, N.B.; Xu, J.J.; Xue, C.G. Core–shell structured mesoporous silica nanoparticles equipped with pyrene-based chemosensor: Synthesis, characterization, and sensing activity towards Hg (II). J. Lumin. 2011, 131, 2021–2025. [Google Scholar] [CrossRef]
- Rameshkumar, P.; Manivannan, S.; Ramaraj, R. Silver nanoparticles deposited on amine-functionalized silica spheres and their amalgamation-based spectral and colorimetric detection of Hg (II) ions. J. Nanopart. Res. 2013, 15, 1639. [Google Scholar] [CrossRef]
- Liu, B.Y.; Zeng, F.; Wu, G.F.; Wu, S.Z. A FRET-based ratiometric sensor for mercury ions in water with multi-layered silica nanoparticles as the scaffold. Chem. Commun. 2011, 47, 8913–8915. [Google Scholar] [CrossRef] [PubMed]
Scheme 1.
Schematic illustration of the preparation of dual-emission silica microspheres and reaction with Hg2+ and biothiols.
Scheme 1.
Schematic illustration of the preparation of dual-emission silica microspheres and reaction with Hg2+ and biothiols.

Figure 1.
FTIR spectra of RBS (RB-APTES), RB (rhodamine B) and APTES (aminopropyltriethoxysilane).

Figure 2.
1H NMR spectrum of RBS in CDCl3.

Figure 3.
SEM images of the (a) RBS-doped silica microspheres, and (b) dual-emission silica microspheres.
Figure 3.
SEM images of the (a) RBS-doped silica microspheres, and (b) dual-emission silica microspheres.

Figure 4.
Thermogravimetric analysis (TGA) result of SiO2 microspheres, RBS-doped silica microspheres, and dual-emission fluorescent microspheres.
Figure 4.
Thermogravimetric analysis (TGA) result of SiO2 microspheres, RBS-doped silica microspheres, and dual-emission fluorescent microspheres.

Figure 5.
(a) Fluorescence spectra (blue line), excitation spectrum (red line), and absorption spectrum (black line) of RBS-doped silica microspheres; (b) fluorescence spectra (blue line), excitation spectrum (red line), and absorption spectrum (black line) of CA-AEAPMS; (c) fluorescence spectra (blue line) and absorption spectrum (black line) of dual-emission silica microspheres; (d) fluorescence spectra at different excitation wavelengths of dual-emission silica microspheres.
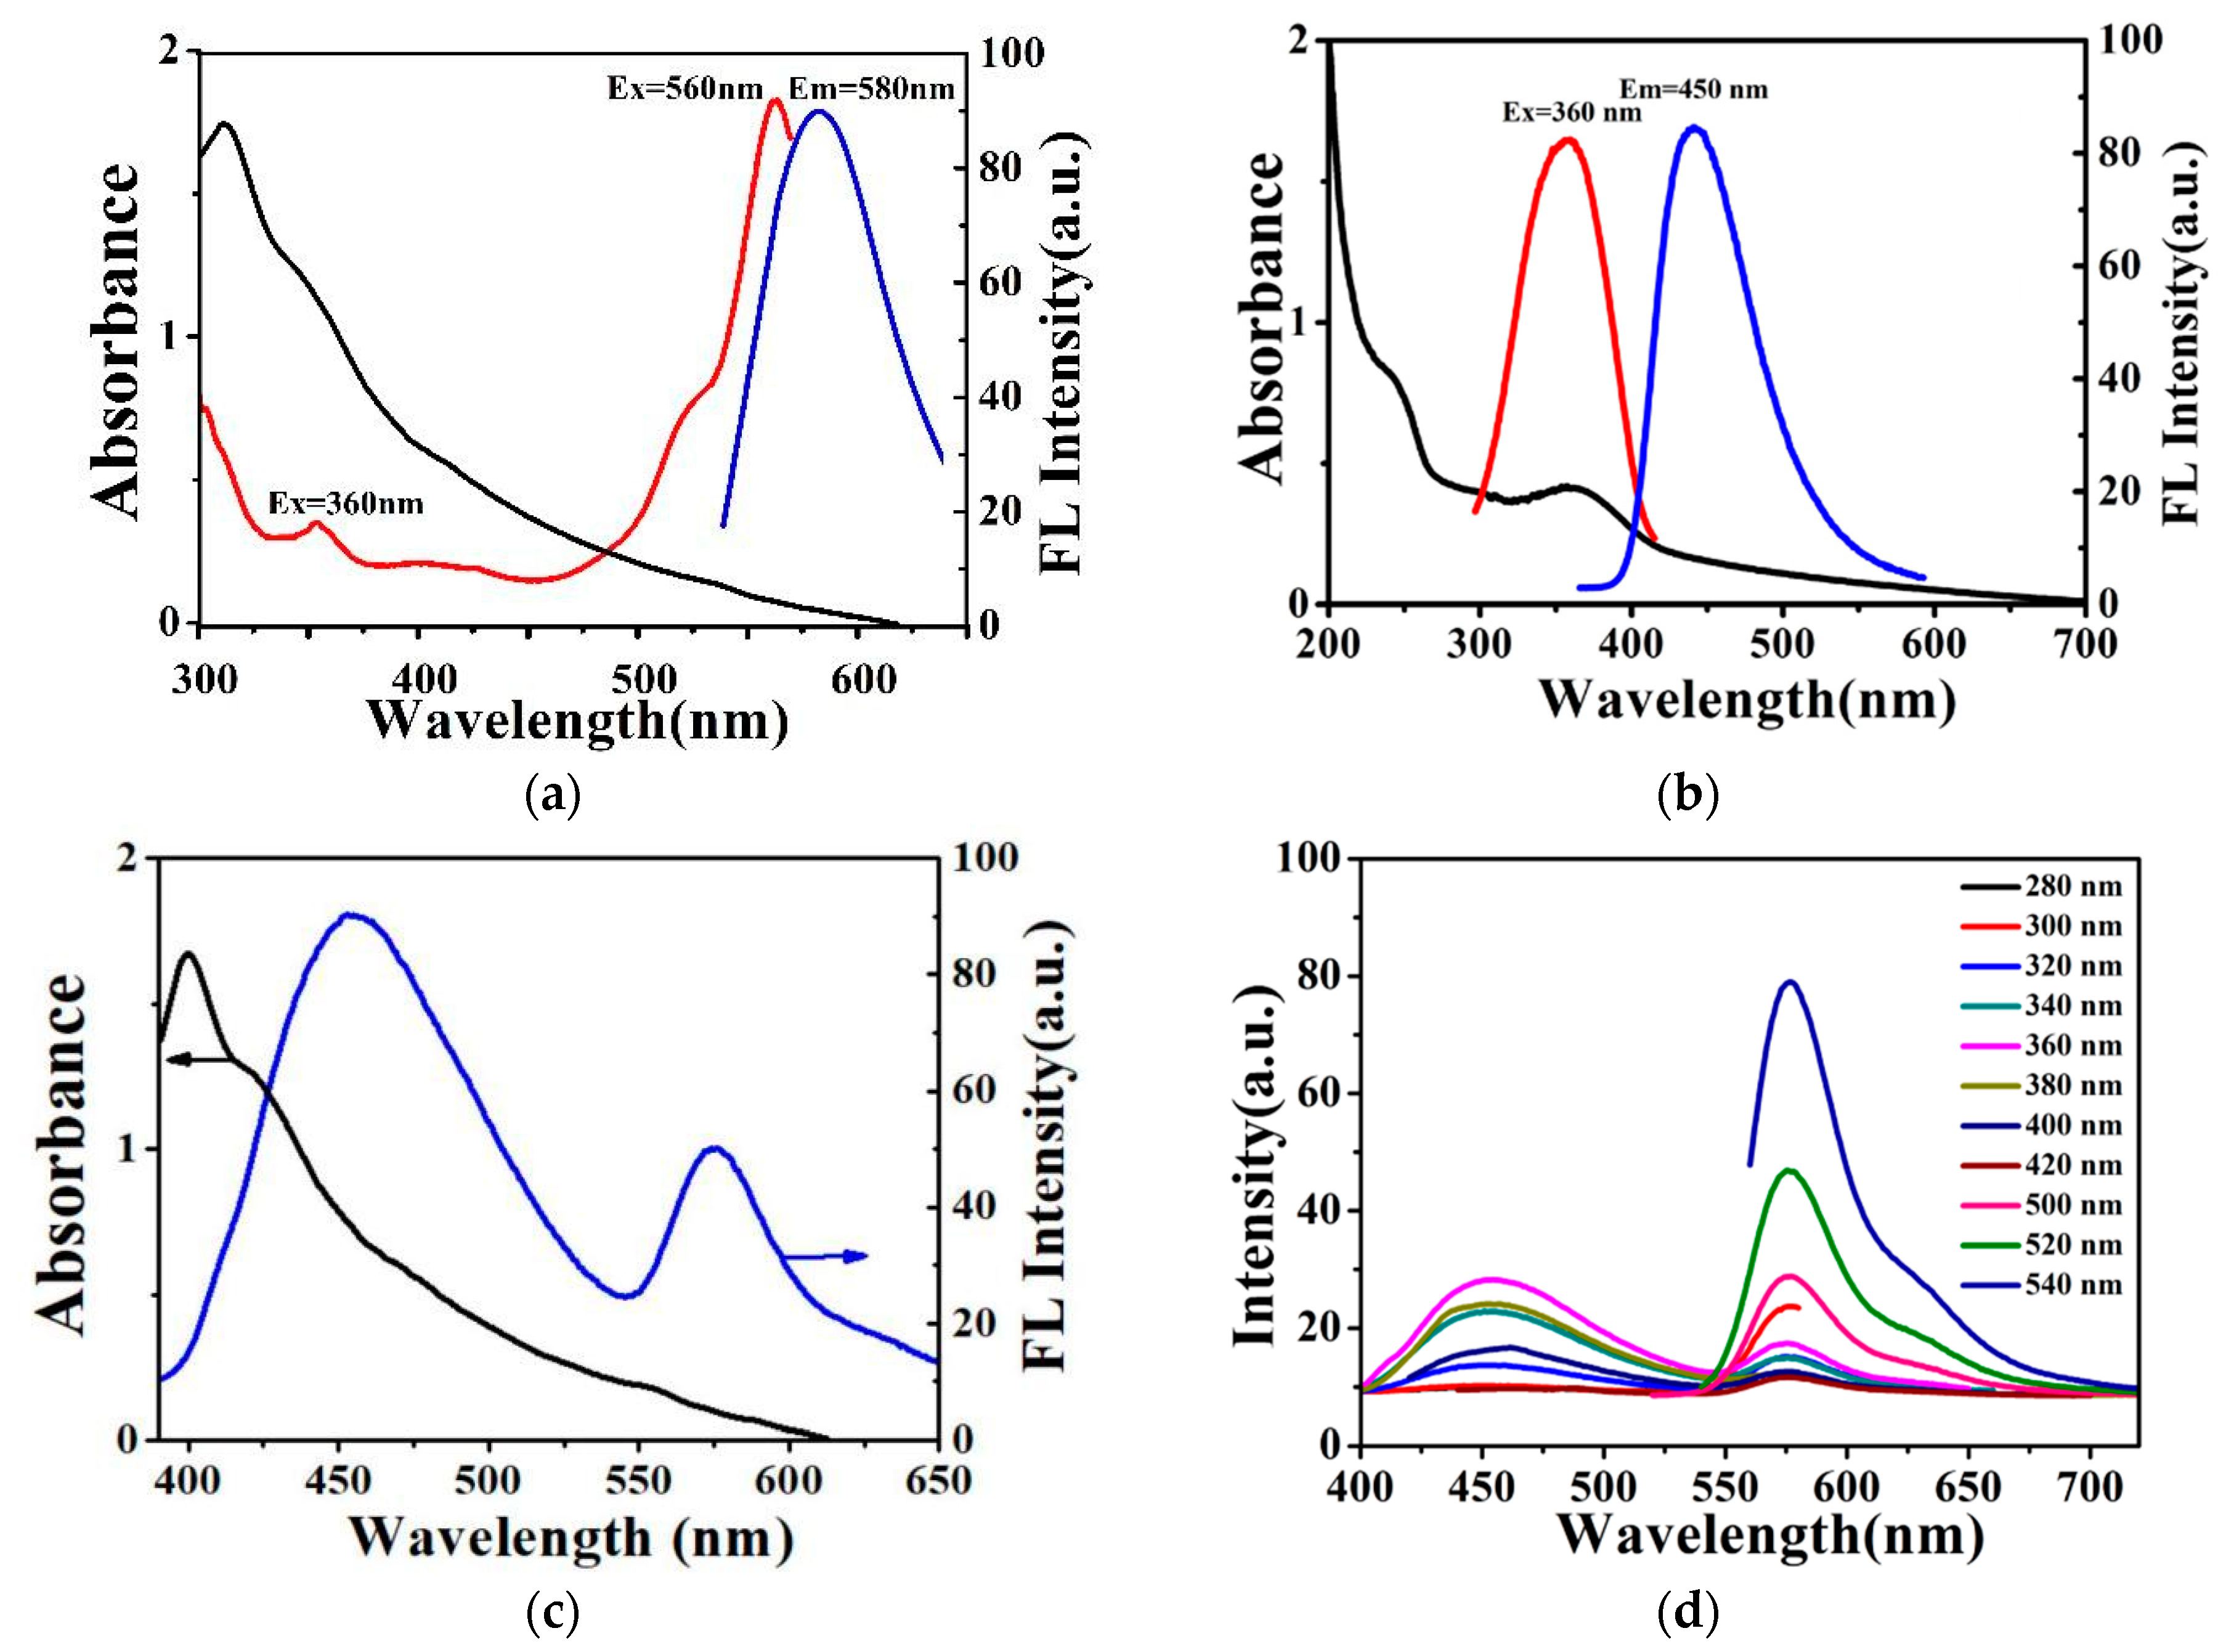
Figure 6.
Fluorescence response of dual-emission microspheres (excited at 360 nm) to various metal ions and several common anions (20 μM, green bars) and the subsequent addition of Hg2+ (20 μM, red bars); 1 is a blank control, and 2 to 17 are Fe3+, Hg2+, Cu2+, Co3+, Al3+, Ca2+, Ni2+, Zn2+, Br−, I−, Na+, K+, CO32−, Mg2+, Ba2+, and Ag+, respectively.

Figure 7.
(a) Fluorescence spectra change of dual-emission silica microspheres upon addition of different concentrations of Hg2+ (excited at 360 nm). The concentration of Hg2+ from 0 to 120 μM; (b) fluorescence intensity ratio of F450/F585 versus Hg2+ concentration. Inset: linear fitting curve of F450/F585 versus a different concentration of Hg2+.
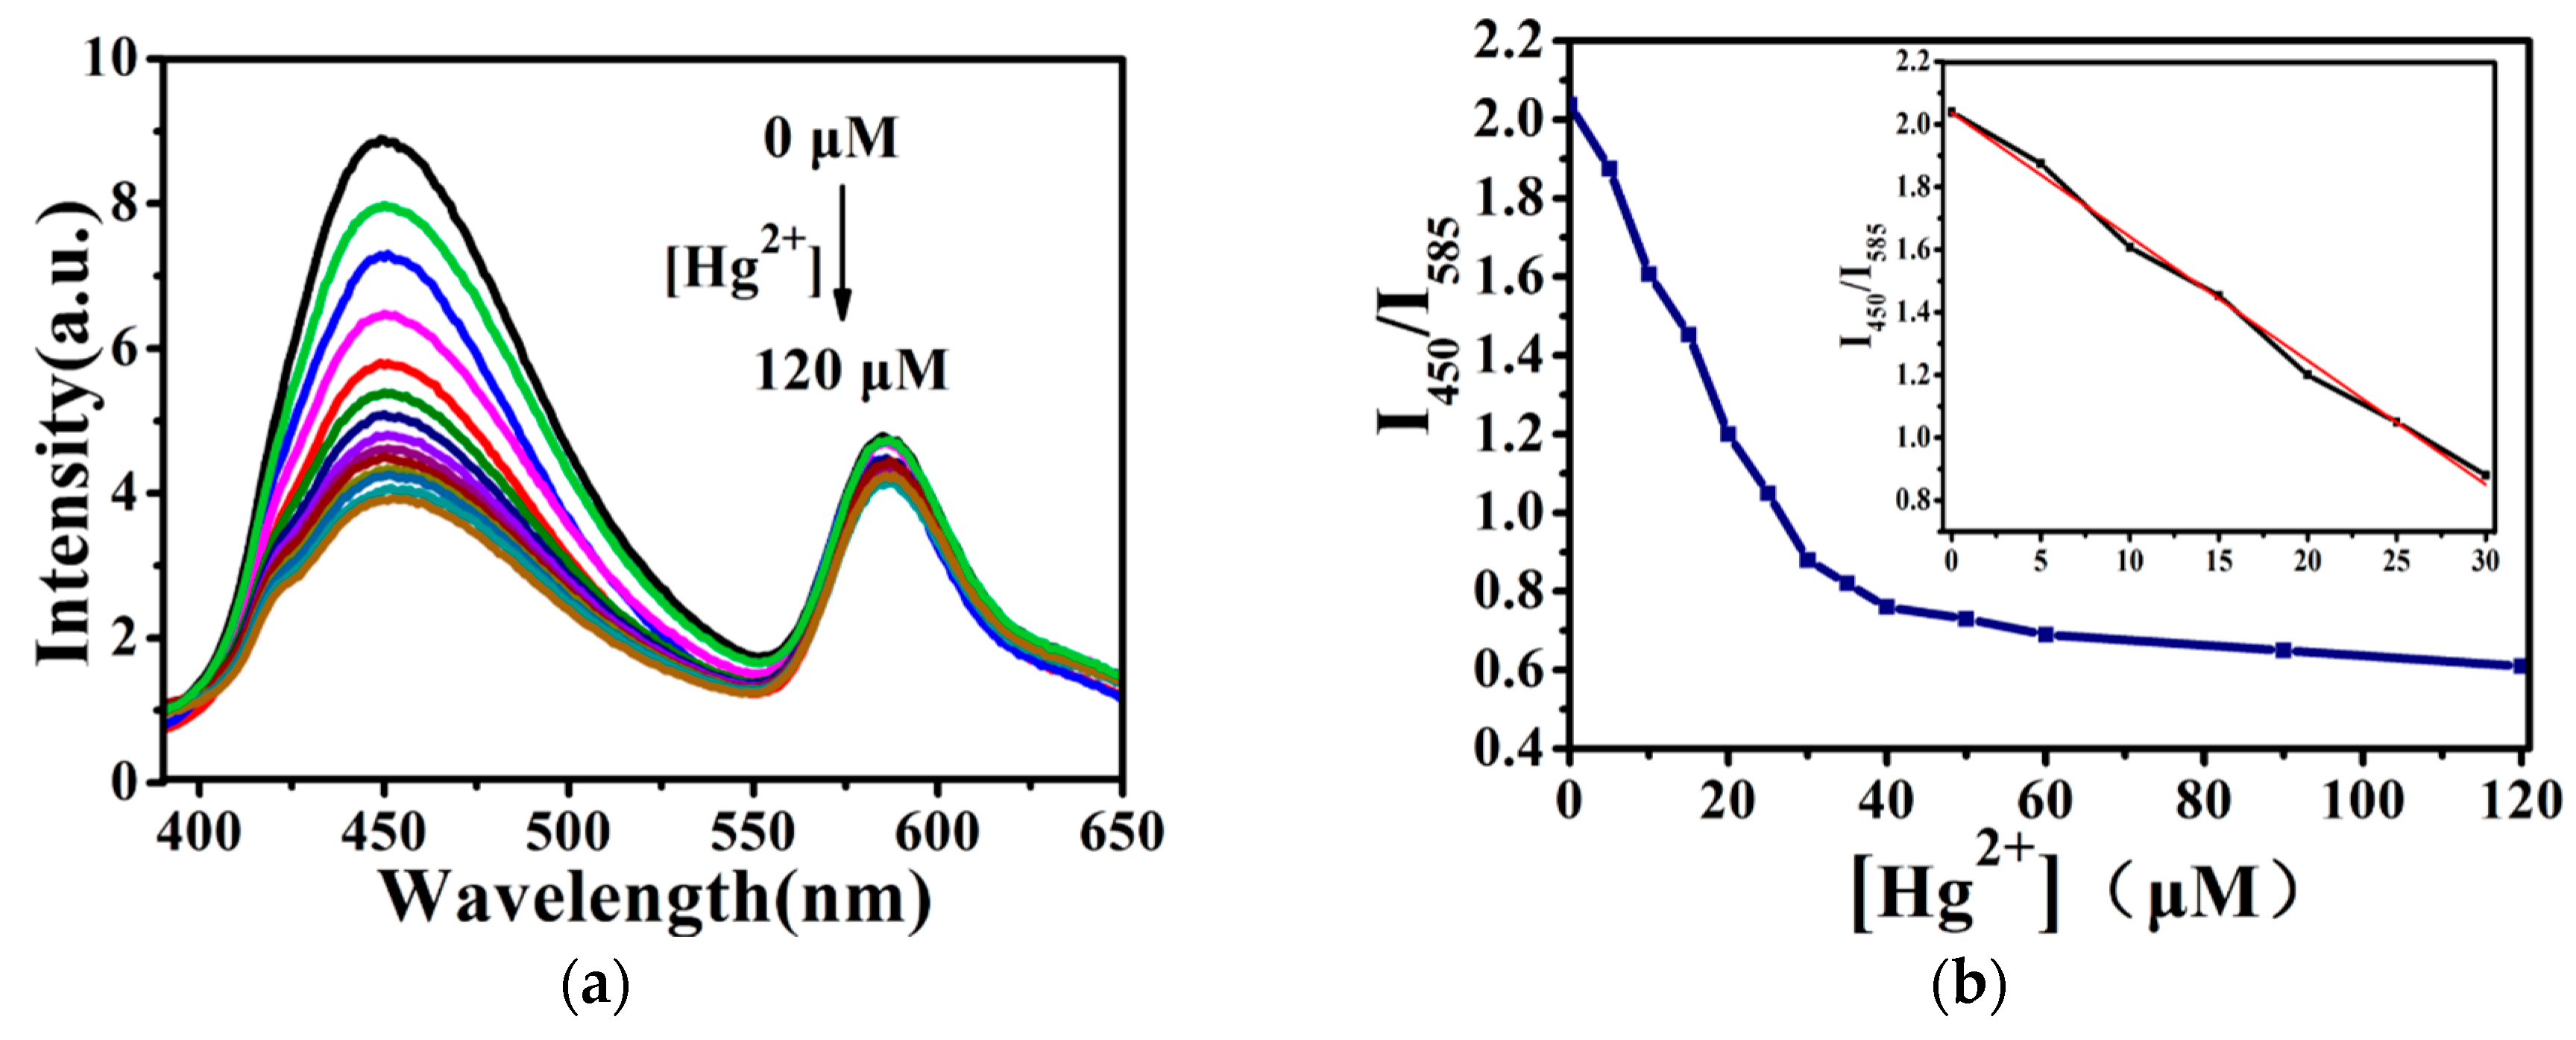
Figure 8.
(a–c) Fluorescence spectra change of dual-emission silica microspheres upon adding different concentrations of Cys, GSH, and Hcy, after adding Hg2+ (excited at 360 nm). The concentration of Cys, GSH, and Hcy from 0 to 60 μM; (d–f) Fluorescence intensity ratio of F450/F580 versus the concentration of Cys, GSH, and Hcy. Inset: linear fitting curve of F450/F580 versus different concentration of Cys, GSH, and Hcy.


Figure 9.
Reversibility of the dual-emission silica microspheres in deionized water by introducing equivalent mole of Hg2+ and GSH.
Figure 9.
Reversibility of the dual-emission silica microspheres in deionized water by introducing equivalent mole of Hg2+ and GSH.


Table 1.
Comparison among silica-based sensors for detection of Hg2+.
| Materials | Detection Limit | Ref. |
|---|---|---|
| SiO2@mSiO2/Py-Si | 1.1 × 10⁻⁸ | [23] |
| QDs-MMS-Rh6G | 2.5 × 10⁻⁹ | [24] |
| SBA-15-HA | 2.1 × 10⁻⁷ | [25] |
| mesoporous silica nanoparticles | 1 × 10⁻⁸ | [26] |
| SiO2/AgNPs | 5 × 10⁻⁶ | [27] |
| SRhB-NH2 | 5 × 10⁻⁷ | [28] |
| dual-emission silica microspheres | 9.7 × 10⁻⁸ | This work |
© 2018 by the authors. Licensee MDPI, Basel, Switzerland. This article is an open access article distributed under the terms and conditions of the Creative Commons Attribution (CC BY) license (http://creativecommons.org/licenses/by/4.0/).
Share and Cite
MDPI and ACS Style
Wang, J.; Zhang, H.; Guan, R. Dual-Emission Fluorescent Microspheres for the Detection of Biothiols and Hg2+. Materials 2018, 11, 2232. https://doi.org/10.3390/ma11112232
AMA Style
Wang J, Zhang H, Guan R. Dual-Emission Fluorescent Microspheres for the Detection of Biothiols and Hg2+. Materials. 2018; 11(11):2232. https://doi.org/10.3390/ma11112232
Chicago/Turabian StyleWang, Jiahui, Hao Zhang, and Ruifang Guan. 2018. "Dual-Emission Fluorescent Microspheres for the Detection of Biothiols and Hg2+" Materials 11, no. 11: 2232. https://doi.org/10.3390/ma11112232
Note that from the first issue of 2016, this journal uses article numbers instead of page numbers. See further details here.