Article

Electrochemical Comparison of SAN/PANI/FLG and ZnO/GO Coated Cast Iron Subject to Corrosive Environments

1
School of Chemical & Material Engineering (SCME), National University of Engineering & Technology (NUST), Islamabad 46000, Pakistan
2
NanoCorr, Energy & Modelling (NCEM) Research Group, Department of Design & Engineering, Bournemouth University, Poole BH12 5BB, UK
3
Renewable Energy Engineering (REE), U.S-Pakistan Center for Advance Studies in Energy (USPCAS-E), University of Engineering and Technology Peshawar, Khyber Pakhtunkhwa 25120, Pakistan
*
Author to whom correspondence should be addressed.
Materials 2018, 11(11), 2239; https://doi.org/10.3390/ma11112239
Submission received: 24 September 2018 / Revised: 8 November 2018 / Accepted: 9 November 2018 / Published: 11 November 2018

Abstract

:
ZnO/GO (Graphene Oxide) and SAN (Styrene Acrylonitrile)/PANI (Polyaniline)/FLG (Few Layers Graphene) nanocomposite coatings were produced by solution casting and sol-gel methods, respectively, to enhance corrosion resistance of ferrous based materials. Corrosive seawater and ‘produced crude oil water’ environments were selected as electrolytes for this study. Impedance and coating capacitance values obtained from Electrochemical Impedance Spectroscopy (EIS) Alternating Current (AC technique) showed enhanced corrosion resistance of nanocomposites coatings in the corrosive environments. Tafel scan Direct Current (DC technique) was used to find the corrosion rate of nanocomposite coating. SAN/PANI/FLG coating reduced the corrosion of bare metal up to 90% in seawater whereas ZnO/GO suppressed the corrosion up to 75% having the impedance value of 100 Ω. In produced water of crude oil, SAN/PANI/FLG reduced the corrosion up to 95% while ZnO/GO suppressed the corrosion up to 10%. Hybrid composites of SAN/PANI/FLG coatings have demonstrated better performances compared to ZnO/GO in the corrosive environments under investigation. This study provides fabrication of state-of-the-art novel anti corrosive nanocomposite coatings for a wide range of industrial applications. Reduced corrosion will result in increased service lifetime, durability and reliability of components and system and will in turn lead to significant cost savings.

1. Introduction

Corrosion is an electrochemical phenomenon which leads to severe component, system and structural deteriorations. Various operational conditions lead to corresponding corrosion failure mechanisms such as pitting, crevice, uniform, galvanic and microbial corrosion. Combined with static or dynamic stresses corrosion often leads to corrosion fatigue, fretting and stress corrosion cracking. These damages cause replacement, unscheduled maintenance, reduced capacity, idle time and insurance issues. Various techniques are used to control corrosion, including design modification, inhibitors, cathodic protection, thereby, increasing the cost of maintaining operations. Corrosion also has several economic, health, safety and technological implications [1]. Many industries face huge financial losses due to corrosion-led failures. Researchers have been developing dielectric materials with enhanced corrosion resistance capabilities to both avoid and mitigate corrosion failures within structures and interacting systems. Some researchers have found that hybrid organic and/or inorganic nanocomposite materials are becoming desirable candidate to perform well in corrosive applications.
Few Layers Graphene (FLG) with 5–8 layers of graphene exhibit the promising properties of thermal, chemical and mechanical stability and are also a good charge carrier; this makes them fascinating in various fields of application [2,3,4]. Graphene provides resistance against oxidation while its hydrophobicity resists hydrogen bonding with water. Due to its multiple promising properties, graphene is being extensively explored for various applications including interacting systems and as nano-additives in lubrication. Recently, several studies have reported that graphene coating can effectively isolate the surface from environmental degradation [5,6,7]. Aneja et al. [4] studied functionalized graphene coating to evaluate its barrier and protection properties applied to mild steel.
Water uptake of the coating, its capacitance and pore resistance was obtained by using EIS. Experiments were conducted at various frequencies for a certain time period. Graphene decreased the water uptake and the activation energy peak was increased for water driven diffusivity process constraining the ion movement through the coating. Moreover, the network of functionalized graphene was found to be structurally dense [4]. Similarly, Olad et al. [8] investigated a triple hybrid system of conducting polyaniline, zinc and epoxy to evaluate their corrosion resistant properties when applied to metallic substrates. During this research, 75-micron thick nanocomposite coatings on iron substrate and in a solution of 0.1 M HCl solution were studied. In addition to anti corrosive properties, epoxy and zinc enhanced the mechanical strength of these nanocomposite coatings. Epoxy enhanced the mechanical properties by providing physical hindrance to electrolyte molecules while zinc improved the electrochemical behavior of polyaniline coating.
SAN is copolymer of styrene and acrylonitrile. It helps against corrosion degradation facilitated by its hydrophobicity and provides physical barrier, based on higher diffusion resistance to the corrosive ion [9]. Conducting polymer prevents corrosion with the help of generated electric field that blocks the electrons flow from the metal to external oxidizing agents [10]. Polyaniline is one of the promising polymers for corrosion protection. It is a p-type semiconductor with desirable electrical and chemical properties. Its conductive type contributes significantly to the effective resistance to corrosion.
New trends in the processing of Polyaniline have increased its range of practical applications. It protects against electrochemical decay by forming a thin oxide layer due to the interaction of polymer and metal substrate. It reduces the redox current as well as shifts the corrosion potential towards noble direction as compared to bare metal [11]. ZnO is a wide bandgap inorganic conductor. It belongs to II-VI semiconductor family. It is found in the form of a white colored powder. Its hydrophobicity and ability to shift corrosion potential to noble direction makes it a good candidate for corrosion protection [12,13,14].
In this research novel hybrid nanocomposite coatings of SAN/PANI/FLG and ZnO/GO were synthesized and characterized through various characterizing tools. An electrochemical framework of Gamry® Instruments was used to evaluate the performances of coating systems against corrosion to protect ductile cast iron pipeline in seawater and crude oil produced water. Electrochemical Impedance Spectroscopy (EIS) technique employs a short perturbation AC signals during electrochemical investigation [15,16,17,18,19,
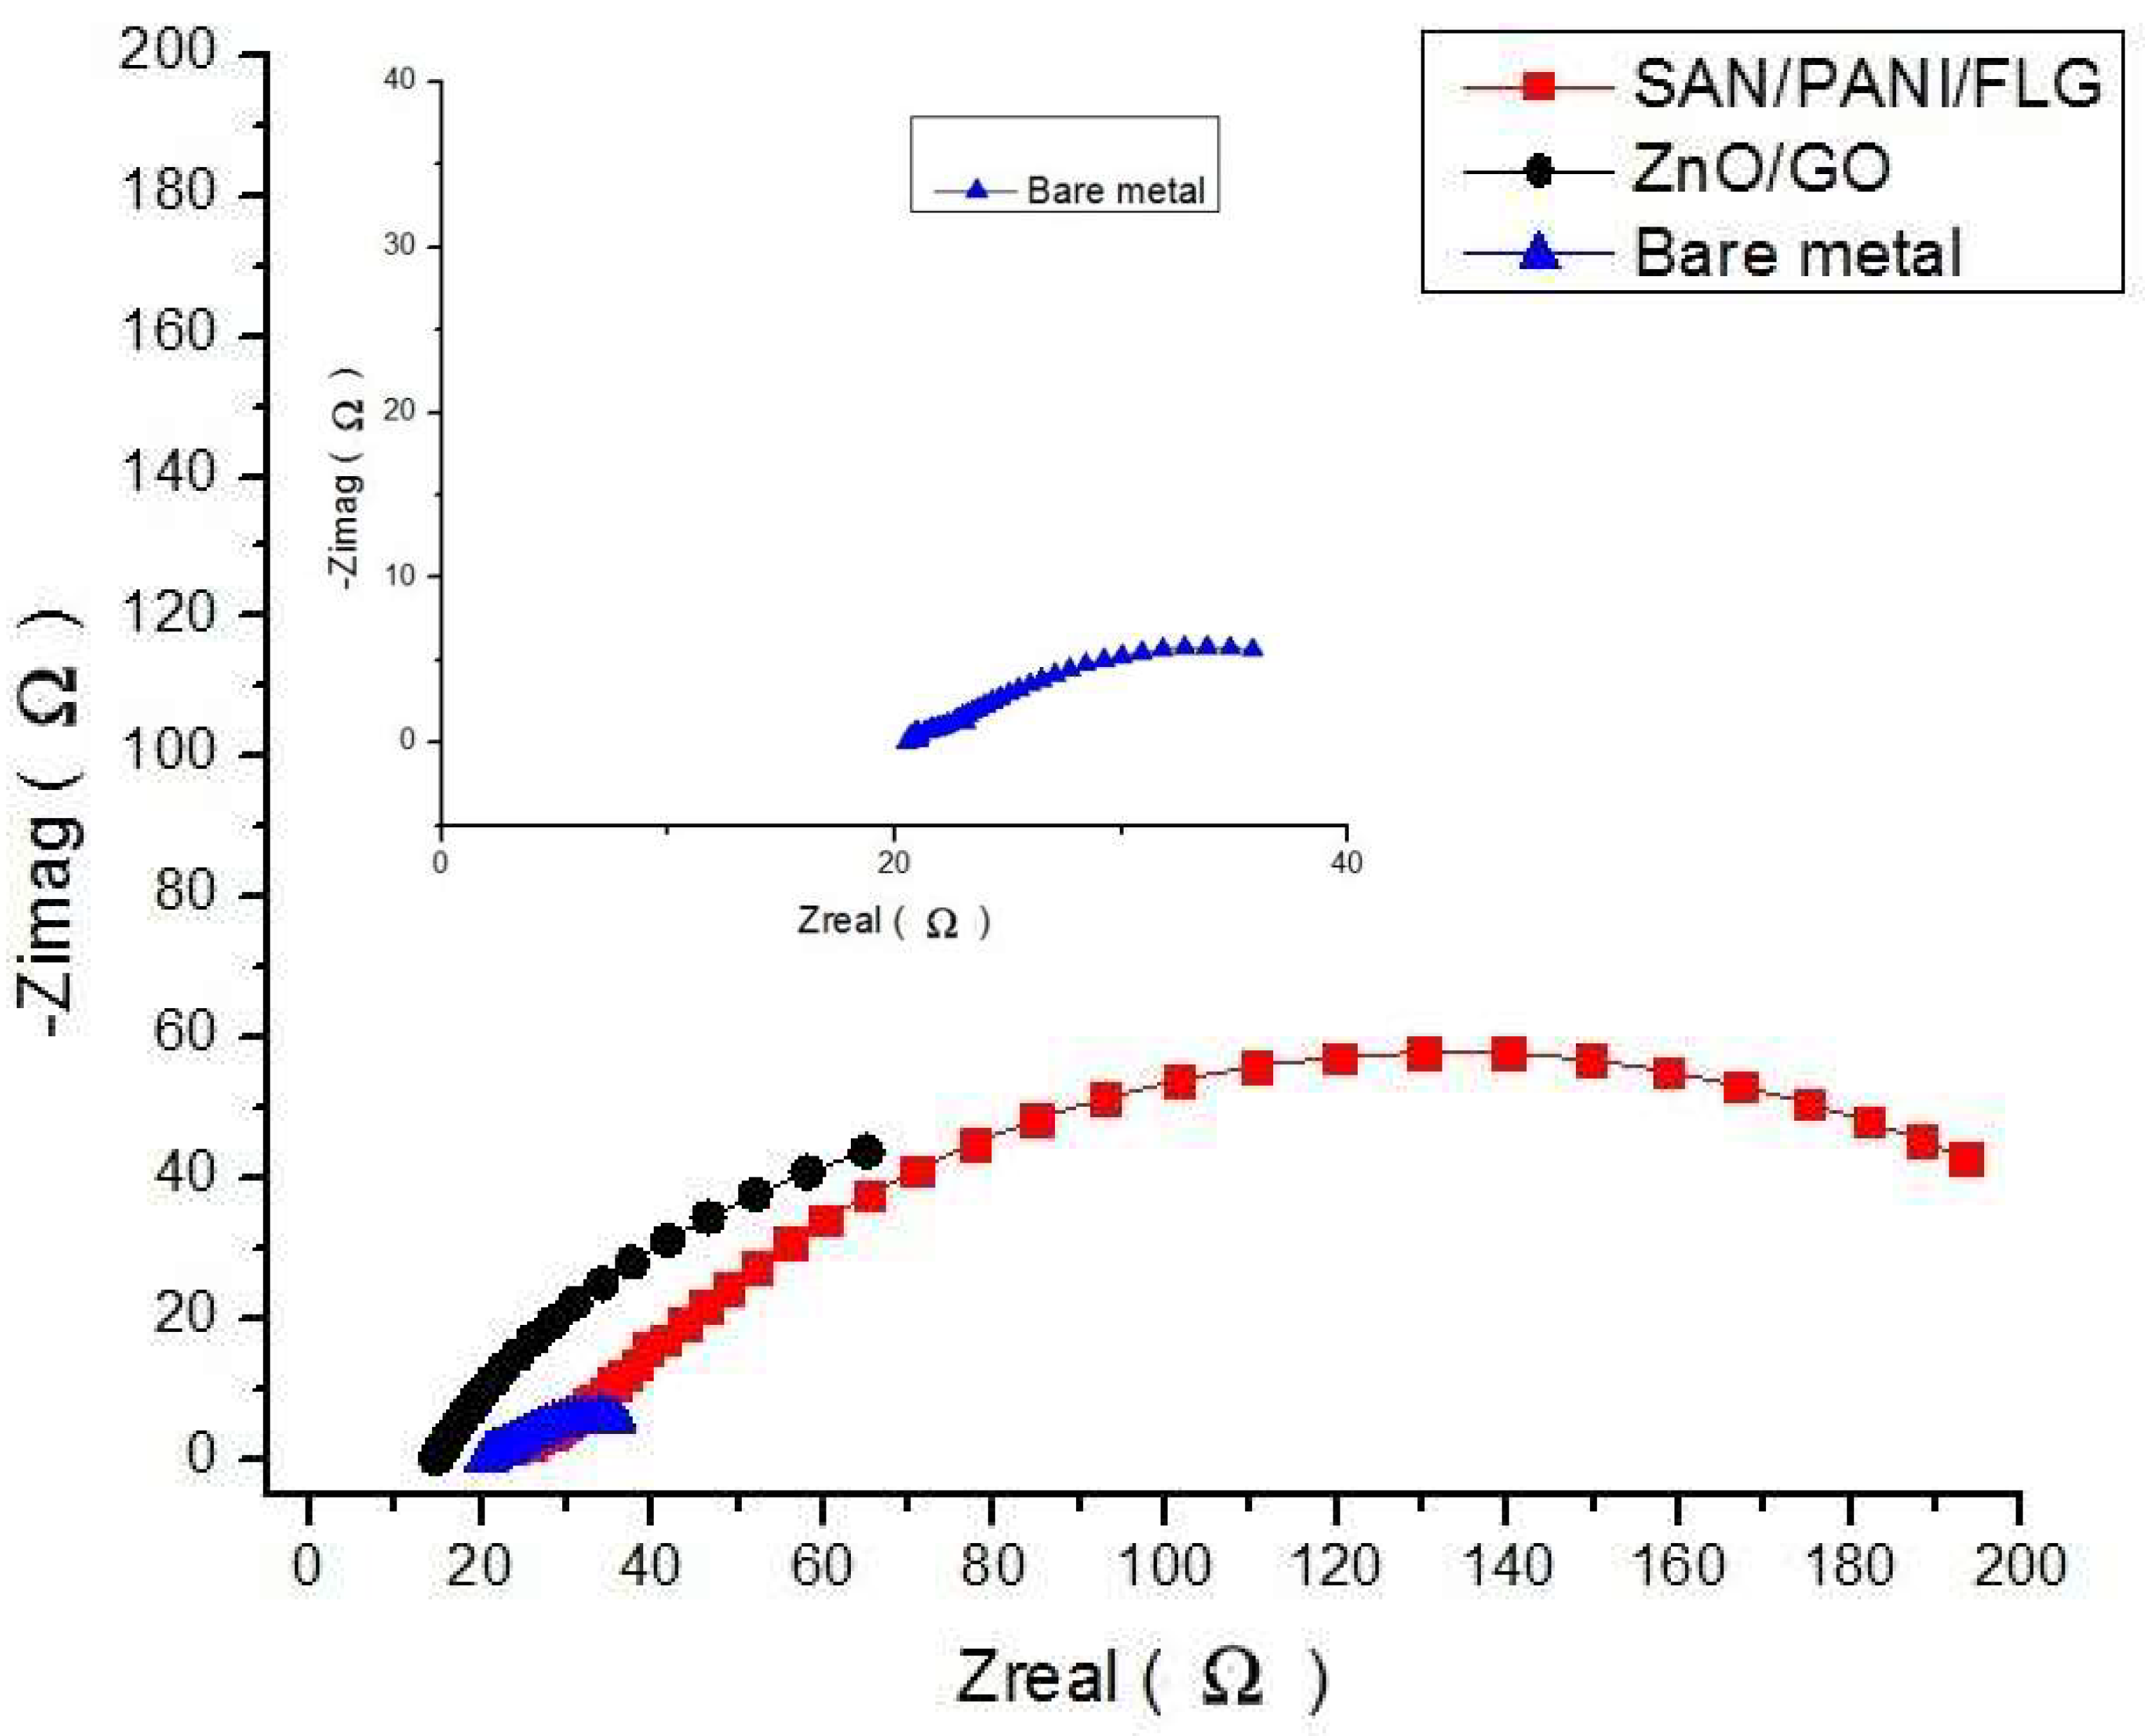
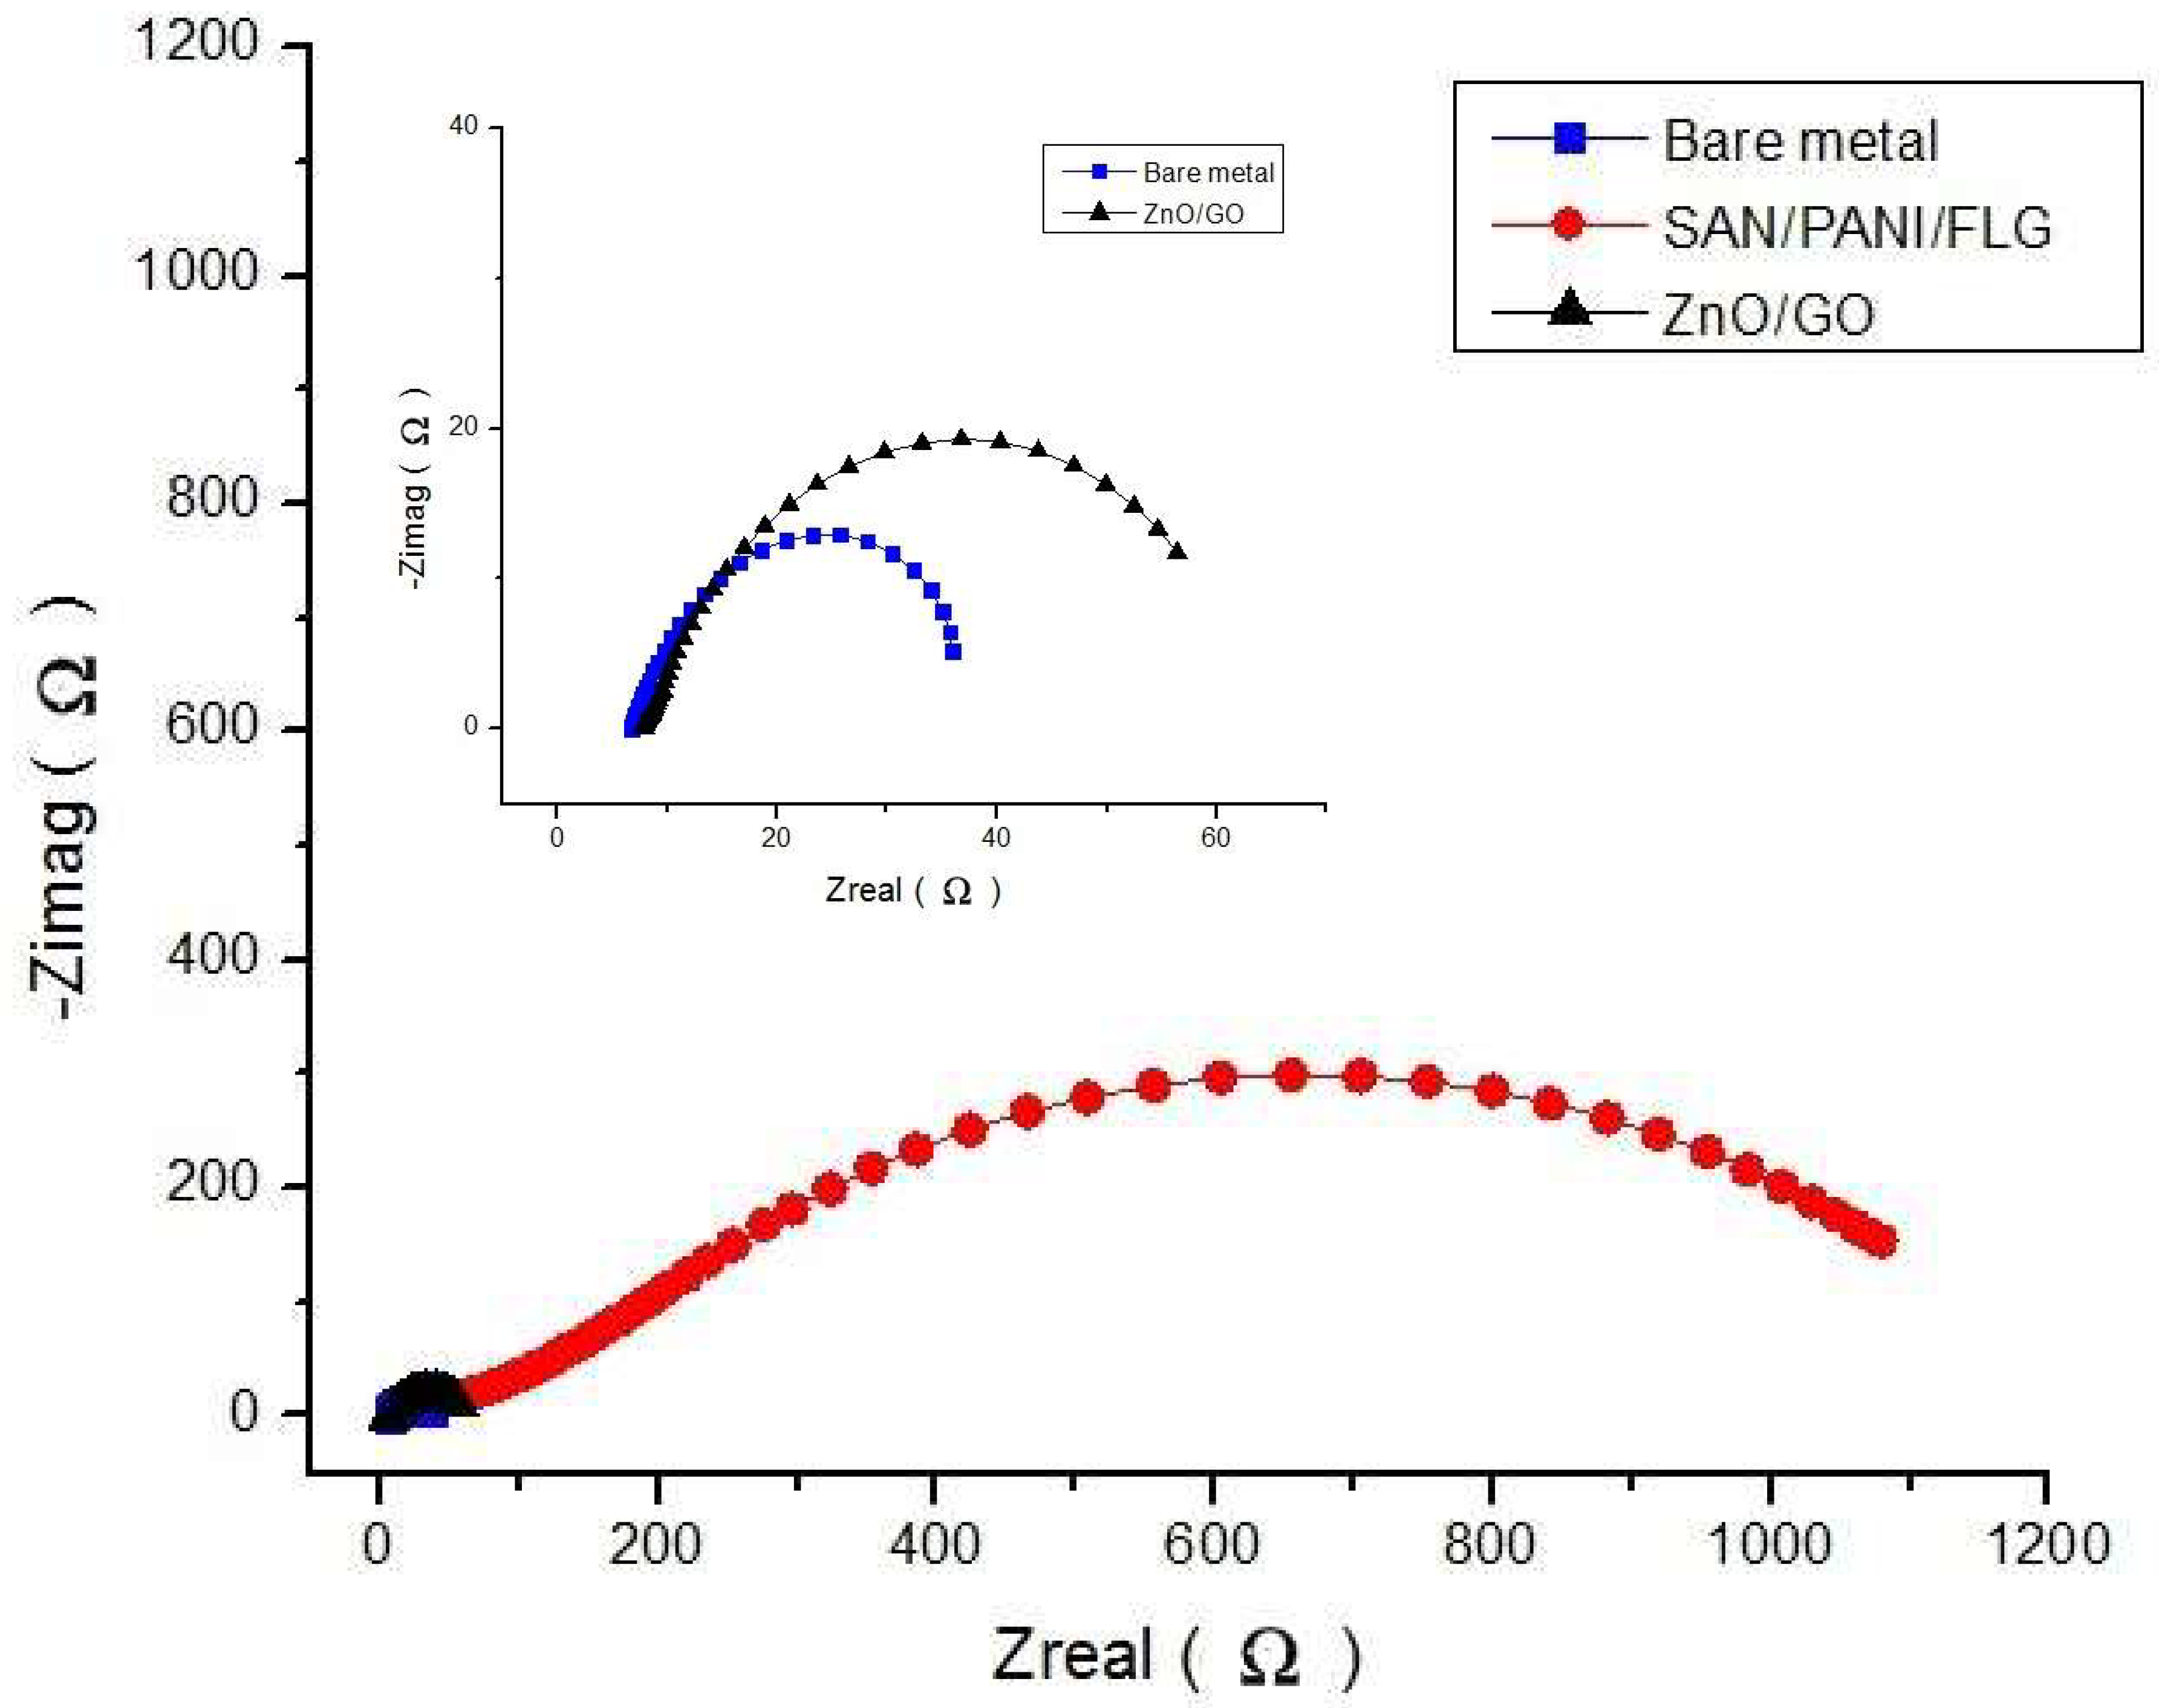
20]. Amplitude of 10 mV AC was applied to investigate the response of system under various frequencies. Corrosion resistance and protection are analyzed by plots Bode and Nyquist generated by EIS. Phase shift and impedance values are plotted against frequency in Bode plot while imaginary frequency is scanned versus real impedance in Nyquist plot. SAN/PANI/FLG performed better in protecting metal samples in aggressive environments against corrosion compared to ceramic ZnO/GO nanocomposite coating.

2. Materials and Methods

2.1. Sample Preparation

Ductile cast iron industrial pipeline samples were used as substrates. Samples were prepared in ~4 × 4 cm2 squared sections. Samples were ground with abrasive paper of 120–320 grades in order to develop a texture for adhesion of nanocomposites coating. Table 1 shows composition of the pipeline cast iron used for study.

2.2. Synthesis of Coating

2.2.1. SAN/PANI/FLG

Table 2 demonstrates materials employed for SAN/PANI/FLG coating.

Preparation of Polyaniline

Chemical oxidation polymerization technique was used to prepare conductive Polyaniline (PANI). 6 g of aniline monomer was mixed in 100 mL deionized water using a vessel fixed with a stirrer and equipped with ice bath for low temperature arrangement. Conductivity of the solution was improved by adding 1 M solution of HCl to obtain aniline hydrochloride; a continuous stirring was ensured during addition. As a surfactant, 1 M solution of Sodium Dodecyl Sulfate (SDS) was added. To start polymerization, 1.2 g APS (Ammonium per sulfate) was dissolved as initiator in a 20 g of deionized water. Gradual addition of the above solution was facilitated using a stirring mechanism while the low temperature (0 °C) was maintained with the help of an ice bath; the mixing continued for one hour. The stirring continued for one a half hour at room temperature. Methanol was used to facilitate precipitation followed by washing using deionized water for multiple times. Final drying was performed in an oven at 50 °C. A green colored PANI powder was the final product. Initially, methanol precipitation was performed. The polymer was then washed by using distilled water, this process of conditioning with distilled was repeated several times. After washing the precipitate, it was dried in an oven at 50 °C. A green colored PANI powder was produced as the final product from the above process.

Preparation of SAN/PANI/FLG Nano Composite

Thin film of nanocomposite coating was prepared through solution casting method. SAN polymer was added to 1,2-dichloroethane and then continuously stirred for 40 min in order to completely dissolve the constituents of the solution. Then PANI was slowly added; and the solution color turned dark green. Solution was probe sonicated and stirred overnight for proper dispersion of PANI. Once the SAN and PANI was completely dissolved, then an appropriate quantity of FLG was added. The solution was then subjected to probe sonication for 45 min to disperse the PANI and FLG. The acquired solution was kept on overnight stirring after which the nanocomposite was ready to coat on the substrate. Mechanical properties of the SAN/PANI/FLG thin film are shown in Table 3.

2.2.2. ZnO/GO Coating

Ceramic coatings were developed on the metallic substrate in two steps: synthesis of (a) ZnO nanoparticles sol gel; (b) ZnO-GO composite sol.
(a) Synthesis of ZnO Nanoparticle Sol Gel
Zinc Acetate Dehydrate (ZnAcDH) was used as a precursor in the synthesis. Isopropanol alcohol was used as the solvent. Ethanol amine was used as stabilizer in a specific amount for the preparation of 0.4 M ZnO sol. It was then stirred until opaque solution turned into transparent one i.e., ZnAcDH was completely dissolved. The resultant solution was left for 24 h for aging. The ingredients are given in the Table 4.
(b) Synthesis of ZnO/GO Composite Sol
A solution containing 0.5 mg/1 mL of graphene oxide in 2-methoxyethanol was formulated and prepared. For proper dispersion of graphene oxide, sonication was performed for 45 min in ultrasonic water bath. Both graphene oxide and ZnO solutions were mixed together. The obtained ZnO nanoparticles had 13 nm to 22 nm size range.

2.3. Dip Coating

Dip coating is a time efficient and most commercially adapted technique for coating purposes. Dip coating process involves five steps: (i) Immersion; (ii) Dwell time; (iii) Deposition; (iv) Drainage; and (v) Evaporation. Samples were dipped in the solution for 3 min. Dwell time was kept 0.5 min to achieve desired thickness. When the solution was properly deposited on the metal samples, the coated samples were then placed in an oven to drive off the solvent from the solution resulting in a meaningful deposition of thin films. Coating thicknesses were kept in a range from 5 to 7 μm, by controlling the process parameter e.g., dwell time etc. using the Landau–Levich equation. Coating thickness was measured by surface profilometry and further manually confirmed by micrometer screw gauge and Landau–Levich equation.

2.4. Electrochemical Testing

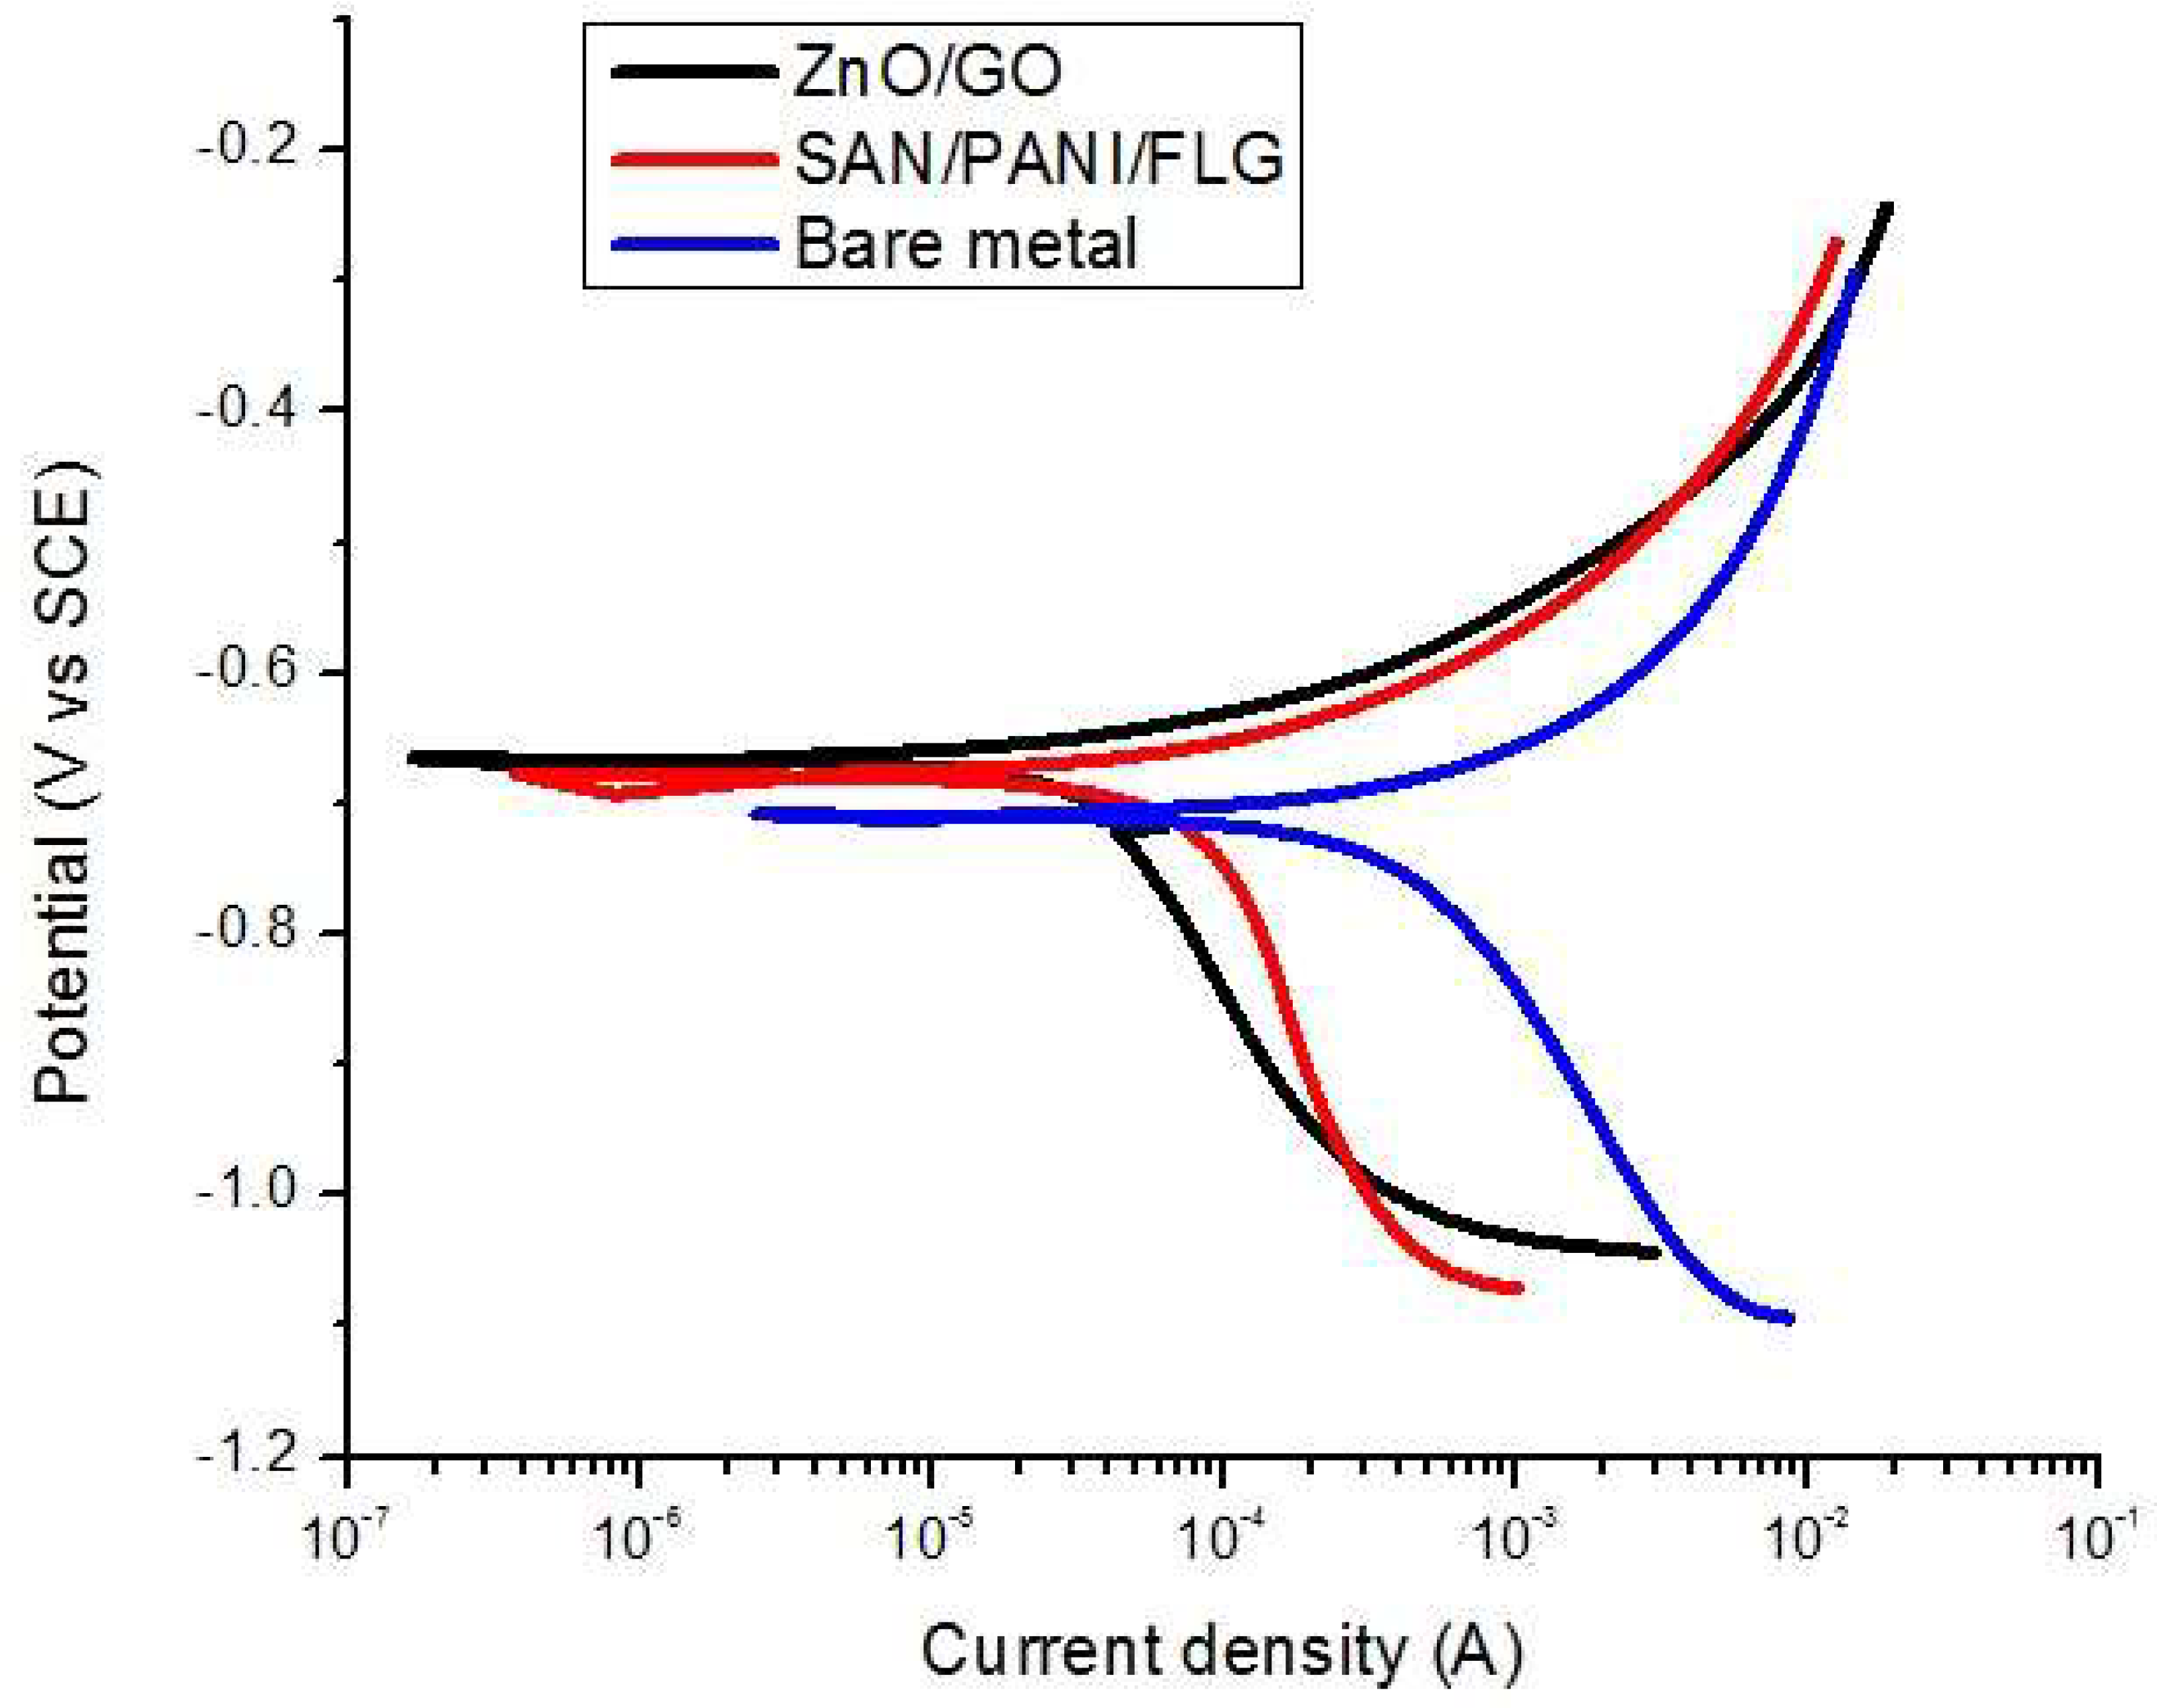
Gamry® framework (Series G-750, Gamry Instruments, Inc., Warminster, PA, USA) equipped with DC corrosion testing as (Gamry Instruments, Inc.) EIS, was employed for all electrochemical measurements. EIS and Tafel scans were conducted by using three-electrode cell. The reference and counter electrodes in the cell were a Saturated Calomel Electrode (SCE) and a graphite rod respectfully. Metal samples of 4 cm × 4 cm dimensions were used. The surfaces were masked using epoxy leaving an exposed area of 3 cm × 3 cm. Two types of corrosive environments were used as electrolytes for investigation: (i) simulated seawater (pH slightly basic (7.9) and conductivity between ≥50 mS/cm); and (ii) a sample of produced water obtained from a local petroleum sector (pH 7.6) and bulk conductivity ~150 µS/cm).

2.5. Equivalent Circuit Modeling

Equivalent circuit model of the cell system with input parameters is shown in Figure 1. It was used for fitting the curves to obtain pore resistance and coating capacitance values of two nanocomposites systems using Reap2cpe model. The determined values are shown in the Table 5.

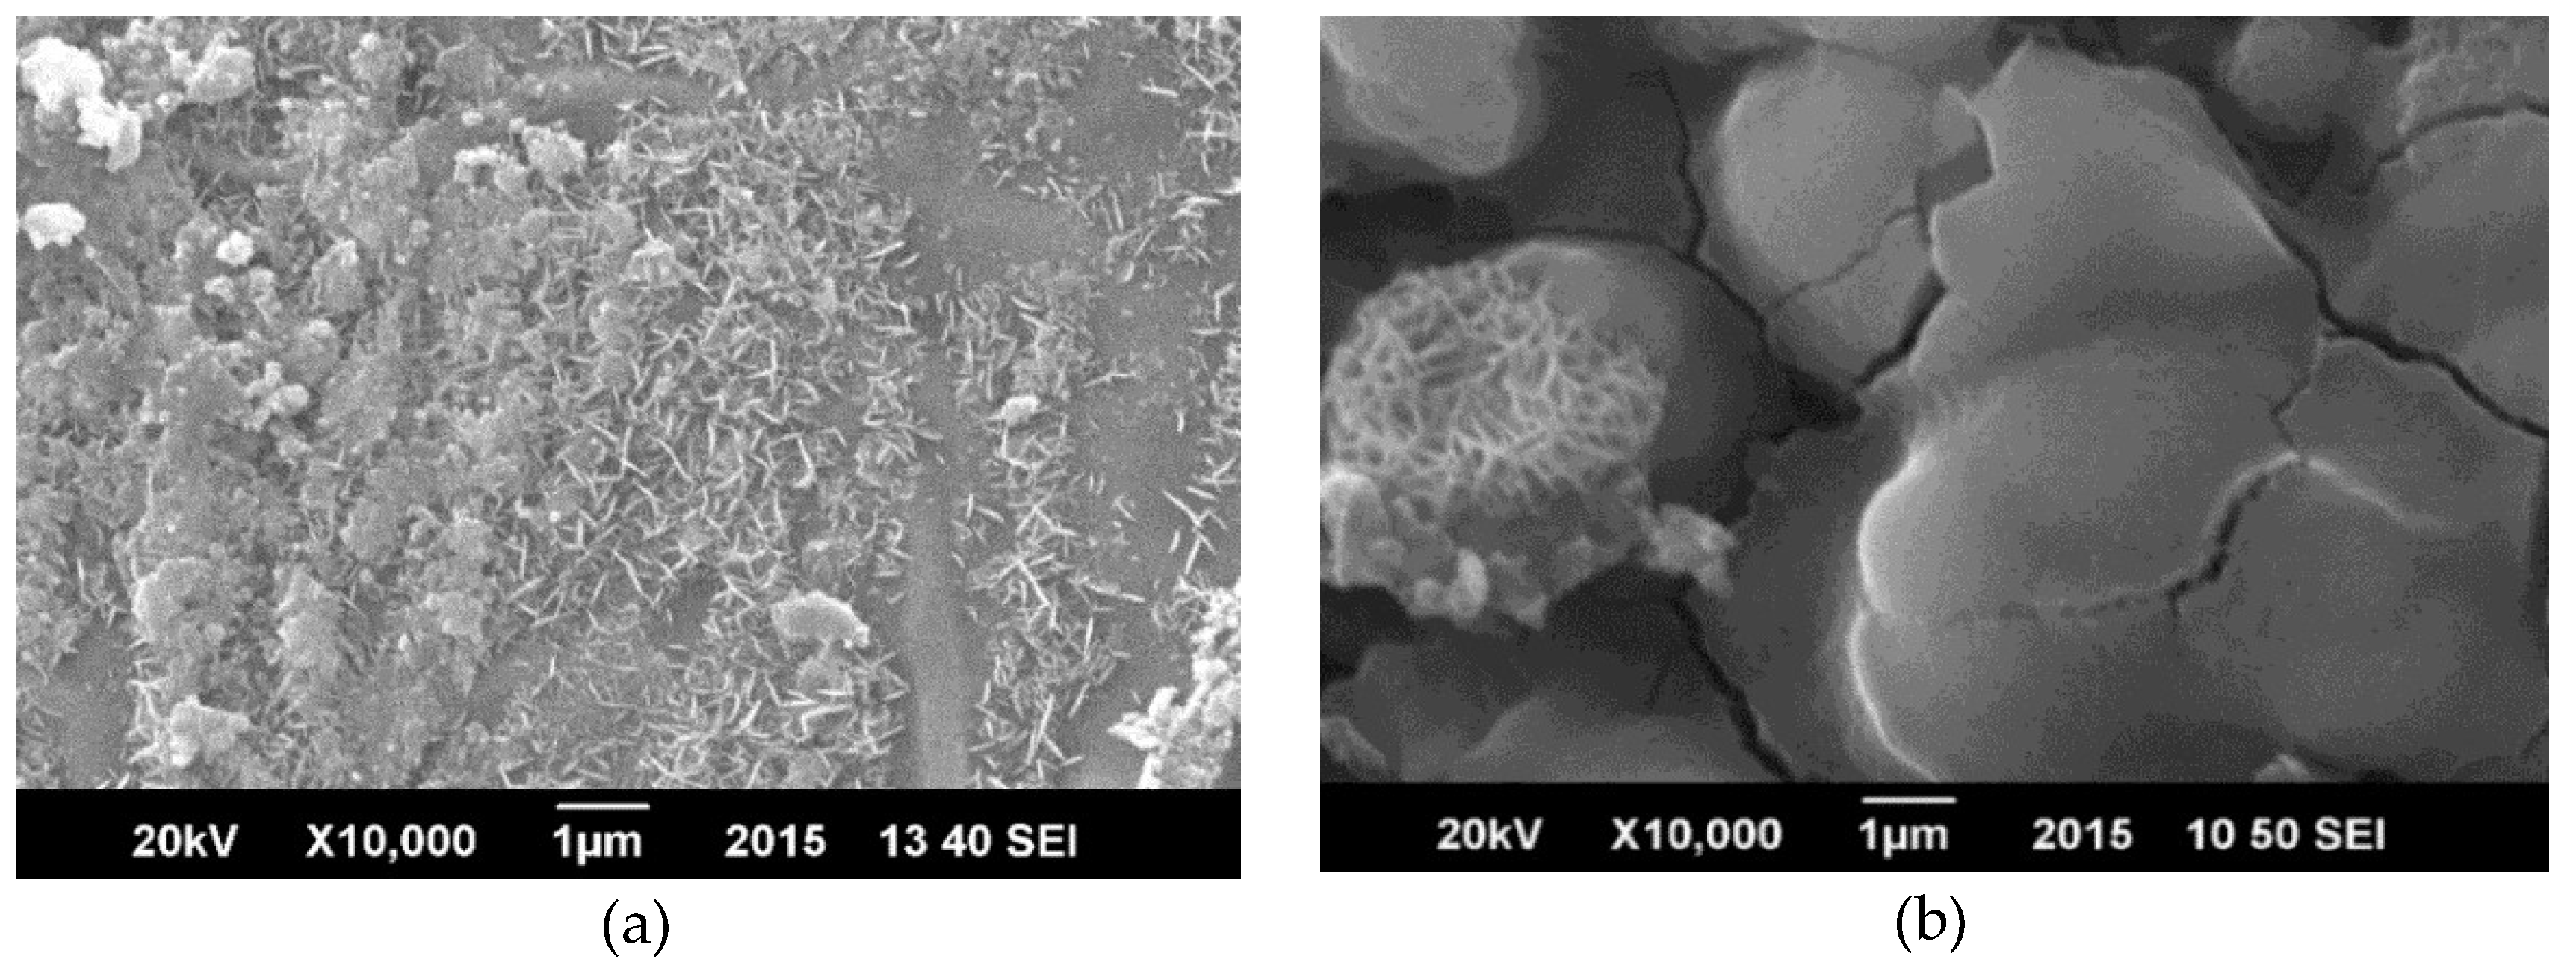
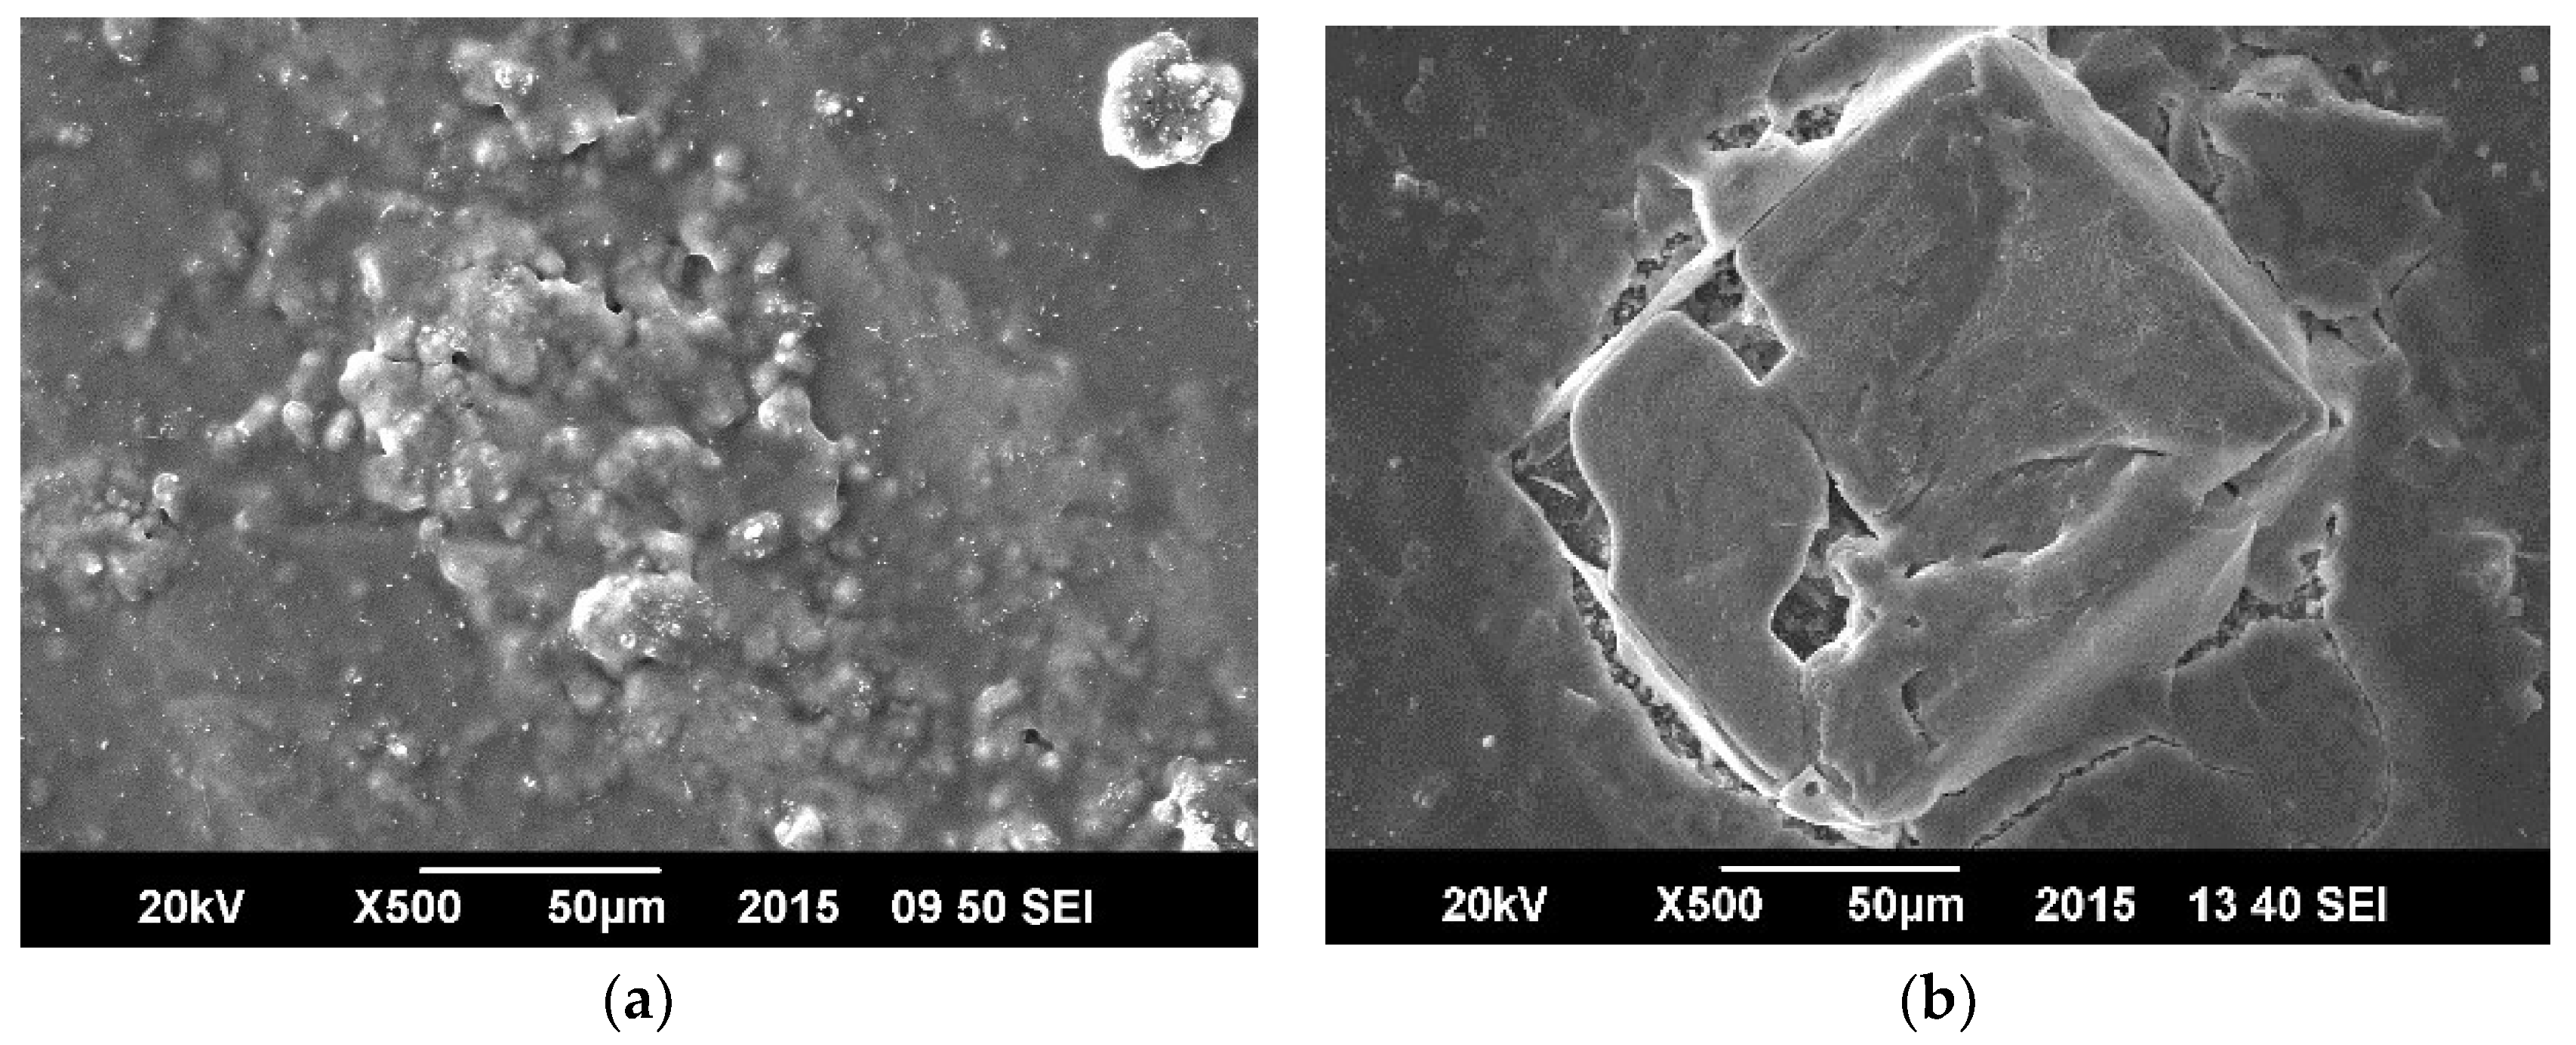
2.6. Surface Morphology

The surface morphology of the samples was studied before and after the corrosion test to observe the damage and deterioration caused by the corrosive environments. This morphological study was conducted by using Scanning Electron Microscope (JOEL JSM-6490A, JEOL USA, INC., Peabody, MA, USA).

3. Results and Discussion

3.1. Electrochemical Impedance Spectroscopy (EIS) in Seawater

Seawater was used as a corrosive medium to test the coated samples by using EIS and Tafel scan and compared their corrosion resistance with bare metal sample. It is shown in the Figure 2 that the impedance value of bare metal approached 50 Ω which was the indication of the low resistance of the metal sample against corrosion. Among the coating systems, SAN/PANI/FLG coating has shown higher impedance value of 250 Ω whereas impedance of ZnO/GO coating was approximately 100 Ω indicating the higher protection capability of SAN/PANI/FLG coating in seawater compared with ZnO/GO system.
The phase shift difference in bare metal and the coated metal is also superimposed in Figure 2. The phase shift of ZnO/GO was found higher than SAN/PANI/FLG coating revealing a better capacitive behavior of ZnO/GO. It could be aligned to the greater surface activity of nano-ZnO that improved the absorption of water on its surface that increased the density of coating and blocked the passages of electrolyte through the coating, thereby improving the barrier protection against corrosion [21,22,23]. Mostafaei [23] reported similar work and studied the effect of Polyaniline and ZnO on corrosion protection. It was reported that the barrier against the corrosion of Epoxy/PANI/ZnO was 3 times higher by magnitude than Epoxy/PANI coating, and was 4 times higher than Epoxy coating [23].
Figure 3 displays Nyquist plots which appeared to agree with the Bode plots. SAN/PANI/FLG coated samples exhibited higher impedance value and thus higher corrosion resistance than ZnO/GO coated samples. Values of EIS parameters i.e., pore resistance (Rpore), coating capacitance (Cc), uncompensated/solution resistance (Ru or Rsoln), polarization resistance (Rp or Rcorr) and double layer capacitance (Cdl or Ccorr) obtained by fitting the respective curves through Reap2cpe (Rapid Electrochemical Assessment of Paint (REAP), Constant Phase Element (CPE)) model are shown as below in Table 5.
The EIS data given in Table 5 was found helpful in determining the performance of coatings in corrosive environment. As shown in Table 5, SAN/PANI/FLG had higher pore resistance (Rpore) than ZnO/GO coating indicating better electrochemical stability and corrosion resistance of the polymeric nanocomposite in seawater environment as compared to ceramic base nanocomposite system. The higher value of pore resistance can be attributed to reduced formation of pores in the coating, restricting the ability of the electrolyte to reach the metal’s surface, thereby decreasing the corrosion [15,16,17,18,19,20]; pore resistance parameters are also important for defining the chemical stability of coating in corrosive environment.
Coating capacitance of SAN/PANI/FLG system was found higher compared to ZnO/GO coating in seawater. It shows that the SAN/PANI/FLG has better water uptake and dielectric properties than ZnO/GO. The diffusion of electrolyte leads to diffusion of corrosive ions through thin film that expectedly affects the coating capacitance. Coating capacitance usually increases significantly with the increase of defects in the coating, when exposed to corrosive environment. This behavior was noticed in a few cases after immersion for short durations in aggressive environment, the value of Cc initially increased and then decreased gradually, presumably, a deposition of corrosion residues in pinholes and defects takes place, resulting in blocking the diffusion of corrosive species and H2O molecules into the coating [8].

3.2. DC Corrosion Testing: Tafel Scan in Seawater

Corrosion rate data from DC corrosion testing is given in Table 6 and the ‘E-log i’ curves are shown in Figure 4. It was revealed that the corrosion of bare metal was reduced up to 85% by SAN/PANI/FLG nanocomposite coating on the metal, whereas ZnO/GO coating suppressed the corrosion rate up to 75% of the bare metal as shown in the Table 6. As mentioned corrosion potential was also shifted to more positive directions for coated metal indicating improvement in corrosion resistance due to coatings [23,24,25].
Polyaniline shifts the potential to the noble directions which is presumed to generation of passive oxide layer providing an alternative conducting path for the electron flow. PANI passivates the pinholes through iron oxide on metal substrate surface. Polyaniline transfers the electron transport from metal surface to the outer surface of primer. Generally, in the process of corrosion protection, the release of acid dopant (camphorsulphonic acid) results in polyaniline leucosalt (PANI-LS) due to the reduction of polyaniline-emeraldine salt. The formation of a passive iron ions film within the defect sites is facilitated by these sulphonic ions. PANI-LS are re-oxidized by dissolved oxygen to PANI-ES. In other words, it can be assumed that at first PANI gets the ions that are released in the corrosion process of iron and gets doped. Once it gets doped, it releases the dopant ions which create the passive layer on the interface of metal and coating [25,26,27]. PANI functions as self-healing coating and this cyclic process helps in effective corrosion protection [25,26,27]. Wei-Kang Lu [11] reported the effect of polyaniline in protecting mild steel and shifting the corrosion potential to positive direction. This protection capability of Polyaniline to generate a passive oxide layer on the surface of the substrate has been discussed [11].
Corrosion protection of graphene is linked to several facts. It is hydrophobic due to which it resists hydrogen bonding with water while in parallel it has ability to prevent oxidation of metal. Its nano-sized structural defects lead to limited passivation. Moreover, it suppresses ion conduction preventing the formation of galvanic cells resulting in better protection properties [2,5].
The obtained value of the desired parameters confirmed better protection ability of SAN/PANI/FLG system due to lower value of corrosion rate as compared to that of ZnO/GO system.

3.3. Surface Morphology in Seawater

Figure 5 shows that the surface morphology of the coating as observed under Scanning Electron Microscopy (SEM); the surface was altered by corrosion, but no significant cracks were developed in the coating indicating that the polymeric based coating afforded better protection properties. Figure 6 displays damage to ZnO/GO coating after the tests in which morphology was significantly changed by the cracks which are produced in the process of protection.

3.4. EIS Measurements in Crude Oil Produced Water

Crude oil produced water holds various types of compounds and hydrocarbons along with impurities, which are aggressive and potentially harmful towards corrosion. EIS and DC corrosion tests were performed for bare metal and, SAN/PANI/FLG and ZnO/GO coated samples. Figure 7 displays Bode plots for bare metal, SAN/PANI/FLG coating and ZnO/GO coating. The graphs exhibit variation in impedance values of various systems and highlights phase shifts. SAN/PANI/FLG performed much better in this environment and offered better protection as compared to that of ZnO/GO and bare metal.
Relatively higher value of impedance approaching to 1000 Ω of SAN/PANI/FLG in produced water was noticed, whereas, the impedance of ZnO/GO was approximately 90 Ω. Likewise, the behavior in seawater environment, ZnO/GO also demonstrated a higher value of phase shift compared to SAN/PANI/FLG coating when exposed to produced water. This indicated its better capacitive and dielectric properties. However, being chemically unstable in this environment, it could not offer any significant resistance against corrosion [28,29].
As evident from Figure 8, Nyquist plots verified relatively higher corrosion resistance of SAN/PANI/FLG system in crude oil produced water compared with its ceramic counterpart. Significantly higher values of impedance for SAN/PANI/FLG system were observed skewing the other two systems. The Nyquist plots showed a few suppressed semicircles representing a capacitance which is slightly deviating from ideal behavior [30]. Generally, the Nyquist plots of all coatings appeared to be semicircles with their centers on the x-axis (impedance), it would appear that the characteristics of the system influences the suppressed semicircles. It can also be attributed to few inhomogeneous features of the system such as non-uniform distribution of various surface properties at various locations over the electrode surface [26,31,32].
Values of Rpore and Cc are mentioned in Table 7, which displays a significant difference in the Rpore values for SAN/PANI/FLG and ZnO/GO coatings. This indicates a better electrochemical stability and corrosion resistance capability of the polymeric nanocomposite system in produced water as compared to ceramic nanocomposite coating.
Coating capacitance of ZnO/GO was observed to be slightly higher than SAN/PANI/FLG coating indicating larger water absorption and dielectric nature of ceramic nanocomposite than the polymeric nanocomposite [8].

3.5. DC Corrosion Testing-Tafel Scan in Crude Oil Produced Water

Tafel scan results validate EIS data regarding the performance of the nanocomposites coatings in produced water. Both coatings exhibited improved corrosion resistance compared to uncoated metal. Corrosion resistance of SAN/PANI/FLG coating was observed to be significantly better compared to ZnO/GO coating, as displayed in Figure 9, the data is summarized in Table 8.
As evident from Table 8 and Figure 9, ZnO/GO system did not prove to be protecting and the corrosion rate was found to be very close to bare metal. The SAN/PANI/FLG system, however, exhibited about 27 times reduction in the rate of corrosion compared with bare iron metal. Both the nanocomposites coatings, however, shifted the Ecorr value towards positive direction. The potential values display a qualitative check for aggressiveness of the electrolyte towards the working electrode, whereas, the quantitative data is based on the current values. In Figure 9, the potentials of the two coated samples although were in close vicinity, however, there position in terms of current were quite distant, presumably due to breakdown of the coating in the electrolyte used.

3.6. Surface Morphology in Crude Oil Produced Water

Figure 10 displays SAN/PANI/FLG coated surface before and after corrosion testing in produced water the micrographs exhibit a partial degradation appearing in the form of micro-cracks in the coating after corrosion testing. The surface, however, did not appear to be damaged thoroughly, indicating relatively better resistance against corrosive attack by produced water.
Figure 11 shows morphology of ceramic nanocomposite coated surface. It was evident that the ceramic coating appeared to be significantly damaged after corrosion testing, indicating its weak resistance against corrosive attack of produced water.

4. Conclusions

It was concluded that the corrosion protection of polymeric based SAN/PANI/FLG coating was found reasonably higher than ceramic based ZnO/GO coating in seawater as well as in produced water. SAN/PANI/FLG coating reduced the corrosion of bare metal up to 90% in seawater environment with the highest reported impedance value of 250 Ω, whereas, ZnO/GO suppressed the corrosion up to 75% having the impedance value of 100 Ω.
In crude oil produced water, SAN/PANI/FLG coating proved to be significantly better corrosion resistant compared to ZnO/GO coating. SAN/PANI/FLG reduced the corrosion up to 95% with impedance value of 1000 Ω while ZnO/GO suppressed the corrosion up to 10% with the impedance value of 90 Ω.
Both polymeric and ceramic based nanocomposites coatings demonstrated better protection against sea and produced water. However, the variation in protection levels of both polymeric and ceramic based nanocomposites coatings between the two environments can be seen. SAN/PANI/FLG coating performed better in terms of reducing corrosion of bare metal as compared to ZnO/GO coating. This was due to better resistance against pore formation and strong barrier properties against the electrolyte of SAN/PANI/FLG coating.

Author Contributions

The research work was carried out in the academic supervision of M.S.; Z.A.K. has been a key academic advisor who contributed significantly in critical revision and development of the paper. M.K.A., A.U.A., A.S. (Abdul Saboor), A.K. and A.H. have contributed to develop the theory, materials synthesis, computation, experimental setup and data analysis and interpretation of this research. A.S. (Adil Saeed) contributed in EIS, Tafel and Bode interpretation and corrosion discussions. M.K. supported wider academic activities.

Funding

This research received no external funding.

Conflicts of Interest

There are no conflicts of interest.

References

  1. Wang, X.; Melchers, R.E. Corrosion of carbon steel in presence of mixed deposits under stagnant seawater conditions. J. Loss Prev. Process Ind. 2017, 45, 29–42. [Google Scholar] [CrossRef]
  2. Fang, S.; Shen, L.; Zheng, H.; Zhang, X. Ge–graphene–carbon nanotube composite anode for high performance lithium-ion batteries. J. Mater. Chem. A 2015, 3, 1498–1503. [Google Scholar] [CrossRef]
  3. Yu, Y.-H.; Lin, Y.-Y.; Lin, C.-H.; Chan, C.-C.; Huang, Y.-C. High-performance polystyrene/graphene-based nanocomposites with excellent anti-corrosion properties. Polym. Chem. 2013, 5, 535–550. [Google Scholar] [CrossRef]
  4. Aneja, K.S.; Böhm, H.L.M.; Khanna, A.S.; Böhm, S. Functionalized graphene as a barrier against corrosion. FlatChem 2017, 1, 11–19. [Google Scholar] [CrossRef]
  5. Kirkland, N.T.; Schiller, T.; Medhekar, N.; Birbilis, N. Exploring graphene as a corrosion protection barrier. Corros. Sci. 2012, 56, 1–4. [Google Scholar] [CrossRef]
  6. Qi, K.; Sun, Y.; Duan, H.; Guo, X. A corrosion-protective coating based on a solution-processable polymer-grafted graphene oxide nanocomposite. Corros. Sci. 2015, 98, 500–506. [Google Scholar] [CrossRef]
  7. Christopher, G.; Anbu Kulandainathan, M.; Harichandran, G. Comparative study of effect of corrosion on mild steel with waterborne polyurethane dispersion containing graphene oxide versus carbon black nanocomposites. Prog. Org. Coat. 2015, 89, 199–211. [Google Scholar] [CrossRef]
  8. Olad, A.; Barati, M.; Behboudi, S. Preparation of PANI/epoxy/Zn nanocomposite using Zn nanoparticles and epoxy resin as additives and investigation of its corrosion protection behavior on iron. Prog. Org. Coat. 2012, 74, 221–227. [Google Scholar] [CrossRef]
  9. Weng, C.J.; Chen, Y.L.; Jhuo, Y.S.; Yi-Li, L.; Yeh, J.M. Advanced antistatic/anticorrosion coatings prepared from polystyrene composites incorporating dodecylbenzenesulfonic acid-doped SiO2@polyaniline core–shell microspheres. Polym. Int. 2013, 62, 774–782. [Google Scholar] [CrossRef]
  10. Baldissera, A.F.; Ferreira, C.A. Coatings based on electronic conducting polymers for corrosion protection of metals. Prog. Org. Coat. 2012, 75, 241–247. [Google Scholar] [CrossRef]
  11. Lu, W.K.; Elsenbaumer, R.L.; Wessling, B. Corrosion protection of mild steel by coatings containing polyaniline. Synth.c Met. 1995, 71, 2163–2166. [Google Scholar] [CrossRef]
  12. Olad, A.; Nosrati, R. Preparation and corrosion resistance of nanostructured PVC/ZnO–polyaniline hybrid coating. Prog. Org. Coat. 2012, 76, 113–118. [Google Scholar] [CrossRef]
  13. Di, H.; Yu, Z.; Yu, M.; Zhang, C.; Li, F.; Liang, L.; Pan, Y.; Shi, H.; He, Y. Corrosion-resistant hybrid coatings based on graphene oxide–zirconia dioxide/epoxy system. J. Taiwan Inst. Chem. Eng. 2016, 67, 511–520. [Google Scholar] [CrossRef]
  14. Kim, J.; Mousa, H.M.; Park, C.H.; Kim, C.S. Enhanced corrosion resistance and biocompatibility of AZ31 Mg alloy using PCL/ZnO NPs via electrospinning. Appl. Surf. Sci. 2017, 396, 249–258. [Google Scholar] [CrossRef]
  15. Rammelt, U.; Reinhard, G. Application of electrochemical impedance spectroscopy (EIS) for characterizing the corrosion-protective performance of organic coatings on metals. Prog. Org. Coat. 1992, 21, 205–226. [Google Scholar] [CrossRef]
  16. Prasai, D.; Tuberquia, J.C.; Harl, R.R.; Jennings, G.K.; Bolotin, K.I. Graphene: Corrosion-inhibiting coating. ACS Nano 2012, 6, 1102–1108. [Google Scholar] [CrossRef] [PubMed]
  17. Liao, Y.-J.; Wu, X.-L.; Zhu, L.; Yi, T. Synthesis and properties of novel styrene acrylonitrile/polypropylene blends with enhanced toughness. Chem. Cent. J. 2018, 12, 78. [Google Scholar] [CrossRef] [PubMed]
  18. Liu, C.; Bi, Q.; Leyland, A.; Matthews, A. An electrochemical impedance spectroscopy study of the corrosion behaviour of PVD coated steels in 0.5 N NaCl aqueous solution: Part II.: EIS interpretation of corrosion behaviour. Corros. Sci. 2003, 45, 1257–1273. [Google Scholar] [CrossRef]
  19. Singh Raman, R.K.; Banerjee, P.C.; Lobo, D.E.; Gullapalli, H.; Sumandasa, M.; Kumar, A.; Choudhary, L.; Tkacz, R.; Ajayan, P.M.; Majumder, M. Protecting copper from electrochemical degradation by graphene coating. Carbon 2012, 50, 4040–4045. [Google Scholar] [CrossRef]
  20. Praveen Kumar, C.M.; Venkatesha, T.V.; Shabadi, R. Preparation and corrosion behavior of Ni and Ni–graphene composite coatings. Mater. Res. Bull. 2013, 48, 1477–1483. [Google Scholar] [CrossRef]
  21. Pirhady Tavandashti, N.; Sanjabi, S.; Shahrabi, T. Corrosion protection evaluation of silica/epoxy hybrid nanocomposite coatings to AA2024. Prog. Org. Coat. 2009, 65, 182–186. [Google Scholar] [CrossRef]
  22. Zandi-zand, R.; Ershad-langroudi, A.; Rahimi, A. Silica based organic–inorganic hybrid nanocomposite coatings for corrosion protection. Prog. Org. Coat. 2005, 53, 286–291. [Google Scholar] [CrossRef]
  23. Mostafaei, A.; Nasirpouri, F. Epoxy/polyaniline–ZnO nanorods hybrid nanocomposite coatings: Synthesis, characterization and corrosion protection performance of conducting paints. Prog. Org. Coat. 2014, 77, 146–159. [Google Scholar] [CrossRef]
  24. Tallman, D.E.; Pae, Y.; Bierwagen, G.P. Conducting polymers and corrosion: Polyaniline on steel. Corrosion 1999, 55, 779–786. [Google Scholar] [CrossRef]
  25. Jafari, Y.; Ghoreishi, S.M.; Shabani-Nooshabadi, M. Electrochemical deposition and characterization of polyaniline-graphene nanocomposite films and its corrosion protection properties. J. Polym. 2016, 23, 91. [Google Scholar] [CrossRef]
  26. Kendig, M.; Scully, J. Basic aspects of electrochemical impedance application for the life prediction of organic coatings on metals. Corrosion 1990, 46, 22–29. [Google Scholar] [CrossRef]
  27. Mirmohseni, A.; Oladegaragoze, A. Anti-corrosive properties of polyaniline coating on iron. Synth. Met. 2000, 114, 105–108. [Google Scholar] [CrossRef]
  28. Huang, Y.; Zeng, H.; Wang, X.; Wang, D. Corrosion resistance and biocompatibility of SrHAp/ZnO composite implant coating on titanium. Appl. Surf. Sci. 2014, 290, 353–358. [Google Scholar] [CrossRef]
  29. Rashvand, M.; Ranjbar, Z. Effect of nano-ZnO particles on the corrosion resistance of polyurethane-based waterborne coatings immersed in sodium chloride solution via EIS technique. Prog. Org. Coat. 2013, 76, 1413–1417. [Google Scholar] [CrossRef]
  30. Xiang, H.; Zhang, K.; Ji, G.; Lee, J.Y.; Zou, C.; Chen, X.; Wu, J. Graphene/nanosized silicon composites for lithium battery anodes with improved cycling stability. Carbon 2011, 49, 1787–1796. [Google Scholar] [CrossRef]
  31. Deflorian, F.; Fedrizzi, L.; Rossi, S.; Bonora, P.L. Organic coating capacitance measurement by EIS: Ideal and actual trends. Electrochim. Acta 1999, 44, 4243–4249. [Google Scholar] [CrossRef]
  32. Mišković-Stanković, V.; Jevremović, I.; Jung, I.; Rhee, K. Electrochemical study of corrosion behavior of graphene coatings on copper and aluminum in a chloride solution. Carbon 2014, 75, 335–344. [Google Scholar] [CrossRef]
Figure 1. Equivalent cell circuit and EIS Input parameters (EIS-Input Parameters AC voltage: 10 mV; Initial frequency: 1 × 10⁵ Hz; Final frequency: 0.2 Hz; Point/decade: 10; Exposed area: 3 × 3 cm2; DC Potential Range: −250 mV to +250 mV vs. SCE).
Materials 11 02239 g001
Figure 2. Bode Plots-bare and coated samples in seawater.
Materials 11 02239 g002
Figure 3. Nyquist Plots of bare and coated samples seawater.
Materials 11 02239 g003
Figure 4. ’E-log i’ curves-bare and coated samples in seawater.
Materials 11 02239 g004
Figure 5. SEM micrographs of SAN/PANI/FLG coated samples in seawater. (a) Before corrosion test; (b) After corrosion test.
Materials 11 02239 g005
Figure 6. SEM micrographs-ZnO/GO coated samples in seawater (a) Before corrosion test; (b) After corrosion test.
Materials 11 02239 g006
Figure 7. Comparison of Bode Plots (crude oil produced water).
Materials 11 02239 g007
Figure 8. Comparison of Nyquist Plot (crude oil produced water).
Materials 11 02239 g008
Figure 9. ’E-log i’ curves-bare and coated samples in (crude oil produced water).
Materials 11 02239 g009
Figure 10. SEM image-SAN/PANI/FLG coated samples (produced water of crude oil). (a) Before corrosion test (b) After corrosion test.
Materials 11 02239 g010
Figure 11. SEM image-ZnO/GO coated sample (produced water of crude oil) (a) Before corrosion test (b) After corrosion test.
Materials 11 02239 g011
Table 1. Constituents proportion of ductile cast iron.
ElementPercentage (%)
Carbon3.7
Silicon2.6
Sulfur0.3
Manganese0.2
IronBalance
Table 2. Ingredients for SAN/PANI/FLG coating.
Materialwt.%Manufacturer
SAN90ERKOL (Mohegan Lake, NY, USA)
Polyaniline 10Prepared in lab
Few layer graphene (5–8 layers) (2 Micrometer sheet size)0.1I. Janowska
Table 3. Mechanical Properties of SAN/PANI/FLG thin film.
Mechanical PropertiesQuantity
UTS of SAN/PANI/FLG thin film26.03 MPa
Elastic Modulus (E)1.37 GPa
Strain%-Strain at break2.6%
Table 4. Ingredients for ZnO/GO coating.
MaterialQuantity
Zinc Acetate Dihydrate 4.42 g
Ethanol amine50 mL
Isopropanol Alcohol1.207 mL
Table 5. Reap2cpe fitting values of coated samples in sea water.
SAN/PANI/FLGZnO/GO
Rpore82.79 ΩRpore6.648 Ω
Cc2.105 × 10−3 FCc1.354 × 10−3 F
Rsoln11.53 ΩRsoln8.150 Ω
Rcorr663.1 × 109 ΩRcorr196.8 Ω
Ccorr33.90 × 10−3 FCcorr8.978 × 10−3 F
Table 6. Corrosion rate (C.R) data from Tafel scan.
Corrosion Rate and PotentialBare MetalSAN/PANI/FLGZnO/GO
C.R (mpy)19.562.514 5.827
Ecorr (mV)−708.1−677.5 −665.1
Table 7. Reap2cpe fitting values of coated samples in produced water.
SAN/PANI/FLGZnO/GO
Rpore114.0 ΩRpore2.260 Ω
Cc55.01 × 10−6 FCc1.775 × 10−3 F
Rsoln34.95 ΩRsoln5.687 Ω
Rcorr1.125 × 103 ΩRcorr67.01 Ω
Ccorr83.08 × 10−6 FCcorr4.641 × 10−3 F
Table 8. Corrosion rate data from Tafel scan in produced water.
Corrosion Rate and PotentialBare MetalSAN/PANI/FLGZnO/GO
C.R (mpy)21.760.786720.82
Ecorr (mV)−805.8−637.4−629.1

