Rough Titanium Oxide Coating Prepared by Micro-Arc Oxidation Causes Down-Regulation of hTERT Expression, Molecular Presentation, and Cytokine Secretion in Tumor Jurkat T Cells

 , , ,
, , , 
Abstract
:
1. Introduction
2. Materials and Methods
2.1. Substrate Preparation and Coating Deposition and Characterization
2.2. Titanium Dioxide Nanoparticles
2.3. Cell Culture
2.4. hTERT Expression in Jurkat T Cells
2.5. Reactive Oxygen Species and Measurement of Cell Death
2.6. Cytokine Profile in the Cell Culture
2.7. Cellular Immunophenotype Detection
2.8. Statistical Analysis
3. Results
4. Discussion
5. Conclusions
Acknowledgments
Author Contributions
Conflicts of Interest
References
- Au, A.; Ha, J.; Hernandez, M.; Polotsky, A.; Hungerford, D.S.; Frondoza, C.G. Nickel and vanadium metal ions induce apoptosis of T-lymphocyte Jurkat cells. J. Biomed. Mater. Res. A 2006, 79, 512–521. [Google Scholar] [CrossRef] [PubMed]
- Chen, X.; Su, J.; Chang, J.; Kanekura, T.; Li, J.; Kuang, Y.H.; Peng, S.; Yang, F.; Lu, H.; Zhang, J.L. Inhibition of CD147 gene expression via RNA interference reduces tumor cell proliferation, activation, adhesion, and migration activity in the human Jurkat T-lymphoma cell line. Cancer Investig. 2008, 26, 689–697. [Google Scholar] [CrossRef] [PubMed]
- Liao, H.F.; Chen, Y.J.; Chou, C.H.; Wang, F.W.; Kuo, C.D. Norcantharidin induces cell cycle arrest and inhibits progression of human leukemic Jurkat T cells through mitogen-activated protein kinase-mediated regulation of interleukin-2 production. Toxicol. In Vitro 2011, 25, 206–212. [Google Scholar] [CrossRef] [PubMed]
- Luongo, D.; Russo, R.; Balestrieri, A.; Marzocco, S.; Bergamo, P.; Severino, L. In vitro study of AFB1 and AFM1 effects on human lymphoblastoid Jurkat T-cell model. J. Immunotoxicol. 2014, 11, 353–358. [Google Scholar] [CrossRef] [PubMed]
- Stevens, M.J.; Donato, L.J.; Lower, S.K.; Sahai, N. Oxide-dependent adhesion of the Jurkat line of T lymphocytes. Langmuir 2009, 25, 6270–6278. [Google Scholar] [CrossRef] [PubMed]
- Caicedo, M.; Jacobs, J.J.; Reddy, A.; Hallab, N.J. Analysis of metal ion-induced DNA damage, apoptosis, and necrosis in human (Jurkat) T-cells demonstrates Ni2+ and V3+ are more toxic than other metals: Al3+, Be2+, Co2+, Cr3+, Cu2+, Fe3+, Mo5+, Nb5+, Zr2+. J. Biomed. Mater. Res. A 2008, 86, 905–913. [Google Scholar] [CrossRef] [PubMed]
- Tuomela, S.; Autio, R.; Buerki-Thurnherr, T.; Arslan, O.; Kunzmann, A.; Andersson-Willman, B.; Wick, P.; Mathur, S.; Scheynius, A.; Krug, H.F.; et al. Gene expression profiling of immune-competent human cells exposed to engineered zinc oxide or titanium dioxide nanoparticles. PLoS ONE 2013, 8, e68415. [Google Scholar] [CrossRef] [PubMed]
- Ratner, B.D.; Hoffman, A.S. Biomaterials Science: An Introduction to Materials in Medicine, 2nd ed.; Elsevier Academic Press: San Diego, CA, USA, 2004. [Google Scholar]
- Thull, R. Titan in der Zahnheilkunde-Grundlagen. Z. Mitteilungen 1992, 82, 39–45. [Google Scholar]
- Ogawa, T. Ultraviolet photofunctionalization of titanium implants. Int. J. Oral Maxillofac. Implants 2014, 29, e95–e102. [Google Scholar] [CrossRef] [PubMed]
- Nethi, S.K.; Neeraja Aparna Anand, P.; Rico-Oller, B.; Rodríguez-Diéguez, A.; Gómez-Ruiz, S.; Patra, C.R. Design, synthesis and characterization of doped-titanium oxide nanomaterials with environmental and angiogenic applications. Sci. Total Environ. 2017, 599–600, 1263–1274. [Google Scholar] [CrossRef] [PubMed]
- Lavigne, M.; Belzile, E.L.; Roy, A.; Morin, F.; Amzica, T.; Vendittoli, P.A. Comparison of whole-blood metal ion levels in four types of metal-on-metal large-diameter femoral head total hip arthroplasty: The potential influence of the adapter sleeve. J. Bone Jt. Surg. Am. 2011, 93, 128–136. [Google Scholar] [CrossRef] [PubMed]
- Matusiewicz, H. Potential release of in vivo trace metals from metallic medical implants in the human body: From ions to nanoparticles—A systematic analytical review. Acta Biomater. 2014, 10, 2379–2403. [Google Scholar] [CrossRef] [PubMed]
- Agins, H.J.; Alcock, N.W.; Bansal, M.; Salvati, E.A.; Wilson, P.D.; Pellicci, P.M.; Bullough, P.G. Metallic wear in failed titanium-alloy total hip replacements. J. Bone Jt. Surg. A 1988, 70, 347–356. [Google Scholar] [CrossRef]
- Case, C.P.; Langkamer, V.G.; James, C.; Palmer, M.R.; Kemp, A.J.; Heap, P.F.; Solomon, L. Widespread dissemination of metal debris from implants. J. Bone Jt. Surg. 1994, 76, 701–712. [Google Scholar] [CrossRef]
- Bradberry, S.M.; Wilkinson, J.M.; Ferner, R.E. Systemic toxicity related to metal hip prostheses. Clin. Toxicol. 2014, 52, 837–847. [Google Scholar] [CrossRef] [PubMed]
- Wang, J.C.; Yu, W.D.; Sandhu, H.S.; Betts, F.; Bhuta, S.; Delamarter, R.B. Metal debris from titanium spinal implants. Spine 1999, 24, 899–903. [Google Scholar] [CrossRef] [PubMed]
- Curtis, A.S.G.; Wilkinson, C. Control of cell behavior: Topological factors. J. Natl. Cancer Inst. 1964, 33, 15–26. [Google Scholar] [CrossRef] [PubMed]
- Khlusov, I.A.; Litvinova, L.S.; Shupletsova, V.V.; Dunets, N.A.; Khaziakhmatova, O.G.; Yurova, K.A.; Yu, M.; Khlusova, Y.; Sharkeev, P. Morphofunctional changes of Jurkat T lymphoblasts upon short-term contact with a relief calcium phosphate surface. Cell Tissue Biol. 2017, 11, 59–64. [Google Scholar] [CrossRef]
- Curtis, A.S.G.; Wilkinson, C. Topographical control of cells. Biomaterials 1997, 18, 1573–1583. [Google Scholar] [CrossRef]
- Ravichandran, R.; Liao, S.; Ng, C.C.; Chan, C.K.; Raghunath, M.; Ramakrishna, S. Effects of nanotopography on stem cell phenotypes. World J. Stem Cells 2009, 1, 55–66. [Google Scholar] [CrossRef] [PubMed]
- Anselme, K.; Bigerelle, M. Topography effects of pure titanium substrates on human osteoblast long-term adhesion. Acta Biomater. 2005, 1, 211–222. [Google Scholar] [CrossRef] [PubMed]
- Ponsonnet, L.; Reybier, K.; Jaffrezic, N.; Comte, F.; Lagneau, C.; Lissac, M.; Martelet, C. Relationship between surface properties (roughness, wettability) of titanium and titanium alloys and cell behavior. Mater. Sci. Eng. C 2003, 23, 551–560. [Google Scholar] [CrossRef]
- Anselme, K.; Bigerelle, M.; Noel, B.; Dufresne, E.; Judas, D.; Iost, A.; Hardouin, P. Qualitative and quantitative study of human osteoblast adhesion on materials with various surface roughnesses. J. Biomed. Mater. Res. Part A 2000, 49, 155–166. [Google Scholar] [CrossRef]
- Legostaeva, E.V.; Kulyashova, K.S.; Komarova, E.G.; Epple, M.; Sharkeev, Y.P.; Khlusov, I.A. Physical, chemical and biological properties of micro-arc deposited calcium phosphate coatings on titanium and zirconium-niobium alloy. Materialwissenschaft und Werkstofftechnik 2013, 44, 188–197. [Google Scholar] [CrossRef]
- Khlusov, I.A.; Sharkeev, Y.P.; Pichugin, V.F.; Legostaeva, E.V.; Litvinova, L.S.; Shupletsova, V.V.; Sokhonevich, N.A.; Khaziakhmatova, O.G.; Khlusova, M.Y.; Gutor, S.S.; et al. Influence of the structure of the titanium oxide coating surface on immunocompetent tumor cells. Russ. Phys. J. 2016, 58, 1527–1533. [Google Scholar] [CrossRef]
- Eguchi, M. On the permanent electret. Philos. Mag. 1925, 49, 178–192. [Google Scholar] [CrossRef]
- Gostischev, E.A. A Noncontacting Manner to Determine the Potentials of Charged Surface of Objects and the Device for Its Realization: Russian Federation. Patent 2,223,511, 2004. [Google Scholar]
- Khlusov, I.A.; Zagrebin, L.V.; Shestov, S.S.; Itin, V.I.; Sedoi, V.S.; Feduschak, T.A.; Terekhova, O.G.; Magaeva, A.A.; Naiden, E.P.; Antipov, S.A.; et al. Colony-forming activity of unipotent hemopoietic precursors under the effect of nanosized ferrites in a constant magnetic field in vitro. Bull. Exp. Biol. Med. 2008, 145, 151–157. [Google Scholar] [CrossRef] [PubMed]
- Yakushina, V.D.; Vasil’eva, O.A.; Ryazantseva, N.V.; Novitsky, V.V.; Tashireva, L.A. The effects of galectin-1 on the gene expression of the transcription factors TBX21, GATA-3, FOXP3 and RORC. Mol. Cell. Biochem. 2015, 398, 245–249. [Google Scholar] [CrossRef] [PubMed]
- Banda, M.; Bommineni, A.; Thomas, R.A.; Luckinbill, L.S.; Tucker, J.D. Evaluation and validation of housekeeping genes in response to ionizing radiation and chemical exposure for normalizing RNA expression in real-time PCR. Mutat. Res. 2008, 649, 126–134. [Google Scholar] [CrossRef] [PubMed]
- Terui, Y.; Ikeda, M.; Tomizuka, H.; Kasahara, T.; Ohtsuki, T.; Uwai, M.; Mori, M.; Itoh, T.; Tanaka, M.; Yamada, M.; et al. Activated endothelial cells induce apoptosis in leukemic cells by endothelial interleukin-8. Blood 1998, 92, 2672–2680. [Google Scholar] [PubMed]
- Devita, V.T.; Lawrence, T.S.; Rosenberg, S.A. Cancer: Principles & Practice of Oncology, 8th ed.; Wolters Kluwer/Lippincott Williams & Wilkins: Philadelphia, PA, USA, 2008. [Google Scholar]
- Novitsky, V.A.; Khlusov, I.A.; Ryazantseva, N.V.; Chechina, O.E.; Feduschak, T.A.; Ermakov, A.E.; Uimin, M.A. Structural and functional state of the bone marrow during its in vitro interaction with ferromagnetic nanoparticles. Bull. Exp. Biol. Med. 2011, 151, 473–476. [Google Scholar] [CrossRef] [PubMed]
- Gallagher, P.F.; Fazekas de St Groth, B.; Miller, J.F. CD4 and CD8 molecules can physically associate with the same T-cell receptor. Proc. Natl. Acad. Sci. USA 1989, 86, 10044–10048. [Google Scholar] [CrossRef] [PubMed]
- Law, H.K.W.; Tu, W.; Liu, E.; Lau, Y.L. Insulin-like growth factor I promotes cord blood T cell maturation through monocytes and inhibits their apoptosis in part through interleukin-6. BMC Immunol. 2008, 9, 74. [Google Scholar] [CrossRef] [PubMed] [Green Version]
- Bi, B.Y.; Lefebvre, A.M.; Duś, D.; Spik, G.; Mazurier, J. Effect of lactoferrin on proliferation and differentiation of the Jurkat human lymphoblastic T cell line. Arch. Immunol. Ther. Exp. (Warsz.) 1997, 45, 315–320. [Google Scholar] [PubMed]
- Akbar, A.N.; Terry, L.; Timms, A.; Beverley, P.C.; Janossy, G. Loss of CD45R and gain of UCHL1 reactivity is a feature of primed T cells. J. Immunol. 1988, 140, 2171–2178. [Google Scholar] [PubMed]
- Khalaf, H.; Jass, J.; Olsson, P.E. Differential cytokine regulation by NF-kappa B and AP-1 in Jurkat T-cells. BMC Immunol. 2010, 11, 26. [Google Scholar] [CrossRef] [PubMed]
- Waugh, D.J.J.; Wilson, C. The interleukin-8 pathway in cancer. Clin. Cancer Res. 2008, 14, 6735–6741. [Google Scholar] [CrossRef] [PubMed]
- Jasmin, C.; Georgoulias, V.; Smadja-Joffe, F.; Boucheix, C.; Le Bousse-Kerdiles, C.; Allouche, M.; Cibert, C.; Azzarone, B. Autocrine growth of leukemic cells. Leuk. Res. 1990, 14, 689–693. [Google Scholar] [CrossRef]
- Arana-Argáez, V.E.; Delgado-Rizo, V.; Pizano-Martínez, O.E.; Martínez-Garcia, E.A.; Martín-Márquez, B.T.; Muñoz-Gómez, A.; Petri, M.H.; Armendáriz-Borunda, J.; Espinosa-Ramírez, G.; Zúñiga-Tamayo, D.A.; et al. Inhibitors of MAPK pathway ERK1/2 or p38 prevent the IL-1{beta}-induced up-regulation of SRP72 autoantigen in Jurkat cells. J. Biol. Chem. 2010, 285, 32824–32833. [Google Scholar] [CrossRef] [PubMed]
- Tatsuta, T.; Cheng, J.; Mountz, J.D. Intracellular IL-1beta is an inhibitor of Fas-mediated apoptosis. J. Immunol. 1996, 157, 3949–3957. [Google Scholar] [PubMed]
- Groux, H.; Bigler, M.; de Vries, J.E.; Roncarolo, M.G. Interleukin-10 induces a long-term antigen-specific anergic state in human CD4+ T cells. J. Exp. Med. 1996, 184, 19–29. [Google Scholar] [CrossRef] [PubMed]
- Raff, M.C.; Barres, B.A.; Burne, J.F.; Coles, H.S.; Ishizaki, Y.; Jacobson, M.D. Programmed cell death and the control of cell survival: Lessons from the nervous system. Science 1993, 262, 695–700. [Google Scholar] [CrossRef] [PubMed]
- Lin, Z.; Lim, S.; Viani, M.A.; Sapp, M.; Lim, M.S. Down-regulation of telomerase activity in malignant lymphomas by radiation and chemotherapeutic agents. Am. J. Pathol. 2001, 159, 711–719. [Google Scholar] [CrossRef]
- Soares, J.; Lowe, M.M.; Jarstfer, M.B. The catalytic subunit of human telomerase is a unique caspase-6 and caspase-7 substrate. Biochemistry 2011, 50, 9046–9055. [Google Scholar] [CrossRef] [PubMed]
- Kanzaki, Y.; Onoue, F.; Sakurai, H.; Ide, T. Telomerase upregulates expression levels of interleukin (IL)-1alpha, IL-1beta, IL-6, IL-8, and granulocyte-macrophage colony-stimulating factor in normal human fibroblasts. Biochem. Biophys. Res. Commun. 2003, 305, 150–154. [Google Scholar] [CrossRef]
- Ghosh, M.; Chakraborty, A.; Mukherjee, A. Cytotoxic, genotoxic and the hemolytic effect of titanium dioxide (TiO2) nanoparticles on human erythrocyte and lymphocyte cells in vitro. J. Appl. Toxicol. 2013, 33, 1097–1110. [Google Scholar] [CrossRef] [PubMed]
- Takaki, K.; Higuchi, Y.; Hashii, M.; Ogino, C.; Shimizu, N. Induction of apoptosis associated with chromosomal DNA fragmentation and caspase-3 activation in leukemia L1210 cells by TiO2 nanoparticles. J. Biosci. Bioeng. 2014, 117, 129–133. [Google Scholar] [CrossRef] [PubMed]
- Montet-Abou, K.; Montet, X.; Weissleder, R.; Josephson, L. Transfection agent induced nanoparticle cell loading. Mol. Imaging 2005, 4, 165–171. [Google Scholar] [PubMed]
- Tobasnick, G.; Curtis, A.S.G. Chloride channels and the reactions of cells to topography. Eur. Cells Mater. 2001, 2, 49–61. [Google Scholar] [CrossRef]
- Dadsetan, S.; Zakharova, L.; Molinski, T.F.; Fomina, A.F. Store-operated Ca2+ influx causes Ca2+ release from the intracellular Ca2+ channels that is required for T cell activation. J. Biol. Chem. 2008, 283, 12512–12519. [Google Scholar] [CrossRef] [PubMed]
- Nohara, L.L.; Stanwood, S.R.; Omilusik, K.D.; Jefferies, W.A. Tweeters, woofers and horns: The complex orchestration of calcium currents in T lymphocytes. Front. Immunol. 2015, 6, 234. [Google Scholar] [CrossRef] [PubMed]
- Khlusov, I.A.; Khlusova, M.Y.; Pichugin, V.F.; Sharkeev, Y.P.; Legostaeva, E.V. Artificial niches for stromal stem cells as a potential instrument for the design of the surface of biomimetic osteogenic materials. Russ. Phys. J. 2014, 56, 1206–1211. [Google Scholar] [CrossRef]
- Sundelacruz, S.; Levin, M.; Kaplan, D.L. Role of membrane potential in the regulation of cell proliferation and differentiation. Stem Cell Rev. 2009, 5, 231–246. [Google Scholar] [CrossRef] [PubMed]
- Wang, Y.; Yu, H.; Chen, C.; Zhao, Z. Review of the biocompatibility of micro-arc oxidation coated titanium alloys. Mater. Des. 2015, 85, 640–652. [Google Scholar] [CrossRef]


| Gene | Primers and Probes | Amplicon Mass |
|---|---|---|
| hTERT | Forward: 5′-ACCGTCTGCGTGAGGAGATC-3′ Reverse: 5′-CCGGTAGAAAAAGAGCCTGTTC-3′ | 131 base pairs |
| 18S rRNA | Forward: 5′-CTGAGAAACGGCTACCACATC-3′ Reverse: 5′-GCCTCGAAAGAGTCCTGTATTG-3′ | 153 base pairs |
| Studied Subpopulation | Fluorochromes and Labeled Monoclonal Antibodies | ||||
|---|---|---|---|---|---|
| PE | FITC | VioBlue | PE | APC | |
| Jurkat T cells | Propidium iodide | Annexin V | CD3 | CD56 | CD16 |
| CD4 | CD8 | ||||
| CD71 | CD95 | ||||
| CD45RA | CD45RO | ||||
| - | CD25 | ||||
| Group Studied (n = 7) | hTERT, a.u. |
|---|---|
| Control cell culture | 9.81 (8.90–11.18) |
| Cell culture in contact with the TiO2-coated titanium samples | 6.00 (4.48–6.95) * |
| Dead or Necrotic Cells, % | Cells Expressing Specific Surface Markers, % | ||||||||||
|---|---|---|---|---|---|---|---|---|---|---|---|
| Apoptosis | Necrosis | CD3 | CD4 | CD8 | CD71 | CD45RO | CD45RA | CD16 | CD56 | CD25 | CD95 |
| Cells cultured on plastic surface (control), n = 15 | |||||||||||
| 5.2 (5.2–8.9) | 8.2 (8.1–14.2) | 98 (97.9–98.85) | 27.5 (26.54–28.43) | 2.16 (1.9–3.0) | 94.0 (93.5–95.0) | 0.55 (0.49–0.60) | 94.9 (94.0–95.22) | 2.46 (2.34–2.83) | 2.5 (2.3–2.97) | 0 (0–0.16) | 1.0 (0.9–1.2) |
| Cells in contact with the TiO2-coated titanium samples, n = 15 | |||||||||||
| 5.9 (5.6–6.9) | 15.3 (8.2–19.3) | 97.5 (97–98) * <0.03 | 25.4 (24.76–26.70) * <0.002 | 0.31 (0.2–0.43) * <0.000003 | 94.1 (93.49–95.0) | 0.50 (0.41–0.50) | 94.0 (93.15–94.3) | 2.33 (2.17–2.34) | 2.36 (2.22–2.80) | 0 (0–0.12) | 0.56 (0.3–0.6) * <0.002 |
| Cytokine Concentration | ||||||
|---|---|---|---|---|---|---|
| IL-1b | IL-2 | IL-4 | IL-6 | IL-8 | IL-10 | TNFα |
| Control cell culture on plastic surface, n = 12 | ||||||
| 0 (0–0.23) | 5.67 (5.46–5.98) | 1.10 (0.74–1.24) | 0 | 11.12 (9.18–12.59) | 6.10 (5.40–6.96) | 14.95 (13.97–15.51) |
| Cell culture in contact with the TiO2-coated titanium samples, n = 12 | ||||||
| 0 (0–0.10) | 6.10 (3.30–8.10) | 0 (0–0.79) * <0.007 | 0 | 12.78 (11.71–13.22) | 7.80 (4.87–9.86) | 13.48 (8.0–14.15) * <0.01 |
| Index | % Viable Cells | % Apoptotic Cells | % Necrotic Cells | CD8 | CD56 | IL-2 | IL-4 | IL-10 | TNFa |
|---|---|---|---|---|---|---|---|---|---|
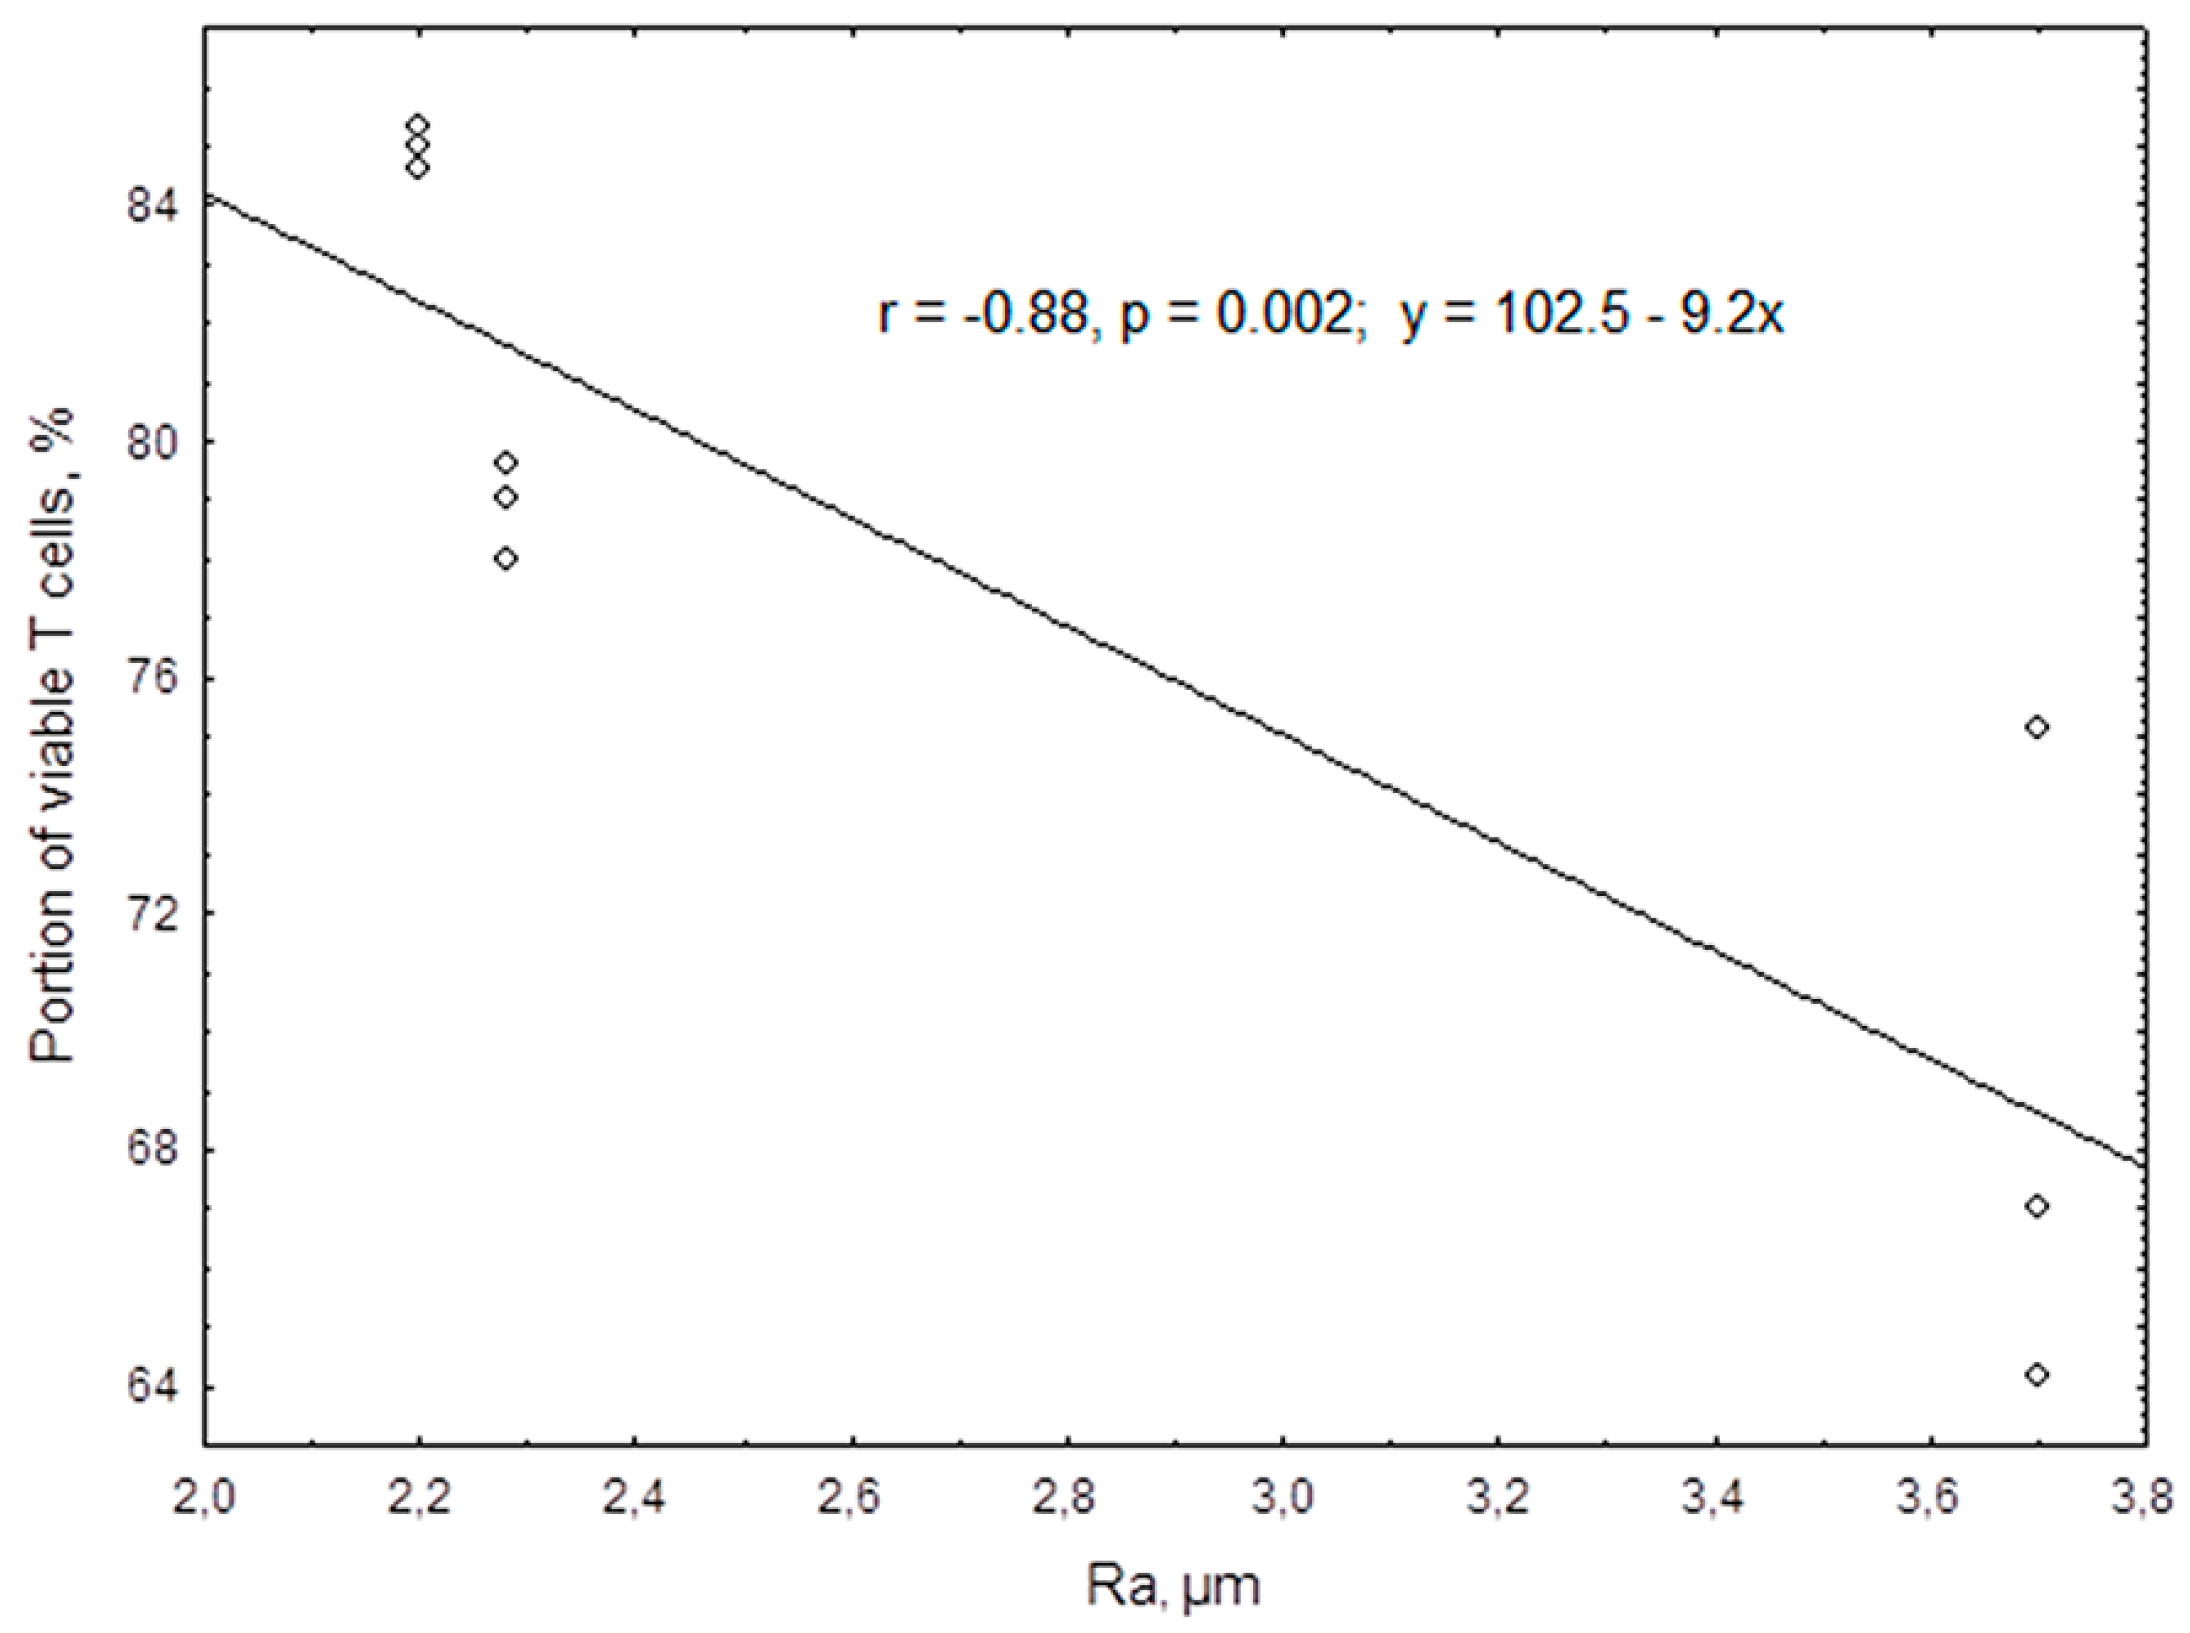
| Ra | −0.95 n = 9 0.0001 | −0.69 n = 9 0.042 | 0.95 n = 9 0.0001 | 0.71 n = 12 0.004 | −0.95 n = 12 0.0001 | −0.95 n = 12 0.000003 | −0.69 n = 12 0.013 | −0.92 n = 12 0.00003 | 0.68 n = 12 0.015 |
| No. | Group | Results | |
|---|---|---|---|
| Number of Apoptotic Cells, % | ROS, a.u. | ||
| 1 | Cells cultured on plastic surface without nanoparticle suspension, n = 6 | 5.87 (5.32–6.99) | 0.130 (0.123–0.150) |
| Concentration of TiO2 nanoparticle samples, n = 3 | |||
| 2 | 100 MACs | 4.82 (4.24–8.50) | 0.131 (0.129–0.194) |
| 3 | 10 MACs | 4.76 (3.65–6.39) | 0.139 (0.130–0.162) |
| Concentration of Fe3O4 nanoparticle samples, n = 3 | |||
| 4 | 10 MACs | 4.39 (3.05–5.10) P1 < 0.02 | 0.123 (0.103–0.150) |
| No | Group | Cytokine Concentration | ||
|---|---|---|---|---|
| TNFα | IL-2 | IL-4 | ||
| 1 | Cells cultured on plastic surface without nanoparticle samples, n = 6 | 27.41 (26.62–28.17) | 4.02 (3.97–4.04) | 4.14 (4.06–4.24) |
| Concentration of TiO2 nanoparticle samples, n = 3 | ||||
| 2 | 100 MACs | 33.52 (32.77–35.0) P1 < 0.05 | 4.73 (4.61–5.0) P1 < 0.05 | 3.67 (3.60–3.67) P1 < 0.045 |
| 3 | 10 MACs | 33.51 (33.17–35.49) P1, P4 < 0.05 | 3.61 (3.56–4.55) | 3.40 (3.27–3.60) P1, P4 < 0.045 |
| Concentration of Fe3O4 nanoparticle samples, n = 3 | ||||
| 4 | 10 MACs | 26.62 (24.72–27.34) | 4.23 (4.0–4.29) | 4.39 (4.10–4.52) |
© 2018 by the authors. Licensee MDPI, Basel, Switzerland. This article is an open access article distributed under the terms and conditions of the Creative Commons Attribution (CC BY) license (http://creativecommons.org/licenses/by/4.0/).
Share and Cite
Khlusov, I.; Litvinova, L.; Shupletsova, V.; Khaziakhmatova, O.; Melashchenko, E.; Yurova, K.; Leitsin, V.; Khlusova, M.; Pichugin, V.; Sharkeev, Y. Rough Titanium Oxide Coating Prepared by Micro-Arc Oxidation Causes Down-Regulation of hTERT Expression, Molecular Presentation, and Cytokine Secretion in Tumor Jurkat T Cells. Materials 2018, 11, 360. https://doi.org/10.3390/ma11030360
Khlusov I, Litvinova L, Shupletsova V, Khaziakhmatova O, Melashchenko E, Yurova K, Leitsin V, Khlusova M, Pichugin V, Sharkeev Y. Rough Titanium Oxide Coating Prepared by Micro-Arc Oxidation Causes Down-Regulation of hTERT Expression, Molecular Presentation, and Cytokine Secretion in Tumor Jurkat T Cells. Materials. 2018; 11(3):360. https://doi.org/10.3390/ma11030360
Chicago/Turabian StyleKhlusov, Igor, Larisa Litvinova, Valeria Shupletsova, Olga Khaziakhmatova, Elena Melashchenko, Kristina Yurova, Vladimir Leitsin, Marina Khlusova, Vladimir Pichugin, and Yurii Sharkeev. 2018. "Rough Titanium Oxide Coating Prepared by Micro-Arc Oxidation Causes Down-Regulation of hTERT Expression, Molecular Presentation, and Cytokine Secretion in Tumor Jurkat T Cells" Materials 11, no. 3: 360. https://doi.org/10.3390/ma11030360
APA StyleKhlusov, I., Litvinova, L., Shupletsova, V., Khaziakhmatova, O., Melashchenko, E., Yurova, K., Leitsin, V., Khlusova, M., Pichugin, V., & Sharkeev, Y. (2018). Rough Titanium Oxide Coating Prepared by Micro-Arc Oxidation Causes Down-Regulation of hTERT Expression, Molecular Presentation, and Cytokine Secretion in Tumor Jurkat T Cells. Materials, 11(3), 360. https://doi.org/10.3390/ma11030360