Protein-Based Nanoparticle Preparation via Nanoprecipitation Method


Abstract
:
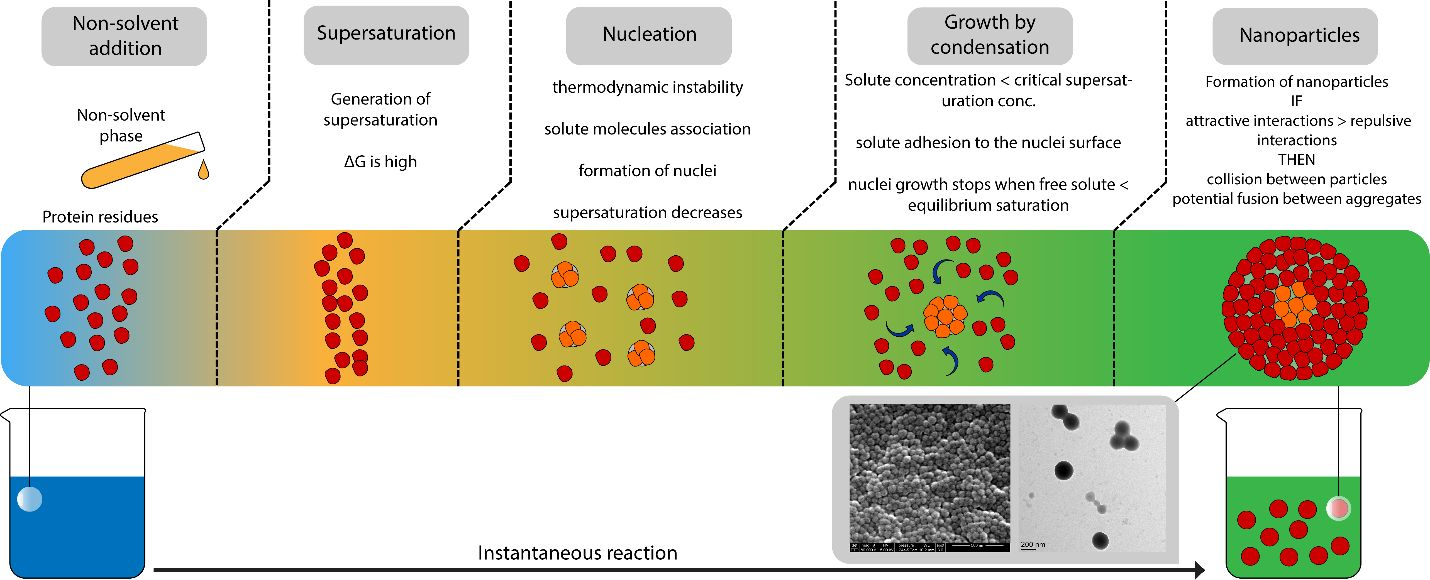
1. Introduction
2. Materials and Methods
2.1. Chemical Reagents
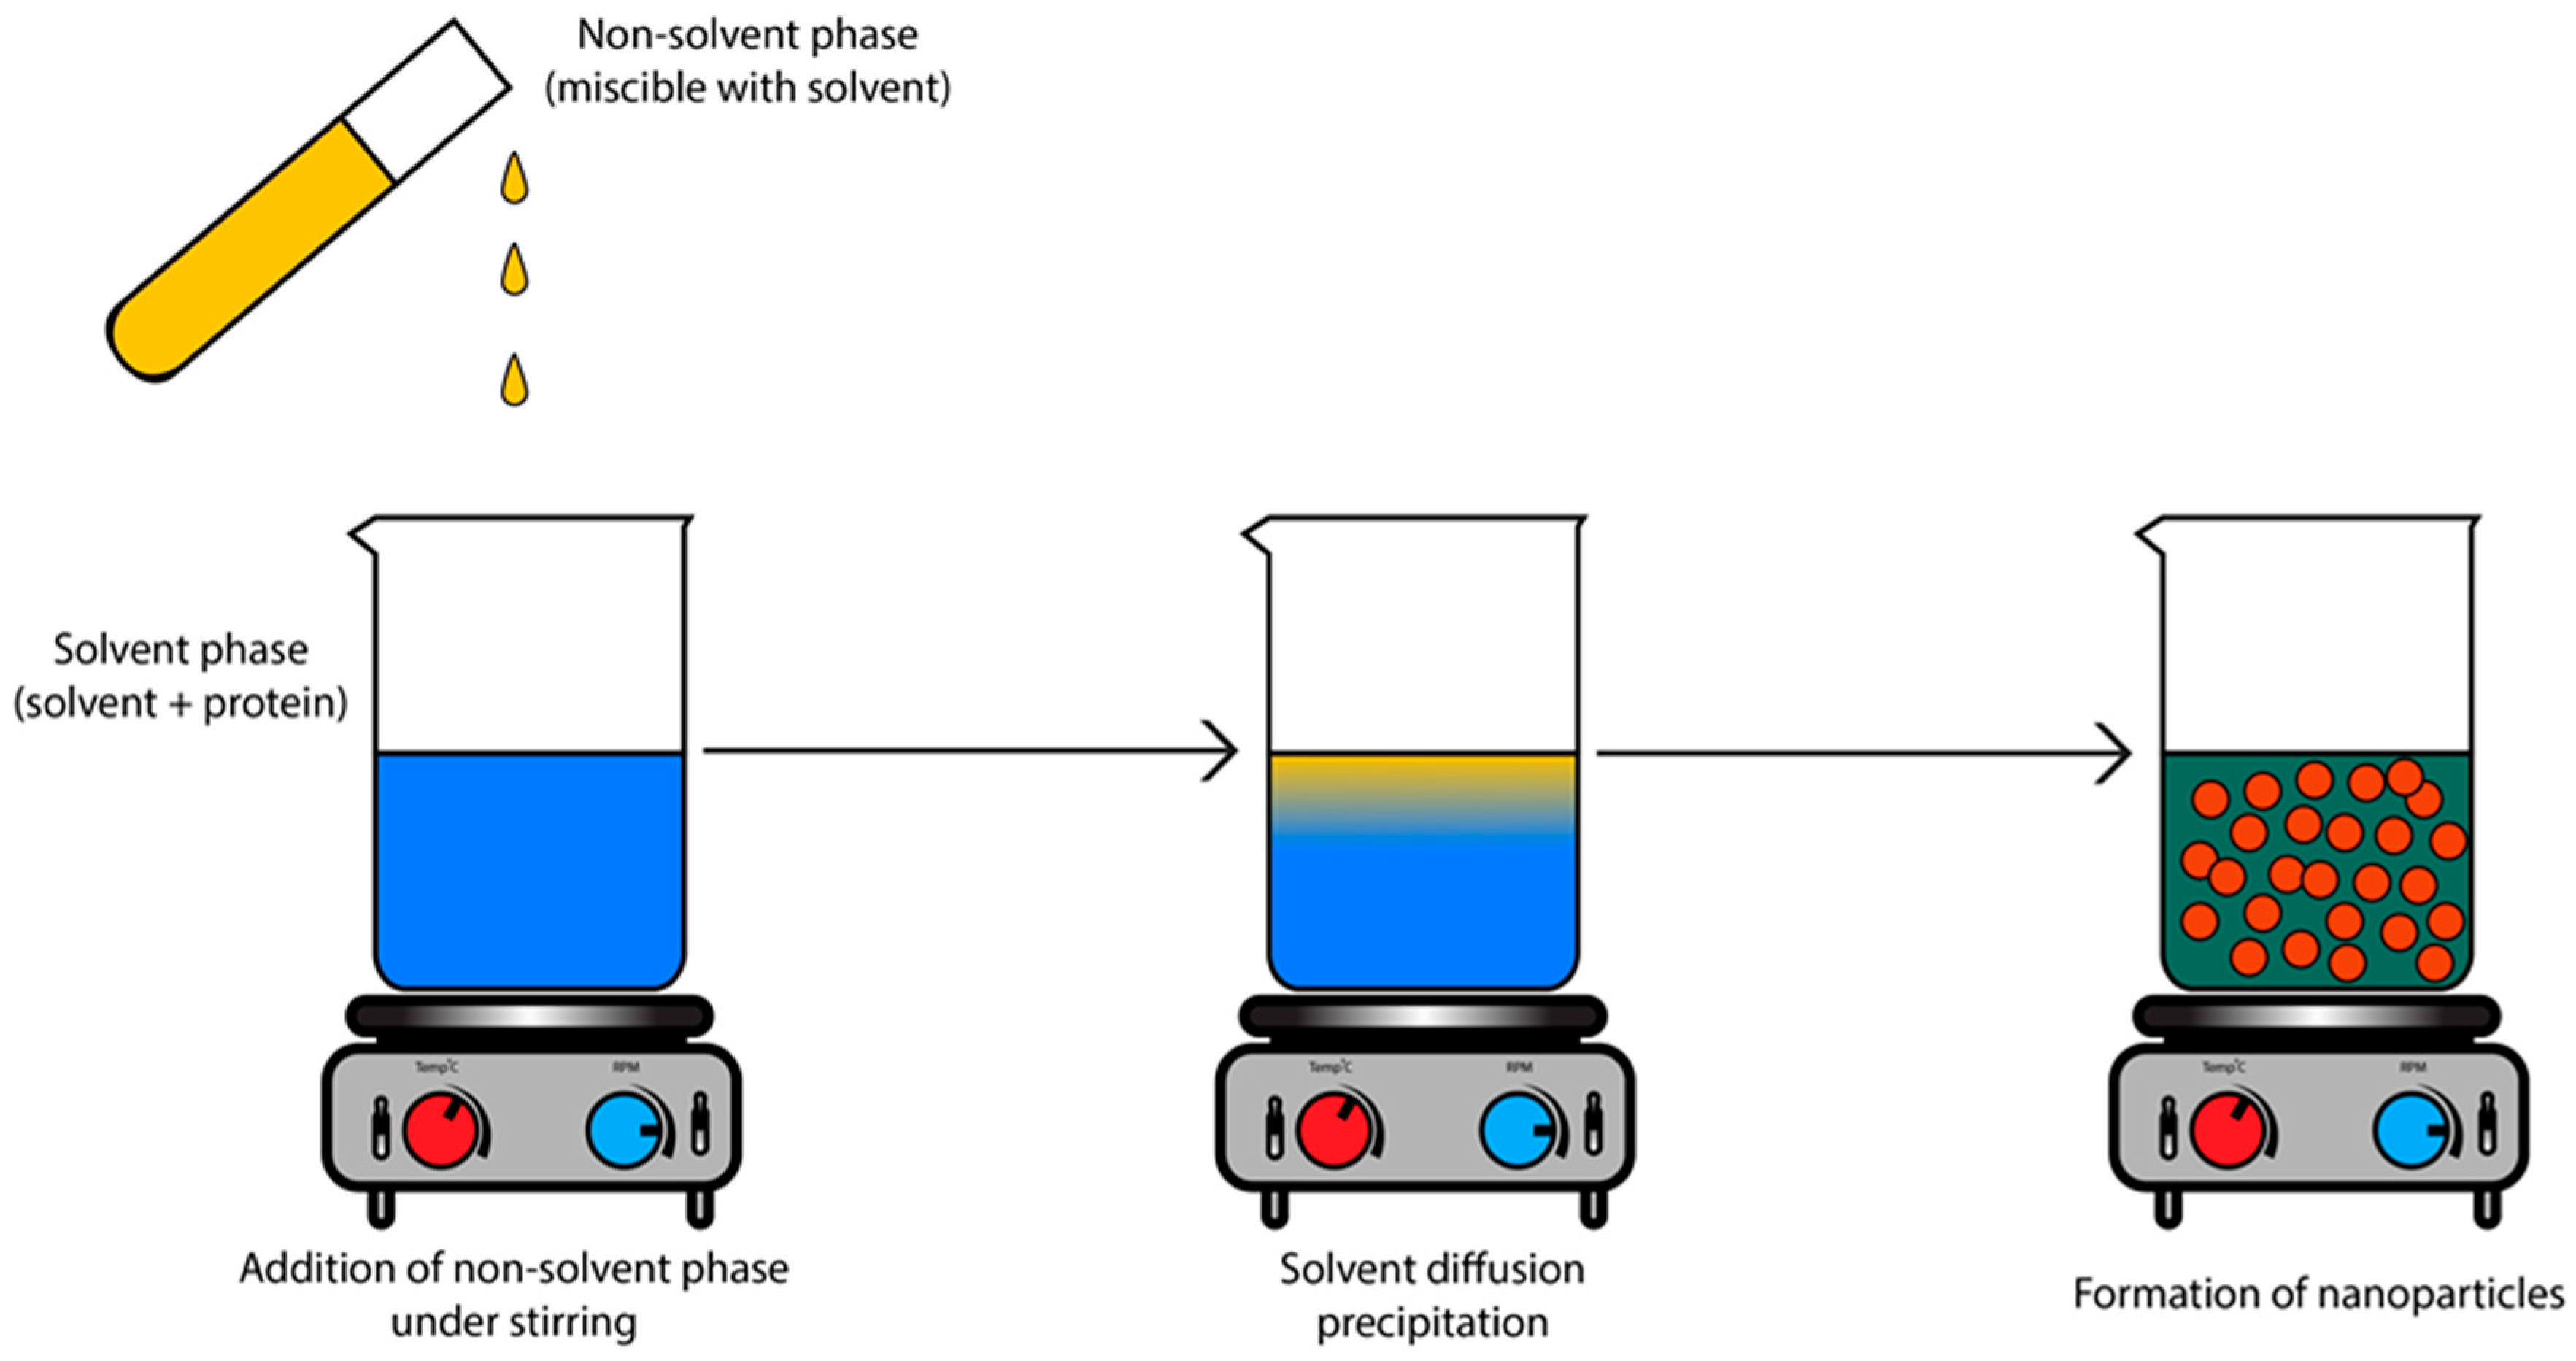
2.2. Preparation of BSA Nanoparticles
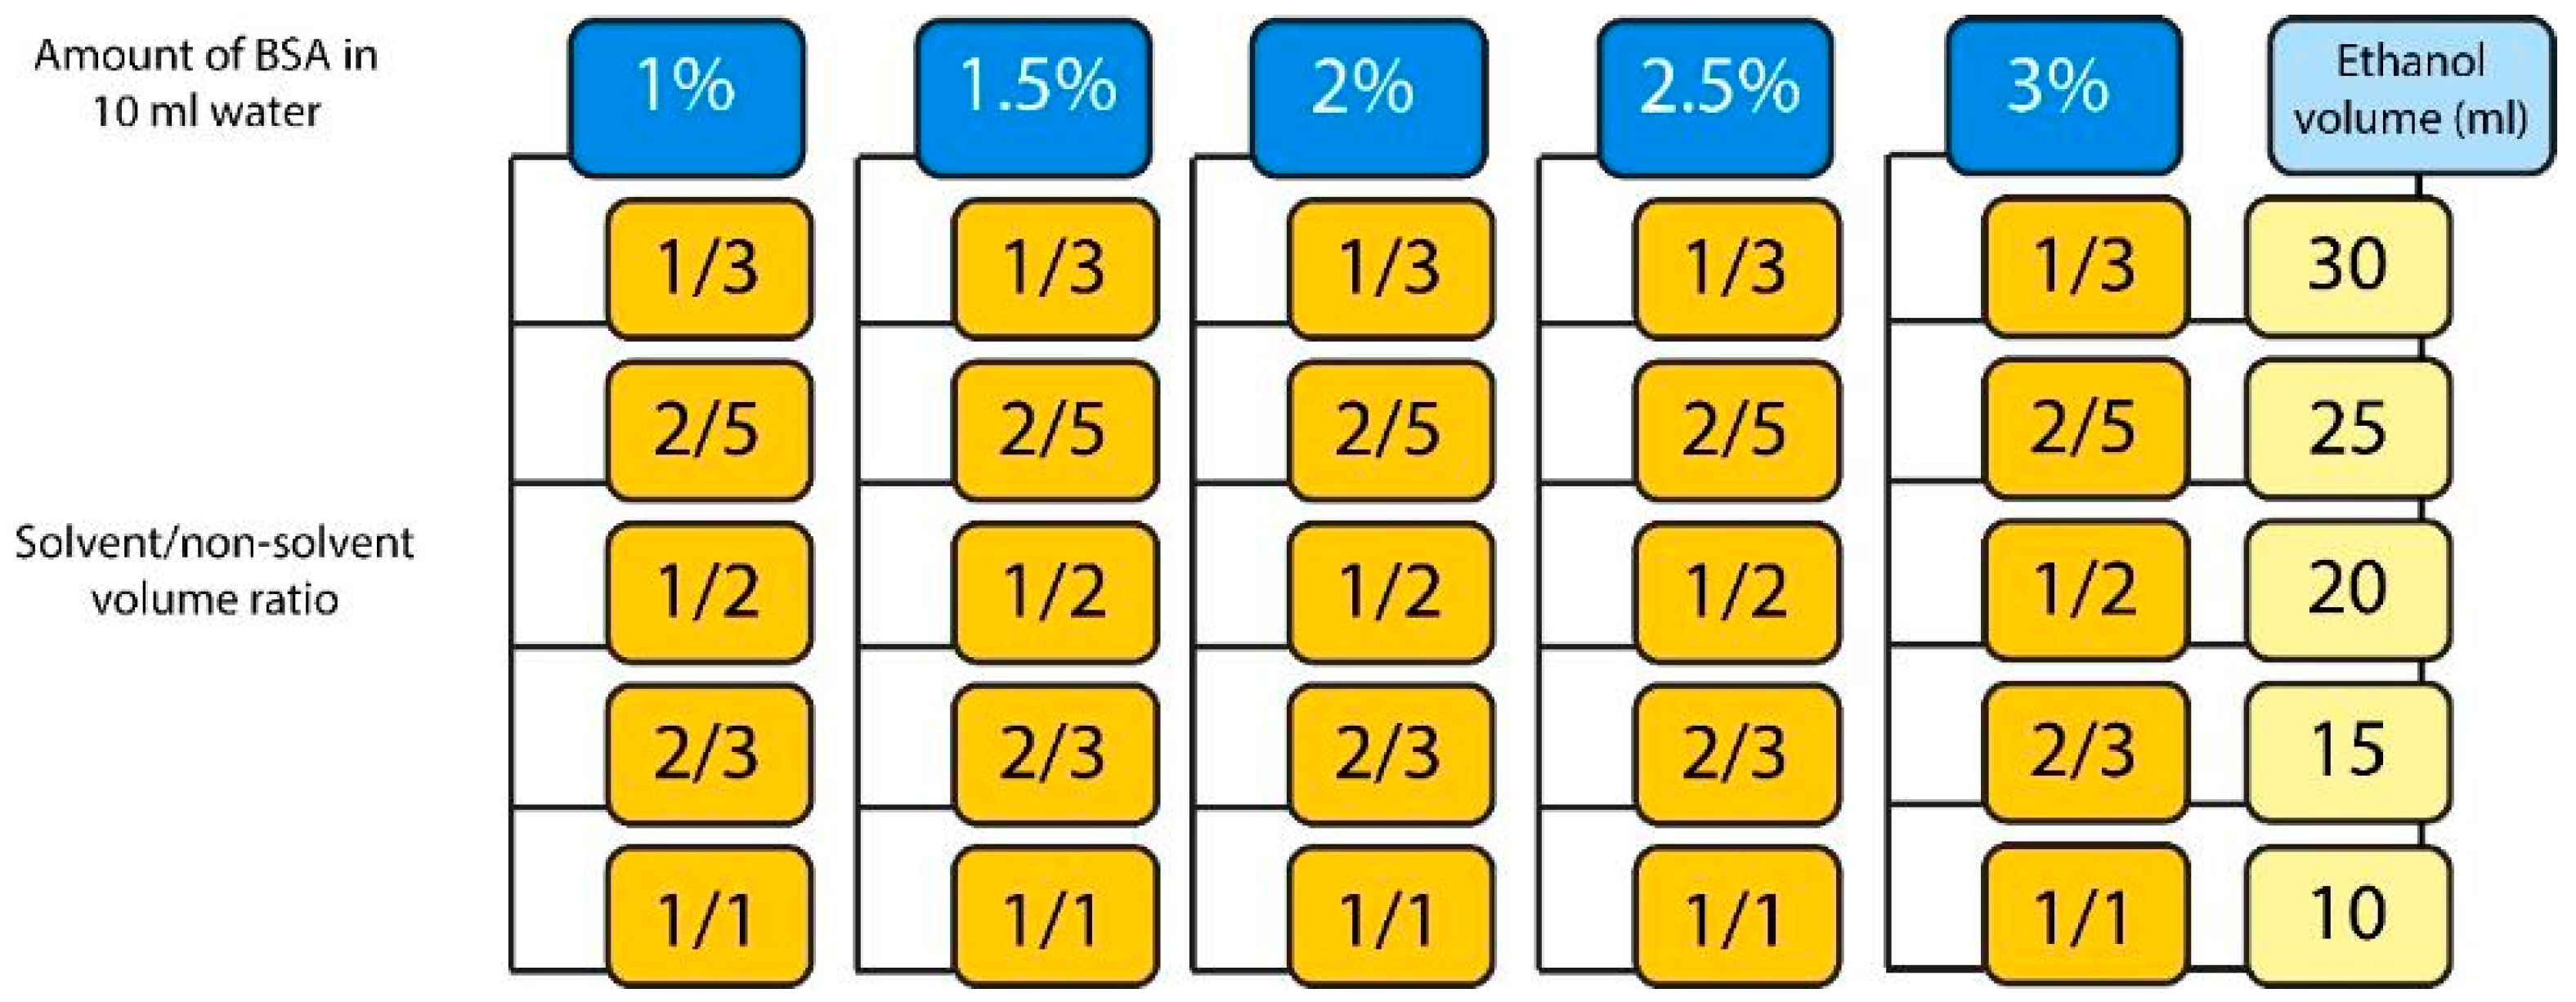
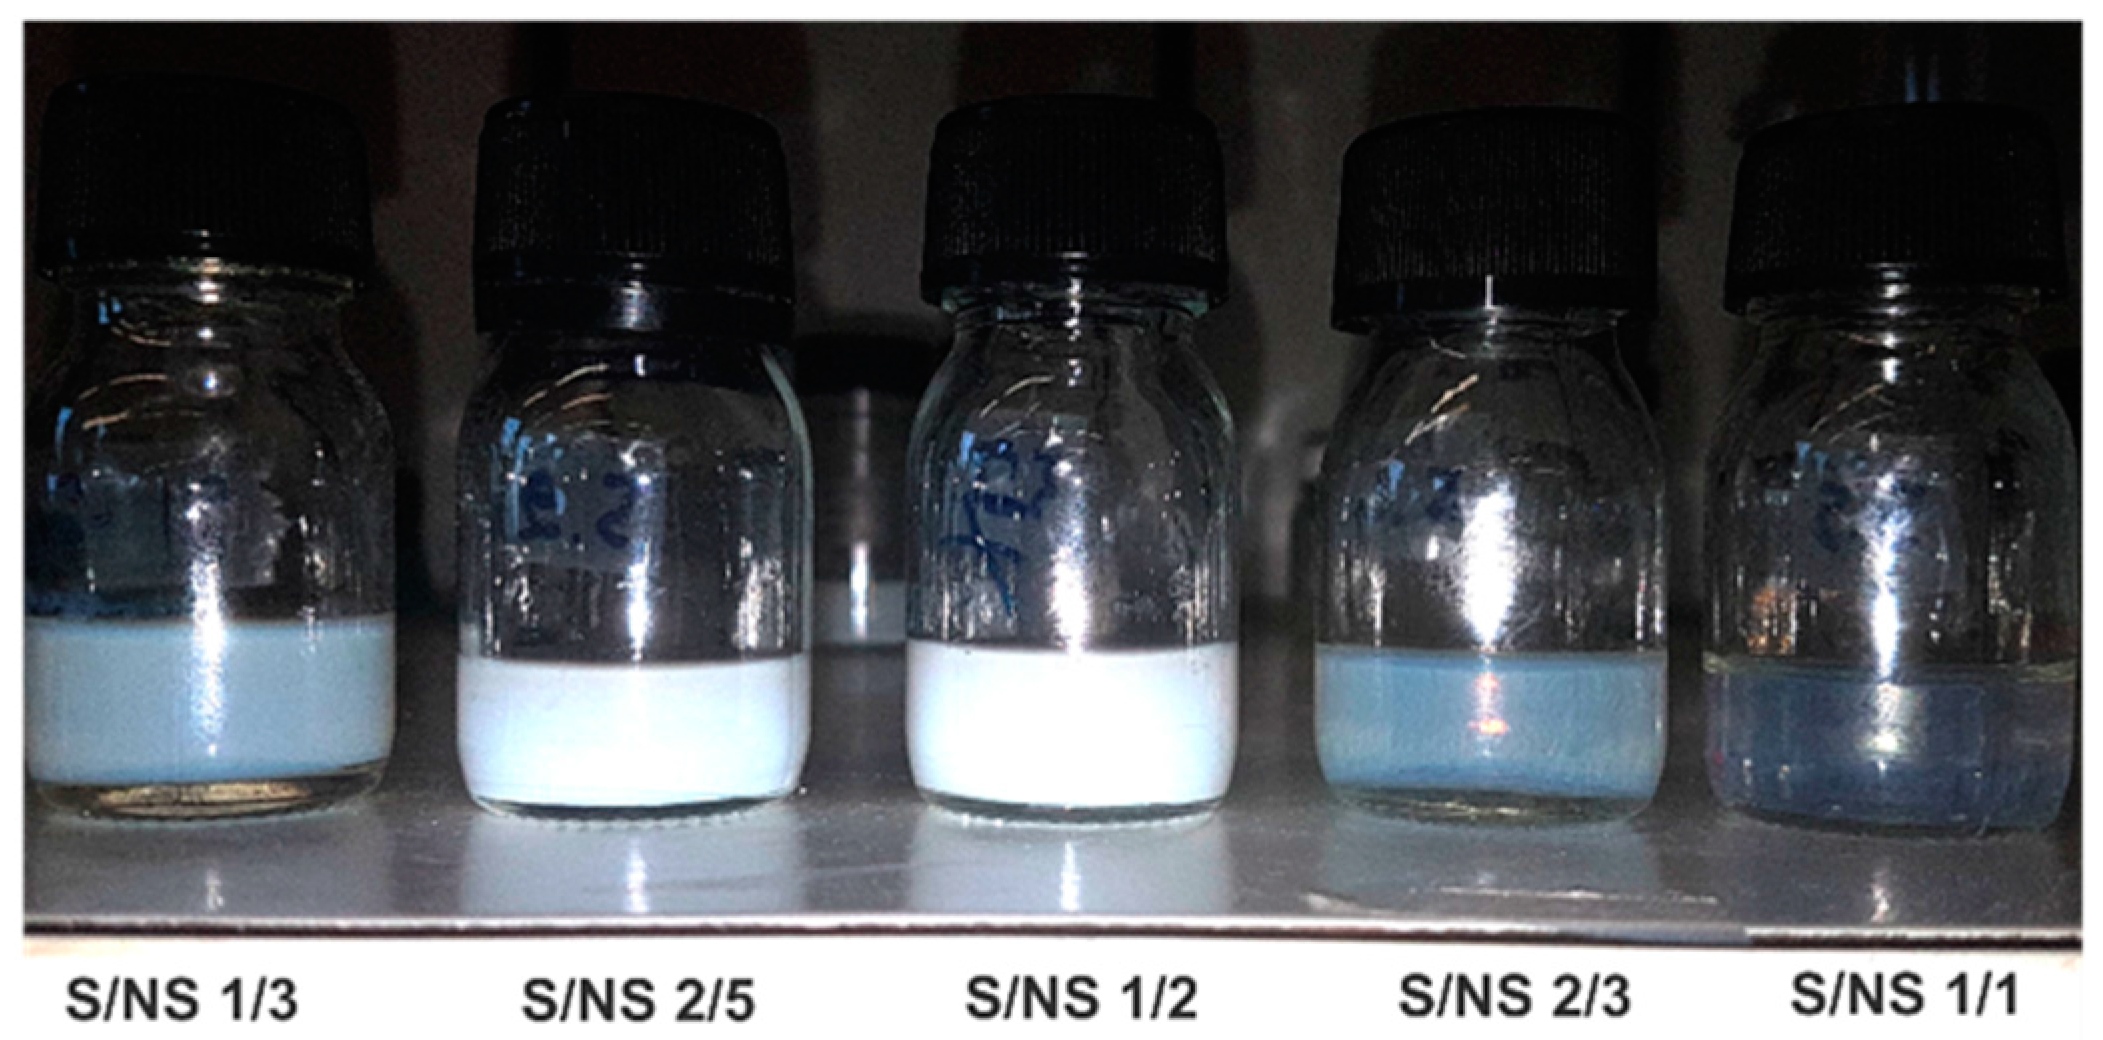
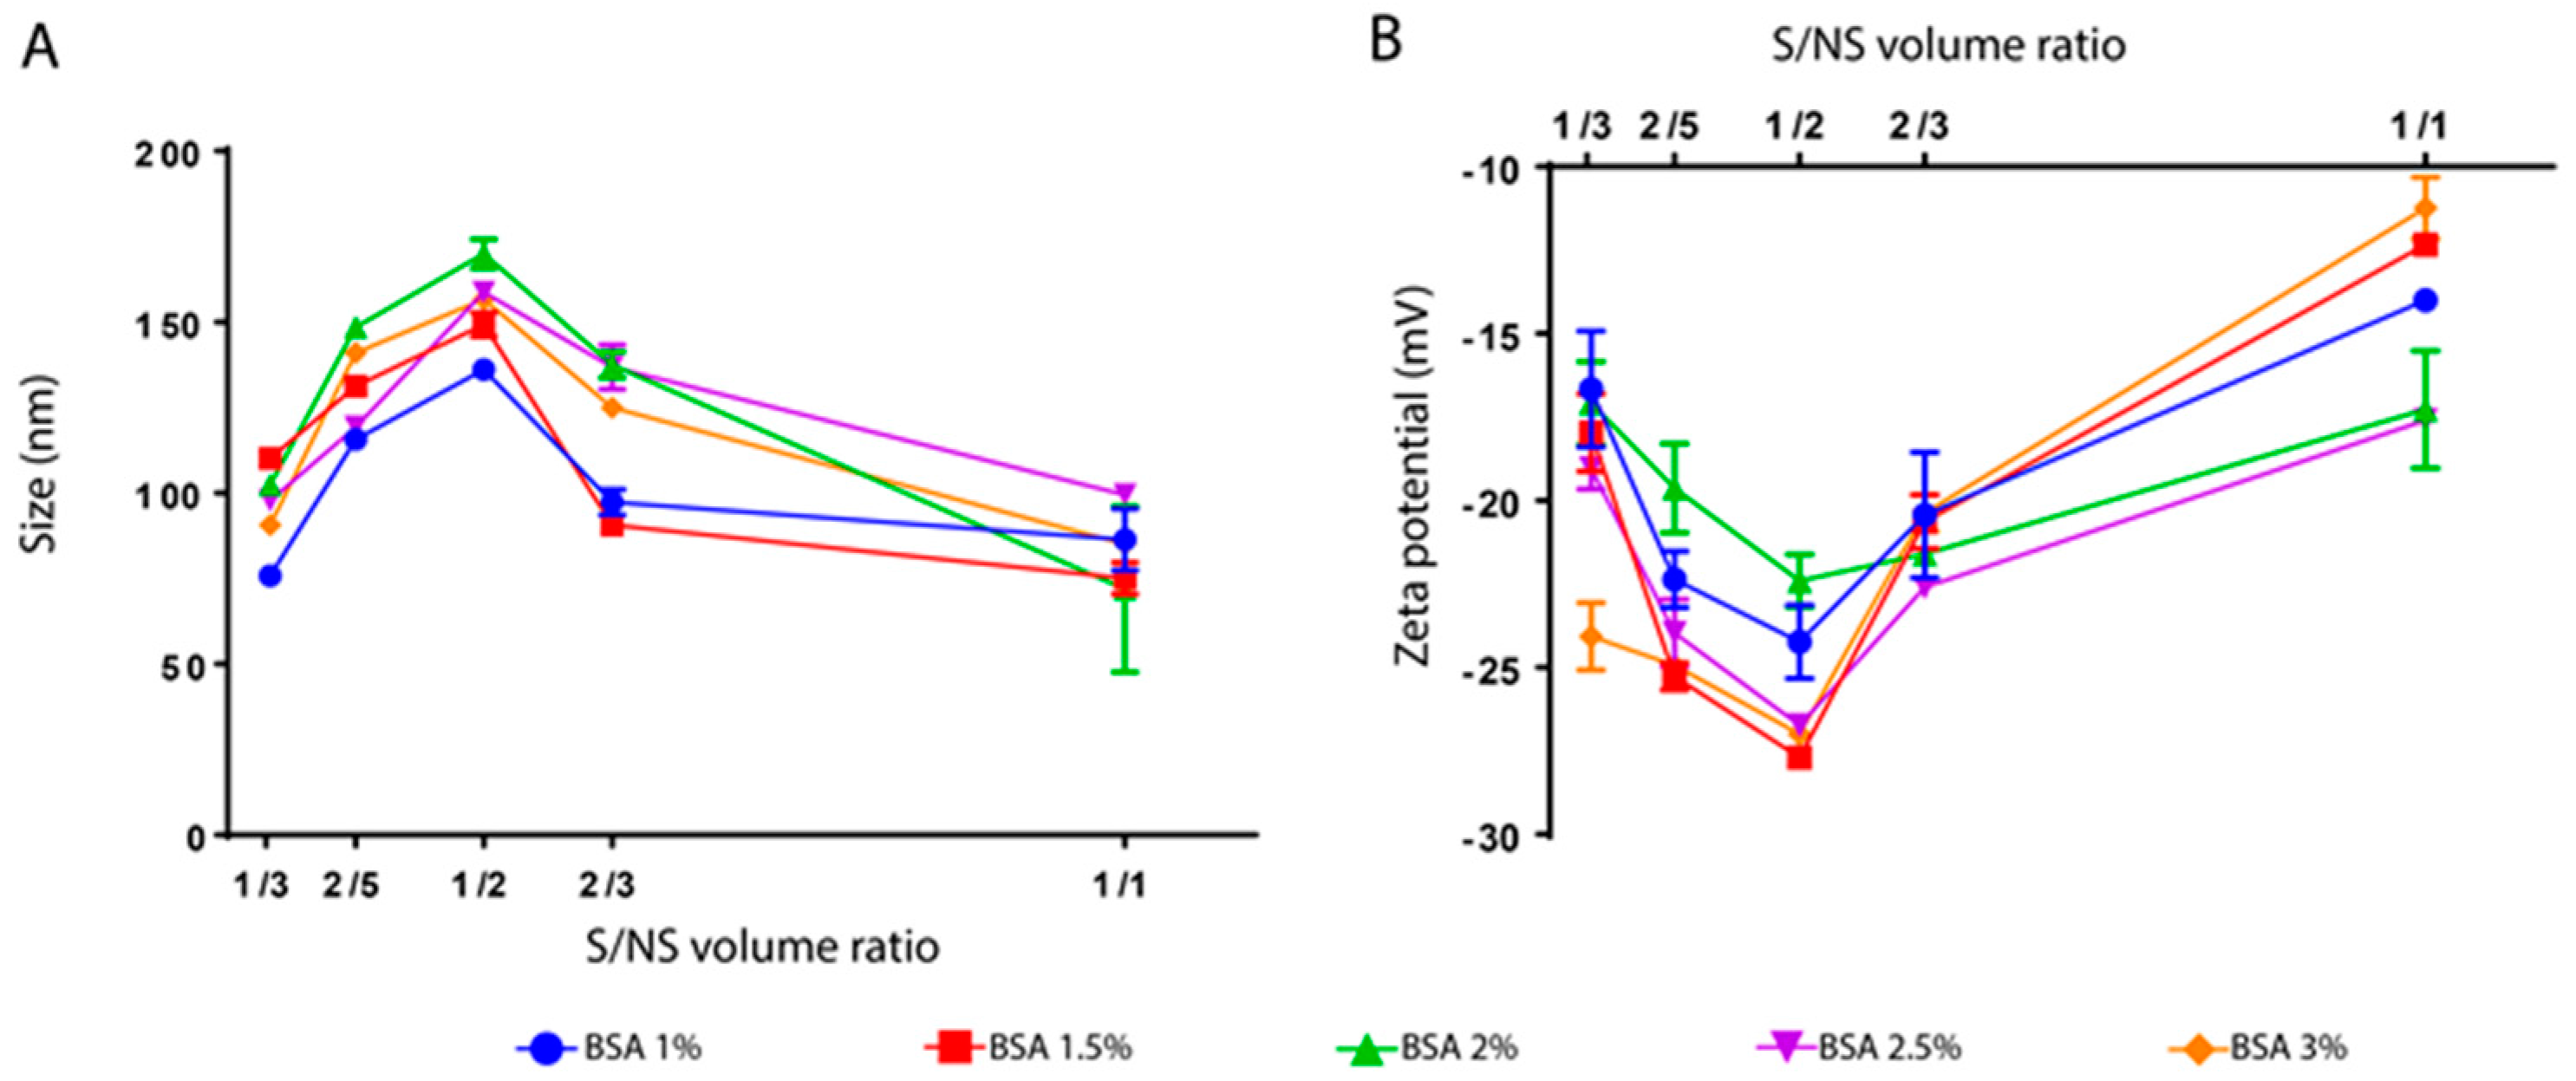
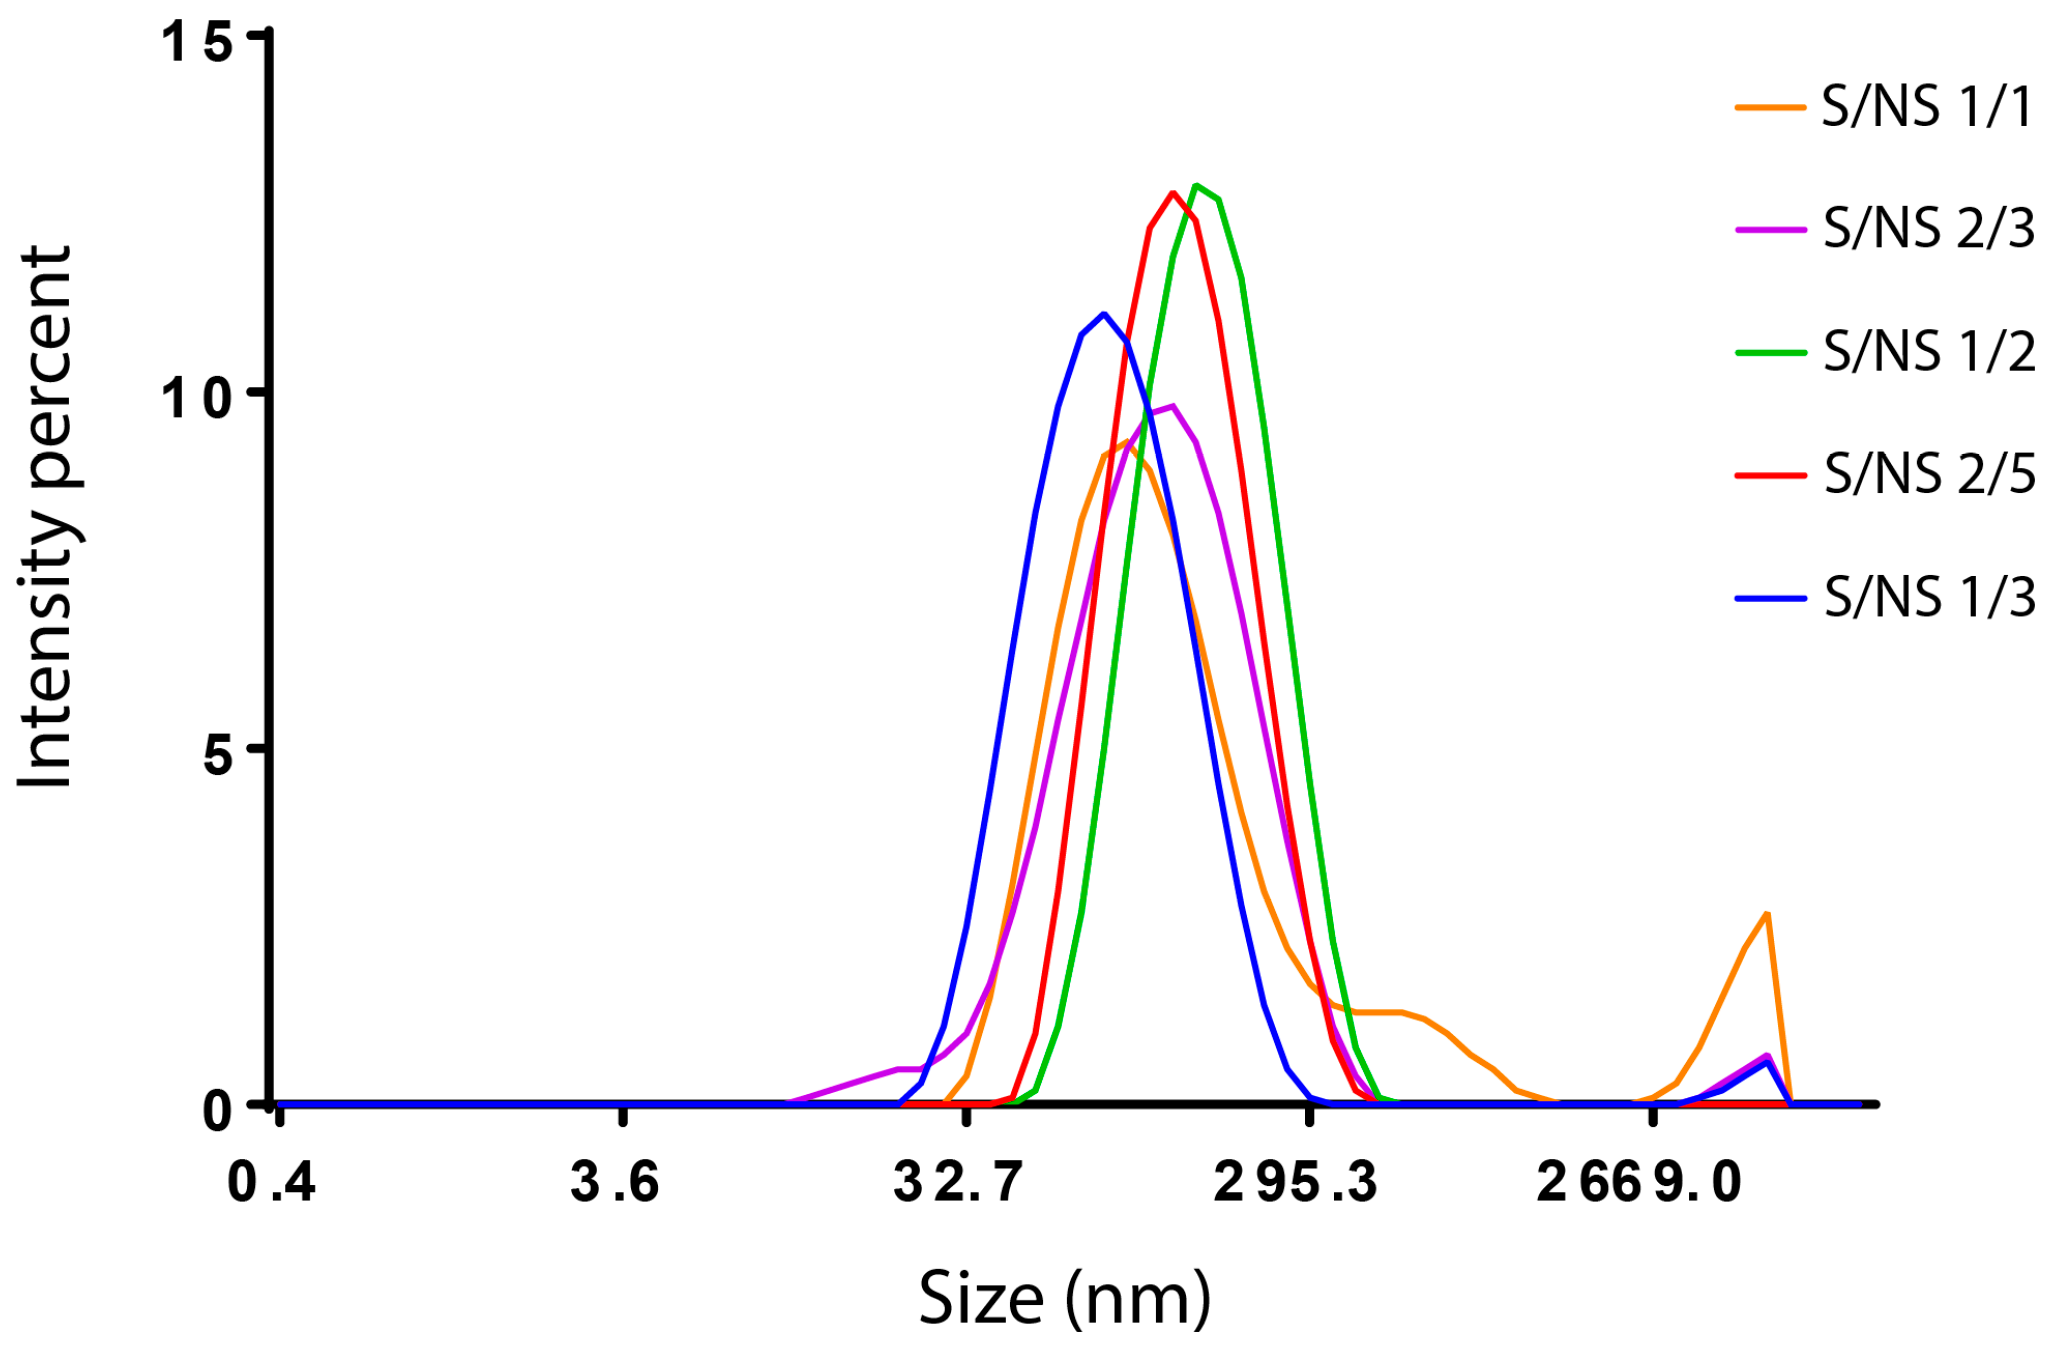
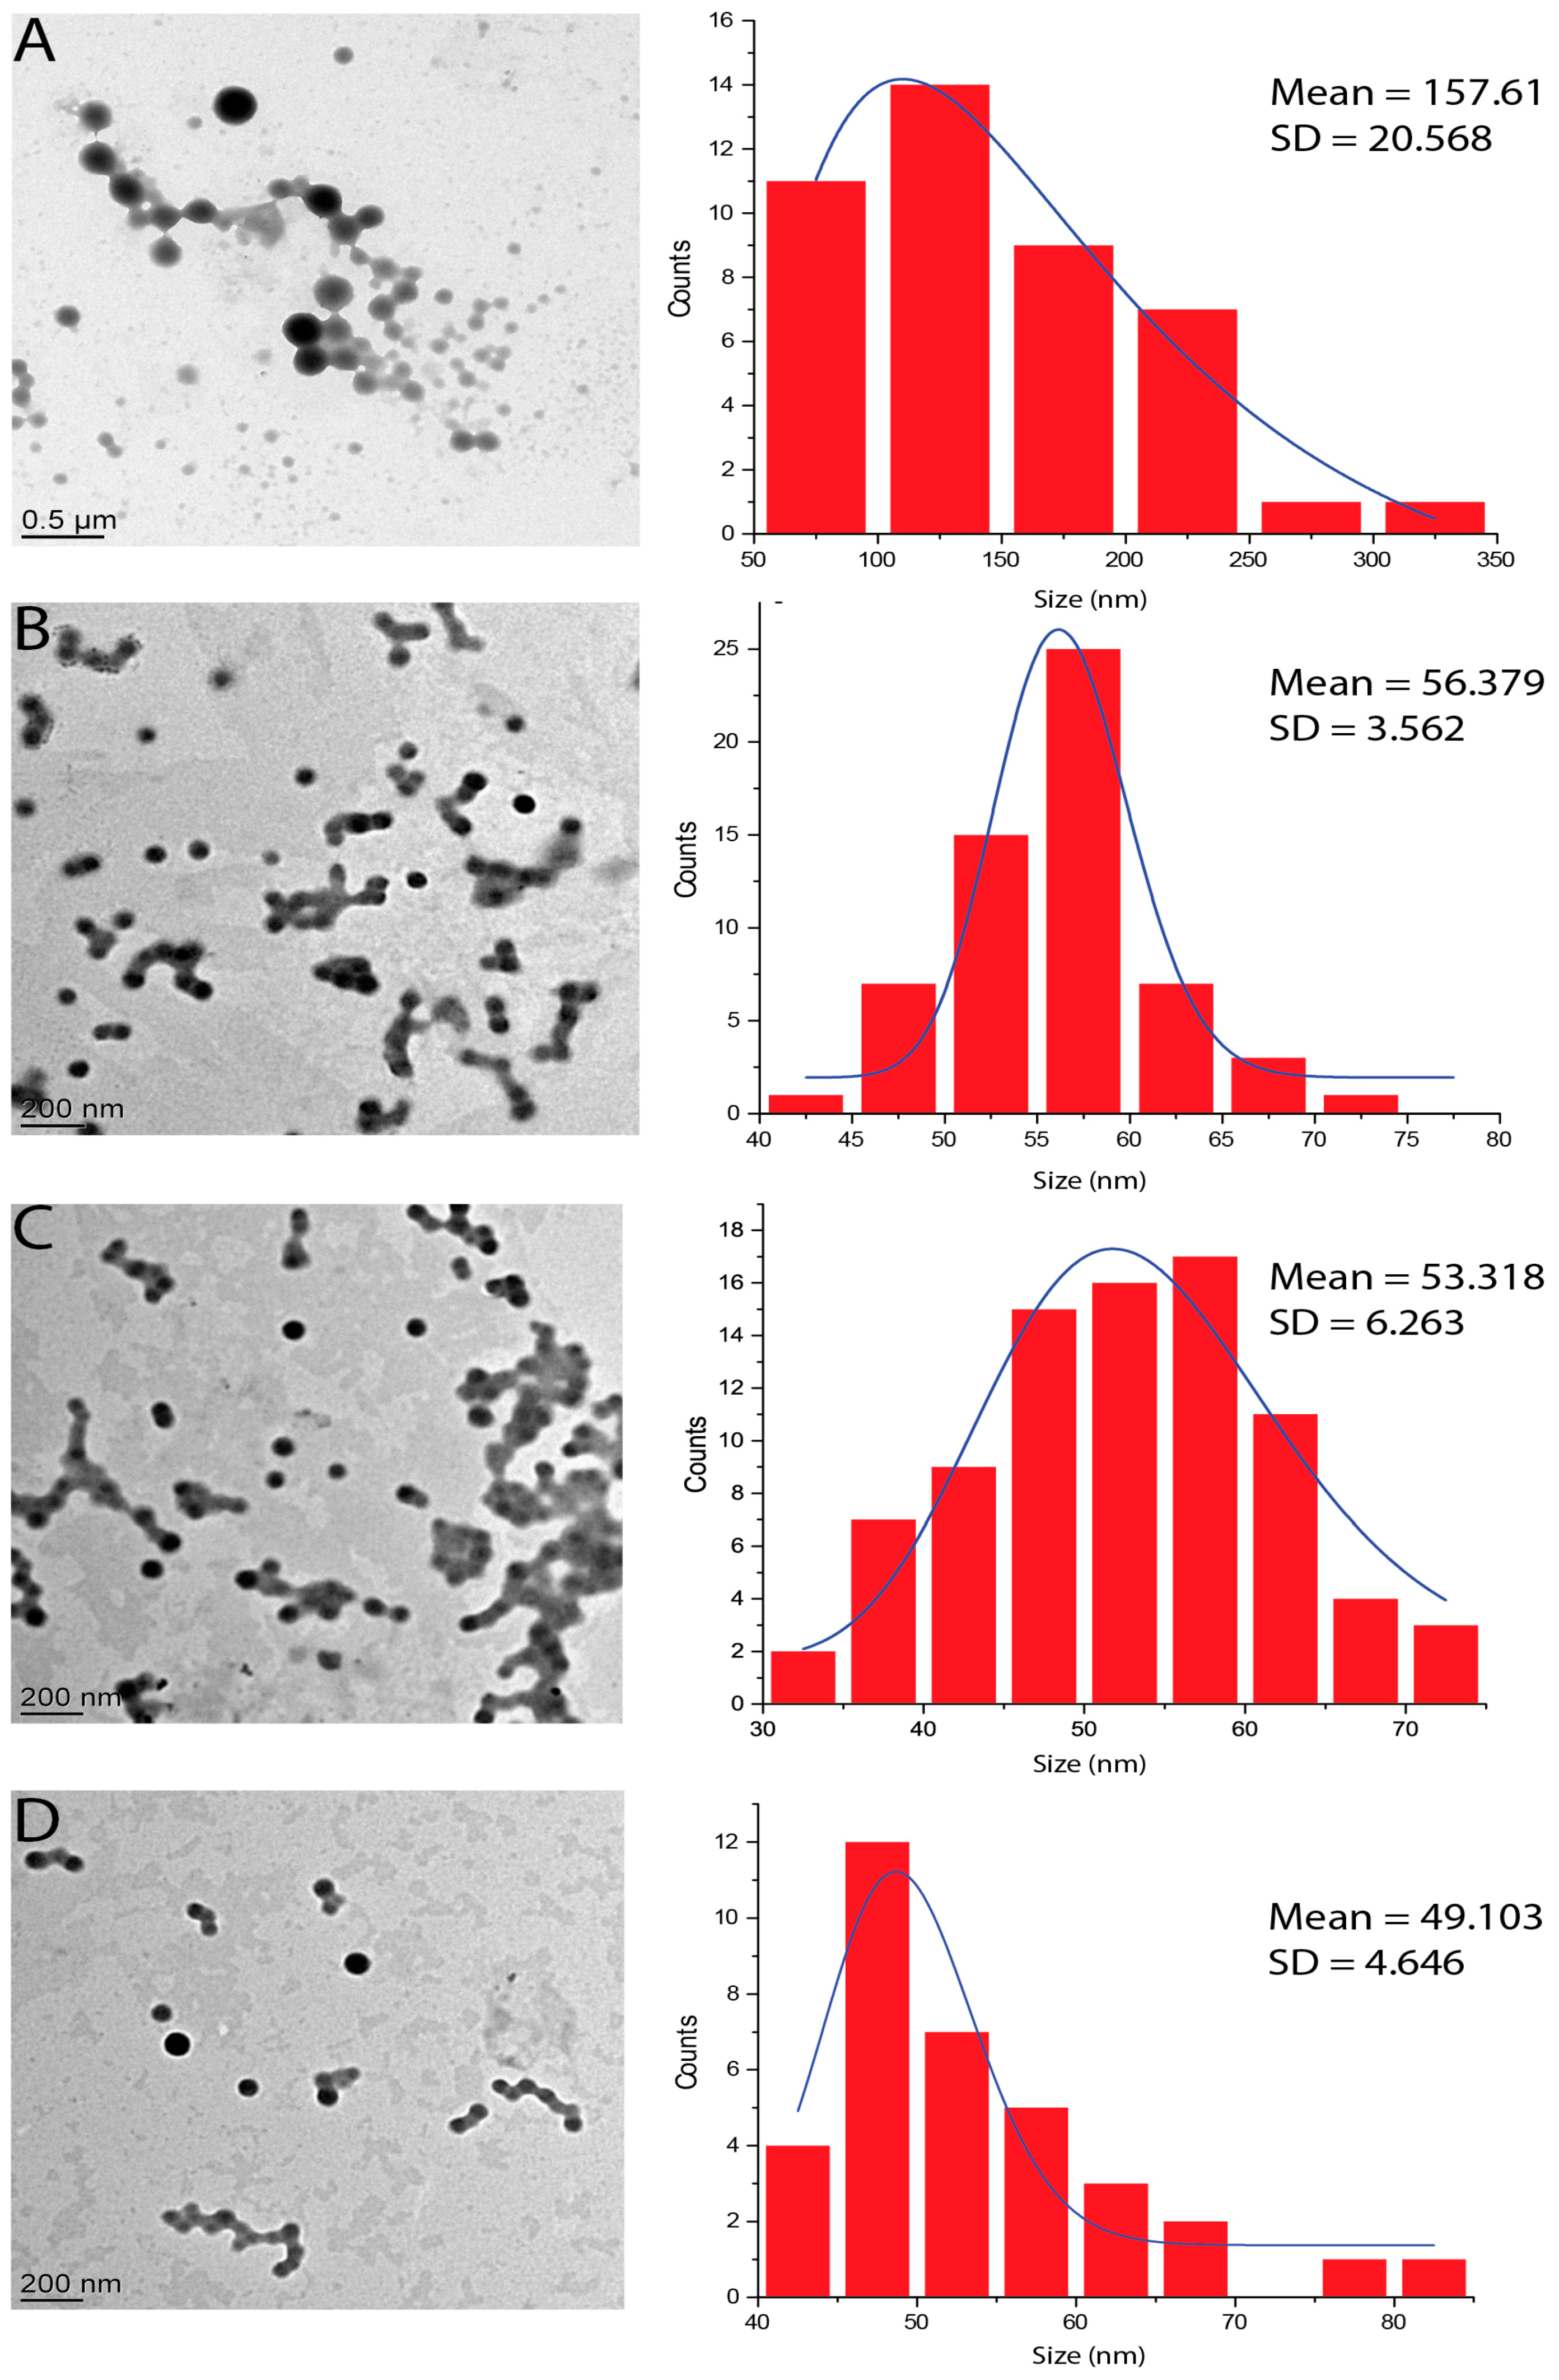
2.2.1. Effect of BSA Concentration and Solvent/Non-Solvent Volume Ratio
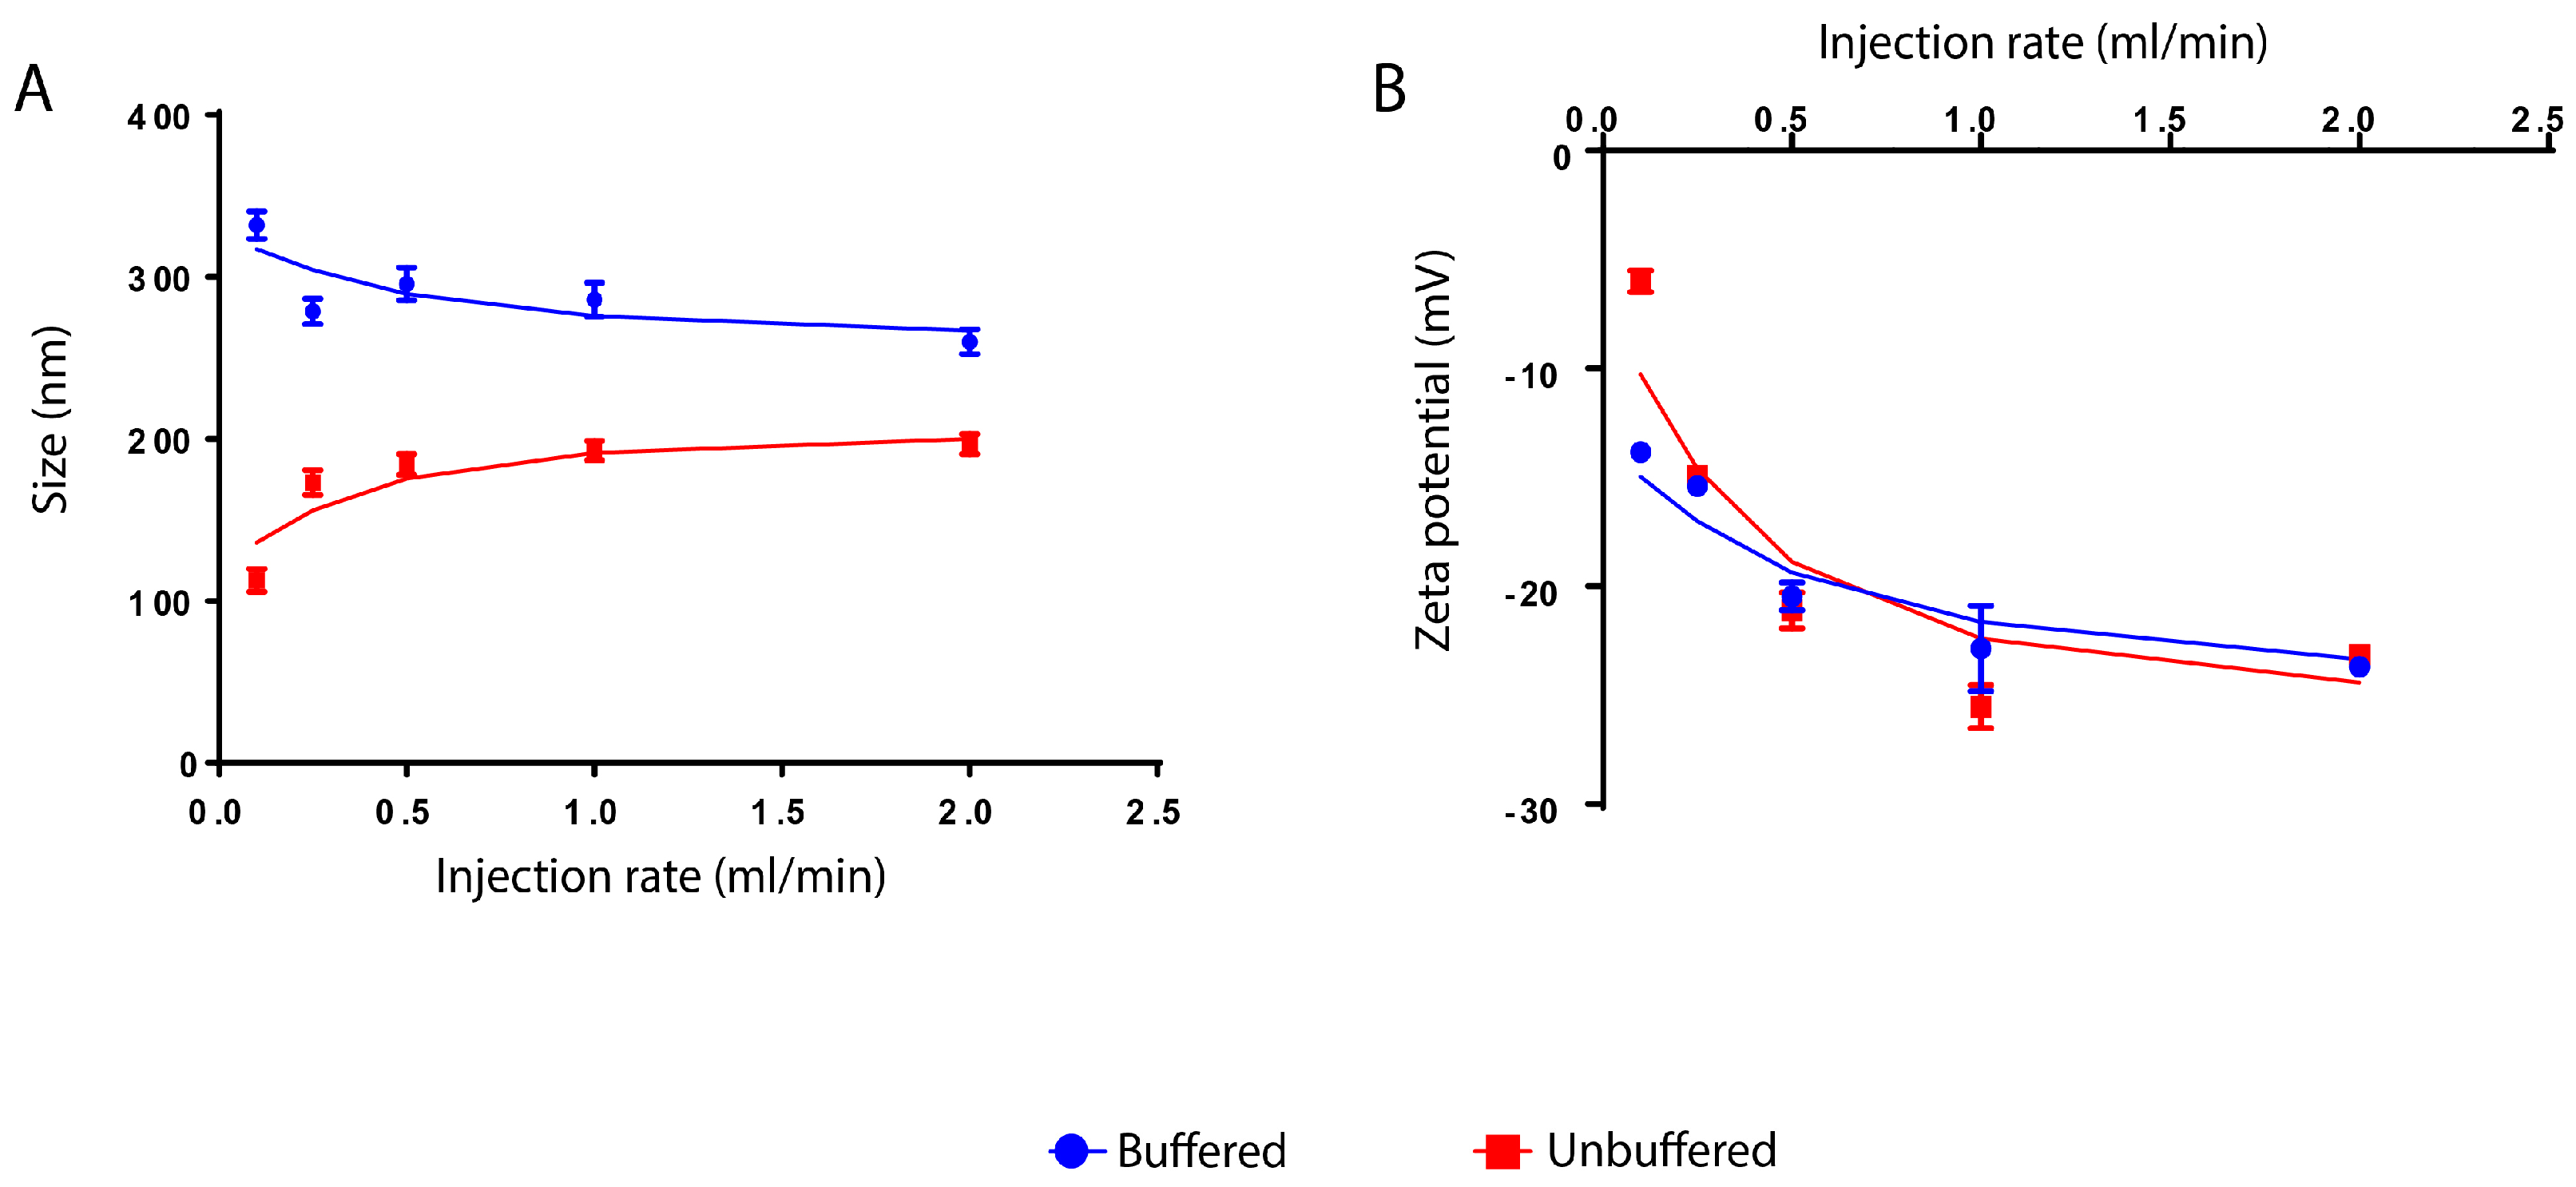
2.2.2. Effect of Ethanol Injection Rate
2.2.3. Effect of Ionic Strength
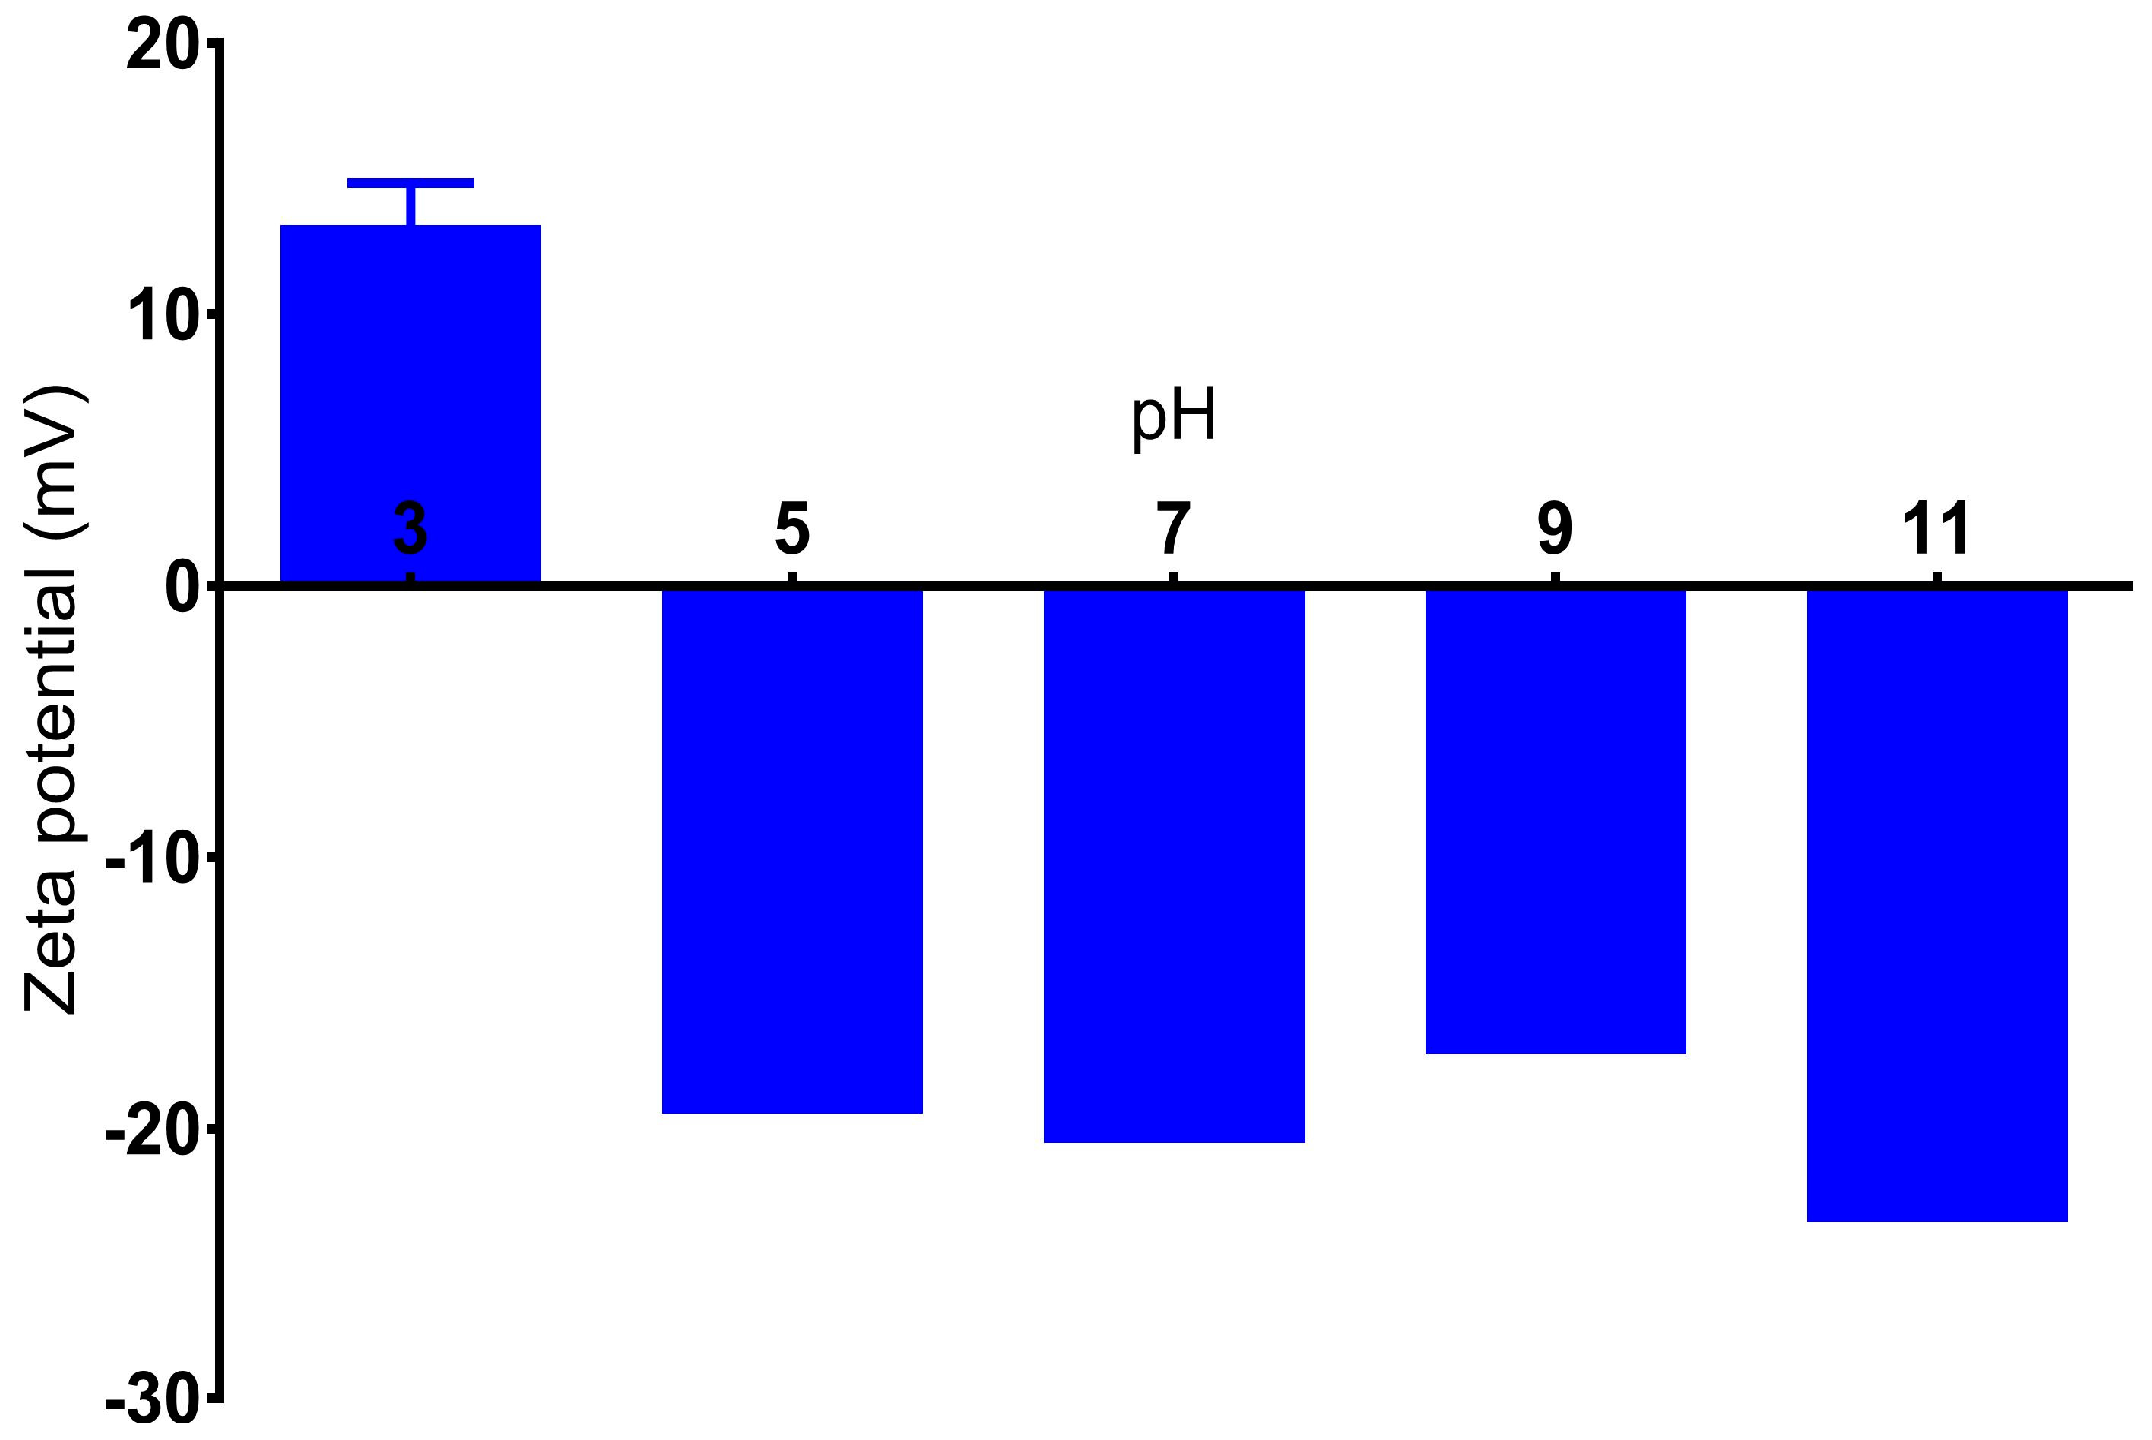
2.2.4. Effect of pH
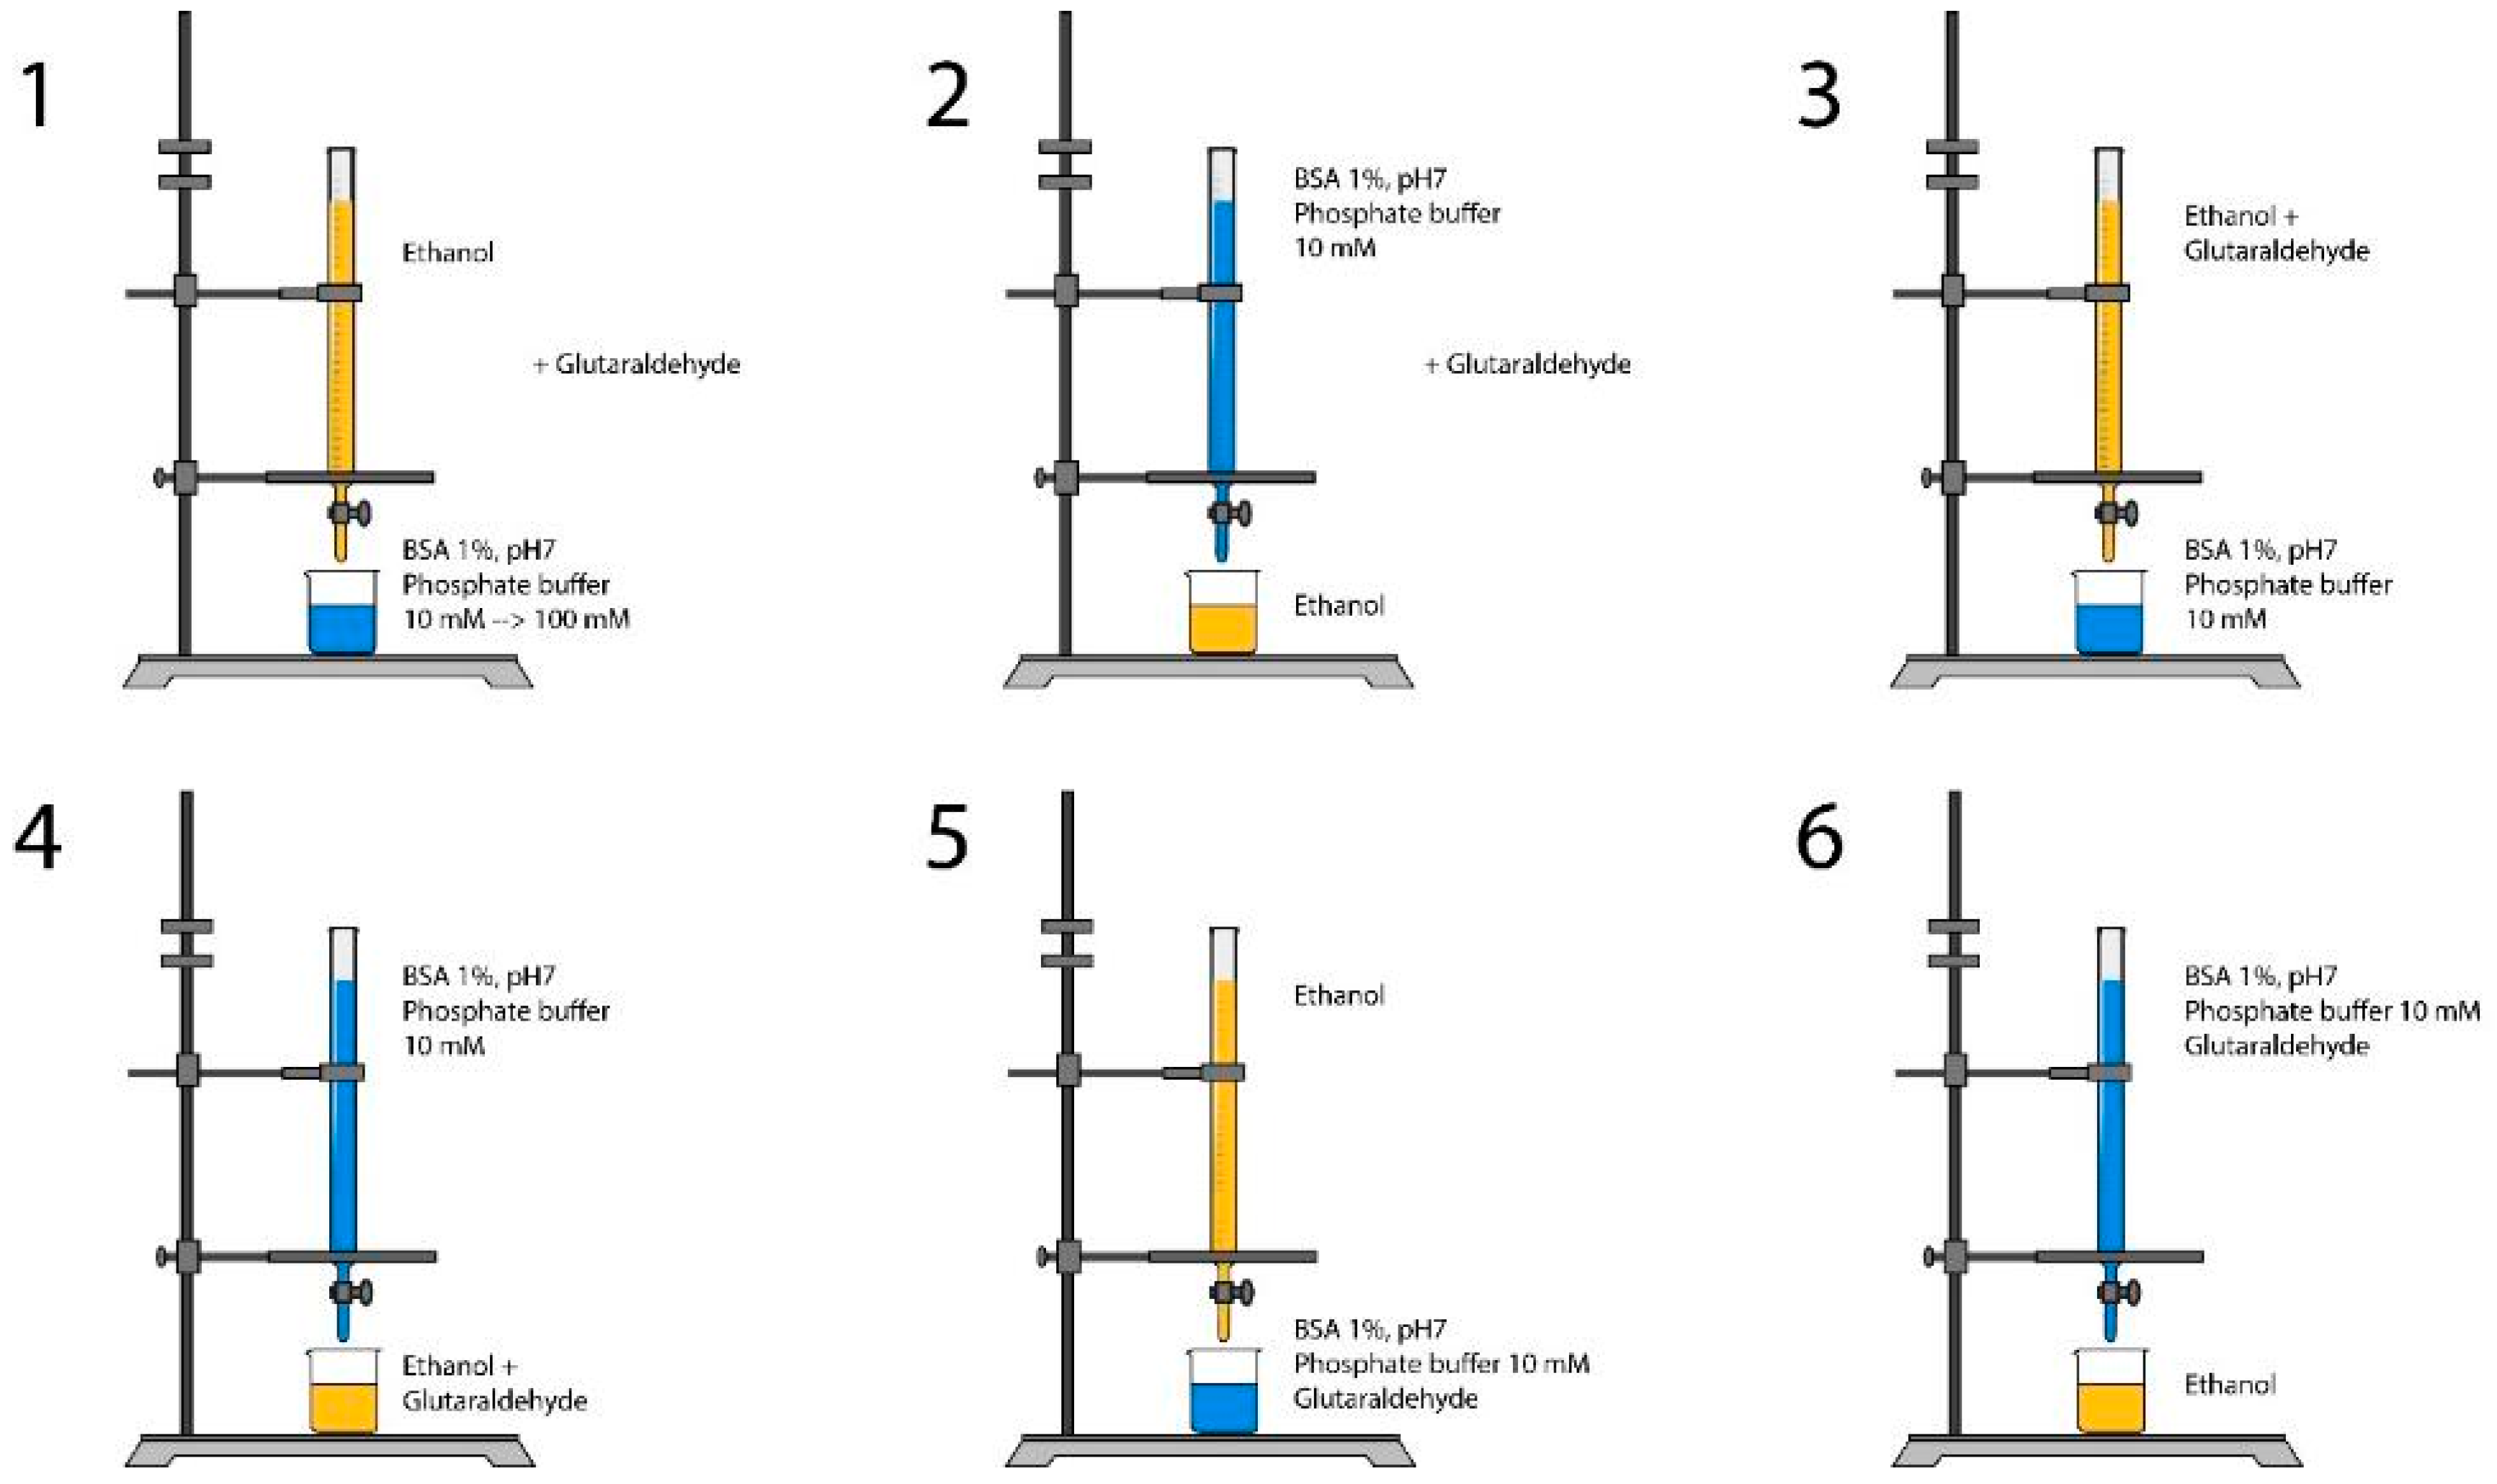
2.2.5. Effect of Process Variation
2.3. Determination of Nanoparticle Yield
2.4. Stability of BSA Nanoparticles
2.5. Characterization of BSA Nanoparticles
2.6. Statistical Analysis
3. Results and Discussions
3.1. Effect of BSA Concentration and Solvent/Non-Solvent Volume Ratio
3.2. Effect of Ethanol Injection Rate
3.3. Effect of Ionic Strength
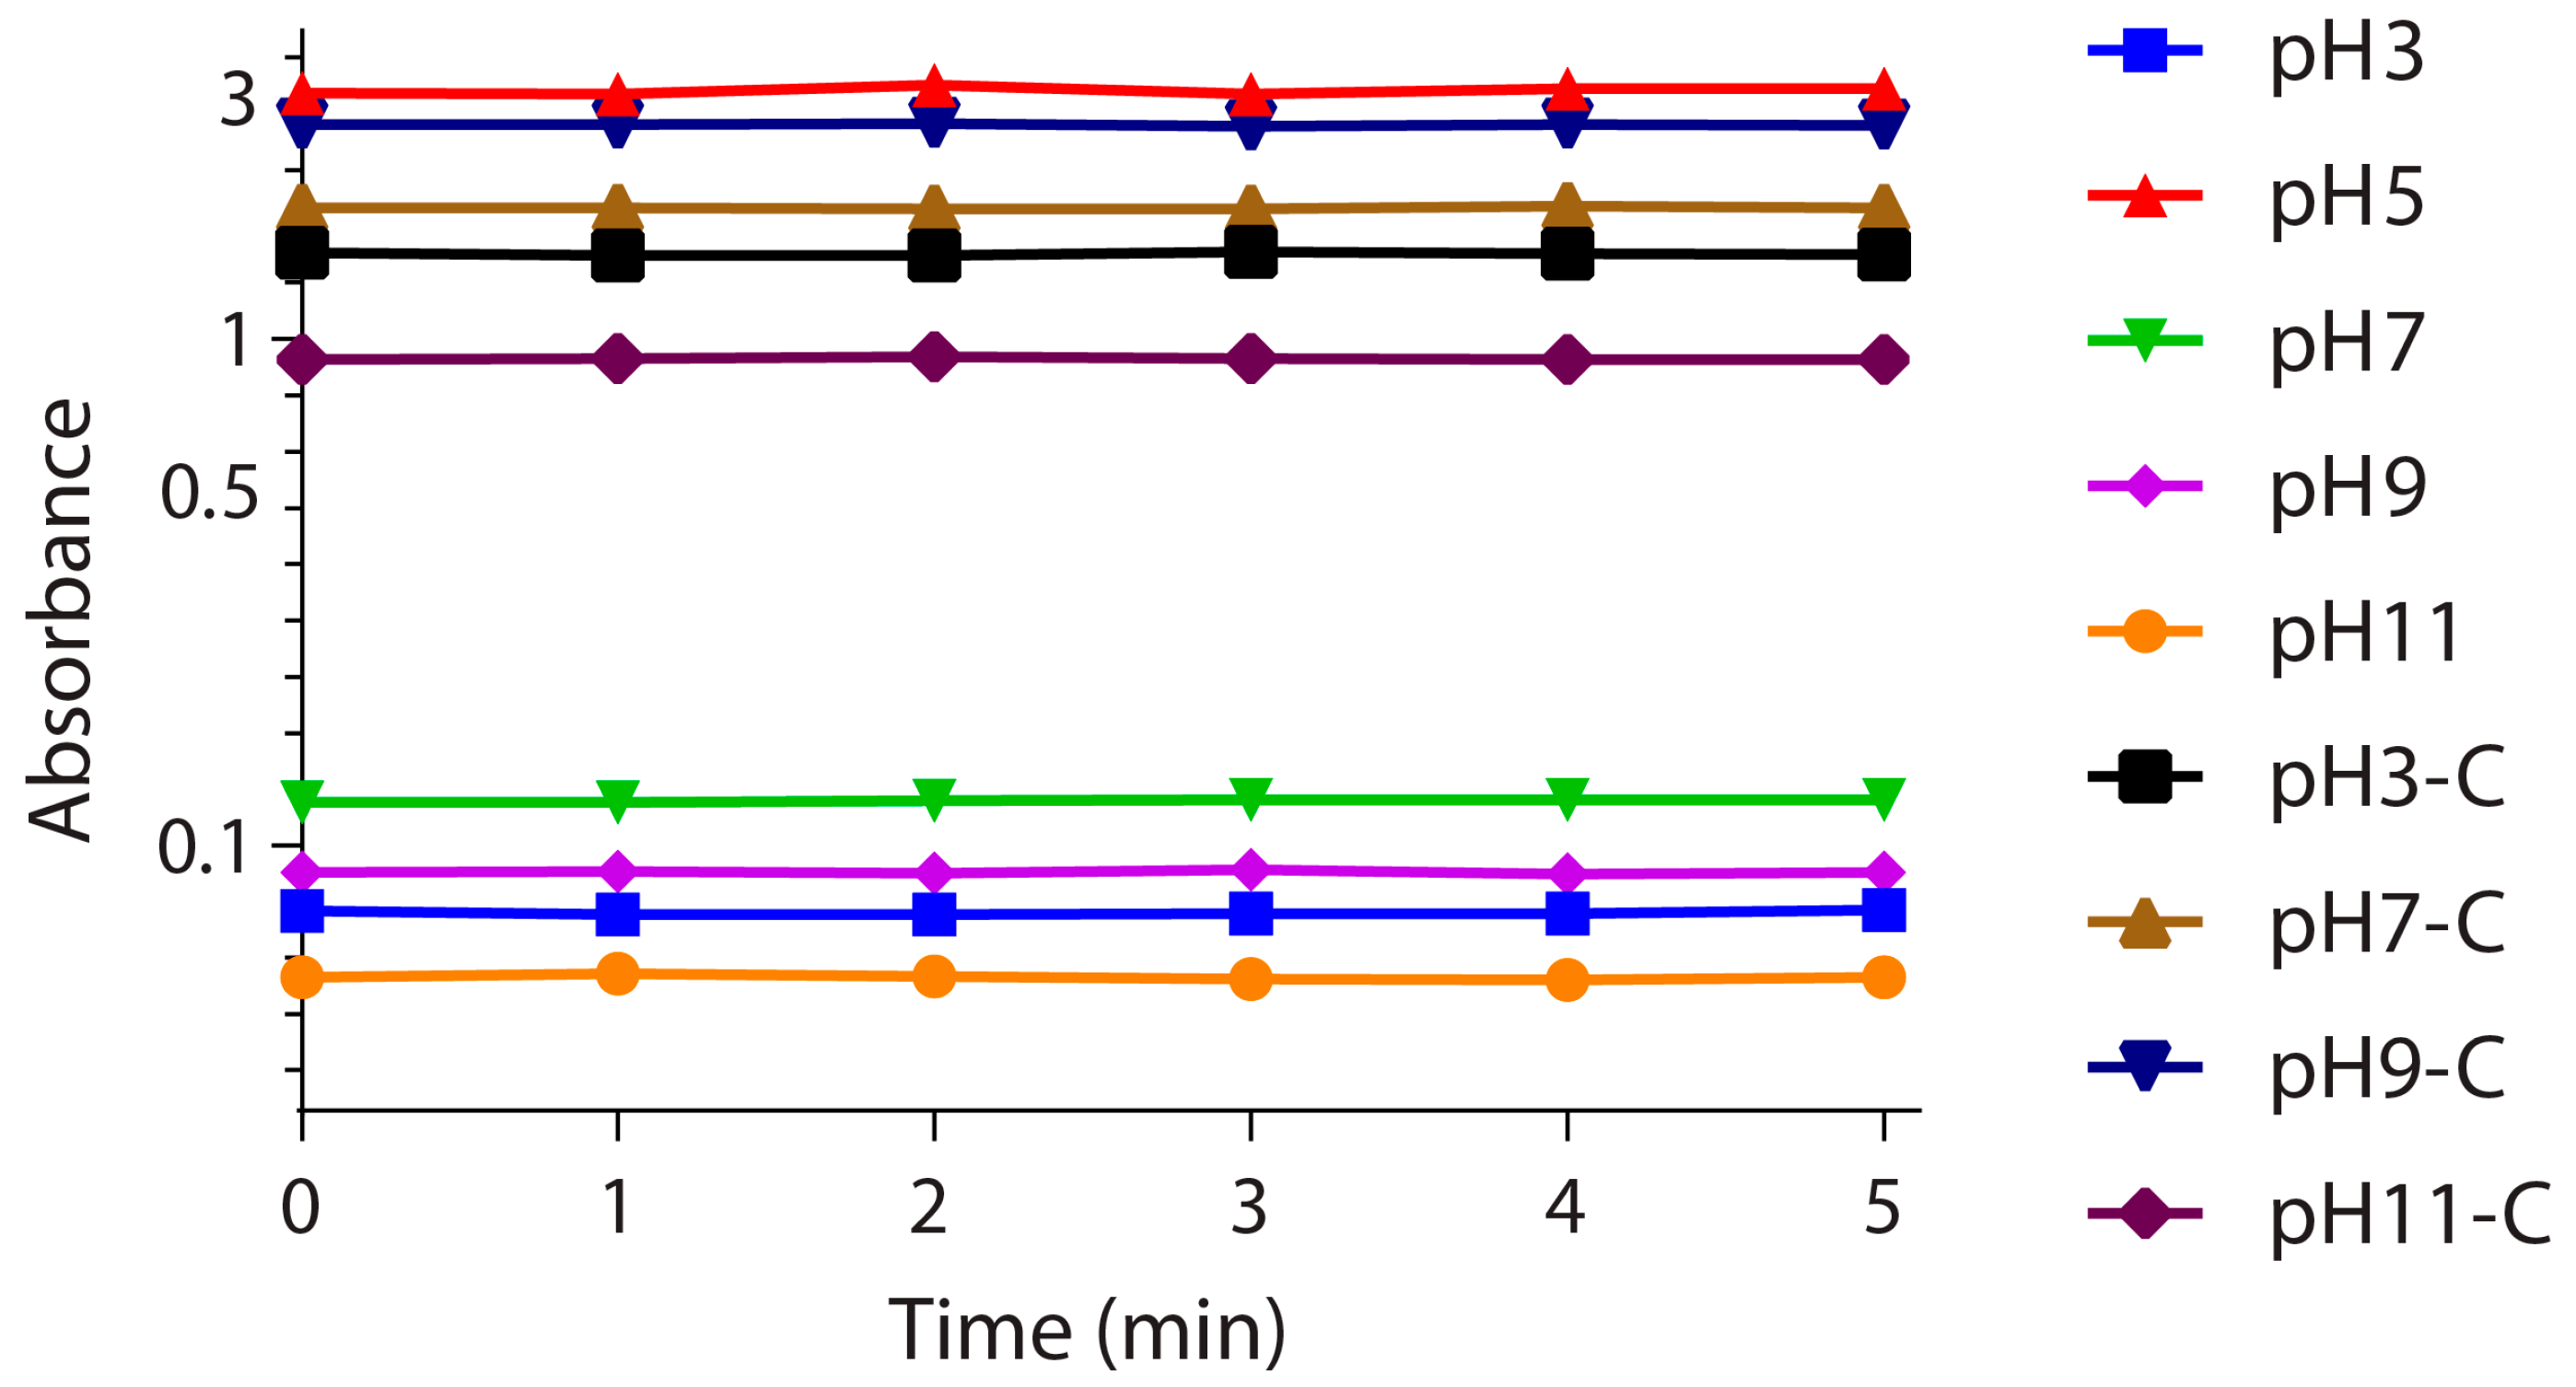
3.4. Effect of pH
3.5. Stability Investigation
3.6. Effect of Method Variation
4. Conclusions
Author Contributions
Conflicts of Interest
References
- Zaman, M.; Ahmad, E.; Qadeer, A.; Rabbani, G.; Khan, R.H. Nanoparticles in Relation to Peptide and Protein Aggregation. Int. J. Nanomed. 2014, 9, 899–912. [Google Scholar]
- Giordano, C.; Albani, D.; Gloria, A.; Tunesi, M.; Rodilossi, S.; Russo, T.; Forloni, G.; Ambrosio, L.; Cigada, A. Nanocomposites for Neurodegenerative Diseases: Hydrogel-Nanoparticle Combinations for a Challenging Drug Delivery. Int. J. Artif. Organs 2011, 34, 1115–1127. [Google Scholar] [CrossRef] [PubMed]
- Elzoghby, A.O.; Samy, W.M.; Elgindy, N.A. Albumin-Based Nanoparticles as Potential Controlled Release Drug Delivery Systems. J. Control. Release 2012, 157, 168–182. [Google Scholar] [CrossRef] [PubMed]
- Kratz, F. Albumin as a Drug Carrier: Design of Prodrugs, Drug Conjugates and Nanoparticles. J. Control. Release 2008, 132, 171–183. [Google Scholar] [PubMed]
- Irache, J.M.; Merodio, M.; Arnedo, A.; Camapanero, M.A.; Mirshahi, M.; Espuelas, S. Albumin Nanoparticles for the Intravitreal Delivery of Anticytomegaloviral Drugs. Mini Rev. Med. Chem. 2005, 5, 293–305. [Google Scholar] [CrossRef] [PubMed]
- Varca, G.H.C.; Queiroz, R.G.; Lugão, A.B. Irradiation as an Alternative Route for Protein Crosslinking: Cosolvent Free BSA Nanoparticles. Radiat. Phys. Chem. 2016, 124, 111–115. [Google Scholar] [CrossRef]
- Zu, Y.; Zhang, Y.; Zhao, X.; Zhang, Q.; Liu, Y.; Jiang, R. Optimization of the Preparation Process of Vinblastine Sulfate (VBLS)—Loaded Folate—Conjugated Bovine Serum Albumin (BSA) Nanoparticles for Tumor-Targeted Drug Delivery Using Response Surface Methodology (RSM). Int. J. Nanomed. 2009, 4, 321–333. [Google Scholar] [CrossRef]
- Maghsoudi, A.; Shojaosadati, S.A.; Vasheghani Farahani, E. 5-Fluorouracil-Loaded BSA Nanoparticles: Formulation Optimization and in Vitro Release Study. AAPS PharmSciTech 2008, 9, 1092–1096. [Google Scholar] [CrossRef] [PubMed]
- Rahimnejad, M.; Najafpour, G.; Bakeri, G. Investigation and Modeling Effective Parameters Influencing the Size of BSA Protein Nanoparticles as Colloidal Carrier. Colloids Surf. A Physicochem. Eng. Asp. 2012, 412, 96–100. [Google Scholar]
- Greige-Gerges, H.; Kaissi, R.; Magdalou, J.; Jraij, A. Reviewing the Binding of a Series of Parabens to Human Serum Albumin. Biopharm. Drug Dispos. 2013, 34, 186–194. [Google Scholar] [CrossRef] [PubMed]
- Greige-Gerges, H.; Diab, Y.; Farah, J.; Magdalou, J.; Haddad, C.; Ouaini, N. Ferutinin Stability in Human Plasma and Interaction with Human Serum Albumin. Biopharm. Drug Dispos. 2008, 29, 83–89. [Google Scholar] [CrossRef] [PubMed]
- Tarhini, M.; Greige-Gerges, H.; Elaissari, A. Protein-Based Nanoparticles: From Preparation to Encapsulation of Active Molecules. Int. J. Pharm. 2017, 522, 172–197. [Google Scholar] [CrossRef] [PubMed]
- Miladi, K.; Ibraheem, D.; Iqbal, M.; Sfar, S.; Fessi, H.; Elaissari, A.; Avicenne, R. Particles from Preformed Polymers as Carriers for Drug Delivery. EXCLI J. 2014, 13, 28–57. [Google Scholar] [PubMed]
- Elzoghby, A.O.; Elgohary, M.M.; Kamel, N.M. Implications of Protein- and Peptide-Based Nanoparticles as Potential Vehicles for Anticancer Drugs, 1st ed.; Academic Press: New York, NY, USA, 2015; Volume 98. [Google Scholar]
- Mazzarino, L.; Travelet, C.; Ortega-Murillo, S.; Otsuka, I.; Pignot-Paintrand, I.; Lemos-Senna, E.; Borsali, R. Elaboration of Chitosan-Coated Nanoparticles Loaded with Curcumin for Mucoadhesive Applications. J. Colloid Interface Sci. 2012, 370, 58–66. [Google Scholar] [CrossRef] [PubMed]
- Almouazen, E.; Bourgeois, S.; Boussaïd, A.; Valot, P.; Malleval, C.; Fessi, H.; Nataf, S.; Briançon, S. Development of a Nanoparticle-Based System for the Delivery of Retinoic Acid into Macrophages. Int. J. Pharm. 2012, 430, 207–215. [Google Scholar] [CrossRef] [PubMed]
- Joye, I.J.; McClements, D.J. Production of Nanoparticles by Anti-Solvent Precipitation for Use in Food Systems. Trends Food Sci. Technol. 2013, 34, 109–123. [Google Scholar] [CrossRef]
- D’Addio, S.M.; Prud’homme, R.K. Controlling Drug Nanoparticle Formation by Rapid Precipitation. In Advanced Drug Delivery Reviews; Elsevier B.V.: Amsterdam, The Netherlands, 2011; pp. 417–426. [Google Scholar]
- Yang, L.; Cui, F.; Cun, D.; Tao, A.; Shi, K.; Lin, W. Preparation, Characterization and Biodistribution of the Lactone Form of 10-Hydroxycamptothecin (HCPT)-Loaded Bovine Serum Albumin (BSA) Nanoparticles. Int. J. Pharm. 2007, 340, 163–172. [Google Scholar] [CrossRef] [PubMed]
- Das, S.; Banerjee, R.; Bellare, J. Aspirin Loaded Albumin Nanoparticles by Coacervation: Implications in Drug Delivery. Trends Biomater. Artif. Organs 2005, 18, 203–212. [Google Scholar]
- Crisante, F.; Francolini, I.; Bellusci, M.; Martinelli, A.; D’Ilario, L.; Piozzi, A. Antibiotic Delivery Polyurethanes Containing Albumin and Polyallylamine Nanoparticles. Eur. J. Pharm. Sci. 2009, 36, 555–564. [Google Scholar] [CrossRef] [PubMed]
- Qi, J.; Yao, P.; He, F.; Yu, C.; Huang, C. Nanoparticles with Dextran/chitosan Shell and BSA/chitosan Core-Doxorubicin Loading and Delivery. Int. J. Pharm. 2010, 393, 177–185. [Google Scholar] [CrossRef] [PubMed]
- Segura, S.; Gamazo, C.; Irache, J.M.; Espuelas, S. Gamma Interferon Loaded onto Albumin Nanoparticles: In Vitro and in Vivo Activities against Brucella Abortus. Antimicrob. Agents Chemother. 2007, 51, 1310–1314. [Google Scholar] [CrossRef] [PubMed]
- Merodio, M.; Arnedo, A.; Renedo, M.J.; Irache, J.M. Ganciclovir-Loaded Albumin Nanoparticles: Characterization and in Vitro Release Properties. Eur. J. Pharm. Sci. 2000, 12, 251–259. [Google Scholar] [CrossRef]
- Santhi, K.; Dhanaraj, S.A.; Koshy, M.; Ponnusankar, S.; Suresh, B. Study of Biodistribution of Methotrexate-Loaded Bovine Serum Albumin Nanospheres in Mice. Drug Dev. Ind. Pharm. 2000, 26, 1293–1296. [Google Scholar] [CrossRef] [PubMed]
- Arnedo, A.; Irache, J.M.; Merodio, M.; Espuelas Millán, M.S. Albumin Nanoparticles Improved the Stability, Nuclear Accumulation and Anticytomegaloviral Activity of a Phosphodiester Oligonucleotide. J. Control. Release 2004, 94, 217–227. [Google Scholar] [CrossRef] [PubMed]
- Zhao, D.; Zhao, X.; Zu, Y.; Li, J.; Zhang, Y.; Jiang, R.; Zhang, Z. Preparation, Characterization, and in Vitro Targeted Delivery of Folate-Decorated Paclitaxel-Loaded Bovine Serum Albumin Nanoparticles. Int. J. Nanomed. 2010, 5, 669–677. [Google Scholar]
- Zimmer, A.K.; Chetoni, P.; Saettone, M.F.; Zerbe, H.; Kreuter, J. Evaluation of Pilocarpine-Loaded Albumin Particles as Controlled Drug Delivery Systems for the Eye. II. Co-Administration with Bioadhesive and Viscous Polymers. J. Control. Release 1995, 33, 31–46. [Google Scholar] [CrossRef]
- Li, F.Q.; Su, H.; Wang, J.; Liu, J.Y.; Zhu, Q.G.; Fei, Y.B.; Pan, Y.H.; Hu, J.H. Preparation and Characterization of Sodium Ferulate Entrapped Bovine Serum Albumin Nanoparticles for Liver Targeting. Int. J. Pharm. 2008, 349, 274–282. [Google Scholar] [CrossRef] [PubMed]
- Galisteo-González, F.; Molina-Bolívar, J.A. Systematic Study on the Preparation of BSA Nanoparticles. Colloids Surf. B Biointerfaces 2014, 123, 286–292. [Google Scholar] [CrossRef] [PubMed]
- Chorny, M.; Fishbein, I.; Danenberg, H.D.; Golomb, G. Lipophilic Drug Loaded Nanospheres Prepared by Nanoprecipitation: Effect of Formulation Variables on Size, Drug Recovery and Release Kinetics. J. Control. Release 2002, 83, 389–400. [Google Scholar] [CrossRef]
- Budhian, A.; Siegel, S.J.; Winey, K.I. Haloperidol-Loaded PLGA Nanoparticles: Systematic Study of Particle Size and Drug Content. Int. J. Pharm. 2007, 336, 367–375. [Google Scholar] [CrossRef] [PubMed]
- Limayem Blouza, I.; Charcosset, C.; Sfar, S.; Fessi, H. Preparation and Characterization of Spironolactone-Loaded Nanocapsules for Paediatric Use. Int. J. Pharm. 2006, 325, 124–131. [Google Scholar] [CrossRef] [PubMed]
- Asadi, H.; Rostamizadeh, K.; Salari, D.; Hamidi, M. Preparation of Biodegradable Nanoparticles of Tri-Block PLA-PEG-PLA Copolymer and Determination of Factors Controlling the Particle Size Using Artificial Neural Network. J. Microencapsul. 2011, 28, 406–416. [Google Scholar] [CrossRef] [PubMed]
- Lim, J.; Yeap, S.P.; Che, H.X.; Low, S.C. Characterization of Magnetic Nanoparticle by Dynamic Light Scattering. Nanoscale Res. Lett. 2013, 8, 381. [Google Scholar] [CrossRef] [PubMed]
- Sze, A.; Erickson, D.; Ren, L.; Li, D. Zeta-Potential Measurement Using the Smoluchowski Equation and the Slope of the Current-Time Relationship in Electroosmotic Flow. J. Colloid Interface Sci. 2003, 261, 402–410. [Google Scholar] [CrossRef]
- Quintanar-Guerrero, D.; Allémann, E.; Fessi, H.; Doelker, E. Preparation Techniques and Mechanisms of Formation of Biodegradable Nanoparticles from Preformed Polymers. Drug Dev. Ind. Pharm. 1998, 24, 1113–1128. [Google Scholar] [CrossRef] [PubMed]
- Horn, D.; Rieger, J. Organic Nanoparticles in the Aqueous Phase-Theory, Experiment, and Use. Angew. Chem. Int. Ed. Engl. 2001, 40, 4330–4361. [Google Scholar] [CrossRef]
- Stainmesse, S.; Orecchioni, A.M.; Nakache, E.; Puisieux, F.; Fessi, H. Formation and Stabilization of a Biodegradable Polymeric Colloidal Suspension of Nanoparticles. Colloid Polym. Sci. 1995, 273, 505–511. [Google Scholar] [CrossRef]
- Jahanshahi, M.; Babaei, Z. Protein Nanoparticle: A Unique System as Drug Delivery Vehicles. J. Biotechnol. 2008, 7, 4926–4934. [Google Scholar]
- Langer, K.; Balthasar, S.; Vogel, V.; Dinauer, N.; Von Briesen, H.; Schubert, D. Optimization of the Preparation Process for Human Serum Albumin (HSA) Nanoparticles. Int. J. Pharm. 2003, 257, 169–180. [Google Scholar] [CrossRef]
- Pathak, Y.; Thassu, D. Drug Delivery Nanoparticles Formulation and Characterization; Informa Healthcare: New York, NY, USA; London, UK, 2009; Volume 191. [Google Scholar]
- Domingos, R.F.; Baalousha, M.A.; Ju-nam, Y.; Reid, M.M.; Tufenkji, N.; Lead, J.R.; Leppard, G.G.; Wilkinson, K.J. Characterizing Manufactured Nanoparticles in the Environment: Multimethod Determination of Particle Sizes Characterizing Manufactured Nanoparticles in the Environment: Multimethod Determination of Particle Sizes. Environ. Sci. Technol. 2009, 43, 7277–7284. [Google Scholar] [CrossRef] [PubMed]
- Kakran, M.; Sahoo, N.G.; Tan, I.L.; Li, L. Preparation of Nanoparticles of Poorly Water-Soluble Antioxidant Curcumin by Antisolvent Precipitation Methods. J. Nanopart. Res. 2012, 14, 757. [Google Scholar] [CrossRef]
- Irache, J.M.; Bergougnoux, L.; Ezpeleta, I.; Gueguen, J.; Orecchioni, A.M. Optimization and in Vitro Stability of Legumin Nanoparticles Obtained by a Coacervation Method. Int. J. Pharm. 1995, 126, 103–109. [Google Scholar] [CrossRef]
- Surugau, N.; Urban, P.L. Electrophoretic Methods for Separation of Nanoparticles. J. Sep. Sci. 2009, 32, 1889–1906. [Google Scholar] [CrossRef] [PubMed]


| Active Compound | Preparation Method | Goal | Ref. |
|---|---|---|---|
| 5-Fluorouracil | Coacervation | In vitro drug release profile | [8] |
| 10-hydroxycamptothecin | W/O Emulsion | Characterization of nanoparticles and in vitro targeted delivery profile | [19] |
| Aspirin | Coacervation | Preparing formulations for intra-articular therapy | [20] |
| Cefamandole nafate (antibiotic) | W/O emulsion | Prevention of medical device-related infections | [21] |
| Doxorubicin | Desolvation | Tumor inhibition of murine ascites hepatoma | [22] |
| γ-Interferon | Coacervation | Targeting of γ-interferon into macrophages | [23] |
| Ganciclovir | Coacervstion | In vitro drug release profile of nanoparticles | [24] |
| Methotrexate | Coacervation | Study the biodistribution of nanoparticles | [25] |
| Oligonucleotides | Coacervation | Delivery of antisense oligonucleotides | [26] |
| Paclitaxel | Deslovation | Characterization and in vitro targeted delivery profile | [27] |
| Pilocarpine | Desolvation | The effect of bioadhesive polymer on the in vivo activity of nanoparticles | [28] |
| Sodium Ferulate | Desolvation | Liver targeting | [29] |
| Parameters | Mean Size (nm) | Mean Zeta Potential (mV) | PDI | |
|---|---|---|---|---|
| BSA % at S/NS 1/2 | 1% | 137 | −24.1 | 0.228 |
| 1.50% | 148 | −27.7 | 0.217 | |
| 2% | 165 | −23.5 | 0.116 | |
| 2.50% | 158 | −26.6 | 0.152 | |
| 3% | 150 | −27.2 | 0.144 | |
| S/NS at BSA 2% | 1/3 | 101 | −17 | 0.25 |
| 2/5 | 148 | −19.7 | 0.289 | |
| 1/2 | 165 | −23.5 | 0.116 | |
| 2/3 | 140 | −22.9 | 0.372 | |
| 1/1 | 77 | −18.2 | 0.818 | |
| Ethanol addtion speed (ml/min) Unbuffered | 0.10 | 196 | −23.1 | 0.137 |
| 0.25 | 192 | −25.5 | 0.165 | |
| 0.50 | 184 | −21.1 | 0.221 | |
| 1.00 | 173 | −14.9 | 0.291 | |
| 2.00 | 112 | −6 | 0.243 | |
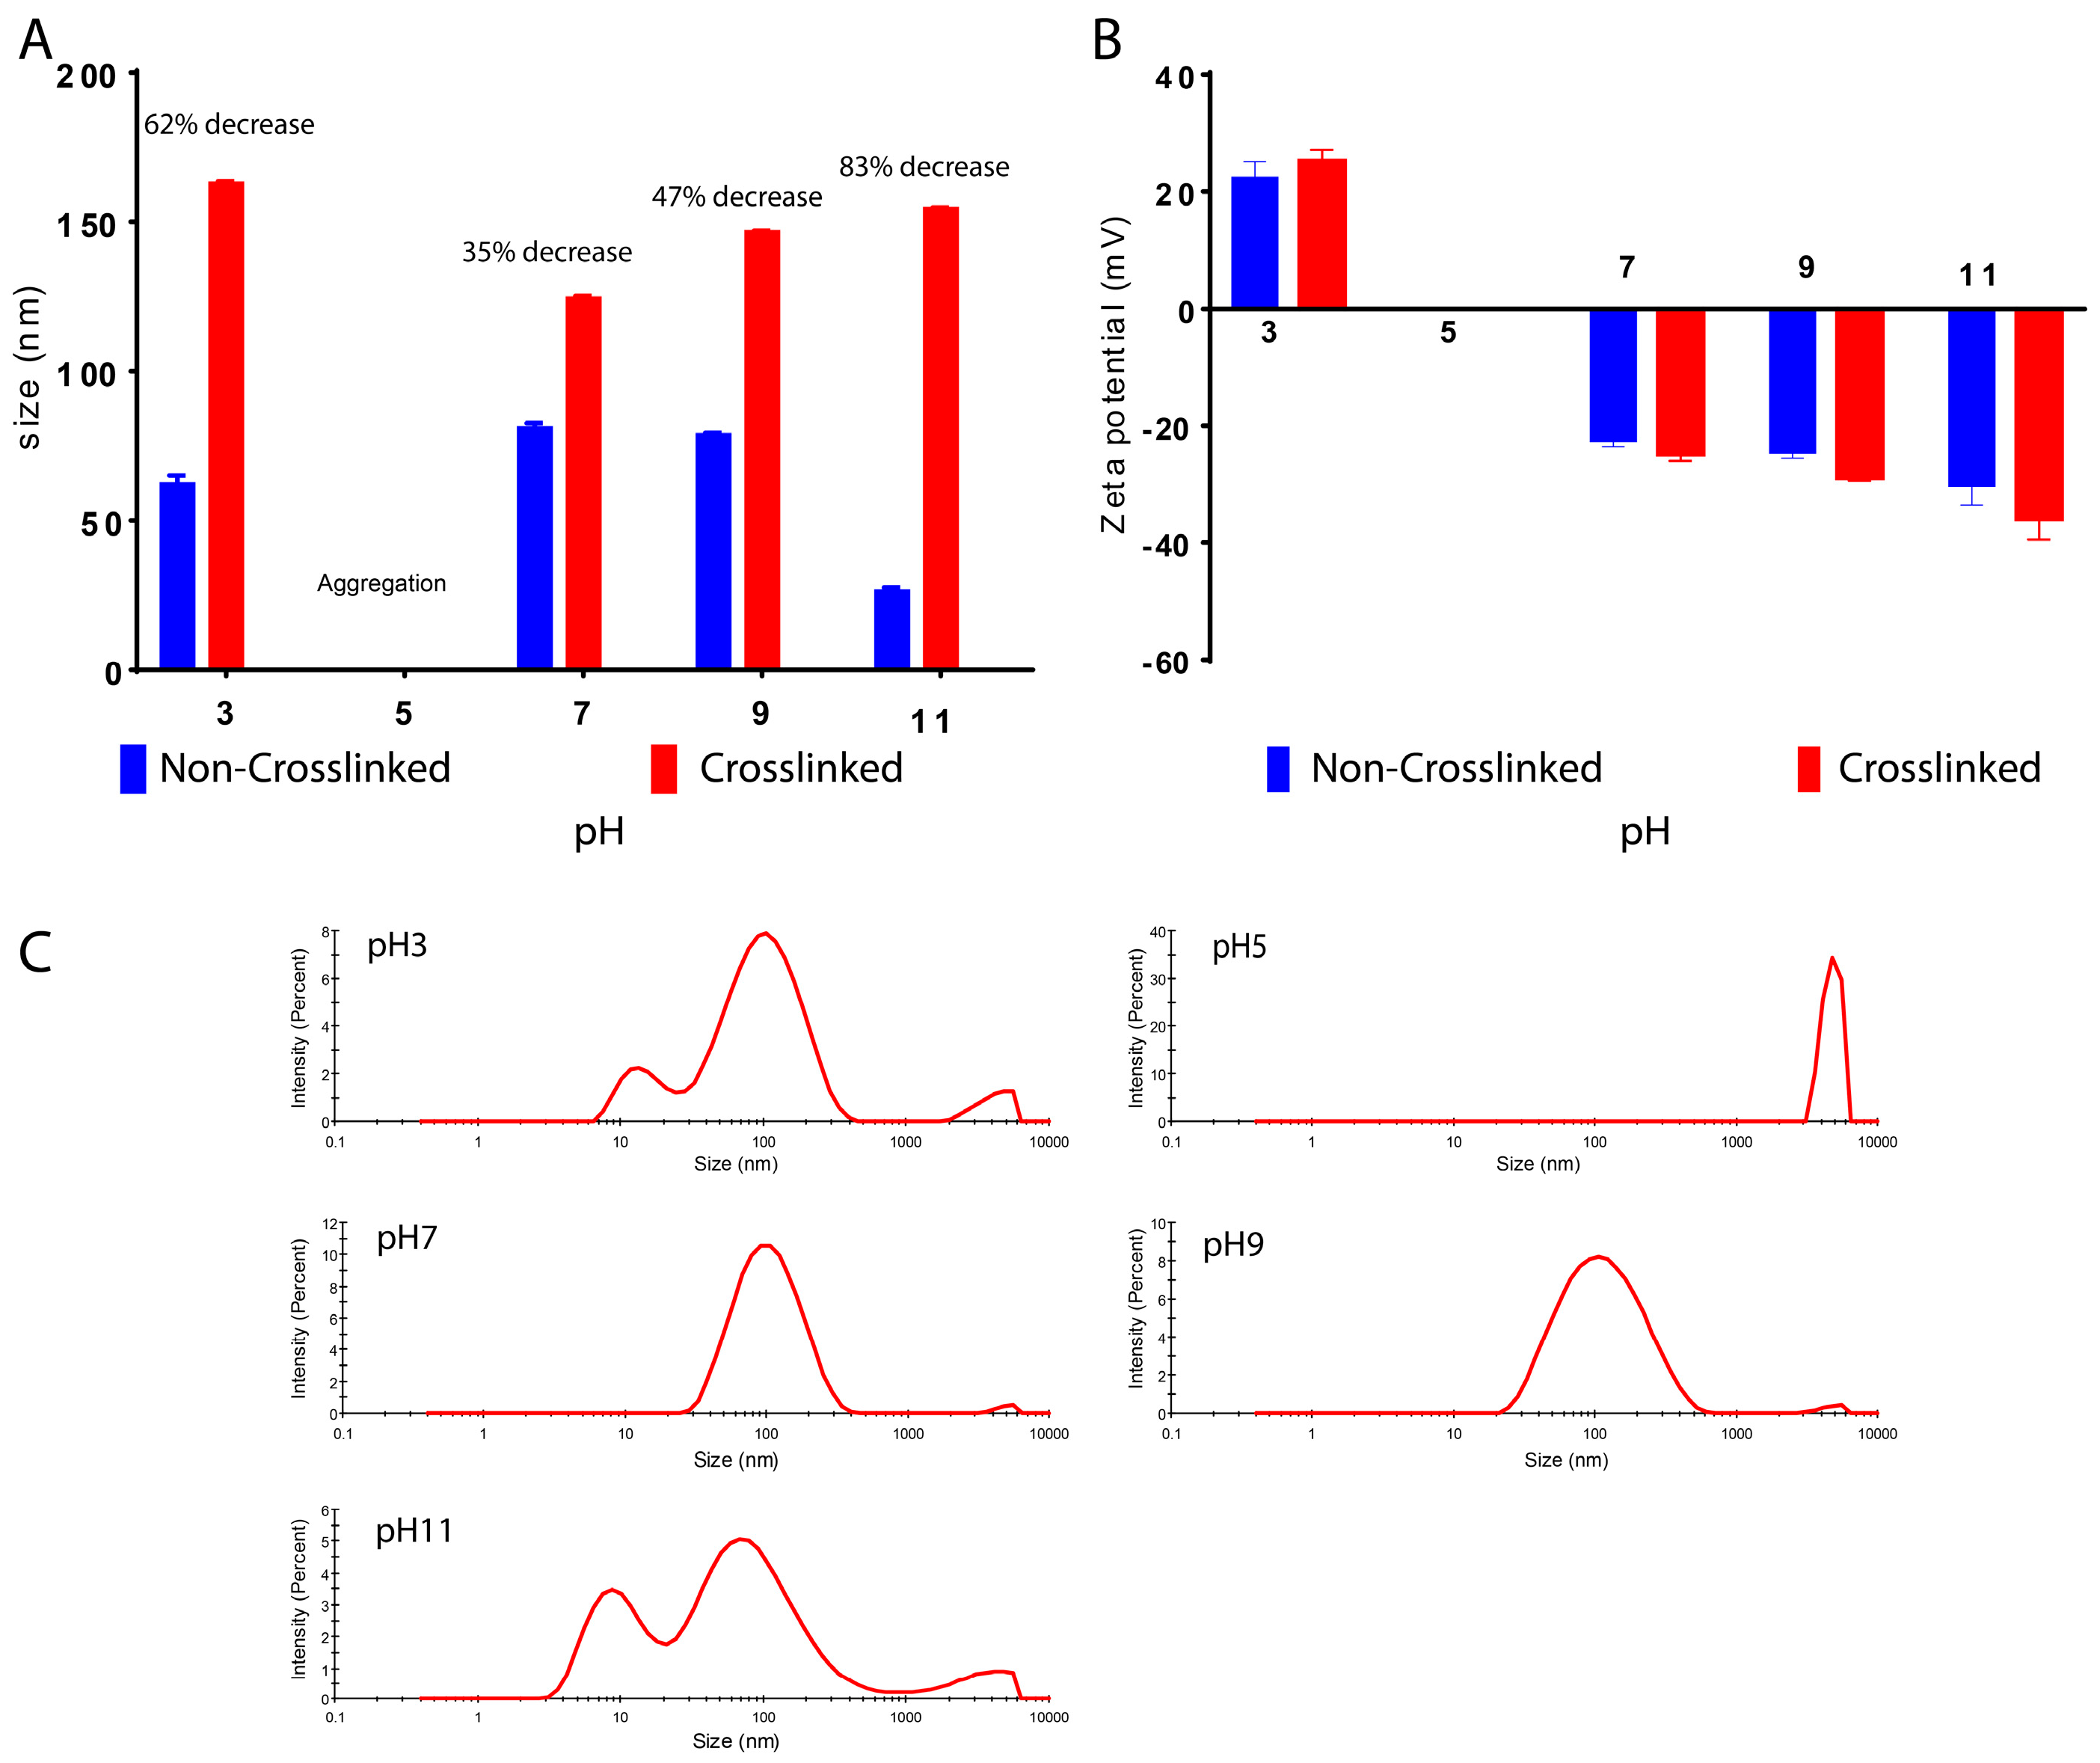
| pH | 3 | 64 | 22.5 | 0.449 |
| 5 | Aggregation | Aggregation | ||
| 7 | 82 | −21.9 | 0.29 | |
| 9 | 79 | −24.3 | 0.45 | |
| 11 | 26 | −27.6 | 0.803 | |
| [PB] mM | 10 | 184.5667 | −14.3 | 0.055 |
| 20 | Aggregation | Aggregation | ||
| 30 | Aggregation | Aggregation | ||
| 50 | Aggregation | Aggregation | ||
| 100 | Aggregation | Aggregation | ||
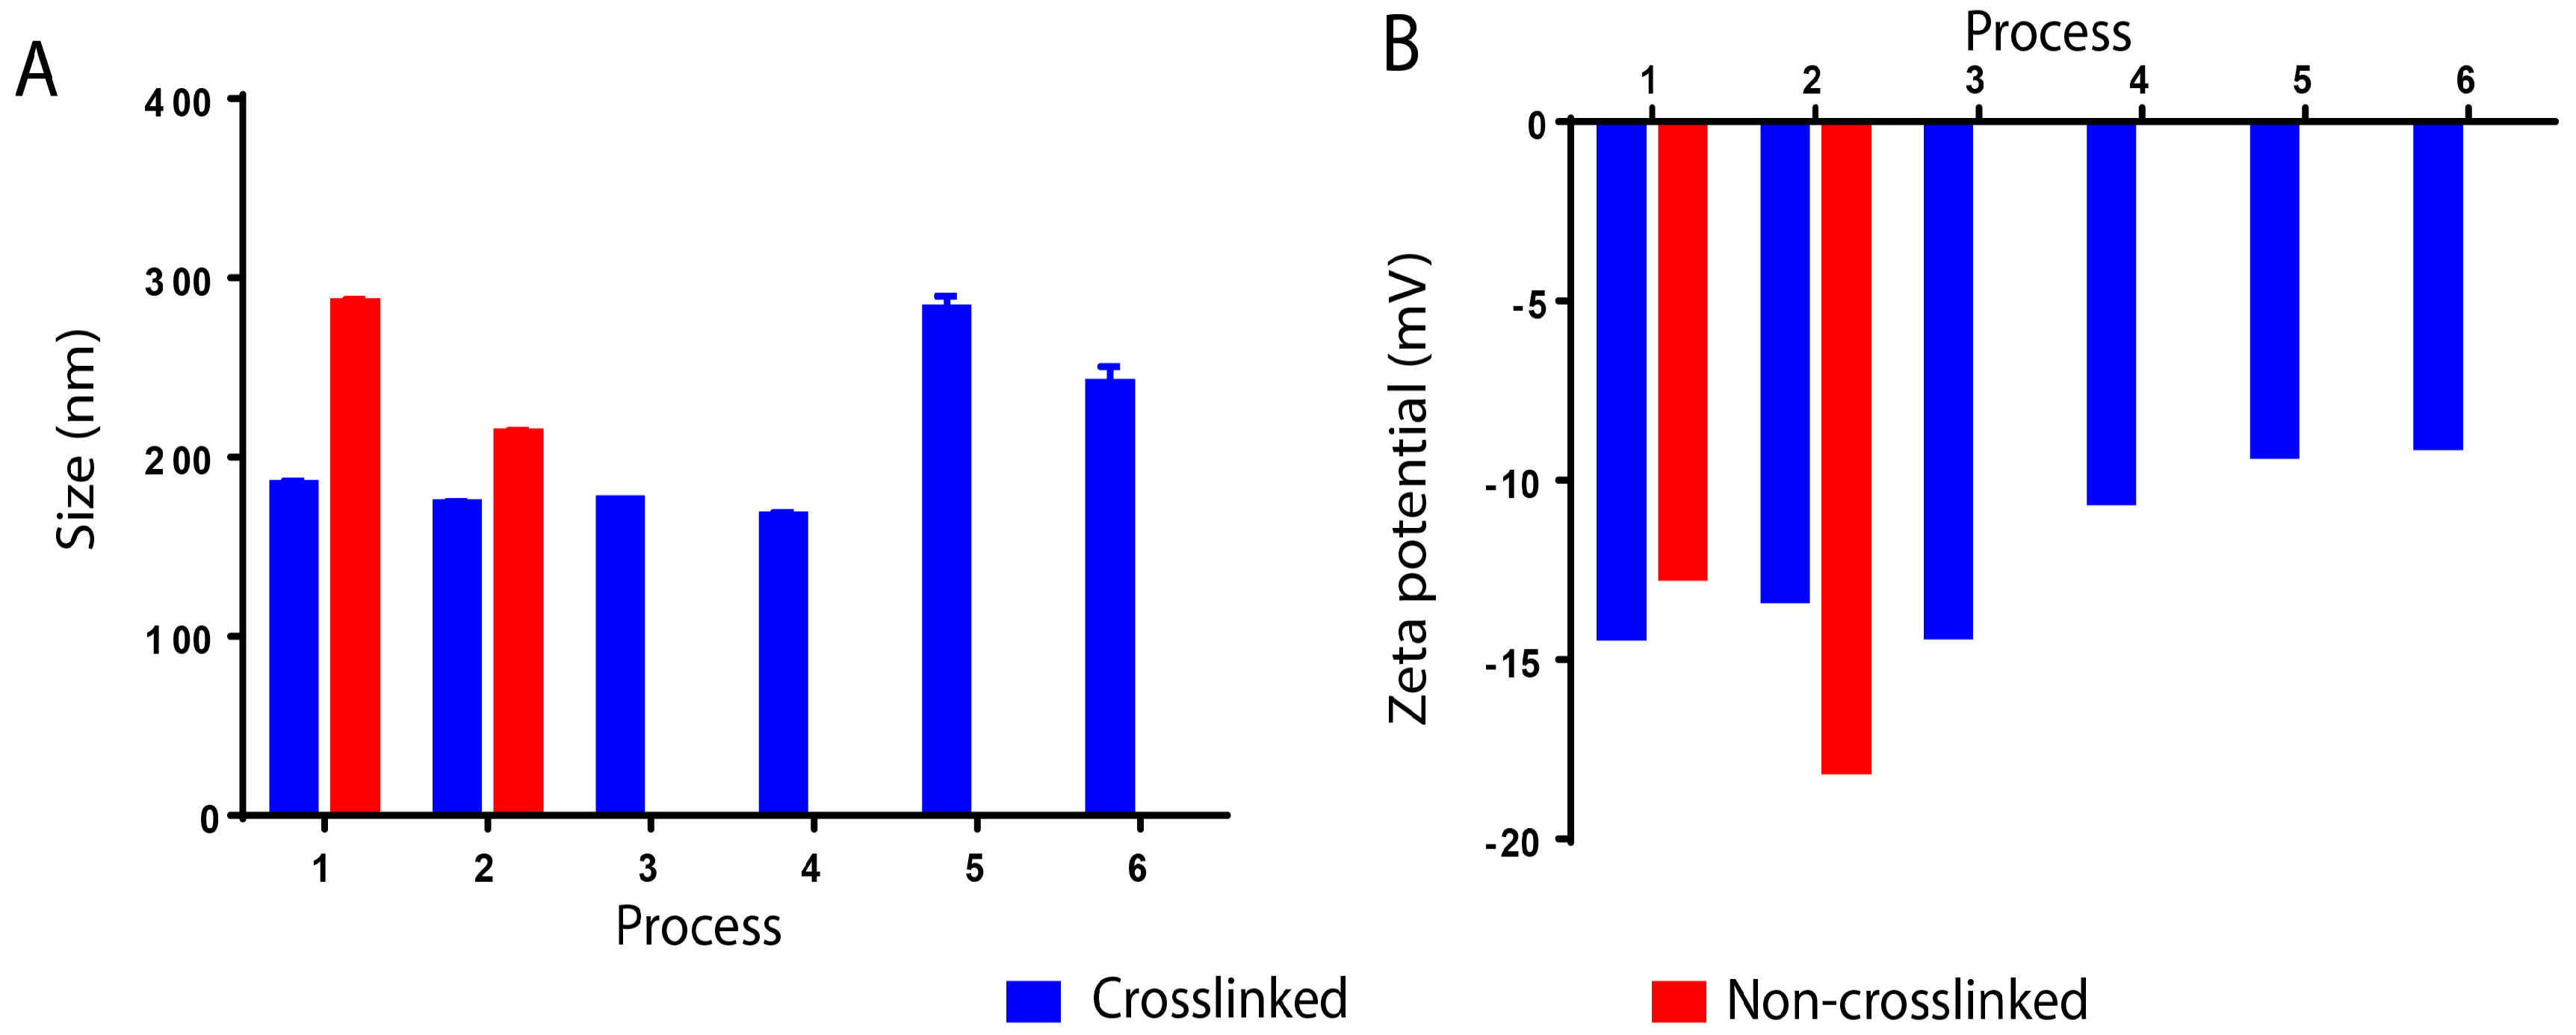
| Process number | 1 | 184 | −14.3 | 0.055 |
| 2 | 173 | −13.3 | 0.142 | |
| 3 | 175 | −14.3 | 0.095 | |
| 4 | 167 | −10.56 | 0.129 | |
| 5 | 282 | −9.2 | 0.265 | |
| 6 | 240 | −9 | 0.192 | |
© 2018 by the authors. Licensee MDPI, Basel, Switzerland. This article is an open access article distributed under the terms and conditions of the Creative Commons Attribution (CC BY) license (http://creativecommons.org/licenses/by/4.0/).
Share and Cite
Tarhini, M.; Benlyamani, I.; Hamdani, S.; Agusti, G.; Fessi, H.; Greige-Gerges, H.; Bentaher, A.; Elaissari, A. Protein-Based Nanoparticle Preparation via Nanoprecipitation Method. Materials 2018, 11, 394. https://doi.org/10.3390/ma11030394
Tarhini M, Benlyamani I, Hamdani S, Agusti G, Fessi H, Greige-Gerges H, Bentaher A, Elaissari A. Protein-Based Nanoparticle Preparation via Nanoprecipitation Method. Materials. 2018; 11(3):394. https://doi.org/10.3390/ma11030394
Chicago/Turabian StyleTarhini, Mohamad, Ihsane Benlyamani, Selim Hamdani, Géraldine Agusti, Hatem Fessi, Hélène Greige-Gerges, Abderrazzak Bentaher, and Abdelhamid Elaissari. 2018. "Protein-Based Nanoparticle Preparation via Nanoprecipitation Method" Materials 11, no. 3: 394. https://doi.org/10.3390/ma11030394