On Nb Silicide Based Alloys: Alloy Design and Selection


Department of Materials Science and Engineering, The University of Sheffield, Sheffield S1 3JD, UK
Materials 2018, 11(5), 844; https://doi.org/10.3390/ma11050844
Submission received: 25 April 2018
/
Revised: 9 May 2018
/
Accepted: 11 May 2018
/
Published: 18 May 2018
Abstract
:The development of Nb-silicide based alloys is frustrated by the lack of composition-process-microstructure-property data for the new alloys, and by the shortage of and/or disagreement between thermodynamic data for key binary and ternary systems that are essential for designing (selecting) alloys to meet property goals. Recent publications have discussed the importance of the parameters δ (related to atomic size), Δχ (related to electronegativity) and valence electron concentration (VEC) (number of valence electrons per atom filled into the valence band) for the alloying behavior of Nb-silicide based alloys (J Alloys Compd 748 (2018) 569), their solid solutions (J Alloys Compd 708 (2017) 961), the tetragonal Nb5Si3 (Materials 11 (2018) 69), and hexagonal C14-NbCr2 and cubic A15-Nb3X phases (Materials 11 (2018) 395) and eutectics with Nbss and Nb5Si3 (Materials 11 (2018) 592). The parameter values were calculated using actual compositions for alloys, their phases and eutectics. This paper is about the relationships that exist between the alloy parameters δ, Δχ and VEC, and creep rate and isothermal oxidation (weight gain) and the concentrations of solute elements in the alloys. Different approaches to alloy design (selection) that use property goals and these relationships for Nb-silicide based alloys are discussed and examples of selected alloy compositions and their predicted properties are given. The alloy design methodology, which has been called NICE (Niobium Intermetallic Composite Elaboration), enables one to design (select) new alloys and to predict their creep and oxidation properties and the macrosegregation of Si in cast alloys.
1. Introduction
Performance targets of future aero-engines have been revised to meet significant reductions in harmful emissions. For example, ACARE (Advisory Council for Aircraft Innovation and Research in Europe) used data for the year 2000 as reference to set goals to be met by aviation by the year 2050, also known as FLIGHTPATH 2050. These require reductions (a) of aircraft CO2 emissions by 75% per passenger kilometer, (b) of aircraft noise by 65% and (c) of NOx (oxides of nitrogen) emissions by 90%. The engine contribution to these goals is reduction of CO2 by 30% and of the NOx certification metric by 75%.
These goals could be met if there were materials available that would enable the engines to operate with significantly higher turbine entry temperatures in the range 1850 °C to 1900 °C. Thus, new materials with capabilities beyond those of Ni based superalloys are required. The need for such materials and the property goals that must be met by them have been well documented in the literature [1]. For example, the creep goal for Nb-silicide based alloys is as follows: “the creep strength should be greater than 170 MPa at a creep rate of 2·10−8 s−1 at 1200 °C” [1]. The creep goal assumes density of Nb-silicide based materials of 7 g/cm3. The search for new materials has considered alloys and composites that utilize the attractive high temperature properties of refractory metal intermetallics [2]. Alloys and in situ composites exploiting the properties of refractory metal silicides have the potential to offer a balance of properties to meet performance targets. Nb-silicide based alloys (or Nb-silicide in situ composites) and Mo-Si-B based alloys belong in this category of new materials. This paper is about the design (selection) of Nb-silicide based alloys.
Alloy design requires a set of properties that the new alloy must have to satisfy performance targets. Data about the latter and the material property goals has been provided by regulatory authorities and the relevant industries (see above and [1]). The property goals are expected to guide the development of new alloys for ultra-high temperature structural applications beyond those for the Ni based superalloys. Alloy design also requires data that links (i) a particular set of properties with specific microstructure(s) and (ii) a particular process with microstructure, in other words, alloy designers need composition-process-microstructure-property relationships, which usually give a good (reasonable) description of particular phenomena over a restricted range of parameters. Armed with the aforementioned data and knowledge about parameters that control material properties, the alloy developer can design (select) alloy compositions using thermodynamic data from databases and/or derived using CALPHAD (CALculation of PHAse Diagrams) and/or ab initio calculations and other alloy design tools, e.g., PHACOMP (PHAseCOMPutation), neural networks [3,4]. Equilibrium calculations will specify the ultimate microstructure, for example give the volume fractions of phases as function of alloy composition and temperature. However, the results of such calculations are far from the actual microstructures that exist in the alloy under anticipated service conditions.
Research on ferrous and non-ferrous (i.e., Al, Cu, Mg, Ni, Ti) alloys, which has been on-going for many decades, has provided large volume of experimental data that has helped to calibrate alloy design tools and improve their accuracy and reliability. However, even with all the available data for the aforementioned alloys, (a) phase diagrams are reliable only in those areas for which there is experimental data, (b) different thermodynamic databases can disagree for the same material type, (c) the CALPHAD method is most reliable when interpolating between compositions used to build the database and (d) models about mechanical behavior are suitable only for specific alloys of an alloy family.
What is the current situation with Nb-silicide based alloys? The important phases in their microstructures are the bcc Nb solid solution (Nbss) and tetragonal 5-3 Nb silicide Nb5Si3. The latter exists in two forms, both of which have the same crystal structure but different lattice parameters, namely the high temperature βNb5Si3 (tP32 D8m, prototype W5Si3) and the low temperature αNb5Si3 (tP32 D8l, prototype Cr5B3). The Nb5Si3 silicide also can form as metastable hexagonal γNb5Si3 (hP16, D88, prototype Mn5Si3). The βNb5Si3 can form in situ either as a primary phase or via the metastable eutectic reaction L → Nb + βNb5Si3, the αNb5Si3 can form from the peritectoid Nb3Si + βNb5Si3 → αNb5Si3 and eutectoid βNb5Si3 → αNb5Si3 + NbSi2 transformations or from the eutectoid transformation Nb3Si → Nb + αNb5Si3 and the Nb3Si can form from the eutectic reaction L → Nb + Nb3Si [1,2]. The aforementioned eutectics can be grown using directional solidification (DS).
The Nbss and tetragonal Nb5Si3 are desirable phases respectively for fracture toughness and creep. Nb alloys and Nb intermetallics can oxidize catastrophically (pest oxidation) at temperatures between 600 °C and 900 °C. The Nbss is the Achilles’ heel for the oxidation of Nb-silicide based alloys. Alloying of both phases is essential to meet the oxidation property goal. However, such alloying for oxidation resistance can have adverse effect on the toughness and creep properties of the phases and alloys. In other words, there is a competition between toughness and creep against oxidation resistance. Other intermetallics and other solid solutions also can be stabilized in the microstructure of Nb-silicide based alloys [5,6,7]. Depending on alloying additions and their concentrations in the alloy and on processing conditions, different types of Nbss (see [6]) and tetragonal Nb3Si, C14-AB2 Laves phase(s) (mainly NbCr2 based) and A15 Nb3X (X = Al, Ge, Si, Sn) intermetallics can form [7,8]. Nb-silicide based alloys with AB2 Laves and A15 phases in their microstructures exhibit better oxidation. However, the Laves and A15 phases can have a negative effect on the toughness and creep of the alloys. Their volume fraction(s) must be optimized to achieve a balance of properties.
The most recent research on Nb-silicide based alloys has mainly focused on “forth” generation alloys, which have evolved from Nb-Ti-Si-Al-Cr alloys [9], MASC (Metal And Silicide Composite) type [1] Nb-Ti-Si-Al-Cr-Hf-(Sn, Ge) alloys, Nb-Si-TM-RM alloys to Nb-Si-TM-RM-X alloys (TM = Cr, Hf, Ti, Zr, RM = Mo, Ta, V, W, and X = Al, B, Ge, Sn, and exotic addition(s) [5,6,7,8,9,10,11,12]). To date, almost all the alloys have been studied in their cast and heat-treated conditions. There is very little research on simple ternary or quaternary alloys that were cast, and then extruded or forged and/or HIPed (Hot Isostatic Pressed) and heat treated, i.e., on the down processing of alloys, and even less research on simple ternary or quaternary powder metallurgy (PM) alloys. Some Nb-silicide based alloys are very close to or even surpass specific property goals.
The volume of experimental data for Nb-silicide based alloys is miniscule compared with that for ferrous and non-ferrous alloys. The alloys tend to have very high liquidus temperatures, in excess of 2000 °C. For research purposes the alloys are made as small buttons (in most cases weight ≤ 20 g) using non-consumable (W) electrode arc melting or plasma melting. Bars with ≤ 10 mm diameter also have been grown using optical float zone (OFZ) melting. Severe macrosegregation of Si and other alloying elements is present in many cast alloys [13] and often the chemical inhomogeneity prevails after heat treatment(s). Toughness or compressive creep has been measured using specimens cut from cast buttons or OFZ bars and the data for tensile creep is limited for few simple alloys. Oxidation behavior below and above 1000 °C has been studied mainly using isothermal oxidation (e.g., [14,15]). There are very few studies of cyclic oxidation behavior. Toughness, creep and oxidation rarely have been reported for the same alloy. Composition-process-microstructure-property relationships are not available for Nb-silicide based alloys. Toughness and creep have been studied using models for composites, for example for creep see [16,17].
The situation is not better regarding thermodynamic and phase equilibria data for Nb-silicide based alloys. Limited experimental data is available for some thermodynamic properties [18]. Phase diagrams for RM-RM (RM = refractory metal) systems have data only above 2400 °C [19]. There are disagreements about the composition and temperature of the equilibrium eutectic reaction L → Nb + Nb3Si, for which reported values respectively are in the range 15.3 at.% Si [20] to 18.7 at.% Si [21] for the composition of liquid, and 1912 °C [22] to 1938 °C [23] for the eutectic temperature. Calculated Nb-Si binary phase diagrams often ignore the experimentally established solubility range of the Nb5Si3. There are also disagreements about the temperature of the eutectoid reaction Nb3Si → Nb + αNb5Si3, which is reported to be in the range 1666 °C [23] to 1770 °C [19]. The temperature of the Ti5Si3 + βTi → Ti3Si peritectoid reaction is considered to be 1170 °C, based on [24], but there is new data that shows that it is in the range 1225 °C < T < 1250 °C [25].
There are also disagreements between experimental and calculated liquidus projections of the Nb-Ti-Si ternary system. For example, experimental [26] and calculated [20] liquidus projections do not specify the type of Nb5Si3 (β or α) forming from the melt, the calculated projections in [27,28] disagree with that in [29] and the liquidus projections in [28] and [30] differ significantly. In other words, there is disagreement about the effect Ti has on the stability of alloyed tetragonal (Nb,Ti)5Si3. The situation is also not better for the Nb-Cr-Si ternary system, for which there is disagreement about the liquidus projection [31,32] and three phase Nbss-Nb5Si3-NbCr2 equilibrium at 1500 °C and lower temperatures [33,34,35]. Furthermore, there is no data for important ternary systems of Nb with Sn or Ge (both elements improve significantly oxidation resistance), namely the Nb-Sn-X (X = Al, Hf, Mo, Ta, Ti, V, W), Nb-Ge-Z (Z = Cr, Mo, Ta, W), and Nb-Si-Ta systems [36]. In their review of Laves phases, Stein et al. [37] concluded that there are also “significant problems associated with the experimental determination of phase equilibria involving Laves phases”.
Titanium improves the oxidation of Nb [38] and Nb-silicide based alloys [15]. The solubility of Ti in the Nbss can vary significantly depending on alloying additions [9,39]. The actual concentration of specific solutes in Nbss depends on the concentration of Ti in the solid solution [40]. For example, the concentration of Cr in the Nbss increases with that of Ti. Furthermore, the partitioning of TM (=transition metal) and RM elements in the Nbss can result to strong solid solution strengthening of the Nbss and can affect the Si concentration in the Nbss [6]. In Nb-silicide based alloys it is possible to have three types of bcc solid solution, namely “normal” Nbss, Ti rich Nbss and Nbss with no Si [6]. In the alloyed Nb5Si3 the Nb can be substituted by other transition and refractory metals and the Si by other simple metals and metalloid elements. An actual 5-3 silicide composition determined by electron probe microanalysis (EPMA) is [48.3Nb-7.7Ti-1.8W-0.9Hf-0.8V-0.3Cr]-(33.1Si-3.2Ge-2.8Al-1.1Sn). Examples of actual compositions of other intermetallics are [26.4Nb-12Ti-5.8Mo-2.5Hf-0.9W]-(35.8Cr-8.2Si-5.5Al-1.6Sn-1.3Ge) for a Laves phase and [51.2Nb-28.1Ti-2.1Cr-1Fe-0.7Hf]-(3.8Si-2.7Al-10.4Sn) for an A15 phase, also determined by EPMA. In the compositions of the latter phases the elements substituting Nb are in the square brackets and those substituting Si in the parentheses. Modelling such real phases in CALPHAD or ab initio calculations is not a simple matter. For example, in the crystal structure of αNb5Si3 there are four different sub-lattices.
Alloying element additions reported in Nb-silicide based alloys include Al, B, Cr, Fe, Ga, Ge, Hf, Ho, Mo, Si, Sn, Ta, Ti, V, W, Y, Zr. Some of the alloying additions provide solid solution strengthening to the Nbss (for example, Mo, Ta, Ti, W), other elements suppress pest oxidation and improve oxidation at high temperatures (for example, Al, B, Cr, Fe, Ge, Hf, Sn, Ti), other elements suppress the stable eutectic and replace it by the metastable one (for example, Al, Mo, Sn, Ta, W) and other elements stabilize tetragonal Nb5Si3 (for example, Al, Cr, Mo, Ta, W) and improve creep (Mo, Ta, W). Are all these alloying elements essential additions in Nb-silicide based alloys to meet a property goal? How can the alloy designer select an alloy to get a balance of properties? How sensitive are the alloys to deviations from desirable (ideal) compositions? Can alloys containing large concentrations of very expensive elements be justified? Which are the compositional freedoms for primary alloying constituents? What are the maximum tolerances for minor alloying additions? The latter two questions were considered in [41] for eutectics with Nbss and Nb5Si3 that form in Nb-silicide based alloys.
The above brief discussion of the status quo for Nb-silicide based alloys shows that the tools available to the alloy designer are very limited compared with what is available for the development of ferrous and non-ferrous alloys. The motivation for the research presented in this paper was to attempt to provide answers to the above questions and to find out whether existing data for Nb-silicide based alloys can lead us to a complementary alloy design (selection) route that can assist alloy development when used with other alloy design tools that are improved continuously as on-going research generates much needed experimental thermodynamic data and phase equilibria data for key ternary Nb based systems [42,43,44].
How can one study alloying behavior in Nb-silicide based alloys? Actual compositions (at.%) of Nb with no Si solid solutions observed in Nb-silicide based alloys are 21.3Nb-11.3Ti-23.4Mo-18.0W-17.7Cr-5.3Al-3.0Sn, 25.8Nb-6.0Ti-21.8Mo-29.4W-12.0Cr-5.0Al and 15.4Nb-11.9Ti-27.1Mo-24.0W-13.3Cr-5.2Al-3.1Sn. Actual compositions (at.%) of Nb-silicide based alloys are 25Nb-27.4Ti-11.8Si-8.9Sn-7.2Mo-6.8Al-6.6Cr-6.3Ge, 27.0Nb-27.0Ti-14.0Si-8.5Sn-6.7Mo-7.0Ge-4.8Cr-5.0Al and 35.0Nb-17.0Ti-15.8Si-5.0Mo-5.0W-6.0Sn-5.5Cr-5.4Al-5.3Ge. Actual compositions (at.%) of eutectics with Nbss and Nb5Si3 observed in Nb-silicide based alloys are 38.8Nb-30.6Ti-13.4Si-7.3Hf-5.4Al-4.4Sn and 34.3Nb-36.8Ti-21Si-7.9Hf. All the above compositions were determined using electron probe microanalysis (EPMA). They satisfy the “standard definition” of the so called “high-entropy alloys” (HEAs), “concentrated solid solution alloys” (CSSAs), “multi-principle element alloys” (MPEAs), “complex concentrated alloys” (CCAs) [45] (note that it is not suggested that all Nb-silicide based alloys are HEAs). Amorphous Nb-Si alloys can be produced by Rapid Solidification techniques. Enthalpy and entropy of mixing, atomic size, electronegativity and valence electron concentration have been considered for the study of the alloying behavior of crystalline and amorphous alloys. Parameters used for the study of HEAs etc include the atomic size difference (δ), electronegativity difference (Δχ), valence electron concentration (VEC), entropy (ΔSmix) and enthalpy (ΔHmix) of mixing and Ω = Tm ΔSmix/|ΔHmix| [45].
The research presented in this paper builds on earlier studies of the alloying behavior of Nb-silicide based alloys [46], their solid solutions [6], the tetragonal Nb5Si3 [47], and hexagonal C14-NbCr2 and cubic A15-Nb3X phases [48] and eutectics with Nbss and Nb5Si3 [41]. For the Nb solid solutions formed in Nb-silicide based alloys it was shown that the parameters δ, Δχ, VEC, ΔSmix, ΔHmix and Ω could describe the alloying behavior (the capital letter Q was used instead of Ω for the ratio TmΔSmix/|ΔHmix| in [6] to avoid confusion with the term Ωij in the definition of ΔHmix). The parameters δ and Δχ respectively separated Ti rich Nbss and Nbss with no Si, and solid solutions depending on alloying additions.
The alloys, where the solid solutions studied in [6] belonged to, were studied in [46] using the same parameters and the ratio sd/sp of sd electronic configuration elements over sp elements. It was shown that the alloys could be separated in three groups according to alloying additions using the parameters Δχ, VEC, and δ. When the data for the parameters of alloys and solid solutions were combined it was discovered that specific pairs of parameters could separate the alloys and their bcc solid solutions. This research also revealed that there is an overlap of the values of some parameters when Nb-silicide based alloys are compared using data for best isothermal oxidation at 800 °C and 1200 °C and for creep at 1200 °C and 210 MPa.
The alloying behavior and properties, respectively of tetragonal Nb5Si3, and hexagonal C14-NbCr2 and cubic A15-Nb3X phases, which were in the Nb-silicide based alloys studied in [46], were studied respectively in [47,48]. The alloying of Nb5Si3 was described using Δχ versus VEC maps. Deterioration of the creep of alloyed Nb5Si3 was accompanied by decrease of VEC and increase or decrease of Δχ depending on alloying addition(s). A plot of Δχ versus Cr, and maps of Δχ versus VEC and VEC versus atomic size separated the alloying behavior of C14-NbCr2. The better creep of Nb(Cr,Si)2 compared with the unalloyed Laves phase was related to the decrease of the parameters VEC and Δχ. The Δχ versus VEC map separated the alloying behavior of elements in A15-Nb3X, the hardness of which was correlated with the parameters Δχ and VEC.
The aims of the research presented in this paper were (i) to find out relationships between the alloy parameters Δχ, VEC, δ and solute concentrations in Nb-silicide based alloys and the oxidation and creep properties of these alloys and (ii) to demonstrate the use of such relationships to design (select) new Nb-silicide based alloys. The toughness of Nb-silicide based alloys is not addressed in this paper. The structure of the paper is as follows. First the objectives of the research are given. Then oxidation and creep of Nb and Nb-silicide based alloys are discussed to highlight the importance of aforementioned parameters for the study of these properties. Relationships between parameters and oxidation, creep or Si macrosegregation are shown and finally a methodology for designing (selecting) new Nb-silicide based alloys is presented.
2. Objectives, Results and Discussion
The first objective of the research was to justify the use of the parameters δ, Δχ and VEC for the study of the oxidation and creep of Nb-silicide based alloys. The second objective was to locate the phases that can form in Nb-silicide based alloys in a Δχ versus VEC map and to compare their creep. The third objective was to find out relationships between the alloy parameters Δχ, VEC, δ and weight gain in isothermal oxidation and steady state creep rate of Nb-silicide based alloys. These objectives were realistic because there was data for the actual compositions of the alloys for which oxidation (weight gain) or compressive creep data were available and thus it was possible to calculate the alloy parameters Δχ, VEC and δ as described in [6]. The forth objective was to find out if the aforementioned relationships can lead to the development of an alloy design/selection methodology.
Grouping of solutes in Nb-silicide based alloys was demonstrated in [6,46]. In the latter paper, correlations between activation energy for diffusion, diffusivity, atomic size and electronegativity were discussed. The research described in this paper was also interested to find out if there are correlations between atomic size, electronegativity or VEC and (i) shear moduli of cubic symmetry alloying elements added in Nb-silicide based alloys, (ii) ratios of shear and bulk moduli for cubic and hexagonal symmetry alloying elements added in Nb-silicide based alloys, (iii) anisotropy parameters for cubic and hexagonal symmetry alloying additions, 5-3 silicides and A15 intermetallics, (iv) G/B (G is the shear modulus and B is the bulk modulus) ratios of 5-3 silicides and A15 intermetallic phases (G is the shear modulus and B is the bulk modulus) and (v) the Young’s moduli of elasticity of alloying elements in Nb-silicide based alloys. All actual compositions of alloys and phases in their microstructures that were used to calculate the parameters δ, Δχ and VEC were determined using EPMA [6,41,46,47,48]. No new experimental data were created during the course of this study.
This section starts by reflecting on the importance of atomic size, electronegativity and VEC (a) in the solubility of oxygen in Nb, the type(s) and structure(s) of the oxides formed in the scales and their importance in the oxidation of Nb-silicide based alloys and (b) in the creep of polycrystalline Nb-silicide based alloys (Nb-silicide in situ composites). The latter builds on the link between alloying of Nb5Si3, C14-NbCr2 and A15-Nb3X phases and their properties that were studied in [47,48]. The alloying behavior and properties of eutectics with Nbss and Nb5Si3 were discussed in [41].
2.1. Oxidation
Niobium is a group 5 transition element in the periodic table. It has high solubility for oxygen, about 9 at.% at 1950 °C [19]. Alloying aims to reduce this and to slow down the diffusion of oxygen. At 800 °C and 1200 °C the diffusion distances of oxygen in Nb after 100 h are about 2.75 and 15.8 mm, respectively [49]. Titanium reduces the diffusivity of oxygen in Nb, for example the diffusivity of oxygen in Nb-25Ti is 1/20 that in pure Nb [50]. The effect of alloying on oxygen transport kinetics in pure Nb and Nb-34Hf-21Al (at.%) at 1300 °C was demonstrated in [51].
The other two transition metals in group 5, namely V and Ta, also have high solubilities for oxygen, which respectively are about 15 at.% and 6 at.% but the elements in group 6 (Cr, Mo and W) have significantly lower oxygen solubilities [19]. The aforementioned elements can be in solution in bcc Nb together with simple metals and metalloids. Also, they substitute Nb in Nb5Si3. An example of Nbss with no Si is the solid solution 63.4Nb-11.7Ti-2.3Hf-11.1Mo-5.7W-6.1Al (see introduction and [6] for more compositions of Nbss in Nb-silicide based alloys). For an example of an actual chemical composition of a Nb5Si3 silicide see introduction.
Atomic size is important in diffusion in alloys. The diffusion of solutes to the substrate/oxide interface is one of the factors that control oxidation. Wagner showed that the oxidation rate of Ni-Pt alloys at 850 °C and 1100 °C was essentially determined by the diffusion of Ni to the alloy-NiO interface [52]. The low oxidation rate of Ni alloys with Be or Si additions compared with the high oxidation rates of Ni alloys with Mo or Cu additions was attributed to differences in the atomic size of solute and solvent [52]. Silicon and Be, and Cu and Mo respectively have smaller and larger atomic size than Ni. The different oxidation behavior was attributed to enhanced diffusion of Ni due to lattice distortion that increased oxidation rate [52]. The relationship between solute atomic size and diffusivity in Nb was discussed in [6].
Research has linked oxygen solubility in binary Nb alloys with the electron per atom ratio (e/α) [53]. The latter is often used to discuss phase stability. Minimum oxygen solubility in Nb-X (X = Mo, Re) alloys was reported for (e/α) ratios of 5.7 and 5.75 for Mo and Re respectively, and was suggested that minimum oxygen solubility occurs when (e/α) = 5.7 [54]. The latter was disputed in [55]. The author’s research group has shown that in Nb-silicide based alloys the concentration of Mo in the alloy is very important for the oxidation behavior [15].
Oxygen dissolves interstitially in octahedral holes in bcc Nb. The different solubilities of oxygen in metals arise from differences in the binding energy of an oxygen atom to an interstitial site. An oxygen atom in the lattice of an element will cause electron redistribution. As an oxygen atom creates a charge density hole, electrons are excluded from the latter and then some of the excluded electrons go back to the hole. The electrons that were displaced from the excluded region will be accommodated in unoccupied metal orbitals and thus the Fermi level will change.
Phase stability can be considered in terms of (e/α) (averaged valence of alloying elements in an alloy) and VEC (number of valence electrons per atom filled into the valence band). The (e/α) ratio is the parameter in the Hume–Rothery rules [53] and the VEC is essential to determining the Fermi level in the valence band [56]. The (e/α) ratio is difficult to use as a universal parameter in alloy design because its value cannot be uniquely assigned to a transition metal as it depends on the surrounding environment. Instead, VEC is a more important parameter in transition metal alloys [56].
Electronegativity (χ) describes the tendency of an atom to attract electrons. The activity of a metal is correlated with its electronegativity, and metals are categorized as very electropositive (χ < 1.4), electropositive (1.4 < χ < 1.9) and electronegative (1.9 < χ < 2.54). Very electropositive metals oxidize easily. Electropositive metals can form protective metal oxide and their surfaces tarnish in oxygen. Chromium, Ge, Sn, Ti, V belong in this category. Electronegative metals do not form very stable oxides and the latter can decompose on heating. Niobium, Mo, Ta, W belong in this category. Electropositive and electronegative elements are present in the three types of bcc Nbss [6], in the Nb5Si3 silicide, where they substitute Nb or Si [47], in the C14-NbCr2 Laves phase where they substitute Nb or Si and in A15-Nb3X compounds [48], see examples of compositions given in the introduction.
The oxidation of Nb-silicide based alloys starts with the oxidation of Nbss grains in the surface, this is followed by the oxidation of Nb5Si3 grains (and other intermetallics) in the surface. The oxidation promotes the surface segregation of Nb that subsequently oxidizes [15,57]. This is followed by oxidation of Nbss and Nb5Si3 below the surface and even in the bulk [15] as well as of other intermetallic phases such as the C14-NbCr2 Laves and A15-Nb3X phases (this is often referred to as (phase) contamination by oxygen). The oxidation of the solid solution is more sever compared with the silicide(s) and other intermetallics [14,15,57]. The oxidation of all phases depends on their chemical composition and on the alloy microstructure (volume fractions of phases, shape, size and spatial distributions of phases) that results from processing. The oxidation includes the dissolution of oxygen and the formation of sub-oxides and of several crystalline oxides in various oxidation states and leads to a mixture of oxides or oxygen-saturated metal + oxides [14,15].
It is important to consider the types and structure(s) of the oxides forming the scales on Nb-silicide based alloys. Oxides in which Al, Cr, Hf, Mo, Nb, Si, Ta, Ti, V or W can participate must be considered because these elements are key for achieving a balance of properties in Nb-silicide based alloys. Not all these elements are simultaneously or necessarily present in every alloy. However, Si and Ti are always present in the alloys, both tend to segregate to Nbss grains in the surface and the segregation of Ti is more severe [58,59]. The latter was suggested to promote the selective oxidation of Ti and the early formation of TiO2 in the scale [58].
The oxide scales formed on Nb-silicide based alloys contain TiO2 (rutile), SiO2, Nb2O5 and niobates [14,15]. In the latter, TM, RM and simple metals can be present [14,15]. The early formation of rutile and Nb oxides in the scale of Nb-silicide based alloys is critical because many of the mixed oxides that form have structures that show analogy with the rutile structure. This is briefly discussed below.
Nb can form the oxides NbO, NbO2 and Nb2O5 [19], where the valence of Nb respectively is Nb2+, Nb3+ and Nb5+. The latter oxide is the most stable. The most commonly encountered polymorph of the Nb2O5 is the monoclinic H-Nb2O5, which is the stable form in air above 900 °C. The stoichiometry of all polymorphs is maintained by NbO6 octahedra. In stoichiometric and slightly reduced Nb2O5, the diffusion coefficients for oxygen are up to 200 times greater parallel to the b axis than perpendicular to this direction [60].
Rutile forms a series of “shear-type” TinO2n−1 structures (Magneli phases) with 4 ≤ n ≤ 10 [61]. The structures are made up of layers of rutile structure with a width of n TiO6 octahedra. The TiO6 octahedra share faces across the discontinuity or crystallographic shear plane.
Binary (mixed) oxides of Nb and solute elements like Al, or TM or RM can form. Examples include the Al, Cr and V niobates AlNbO4, CrNbO4 and VNbO4 and the binary (mixed) oxides of Nb2O5 with TiO2, Ta2O5, V2O5, MoO3 and WO3. Rutile can also form binary oxides with HfO2 [62] and Ta2O5 [63]. There are similarities in the structures of such binary oxides that are important for the diffusion of oxygen and solute elements. Up to about 5 mol % hafnia can be in solution in rutile [62].
The AlNbO4 niobate crystallizes in a monoclinic system and in its crystal structure blocks of ReO3 type can be distinguished, built from distorted MO6 octahedra. The CrNbO4 niobate has tetragonal structure (tP6) with prototype TiO2 (rutile) and its structure consists of (Cr,Nb)O6 octahedra. The VNbO4 also has tetragonal structure (tP6) with prototype TiO2 (rutile). Adherence of CrNbO4 scale (with small amount of Cr2O3) on NbCr2 Laves phase has been reported after cyclic oxidation in air at 1200 °C that gave a rate of metal loss of 4.9 µm/h [64].
A very wide range of Ti(1−x)NbxO2 compositions have the ideal rutile structure [65]. Binary oxides between Nb2O5 and TiO2 include TiO2-Nb2O5 (TiNb2O7) [66], TiO2-3Nb2O5 (Ti2Nb10O29) [66,67,68], and TiNb24O62. Disorder is created by Nb5+ as a donor dopant in TiO2. The crystal structure of TiNb2O7 contains ReO3 blocks of corner-sharing MO6 octahedra. The different stoichiometries and structures of the above oxides are a consequence of variations in the size of these ReO3 blocks and the way they are joined together.
The metal positions in the structures are occupied by one or other of these elements in a random manner. Each metal atom (Ti and Nb) is coordinated to six oxygen atoms [69,70] forming an octahedral grouping (TiO6 and NbO6). In TiNb2O7 these blocks contain MO6 octahedra and form a linear column along the b-axis of the unit cell. Perpendicular to the b-axis the columns are bound by crystallographic shear planes. Across the shear planes the MO6 octahedra share edges [70]. In all cases, the b axis (the short axis of the structures) is around 3.8 Å, the length of the octahedral body diagonal of the structures. The smaller and lower-charged Ti4+ ion has a preference for the octahedra at the corners and edges of the blocks. TiNb2O7 is very friable, whereas the TiNb2O6.42 is very resistant to fracture. These properties are reversible as the binary oxide composition can change in the oxidizing atmosphere.
The structures of binary oxides in the Nb2O5-WO3 system [70] also derive from blocks of the ReO3 type, with networks of octahedral MO6 groups linked by sharing the oxygen atoms at their vertices. The growth axes of the Nb-W oxides are parallel to the infinite extension of the blocks, with a periodicity of 3.8 Å. The structure of Nb14Mo3O44 and Nb12MoO33 (isostructural oxides respectively with Nb14W3O44 and Nb12WO33) also consists of blocks of ReO3 type, built up from deformed NbO6 octahedra sharing only corners. Oxides in the V2O5–Nb2O5 system consist of corner sharing metal-oxygen polyhedra. The structure of VNb9O25 consists of block structures of NbO6 octahedra, which are shared with VO4 tetrahedra at each corner of those blocks [71].
The columbite-tantalite mineral group is the most common group of Nb and Ta bearing minerals. Tantalum is found together with Nb and Ti in at least 15 minerals, and with Nb in 12 minerals. Tantalum is the main impurity in commercial purity Nb. Its oxide, Ta2O5, has two polymorphs, a low temperature one (known as L-Ta2O5) and the high temperature H-Ta2O5. Their structure involves highly distorted TaO7 and TaO6 polyhedra [65] and the periodicity of the structure is sensitive to small concentrations of dopants [72]. Nb2O5 can form a solid solution with Ta2O5 and (Ta1−xNbx)2O5 solid solutions crystallize at a lower temperature than Ta2O5.
To summarize, the atomic sizes of the elements that participate in the mixed oxides formed on Nb-silicide based alloys are important because the oxide structures consist of blocks of the ReO3 type with networks of octahedral MO6 groups.
Ta2O5 contains a large number of oxygen vacancies [73]. The loss of oxygen can be suppressed by TiO2 substitution [74]. The TiO2 addition significantly slows down the H- to L- phase reversion [72]. Ti substitution in the octahedra is more energy favorable [72]. By doping of TiO2 in Ta2O5, oxygen vacancies are compensated by Ti4+ ions that are substitutionally incorporated at Ta5+ sites [72]. The Ti4+ has radius similar to Ta5+, which allows for dense packing in the Ta and O matrix.
The TiTa2O7 is isostructural with TiNb2O7 and Nb and Ta are compatible in rutile. The latter is often considered as stoichiometric TiO2 and Nb5+ and Ta5+ replace Ti4+ in the octahedral Ti sites. The charge balance in these sites and interstitial sites is provided by oxygen vacancies. The diffusivities of Ti and oxygen in rutile are significantly higher than those of Nb and Ta that are also higher than the diffusivity of Hf in rutile. Furthermore, the diffusivity of Nb in rutile is four times that of Ta [75]. Marschall et al. [75] attributed the high DNbTiO2/DTaTiO2 ratio to differences in electronegativity rather than to mass difference after considering the factors that influence the substitution of elements in minerals, namely ionic charge (the same for Nb and Ta), ionic radii (very similar for Nb and Ta) and electronegativity (1.6 for Nb vs. 1.5 for Ta). The latter influences bond strength and thus the potential for substitution in rutile [75].
The above discussion shows that in the oxidation of Nb-silicide based alloys there is inter-dependence of solubility and diffusivity of oxygen, oxidation and diffusion of Nb and solute elements and chemistry and structure of the oxides on atomic size, electronegativity and VEC.
2.2. Creep
In polycrystalline alloys, creep is controlled by diffusion-controlled dislocation creep, grain boundary sliding and diffusional creep. The creep rate έ is related to the stress σ with the power law relation έ ∝ σn. Harper-Dorn creep occurs when n = 1. The exponent n can be approximately equal to 3 (viscous glide of dislocations, activation energy Qcreep approximately equal to the activation energy for interdiffusion of solute atoms Qinterdiffusion), or 5 (climb of dislocations) or 8 (dislocation climb creep under constant microstructure). For the latter two cases Qcreep is approximately equal to the activation energy for self-diffusion Qself-diffusion. Creep data for dispersion hardened alloys provides support for n ≈ 8. However, the latter alloys can have Qcreep ≠ Qself-diffusion. Metal matrix composites can have high and variable stress exponent and activation energy, but when a threshold stress (stress below which creep cannot occur) is considered the values of the above parameters are similar to those of n and Qcreep of pure metals and solid solution alloys [76].
For Nb and the group 5 and 6 transition metals in the periodic table that can be in solution in Nbss, often Qcreep is noticeably less than Qself-diffusion for homologous temperatures less than 0.6 and often much higher at higher homologous temperatures, and the values of n can be in the range 4 to 7 [77]. For intermetallics that can be present in the microstructures of Nb-silicide based alloys the following is known regarding creep. The compressive creep of NbCr2 at 1200 °C and σ = 69 MPa gave n = 2 and Qcreep ≈ 130 kJ/mol [64]. The compressive creep of Nb3Al at 1000 °C was comparable with that of Ni based superalloys at the same temperature and gave n = 2.86 and Q = 350 kJ/mol [78]. The latter is close to the activation energy for chemical inter-diffusion in Nb3Al (Q ≈ 366 kJ/mol [79]) and the activation energy for the diffusion of Al in Nb (335 kJ/mol [6]). For the creep of Nb3Al at 1200 °C the stress exponent n was 2.19 [78]. For Nb3Al, nano-indentation creep gave creep exponent 4.2 and Q = 531 kJ/mol, or about 1.5Qself-diffusion [79]. The compressive creep of Nb3Sn (for 25 at.% Sn) at 1400 °C gave n = 4.5 and Q ≈ 450 kJ/mol [78] (compared with 320 kJ/mol for the activation energy for the diffusion of Sn in Nb [6]). The creep at 850 and 1000 °C of dual phase alloys based on (Ti,Nb)5(Si,Al)3 and (Ti,Nb)3(Si,Al) could be described in terms of power law creep [80].
The Nb-silicide based alloys are also known as in situ composites where the two most important phases are considered to be the bcc Nbss and tetragonal Nb5Si3 (see introduction). Experimental data has given n ≈ 1 for the Nb5Si3 silicide and n ≈ 3 for the Nbss [16,17] (see previous paragraph for n values of other intermetallics that can be present in the microstructures of Nb-silicide based alloys). The volume fractions of these phases can differ between composites. When the matrix is the strong phase (silicide) the composite is an (ductile phase toughened) intermetallic matrix composite (IMC). When the matrix is the weak phase (Nbss) the composite is a metal matrix composite (MMC). Either composite type can have more than one type of bcc Nbss (see [6]) and Nb5Si3 silicide (meaning βNb5Si3 and/or αNb5Si3 and/or γNb5Si3, see introduction), the silicide can have complex composition with Nb and Si substituted by other solute elements (see example given in the introduction and [47]) and there is partitioning of Ti and Hf at the interface between Nbss and silicide [9,47]. The latter interface is rich in Ti and Hf, during exposure to high temperature only the solid solution is homogenized but the interface between solid solution and Nb5Si3silicide can continue to be rich in Ti but only on the silicide side [9]. Furthermore, there can be precipitation of second phase(s) in the silicide [5,7,9,81,82]. Alloying affects the creep of all phases (see below), can stabilize the hexagonal γNb5Si3 silicide (which is considered undesirable for creep [1]), can result to significant changes of the properties of tetragonal Nb5Si3 [47] and can promote or slow down the transformation of βNb5Si3 to αNb5Si3 (for example, see [5,7,9,81,82]). A consensus has not been reached about the type(s) of other intermetallic phases that are desirable for the creep of Nb-silicide based alloys. Research on how different microstructures affect the creep of Nb-silicide based alloys is also extremely limited, owing (i) to the limited resources worldwide for the processing of these materials and (ii) the limited availability of material for experimental work (see introduction).
The parameters δ, Δχ and VEC, which are based respectively on atomic size, electronegativity and valence electron concentration and describe the alloying behavior of Nb-silicide based alloys and the phases that are present in their microstructures [6,41,46,47,48], depend on electronic structure. Could these parameters be related to creep rate? Creep refers to the plastic deformation of a material with time at constant stress. Creep theories consider the motion of dislocations in the microstructure. The creep rate έ is related to the dislocation velocity υ (έ = bρυ, υ = Bτeffmexp(−U/kT), where ρ is the density of mobile dislocations, b is Burger’s vector, τeff is an effective shear stress acting on the dislocation, B is a constant and m and U describe the stress and temperature dependence of the dislocation velocity [83]). What is the role played by electronic structure in the motion of dislocations in plastic flow? Below, deformation is briefly considered in the context of dislocations and electronic structure.
The deformation of materials can be dislocation mobility controlled (intrinsic resistance to dislocation motion) or dislocation obstacle controlled (extrinsic resistance). Materials in which flow is limited by dislocation mobility are strain rate sensitive and are characterized by a low stress exponent n and a large strain rate exponent. In such materials dislocations propagate by the motion of kinks, in other words the latter limits dislocation mobility. In materials where flow is dislocation obstacle controlled, deformation occurs by the rapid motion of highly mobile dislocations that are free to glide until they become obstructed by extrinsic resistances such as the dislocation substructure, precipitates and phase interfaces and other obstacles (see below), at which point the generation of new dislocations is required to continue deformation. Extrinsic resistances are those in which dislocation lines as a whole interact with some structural feature of a material and include the cutting or bypassing of precipitates (Orowan bowing) by dislocations.
The deformation of bcc metals and Class I solid solutions is controlled by dislocation mobility, i.e., by the motion of kinks. In contrast, in pure fcc metals and Class II solid solution alloys dislocation mobility is controlled by obstacles such as dislocation substructure. The activation volume (Vactivation) and the stress exponent n can be used to identify the microstructure mechanisms that control deformation. For the bcc metals Nb and W the stress exponent n respectively is in the range 5 to 7 and 5 to 9 and the activation volume Vactivation respectively is 50b3 and 5b3 (b is Burger’s vector) [84] compared with the significantly higher n and Vactivation values for metals whose flow is dislocation obstacle controlled. For example, for Cu, n = 100 and Vactivation = 2000b3 [85]. For Si and Ge (covalent bonding) the Vactivation values at 900 °C were 23.4b3 and 18b3 respectively and 9b3 for Ge at 600 °C [86].
The effect of symmetry on bonding is very important. The band gap between the conduction and valence energy bands forms a basis for properties such as elastic stiffness, plastic flow resistance (dislocation mobility), and crystal structure stability. The larger the band gap the more stable the crystal structure. Dislocation mobilities determine rates of plastic shape change. The arrays of atoms at the cores of dislocations are important for mechanical behavior. The symmetry changes as material passes into and then out of the core of a moving dislocation. Dislocation lines move through kinks that lie along their lengths. The atomic configuration at a kink is very different than it is in the normal crystal structure. Kink mobility is directly related to electronic structure. The activation energy for dislocation mobility in Si, Ge and Sn is proportional to the band gap. In Si (covalently bound element) kinks are very localized [87]. The mobility of dislocations is very small in covalently bonded crystals like Si.
The range of dislocation mobilities is very large when measured by the stress needed to move a dislocation. This range is from very small in a perfect metal to about G/4π for a covalently bonded crystal (G is the appropriate shear modulus). Extrinsic resistance to dislocation mobility arises from dislocations, stacking faults, vacancies, interstitials, grain boundaries, anti-phase boundaries, twins, precipitates, free surfaces and others. Theories of creep in metals and alloys consider extrinsic resistances and grain size. Dislocations move by becoming intermittently trapped by various obstacles followed by “free run”. The former is caused by extrinsic factors (see above) that create obstacles to dislocation movement. The latter is limited by intrinsic factors, i.e., by the interaction of dislocations with conduction electrons and phonons.
Dislocation mobility depends strongly on chemical bonding. In simple metals the theoretical width of a dislocation is a few atomic spaces but the bonding is very delocalized, thus the energy of a dislocation is nearly independent of its position. In covalently bonded crystals the bonding is highly localized to the regions between pairs of atoms (less than one atomic distance) and this depends strongly on the position of the center of a dislocation. In the transition metals the electrons that contribute most to the cohesion are localized in spd-hybrid bonds. Thus, the cohesive energy is not nearly independent of the atomic configuration.
In bcc metals slip occurs in the <111> direction and the Burger’s vector is α/2<111>. The bonding in bcc metals gives the screw dislocations a non-planar core structure. Dislocations move through the nucleation and propagation of double kinks. There is disagreement about the fundamental slip planes in bcc metals, i.e., the planes where kinks form. According to slip trace analyses at low temperatures slip always occurs on {110} planes and as the temperature increases slip is observed on {110}, {112} and {123} planes in order of increasing rarity. The continuum theory predicts slip on {110} planes at low temperatures and on {112} for temperatures above about 100 K but atomistic simulations show {110} slip at 0 K and at finite temperatures [88].
For edge and screw dislocations the bonding disregistry respectively is perpendicular to and along the dislocation line direction. The elastic energy of a dislocation is independent of the sense of its Burger’s vector but its mobility need not be because its core may not have mirror symmetry about its mid-point. In bcc metals the mechanical properties are governed by ½<111> screw dislocations, and asymmetry appears when the glide direction is <111>. The nature of the dislocation core dictates the types of kinks that can form on a dislocation line. Dislocation kink mechanisms are linked with symmetry breaking that can be caused by mixed character of dislocation, the symmetry of the crystal lattice and atomic core reconstruction. The latter is dependent on the details of interatomic interaction [89]. Atomistic simulations of screw dislocation cores in Mo and Ta have shown them to be non-degenerate cores. There is no data for the screw dislocation cores in Cr, Nb and V but it is expected that they are also non-degenerate [88]. In other words, dislocation cores in bcc metals are non-degenerate and spatially spread. The spreading into {110} planes varies locally depending on local atomic composition [90]. An atomistic modelling study of kinks on screw dislocation in Si concluded that “the structure of a single kink is characterized by a narrow core and highly stretched bonds between some of the atoms”. Ge has similarities with Si regarding dislocation properties [91].
Correlations exist between the cohesive properties and electronic structure band. Covalently bonded solids possess intrinsic plastic resistance. The motion of dislocations is limited by the motion of their cores and the core motion is limited by the motion of kinks along the cores. In materials with localized bonding, dislocations are expected to move bond by bond. At a kink the chemical structure is severely disrupted (a chemical bond is broken). This disruption is very localized.
In the microstructures of Nb-silicide based alloys the bcc Nb solid solution(s) co-exist with covalently bound compounds (silicides and other intermetallic compounds, see introduction). The importance of electronic structure for the properties of intermetallic compounds in Nb-silicide based alloys was demonstrated in [47,48] using the parameters VEC and Δχ. The latter is related to electronegativity and the former, which gives the number of valence electrons per atom filled into the valence band, is key to determining the Fermi level in the valence band [56]. Changes in the properties of the intermetallic phases were related to the parameters VEC and Δχ [47,48]. For example, the worsening of the creep of alloyed Nb5Si3 compared with the unalloyed Nb5Si3 was accompanied by decrease of VEC and increase or decrease of Δχ depending on alloying addition(s) [47], and the better creep of Nb(Cr,Si)2 Laves phase compared with the unalloyed NbCr2 Laves phase was related to the decrease of the VEC and Δχ parameters [48]. In [41] it was shown that the hardness of microstructures containing both Nbss and Nb5Si3 or Nbss, Nb5Si3 and A15-Nb3X increased as the VEC parameter of such microstructures increased. The same trend between hardness and VEC was observed for the hardness of the A15-Nb3X phases in the Nb-silicide based alloys [48], and for β(Nb,Ti)5Si3 and alloyed tetragonal Nb5Si3 [41]. The strong relationship between the hardness and VEC of eutectics with Nbss and Nb5Si3 was attributed to the covalent bonded intermetallic phase(s) in the eutectics, with the latter being the key phases that determined the hardness of the eutectics [41]. Most importantly, the trends between the C44 and VEC and hardness and VEC of α(Nb,Ti)5Si3 were the same as those reported for transition metal covalently bonded carbonitrides [41]. Also the trend between the C44 and VEC of β(Nb,Ti)5Si3 was the same as that reported for covalently bonded M2AlC compounds [41].
Dislocation mobility is fundamental to mechanical behavior and plastic deformation of materials including creep. How atomic size, electronegativity and valence electron concentration can elucidate the creep of Nb-silicide based alloys? What role can the electronic structure play in the creep of Nb-silicide based alloys? Are mechanisms related to electronic structure (i.e., intrinsic mechanisms) important in the creep of Nb-silicide based alloys? The following discussion will make a case that the link between the creep of Nb-silicide based alloys and their parameters δ (related to atomic size), Δχ and VEC, which relate to the electronic structure of alloys, is attributed primarily to the covalently bound intermetallics in their microstructures and to the increase of the covalency of the Nbss with alloying. In Section 2.3 it will be shown that there exist relationships between creep rate and each of the above parameters.
The electronic structure that underlies the structural geometry of elements plays a key role in determining the mechanical behavior of metals and alloys. Chemical bonding, which is provided by electronic structure, is crucial to mechanical behavior. The sizes of atoms are determined by energies of electrons in occupied quantum states. Interactions between atoms provide cohesion via the redistribution of the bonding electrons between the atoms. The spatial distribution of bonding electrons is key to mechanical behavior.
The elastic constants depend on structural geometry and the corresponding electronic structure. The shear coefficients are the most important sub-sets of the elastic constants. The Young’s modulus is a function of the bulk modulus B and the shear modulus G. The latter rather than the former appears in the equations of dislocation theory. Both B and G are fundamental coefficients for describing mechanical behavior.
The primary factor that determines elastic stiffness is chemical constitution because the latter determines bonding. The covalent bonds are the stiffest. A key parameter in bonding is the size of atoms (bond length). A key parameter for elastic stiffness is the valence electron concentration. In covalent bonds the charge associated with electron pairs is localized. In metallic bonds the bonding electrons are delocalized.
The shear moduli depend on both the shear plane and the shear direction and the structures of both of these depend on crystal symmetries and local atomic structure. For simple metals (those bonded primarily by s- and p-level electrons) as the number of valence electrons increases the bulk stiffness increases, and decreases as the atomic size increases. Only the s and p quantum states contribute to the cohesion of these elements. For the transition metals the occupied d and f states play an important role in the cohesion. The valence electron concentration is important for the bulk modulus of the covalently bonded Ge, Si and Sn. In covalently bonded materials the shear moduli can be significantly larger compared with the bulk moduli.
The most characteristic shear moduli for cubic symmetry are the C44 (shear on (100) planes), (C11-C12)/2 (shear on (110) planes in the face diagonal directions) and 3C44(C11-C12)/[4C44 + (C11-C12)] (shear on (111) planes). Figure 1, Figure 2, Figure 3 and Figure 4 show data for shear moduli, Zener anisotropy factor (see below) and G/B ratios of Nb and other cubic and hexagonal metals in Nb-silicide based alloys, 5-3 silicides and A15 compounds. The lines in these figures are provided to highlight trends for different groups of metals and compounds.
The shear moduli of metals of cubic symmetry that are alloying additions in Nb-silicide based alloys belong in different groups when the aforementioned characteristic shear moduli are plotted versus VEC, Pauling electronegativity χi and atomic size ri. Figure 1 shows plots of the latter of the above moduli parameters versus VEC, χi and ri. The same groups of elements as in Figure 1a–c respectively were in plots of C44 versus VEC and (C11-C12)/2 versus VEC (not shown), in plots of C44 versus χi and (C11-C12)/2 versus χi (not shown) and in plots of C44 versus ri and (C11-C12)/2 versus ri (not shown).
The G/B ratio is positive, is small for ductile materials and increases as the materials becomes increasingly rigid and more brittle. For covalently bonded solids the ratios C44/B, [C11-C12]/[2B] and 3C44(C11-C12)/[B(4C44 + (C11-C12))] are high and are greater than one for diamond (about 1.3, 1.08 and 1.14 respectively [92]). In such solids the dislocation mobility is significantly reduced compared with elements with metallic bonding. Increased covalency due to alloying would result to decreased dislocation mobility. Figure 2 shows plots of the second of the above ratios versus VEC, χi and ri. The same groups of elements as in Figure 2a–c respectively were in plots of C44/B versus VEC and 3C44(C11-C12)/[B(4C44 + (C11-C12))] versus VEC (not shown), in plots of C44/B versus χi and 3C44(C11-C12)/[B(4C44 + (C11-C12))] versus χi (not shown) and in plots of C44/B versus ri and 3C44(C11-C12)/[B(4C44 + (C11-C12))] versus ri (not shown). Note that the colours indicate the same groups of elements in Figure 1a and Figure 2a, Figure 1b and Figure 2b and Figure 1c and Figure 2c.
The Zener anisotropy constant A = 2C44/[C11-C12] gives the deviation from isotropy for cubic, tetragonal and hexagonal structures [93]. Figure 3a is a plot of this parameter versus atomic radius ri of cubic and hexagonal symmetry elements in Nb-silicide based alloys. Note that the hexagonal metals Hf, Ti, Y and Zr are in the same group with Al, Ge, Si and Ta. Also note that the grouping of elements in Figure 1, Figure 2 and Figure 3a is in accordance with the separation of Nb-silicide based alloys in different groups that was discussed in [46]. The grouping of elements would also indicate that if there were to be relationships between mechanical properties and alloy parameters VEC, δ and Δχ, they would apply for specific groups of elements in Nb-silicide based alloys. The data for C11, C12 and C44 for the elements in Figure 1, Figure 2 and Figure 3a is from [94] (Al), [95] (Cr), [96] (Fe, V), [97] (Ge), [98] (Mo), [99] (Nb, Si), [100] (Ta), [101] (W) and [102] (Hf, Ti, Y, Zr).
Data for the Zener parameter A for 5-3 silicides with prototypes W5Si3 or Cr5B3 is plotted versus atomic radius respectively in Figure 3b,c and for A15-Nb3X compounds in Figure 3d. The R2 values in Figure 3b,c correspond to all the data. Note that the plots based on atomic radius show that the effect of alloying on the Zener parameter of tetragonal Nb5Si3 is weak. The metalloid elements form covalent bonds with metals in intermetallic compounds, which tend to reduce the dislocation mobility in these compounds. The latter have negligible ductilities because of the low mobilities of dislocations. Figure 4 shows plots of G/B for A15-Nb3X compounds and 5-3 silicides with prototypes W5Si3 or Cr5B3. The G/B data is plotted versus atomic radius in Figure 4a,d and versus Δχ in Figure 4b,c. Note similar trends in Figure 3d and Figure 4a for the A15 compounds. Also note that the plots of G/B versus ri or Δχ show clearly the strong effect of alloying with Ti on increasing the G/B ratio and thus the covalency of α(Nb,Ti)5Si3. Figure 4c,d also show that alloying with Ti has a stronger effect on the covalency of αNb5Si3 compared with βNb5Si3. The data for G/B and C11, C12 and C44 for the 5-3 silicides and A15-Nb3X compounds is from [103] (Cr5Si3), [99] (Nb5Si3), [104] ((Nb,Ti)5Si3), [100] (Mo5Si3, Ta5Si3), [105] (W5Si3, V5Si3), [106] (Nb3Sn) and [107] (Nb3Si).
Elastic properties like Young’s modulus and shear modulus depend on actual composition. Chan reported that the Young’s modulus of tetragonal unalloyed Nb5Si3 is reduced when Nb is substituted by Ti and as the concentration of Ti in (Nb,Ti)5Si3 increases (the structure changes to hexagonal (Ti,Nb)5Si3) the modulus decreases further towards that of Ti5Si3 [108]. Papadimitriou et al. [104] showed that this is the case only of βNb5Si3 and that the substitution of Nb by Ti in αNb5Si3 increases the Young’s modulus.
The shear moduli increase relatively more than the bulk moduli; thus, the G/B ratio is greater for intermetallic compounds compared with metals. For example, for Nb the G/B ratio is 0.228, for βNb5Si3 this ratio is 0.54 and for αNb5Si3 is 0.613. In other words, the tetragonal Nb5Si3 is more than twice as rigid as Nb. For the Nb solid solutions with no Sn or B additions that were given in the Table 1 in reference [6] the G/B ratio increases with alloying and is 54% higher than that of pure Nb for the 40.4Nb-31.5Ti-1.6Si-2.7Hf-1Ge-15Cr-7.8Al solid solution, which is about 90% of the G/B ratio of γNb5Si3 [104]. Alloying can increase further the G/B ratio of the Nbss, for example in one alloy recently studied in our group [109] the G/B ratio of the Nbss with no Si was 0.403, i.e., higher than that of γNb5Si3 (the G/B ratios of the aforementioned Nbss were calculated using the rule of mixtures). These high G/B ratios would also suggest that the Nbss becomes increasingly rigid and more brittle as the ratio is increased. The larger G/B ratios of the tetragonal Nb5Si3 and alloyed solid solution indicate that the dislocation core energies depend strongly on their positions.
The location of the Fermi level is indicative of phase stability. For intermetallics, a pseudo-gap in the density of states is observed close to the Fermi level owing to the combined effects of charge transfer and hybridization. For example, when there is large electronegativity difference between elements, the redistribution of electrons changes the shape of the band, the screening electrons are assigned to low states in the band and this gives the minimum in the density of states curve. The intermetallic is stable when the Fermi level is exactly at the pseudo-gap and unstable in the antibonding region (Fermi level to the right of the pseudo-gap). Alloying may stabilize a metastable intermetallic phase. When the Fermi level is to the left of the pseudo-gap (bonding states) not all bonding states are completely filled and additional electrons are needed to increase stability. If the Fermi level falls on a peak in the density of state curve of the intermetallic the Dself-diffusion of the latter is increased. Considering the Ti and Hf rich Nbss/Nb5Si3 interfaces in Nb silicide-based alloys and their contamination by oxygen and formation of hafnia near Hf rich areas of the Nb5Si3 [15,57,81], the changes of the Fermi level resulting from alloying will affect the stability of phases and their properties, both of which are important in creep.
In reference [47] it was shown that the alloying of Nb5Si3 changed the position of the Nb5Si3 silicide in Δχ versus VEC maps and that the changes (meaning increase or decrease) of these parameters depended on specific alloying addition(s). The effect of the substitution of Nb by Ti was clearly demonstrated, as was the substitution of Si by Ge or Sn and the alloying of the silicide with B in the Figures 5 and 6 in reference [47]. The specific case of the substitution of Nb only with Ti in Nb5Si3 silicides was studied using first-principles calculations in [104] to find out how the stability of different Nb5Si3 silicides and their elastic properties are affected with increasing Ti concentration. It was shown that for all 5-3 silicide structures (meaning tetragonal αNb5Si3 and βNb5Si3 and hexagonal γNb5Si3) the main contribution to the total electronic density of states (TDOS) was the partial electronic density of states (PDOS) of d electron states, followed by the p electron states. The s electron states contributed the least to the TDOS of all structures. For the unalloyed Nb5Si3 silicide the gradual decrease of phase stability from tetragonal to hexagonal Nb5Si3 silicide was explained by the location of the Fermi level of each silicide. The hexagonal γNb5Si3 silicide became stable compared with the tetragonal αNb5Si3 and βNb5Si3 when the Ti concentration reached 50 at.%. For the αNb5Si3 and γNb5Si3 silicides the shear and Young’s moduli increased with increasing Ti addition and decreased in the case of βNb5Si3. The substitution of Nb by Ti strengthened atomic bonding in αNb5Si3 and γNb5Si3, and decreased bond strength in βNb5Si3. The above discussion shows that the Nbss/Nb5Si3 interface in Nb-silicide based alloys is dynamic, meaning as the local chemistry changes during exposure to high temperature so do the mechanical properties of the interface.
The creep properties of Nb-silicide based alloys are key for their application at high homologous temperatures where diffusion is important. Diffusivities in the solid solution and silicide will depend on composition and in the case of the silicide will also depend on crystal structure. The latter can change as solutes partition to the silicide. The case for Ti was demonstrated in [104]. These changes also will be important in oxidation. Activation energies for creep may be strongly dependent on concentration(s) of impurities, for example contamination of Nbss (mainly) and silicide(s) by oxygen near the surface and below it and even in the bulk alloy microstructure is possible in Nb-silicide based alloys, depending on alloy composition [14,15,57]. Relationships between atomic radius and electronegativity of solute elements in Nb and their activation energies for diffusion and diffusivity at 1200 °C were discussed in [6].
The above discussion has indicated that if there were to be relationships between the creep of Nb-silicide based alloys and their parameters δ, Δχ and VEC, such relationships (i) would be about the contributions to creep rates made by intrinsic resistances not extrinsic ones and (ii) would not give the contributions made separately by intrinsic resistances to each parameter. In other words, any relationships between creep rate and parameters would be averaging the contributions of intrinsic resistances to creep that are expressed by a relationship between creep rate and a parameter. In the following parts of this paper it will be shown that as a matter of fact the available experimental data does give relationships between creep rates and each of the alloy parameters δ, Δχ and VEC.
Phases in Nb-Silicide Based Alloys: Δχ versus VEC Maps and Creep
The alloying behavior of bcc Nb solid solutions, tetragonal Nb5Si3, eutectics with Nbss and Nb5Si3, hexagonal C14-NbCr2 Laves phases and cubic A15-Nb3X compounds that are formed in Nb-silicide based alloys was studied, respectively in [6,41,47,48] and the data is summarized in the Δχ versus VEC maps in Figure 5. Figure 5a shows the phases without the eutectic. The data for the eutectic is included in Figure 5b, where the data for Nbss and Nb5Si3 alloyed with B has been excluded (eutectics with solid solution and 5-3 silicide are formed in B containing Nb-silicide based alloys, but currently there is no data about the actual chemical composition of these eutectics). Note that some data in Figure 5b for the eutectic is in the areas that were occupied by the data for B containing Nbss and Nb5Si3 in Figure 5a. Details of the solid solution area in the map are shown in the Δχ versus VEC map in the Figure 6. Figure 6A has the data for all solid solutions in cast and heat-treated alloys [6]. Figure 6B shows the data for the Ti rich Nbss and the Nbss with no Si [6]. The former is not stable after heat treatment.
There is a gap in Δχ values of the Nbss in Figure 6, which cannot be easily recognized in Figure 5, and no solid solutions fall in the range 0.13 < Δχ < 0.18. This gap in the Δχ values of the Nbss was discussed in [6]. The solid solutions with no B, Ta and V have Δχ > 0.18 and the solid solutions with no W have Δχ < 0.13. In Figure 6B in the bottom ellipse are the Ti rich Nbss with no refractory metals (RMs) (series 2). These solid solutions have 30 < Ti < 47 at.%, 9 < Cr < 16 at.% and 2 < Ti/Cr < 4. The Ti rich Nbss with RMs are in the bottom of the top ellipse. These solid solutions are lean in Mo and W and have 5 < (Mo + W) < 10 at.%, 3 < (Mo/W) < 5 and 2 < {Ti/(Mo + W)} < 6. In Figure 6B the Nbss with no Si (series 3) has 0.23 < Δχ < 0.33. This type of solid solution has 1 < (Mo/W) < 3, 0 < {Ti/(Mo+W)} < 1 and (Mo + W) > 14 at.%.
Data for the creep of bcc Nb solid solutions, tetragonal Nb5Si3, hexagonal C14-NbCr2 Laves phases and cubic A15-Nb3Al are shown in Figure 7A and details of the Nb5Si3 silicide data and the Nbss data are shown respectively in Figure 7B,C. Note that the phases in Figure 5a are represented in Figure 7A. The creep data for the intermetallics was discussed in [47,48]. Figure 7A shows the gradual decrease of the value of the exponent n and the shift towards lower creep rates and higher stresses from the left-hand side (occupied by the solid solution) to the right hand side of the figure (occupied by the Nb5Si3 silicide). The values of the creep exponent n of the silicide and solid solution are given in Figure 7B,C, respectively. The n values for Nb3Al, NbCr2 and Nb-55Cr-15Si, respectively are 3.39, 1.8 and 0.99.
The Nb solid solutions for which there is creep data for 1200 °C (Figure 7C) are shown in Figure 6B. In Figure 7A,C the creep data for the Nb-1Si and Nb-46Ti-1Si solid solutions shows the adverse effect that Ti has on the creep of the solid solution. This is further supported by the data for the leaner in Ti solid solution of composition Nb-27Ti-5Hf-2Al-2Cr-0.9Si. The positions of the Ti rich solid solutions Nb-46Ti-1Si and Nb-27Ti-5Hf-2Al-2Cr-0.9Si with regard to the Ti rich Nbss are shown in Figure 6B. Notice that the solid solutions Nb-1Si and Nb-5.4Hf-2Ti are outside the area for the Ti rich Nbss.
In Figure 7C there are two sets of data for the solid solution alloy Nb-5.4Hf-2Ti [113], which, as indicated in the caption, correspond to two different activation energies in έ = A(σ/E)nexp(−Q/RT), where E is the Young’s modulus [114]. The higher activation energy is closer to the activation energy for the diffusion of Hf in Nb [6]. The solid solution alloy Nb-5.4Hf-2Ti (known commercially as alloy C103) is considered as a Class I solid solution regarding its creep (n = 3). In this alloy, the Hf atoms rather than the Ti atoms were considered to be responsible for the solute effects on dislocation motion [113]. It has been suggested [113] that there is a critical concentration of Hf beyond which this element does not contribute significantly to strengthening at high temperatures. If the data for (d) and (e) in Figure 7C is correct, it would indicate a positive effect of Hf for the creep of Nb at low concentrations.
Under creep conditions the constituent phases in Nb-silicide based alloys, namely the Nbss and intermetallics (silicides and others) can be rigid and/or creeping. Models [16] of the creep behavior of these alloys and comparison of the results of modelling with experimental data for alloys with about 37% volume fraction silicide, (i.e., with composites with weak matrix, see above) have shown that rigid Nb silicides have high creep exponent and poor creep. Chan [16] concluded (a) that creeping silicides with low creep exponent (n ≈ 1) are desirable, (b) that creeping or rigid phases with n ≥ 3 are undesirable, (c) that desirable phases for optimum creep should be rigid at low stresses and creep with low n at higher stresses and (d) that diffusional creep and Harper-Dorn creep in intermetallics are preferred over power law creep with n > 1. The creep of composites with strong (Nb5Si3) matrix has been simulated by Henshall et al. [17] using data for bulk unalloyed Nb5Si3 and Nb-1.25Si solid solution. This work under-predicted steady state creep rates and over-predicted primary creep strains compared with experimental data for Nb-10Si.
Elastic constants depend on interatomic bonding and are important to understanding how the material will deform (see previous section). In reference [6] it was shown that the solutes in Nb belong in different groups when activation energy for diffusion (Q) and diffusivity (D) were plotted against atomic size or electronegativity. Figure 8 shows the Young’s (E) moduli of solute elements in Nb-silicide based alloys against atomic radius (Figure 8a) and electronegativity (Figure 8b). The solute elements fall in three groups with Boron in one of these groups (series c in both parts of Figure 8), consistent with the data for Nb-silicide based alloys in [46]. The transition metal (TM) and refractory metal (RM) elements in the series a, b and c in Figure 8 are in agreement with the ranking of substitutional solutes in binary Nb-X alloys in terms of their effect on creep strength [115].
2.3. Relationships between Alloy Parameters, Properties and Solute Concentrations
Correlations were found between weight gain per unit area (ΔW/A) after 100 h isothermal oxidation at 800 °C or 1200 °C and the alloy parameters Δχ, δ or VEC. Different functions (ΔW/A) = f1(Δχ), (ΔW/A) = f2(δ) or (ΔW/A) = f3(VEC) and plots like the one shown in Figure 9 were established for each temperature. In Figure 9 the R2 value for the linear fit of the data is 0.9359. In similar plots (not shown) of (ΔW/A) versus δ and (ΔW/A) versus Δχ the R2 values respectively were 0.932 and 0.949 for oxidation at 800 °C. For the oxidation at 1200 °C the R2 values for the (ΔW/A) versus Δχ, (ΔW/A) versus δ and (ΔW/A) versus VEC plots (not shown) were 0.935, 0.95 and 0.951, respectively. The oxidation data (isothermal weight gain) was from [14,15,59,109,116,117,118,119,120,121].
Figure 10 shows compressive creep data at 1050 °C and 100 MPa of the MASC alloy and other Nb-silicide based alloys [122]. The creep rate is plotted versus the parameters VEC, δ or Δχ. The creep rate decreases with increasing VEC or Δχ and increases with increasing δ. Creep rate of Nb-silicide based alloys at 1050 °C and 1200 °C for stresses higher than 100 and up to 300 MPa [122] also was found to be related to the alloy parameters δ, VEC and Δχ. The R2 value for the fit of data for creep rate at 1200 °C and 170 MPa was 0.9299 in έ = g1(δ) (figure not shown). The R2 value for the fit of data for creep rate at 1200 °C and 170 MPa in έ = g2(Δχ) and έ = g3(VEC) was 0.9586 and 0.9149, respectively (figures not shown). The size of the phases in the studied alloys was similar [7,9].
The macrosegregation of Si (MACSi) in cast Nb-silicide based alloys was discussed in [13]. Figure 11 shows such a relationship between MACSi = [CmaxSi − CminSi] and ΔHmsd with R2 = 0.9033. Similar relationships were found for the macrosegregation of Si versus ΔHmsd/ΔHmsp or Tmsd/Tmsp with R2 = 0.946 and R2 = 0.996, respectively (figures not shown). For the definition of the parameters ΔHmsd, ΔHmsp, Tmsd and Tmsp see [13].
Having established relationships between properties and parameters of Nb-silicide based alloys, the next step was to find out whether the property goals and said relationships could be used to assist the design (selection) of Nb-silicide based alloys. Relationships between the alloy parameters and solute additions were sought. It was discovered that the concentrations of all solute elements in Nb-silicide based alloys can be expressed as functions of the alloy parameter Δχ. An example is shown in Figure 12a for the linear relationship Hf = ψ1(Δχ) for the concentration of Hf in Nb-silicide based alloys. The R2 value for the fit of the data in Figure 12a was 0.9521. Similar relationships were discovered for the solutes Al, Ge, Cr, Mo, Si, Sn, Ti, and W with R2 values 0.957, 0.926, 0.9513, 0.930, 0.916, 0.930, 0.915 and 0.973, respectively (figures not shown). The concentrations of solutes also could be expressed as functions of other alloy parameters; an example is shown in Figure 12b for W versus the alloy parameter VEC, where R2 = 0.9831.
The relationships between alloy weight gain in isothermal oxidation at 800 °C and 1200 °C and the alloy parameters VEC, δ and Δχ (for example, see Figure 9), and between the concentrations of elements in Nb-silicide based alloys and the alloy parameters were used to find out the contribution each element makes in weight gain in Nb-silicide based alloys at each temperature by expressing weight gain as a function of solute element concentration. The relevant equations were of the type [ΔW/A]i (g/cm2) = ai + biCi where i = Al, B, Cr, Ge, Hf, Mo, Nb, Si, Sn, Ti, W, and C is the concentration (at.%) of element i and a and b are constants. For example, for oxidation at 1200 °C the above constants for Al were aAl = 6.22·10−4 g/cm2 and bAl = 0.0105 g/cm2 at.% for Nb-silicide based alloys without Boron. The grouping of elements was based on the results in [46] and the available experimental data for isothermal oxidation. Figure 13 shows the contribution to weight gain of element i at 1200 °C normalized against the weight gain of Nb, versus atomic radius and VEC of element i. Positive values of ([ΔW/A]/at.%)i/([ΔW/A]/at.% )Nb mean reduction in weight gain. The solutes with atomic size ri < rNb, namely B, Mo, Si and W, reduce weight gain, the solutes with atomic size ri > rNb, namely Al, Hf, Sn and Ti, increase weight gain. The solutes Cr and Ge, which have ri < rNb, fall in the same group as Mo and W but increase weight gain. It should be noted that the data in Figure 13 is only relevant to the concentrations of solute additions used in Nb-silicide based alloys. The solutes Al, B, Cr, Ge and Sn that are used to control the oxidation of Nb-silicide based alloys fall in the same group (series c in Figure 13a). Ti and Hf, which improve oxidation, belong in a separate group. The majority of the elements in series b, c and d in Figure 13b are the same as those in the same series in Figure 13a. Also, it should be noted that the same elements belong in the series a in the Figure 8a and Figure 13a,b and that there are similarities in the elements in series a, b and c in Figure 8b and Figure 13b.
The creep goal was given in the introduction. Experimental work has shown that the density of Nb-silicide based alloys can be around 7 g/cm3 [123] and that these alloys should have 16 < Si < 22 at.% [124] to meet this goal.
The relationships between creep rate at 1200 °C and 170 MPa and the alloy parameters VEC, δ and Δχ and between the concentrations of elements in Nb-silicide based alloys and the alloy parameters were used to find out the contribution each element makes in creep rate for the creep goal conditions by expressing creep rate as a function of solute element concentration. The relevant equations were of the type lnέ = ci + diCi where i = Al, B, Cr, Ge, Hf, Mo, Nb, Si, Sn, Ti, W, and C is the concentration (at.%) of element i and c and d are constants. For example, for Cr, cCr = −23.62 s−1 and dCr = 2.63 s−1 per at.%. Figure 14 shows the contribution to creep rate at 1200 °C and 170 MPa of element i normalized against the contribution to creep rate of Nb, versus Pauling electronegativity χi of element i. Positive values of [lnέ/at.%]i/[lnέ/at.%]Nb mean decrease in creep rate. The elements Mo, Si and W contribute to decrease creep rate while Al, B, Cr, Ge, Hf, Sn and Ti increase creep rate. The ranking of RM alloying additions is in agreement with [115]. There are similarities in the elements in series c in the Figure 8b, Figure 13 and Figure 14, and in series c in Figure 8a and series a in Figure 14.
2.4. Approaches to Alloy Design and Selection
The final objective of the research was to use the above data to develop a design methodology. The first approach to design a Nb-silicide based alloy was based on selecting a Si concentration, for example this could be from the range of the concentration of Si for “best” creep (16 < Si < 22 at.% [124]), say 18 at.%. Next, this Si concentration was used to calculate the value of the parameter Δχalloy from the Si = ψ1(Δχalloy) equation. The calculated value of Δχalloy was then used to calculate the concentrations of all other solute elements, for example Hf = ψ1(Δχalloy) for Hf, see Figure 12a. The calculated concentrations of the solutes gave an alloy composition for which the values of the alloy parameters ΔHcalmix,alloy, ΔScalmix,alloy, δcalalloy, Δχcalalloy, VECcalalloy, Ωcalalloy (sd/sp)cal and {Nb/(Ti + Hf)}cal were calculated as discussed in [46]. To proceed with the calculation (prediction) of properties (creep, macrosegregation and oxidation (weight gain after isothermal oxidation for 100 h at 800 °C and 1200 °C)) all the alloy parameters of the calculated alloy composition were checked to find out if they were in the ranges given in [46]. If the latter was the case, the creep rate at 1200 °C and 170 MPa was calculated using the function έ = g2(δcalalloy) or έ = g1(Δχcalalloy) or έ = g3(VECcalalloy). The weight gain at 800 °C was calculated using the function ΔW/A = f3(VECcalalloy), for example see Figure 9, or ΔW/A = f2(δcalalloy) or ΔW/A = f1(Δχcalalloy), and the weight gain at 1200 °C was calculated using similar functions for this temperature. The macrosegregation of Si in the cast alloy was predicted using relationships like that shown in Figure 11. The outlined procedure is shown in Figure 15.
An example of a Nb-silicide based alloy designed using the approach described above is the alloy Nb-21.93Ti-18Si-4.3Cr-4.06Al-4.9Hf-3.43Mo-1.03W-4.5Ge (at.%). We shall call this alloy A. This alloy has VECcalalloy = 4.513, δcalalloy = 8.79 and Δχcalalloy = 0.2. The parameters of this alloy are in the ranges for Nb-silicide based alloys [46]. The calculated (predicted) weight gains at 800 °C and 1200 °C, respectively are 8.9 mg/cm2 and 64.5 mg/cm2 and the macrosegregation of Si is 5.5 at.%. The predicted creep rate at 1200 °C and 170 MPa is lower than the creep goal (see below). The weight gain after 100 h at 1200 °C is significantly higher than that of the single crystal Ni based superalloy CMSX-4 (1 to 4 mg/cm2).
Another approach was to use έ = g1(Δχalloy) and a selected value of the creep rate, for example use the creep goal (see Section 2.3) to set έ, and then to solve the equation for Δχalloy and then use the latter to calculate the concentrations of the solutes and thus the alloy composition as described above, see Figure 15.
An alternative approach to alloy design (selection) could be to use the dependence of weight gain at 800 °C and 1200 °C on the alloy parameters VEC and Δχ (i.e., use the functions [ΔW/A]3 = f3(VEC) and [ΔW/A]1 = f1(Δχ)) and the fact that the concentration of Si in the alloy is related to each of these two parameters with functions Si = ψ1(Δχ) and Si = ψ3(VEC). The weight gain functions can thus be re-written as functions of Si concentration in the alloy, and from [ΔW/A]1 = [ΔW/A]3 the Si concentration can be calculated at each temperature. The Si concentration in the alloy is then taken as the average of the two concentrations calculated for 800 °C and 1200 °C (the difference between the two calculated Si concentrations is ≤1 at.%). The Si concentration is accepted if it is in the range required for “best” creep (16 < Si < 22 at.% [124]). The accepted Si concentration is then used to get Δχalloy and the latter to calculate the concentrations of the other solute elements, following the same procedure as described previously (see Figure 15). An example of an Nb-silicide based alloy designed using this approach is the alloy Nb-19.3Ti-18.5Si-4.3Mo-3.8Hf-3.8Sn-3.7Ge-3.3Cr-3.1Al-1.3W (at.%). We shall call this alloy B. This alloy has VECcalalloy = 4.536, δcalalloy = 9.4 and Δχcalalloy = 0.2086. The parameters of this alloy are in the ranges for Nb-silicide based alloys [46]. The calculated (predicted) weight gains for isothermal oxidation for 100 h at 800 °C and 1200 °C, respectively are 5 mg/cm2 and 39 mg/cm2 and the macrosegregation of Si is 5.1 at.%. The calculated creep rate at 1200 °C and 170 MPa does not meet the creep goal (see below).
Another approach to alloy design was to use the relationship of creep rate with the alloy parameter Δχ and write έ = g1(Δχ) as a function of weight gains at 800 °C and 1200 °C given that [ΔW/A]1,i = f1,i(Δχ) (i = 800, 1200) and then calculate the weight gains at 800 °C and 1200 °C for the creep goal. Next, from the weight gain equation, the value of Δχalloy is calculated, and the latter is subsequently used to calculate the concentrations of all solute elements, as described previously (see Figure 11).
Given that the weight gain for oxidation at a particular temperature is related to more than one of the studied parameters, as a first approximation, the calculated alloy weight gain at 800 °C or 1200 °C was taken to be the average of the values calculated using each of the three alloy parameters δ, Δχ and VEC. The weight gains calculated using each parameter at a given temperature were not significantly different from each other. The same approach was used for macrosegregation, meaning the macrosegregation of Si was the average of the values calculated using each of the parameters discussed above and in [13].
In the case of creep there can be at least an order of magnitude difference between the values calculated from the relationships with atomic size, electronegativity and valence electron concentration (VEC). For alloys that do not oxidize catastrophically in pest oxidation and at high temperatures the creep rate calculated from the relationship with VEC is higher than 10−7 s−1 and the relationships between the atomic size or electronegativity with alloy creep rate give the latter respectively lower than 10−6 and 10−7 s−1. This is attributed (a) to different contributions to creep from each parameter given that electronegativity links with all the solutes in Nb-silicide based alloys, the atomic size describes the alloying behavior of the Nbss, C14-NbCr2 Laves and A15-Nb3X phases, and electronegativity and VEC describe the alloying behavior of all phases in Nb-silicide based alloys [6,41,46,47,48], (b) to the different contributions of elements to creep (Figure 7B, Figure 8b and Figure 14), (c) to the anticipated changes in the properties (i) of Nb5Si3 silicides because of the shift of Nb5Si3 silicides in the Δχ versus VEC maps depending on solute elements substituting Nb and Si in the silicide (see [47] and Figure 7B), and (ii) of the Nbss because of changes in the composition of the solid solution (Figure 6 and Figure 7C) and (d) to changes of the elastic properties of the Nb5Si3 silicides with alloying [104].
Not the same values of the parameters δ, Δχ and VEC are calculated if one were to use the creep goal and some isothermal oxidation (weight gain) targets, say 1 mg/cm2 and 20 mg/cm2, respectively for 800 °C and 1200 °C. (Note that these targets are not the same as the oxidation goal. The latter was given as “a recession rate of less than 0.25 μm/hour at 1315 °C” [1]. This goal was derived from the requirement of achieving the oxidation life at 1315 °C that 2nd generation single crystal Ni-based superalloys presently exhibit at 1150 °C). The former oxidation target is achieved in Nb-silicide based alloys that do not pest and the latter is considered realistic and has been achieved. The alloy VEC values decrease from the creep goal to weight gain goal for oxidation at 800 and at 1200 °C, and the opposite is the case for the values of the alloy parameter δ. The alloy parameter Δχ has the highest value for the oxidation weight gain target at 800 °C and the lowest for the creep goal. This means that for the current property goals it is unlikely that an alloy could be designed where both creep and oxidation property goals can be met simultaneously. However, it is possible (i) to design (select) alloys where one of the property goals is surpassed and the other is met very closely or (ii) to design alloys where both goals are met closely. Both (i) and (ii) have been achieved in the author’s research group. It is the opinion of the author that attaining a weight gain of 1 to 4 mg/cm2, which is the weight gained by the single crystal Ni based superalloy CMSX-4 alloy after 100 h isothermal oxidation in air at 1200 °C, in polycrystalline Nb-silicide based alloys at 1200 °C is unrealistic unless the vol % of Nbss is extremely low in the latter.
In the alloy design (selection) methodology outlined in this paper, the criterion used to select an alloy for further study considering the predicted creep rate at the creep goal conditions is the following. “If the calculated creep rates from the relationships based on atomic size, electronegativity and VEC are higher than 10−7 s−1 the alloy is considered highly unlikely to meet the creep goal”, which is “the creep strength should be greater than 170 MPa at a creep rate of 2 10−8 s−1 at 1200 °C” [1]. Using this criterion, the alloys A and B (see above) were predicted not to meet the creep goal.
Each approach to alloy design (selection) that has been discussed above would give an alloy composition for which solidification path, volume fractions of phases and phase equilibria at different temperatures could be calculated, provided thermodynamic data was available. This task is not possible currently, for the reasons discussed in the introduction. Using knowledge gained from on-going research it is possible to make some informed predictions for the selected alloys. The latter and the calculated (predicted) properties can be tested experimentally. For example, the alloy A should have βNb5Si3 as its primary phase, in its microstructure tetragonal Nb5Si3 and Nbss should be stable at 1500 °C but not the C14 NbCr2 Laves and A15 intermetallic phases and the alloy should not pest. The alloy B should have βNb5Si3 as its primary phase, eutectic with Nbss and Nb5Si3 should form (see below), in its microstructure tetragonal Nb5Si3, Nbss (most likely solid solution with no Si) and A15 intermetallic should be stable at 1500 °C but not C14 NbCr2 Laves phase and the alloy should not pest.
The parameters VEC, Δχ and δ also are important for the types of bcc Nbss that form in Nb-silicide based alloys, see [6]. It is known that the solubility of Cr in bcc Nbss depends on that of Ti in the solid solution [9,40]. Relationships between solute elements in the alloy and solid solution exist, for example see Figure 16 for the relationship (R2 = 0.9231) between W in the alloy and W in the normal Nbss. There are also relationships between Δχalloy and ΔχNbss, δalloy and δNbss and VECalloy and VECNbss, for example see Figure 17 for the relationship between VECalloy and VECNbss (R2 = 0.965) Such relationships make it possible to calculate (predict) the composition of the solid solution in a designed (selected) alloy, see Figure 15. There are also relationships between the parameters of the alloy and Nb5Si3, for example Δχalloy = h(ΔχNb5Si3) with R2 = 0.9081 for alloying elements Al, B, Cr, Ge, Hf, Si, Sn, Ta, Ti, from which the ΔχNb5Si3 is calculated and the latter is then used to get concentrations of solute additions in the silicide from, say CiNb5Si3= ψi(ΔχNb5Si3), see Figure 15.
It is possible to predict the presence or not of a eutectic with Nbss and Nb5Si3 and whether it will be a rich or poor in Ti eutectic in a Nb-silicide based alloy designed using the alloy design methodology described in this paper. The parameters Δχ and VEC of the eutectics with Nbss and Nb5Si3 [41] can account for their alloying behavior and are related to the parameters Δχ and VEC of the Nb-silicide based alloys with linear relationships with R2 = 0.9325 and R2 = 0.9517, respectively (figures not shown). For an alloy selected using the methodology described in this paper, the Δχeutectic and VECeutectic will be calculated from the aforementioned relationships and Figure 5 in reference [41] could be used to find out whether a eutectic with Nbss and Nb5Si3 would form. Then Figure 4 in reference [41] would be used to predict whether the eutectic will be rich or poor in Ti. The relevant part of Figure 5 in reference [41] is reproduced in Figure 18 in the present paper. The alloy B will be used to demonstrate the above procedure. The composition of the alloy B is Nb-19.3Ti-18.5Si-4.3Mo-3.8Hf-3.8Sn-3.7Ge-3.3Cr-3.1Al-1.3W (at.%), see above. The calculated parameters for a eutectic with Nbss and Nb5Si3 in alloy B are VECeutectic = 4.602 and Δχeutectic = 0.2156. Figure 18 shows that a eutectic with Nbss and Nb5Si3 can form in this alloy (the data point is very close to the line for eutectics with the same elements as those in the alloy B (series e in Figure 5 in reference [41]). Figure 4 in reference [41] shows that in the alloy B a eutectic with Nbss and Nb5Si3 and the above Δχeutectic and VECeutectic values would be poor in Ti. Thus, the alloy B is predicted to have a poor in Ti eutectic with Nbss and Nb5Si3.
2.5. Other Relationships
The type of Nb5Si3 silicide (meaning tetragonal α and β Nb5Si3 and hexagonal γNb5Si3) that is stable in the microstructure of Nb-silicide based alloys depends on all the solute additions in the alloy and the actual concentrations of Ti and Hf in the alloy and silicide, and is critical for the creep properties of the silicide and alloy [1,2,47,111]. For example, with the addition(s) of Cr, Mo, Ta and W often the βNb5Si3 is stabilized and with the additions of Hf, Ti and Zr the hexagonal Nb5Si3 silicide can be stabilized depending on the concentration of these elements in the alloy and silicide. Hexagonal Nb5Si3 silicide is undesirable for creep [1,124]. Titanium and Hf additions also are important for oxidation. The Nb/(Ti + Hf) ratio is often used as an indicator of the structure (tetragonal or hexagonal) of the Nb5Si3 silicide. If the value of this ratio in the alloy and Nb5Si3 is less than 1 it is likely that the latter has hexagonal structure and the likelihood of the latter increases the smaller this ratio becomes. Figure 19 shows that the creep rate decreases with increasing Nb/(Ti + Hf) ratio, i.e., when tetragonal Nb5Si3 silicide(s) is(are) present in the microstructure. The MASC alloy is included in the Figure 19.
The Nb/(Ti + Hf) ratio considers only Nb and two sd elements that promote hexagonal Nb5Si3 silicide. In Nb-silicide based alloys, however, there are other TM and RM elements and simple metal and metalloid elements and Si, all of which contribute to establish, for given processing route(s), microstructure(s) with specific creep and oxidation properties (and macrosegregation of Si in the cast alloy). There exist relationships between the aforementioned and the alloy parameters VEC, Δχ and δ. A parameter that considers all the elements in the alloy is the sd/sp ratio [46]. The latter can be related to creep, like the Nb/(Ti + Hf) ratio. Figure 20 shows such a relationship for alloys with the elements indicated in the figure caption. The MASC alloy is included in this figure to demonstrate that the sd/sp ratio alone is not sufficient for alloy design (selection) and that this ratio should be used with great care.
3. Summary
The current situation vis-à-vis composition-process-microstructure-property relationships and thermodynamic data for Nb-silicide based alloys is unsatisfactory and makes it impossible to design (select) new alloys using methodologies that have been established for other alloy families. There are relationships between the alloy parameters δ, Δχ and VEC, and the concentrations of solute elements in Nb-silicide based alloys and their creep and oxidation (weight gain) properties. Such relationships were demonstrated in the paper and different approaches to design (select) new alloys using them and property goals for Nb-silicide based alloys were discussed.
Funding
This research was funded by [Engineering and Physical Sciences Research Council] grant number [EP/H500405/1, EP/L026678/1].
Acknowledgments
The support of the University of Sheffield, EU (FP6-ULTMAT project), EPSRC (GR/R09367, GR/S81759) and Rolls Royce plc and discussions with all the members (current and past) of the research group and with partners in the ULTMAT project about creep tests and data are gratefully acknowledged.
Conflicts of Interest
The author declares no conflict of interest.
References
- Bewlay, B.P.; Jackson, M.R.; Gigliotti, M.F.X. Niobium silicide high temperature in situ composites. In Intermetallic Compounds: Principles and Practice; Fleischer, R.L., Westbrook, J.H., Eds.; John Wiley: New York, NY, USA, 2001; Volume 3. [Google Scholar]
- Balsone, S.J.; Bewlay, B.P.; Jackson, M.R.; Subramanian, P.R.; Zhao, J.C.; Chatterjee, A.; Heffernan, T.M. Materials beyond superalloys—Exploiting high-temperature composites. In Structural Intermetallics 2001; Hemker, K.J., Dimiduk, D.M., Clemens, H., Darolia, R., Inui, M., Larsen, J.M., Sikka, V.K., Thomas, W.J.D., Eds.; TMS: Warrendale, PA, USA, 2001. [Google Scholar]
- Boesch, W.J.; Slaney, J.S. Preventing sigma phase embrittlement in nickel base superalloys. Metal Prog. 1964, 86, 109–111. [Google Scholar]
- Jones, J.; MacKay, D.J.C. Neural network modelling of the mechanical properties of nickel base superalloys. In 8th International Symposium on Superalloys; Kissinger, R.D., Deye, D.J., Anton, D.L., Cetel, A.D., Nathal, M.V., Pollock, T.M., Woodford, D.A., Eds.; TMS: Seven Springs, PA, USA, 1996. [Google Scholar]
- Vellios, N.; Tsakiropoulos, P. Study of the role of Fe and Sn additions in the microstructure of Nb-24Ti-18Si-5Cr silicide base alloys. Intermetallics 2010, 18, 1729–1736. [Google Scholar] [CrossRef]
- Tsakiropoulos, P. On the Nb silicide based alloys: Part I—The bcc Nb solid solution. J. Alloys Compd. 2017, 708, 961–971. [Google Scholar] [CrossRef]
- Zelenitsas, K.; Tsakiropoulos, P. Study of the role of Ta and Cr additions in the microstructure of Nb-Ti-Si-Al in situ composites. Intermetallics 2006, 14, 639–659. [Google Scholar] [CrossRef]
- Vellios, N.; Tsakiropoulos, P. The role of Sn and Ti additions in the microstructure of Nb-18Si based alloys. Intermetallics 2007, 15, 1518–1528. [Google Scholar] [CrossRef]
- Zelenitsas, K.; Tsakiropoulos, P. Study of the role of Al and Cr additions in the microstructure of Nb-Ti-Si in situ composites. Intermetallics 2005, 13, 1079–1095. [Google Scholar] [CrossRef]
- Grammenos, I.; Tsakiropoulos, P. Study of the role of Mo, Hf and W additions in the microstructure of Nb-20Si silicide based alloys. Intermetallics 2011, 19, 1612–1621. [Google Scholar] [CrossRef]
- Li, Z.; Tsakiropoulos, P. Study of the effect of Cr and Ti additions in the microstructure of Nb-18Si-5Ge based in situ composites. Intermetallics 2012, 26, 18–25. [Google Scholar] [CrossRef]
- Tian, Y.; Cheng, G.; Guo, J.; Zhou, L.; He, L.; Ye, H. Microstructure and mechanical properties of directionally solidified Nb-22Ti-16Si-7Cr-3Al-3Ta-2Hf-0.1Ho alloy. Adv. Eng. Mater. 2007, 9, 963–966. [Google Scholar] [CrossRef]
- Tsakiropoulos, P. On the macrosegregation of silicon in niobium silicide based alloys. Intermetallics 2014, 55, 95–101. [Google Scholar] [CrossRef]
- Zelenitsas, K.; Tsakiropoulos, P. Effect of Al, Cr and ta additions on the oxidation behaviour of Nb-Ti-Si in situ composites at 800 °C. Mater. Sci. Eng. 2006, A416, 269–280. [Google Scholar] [CrossRef]
- Geng, J.; Tsakiropoulos, P.; Shao, G. Oxidation of Nb-Si-Cr-Al in situ composites with Mo, Ti and Hf additions. Mater. Sci. Eng. 2006, A441, 26–38. [Google Scholar] [CrossRef]
- Chan, K.S. Modelling creep behaviour of niobium silicide in-situ composites. Mater. Sci. Eng. 2002, A337, 59–66. [Google Scholar] [CrossRef]
- Henshall, G.A.; Subramanian, P.R.; Strum, M.J.; Mendiratta, M.G. Continuum predictions of deformation in composites with two creping phases—II: Nb5Si3/Nb composites. Acta Mater. 1997, 45, 3135–3142. [Google Scholar] [CrossRef]
- Meschel, S.V.; Kleppa, O.J. Standard enthalpies of formation of some 4d transition metal silicides by high temperature direct synthesis calorimetry. J. Alloys Compd. 1998, 274, 193–200. [Google Scholar] [CrossRef]
- Okamoto, H. Phase Diagrams for Binary Alloys: Desk Handbook; ASM International: Metals Park, OH, USA, 2000. [Google Scholar]
- Liang, H.; Chang, Y.A. Thermodynamic modelling of the Nb-Si-Ti ternary system. Intermetallics 1999, 7, 561–570. [Google Scholar] [CrossRef]
- Okamoto, H.; Gokhale, A.B.; Abbaschian, R. Nb-Si (niobium-silicon) in T B Massalski (ed) Binary Phase Diagrams, 2nd ed.; ASM International: Metals Park, OH, USA, 1990. [Google Scholar]
- Shao, G. Thermodynamic assessment of the Nb-Si-Al system. Intermetallics 2004, 12, 655–664. [Google Scholar] [CrossRef]
- Fernandes, P.B.; Coelhoa, G.C.; Ferreira, F.; Nunes, C.A.; Sundman, B. Thermodynamic modelling of the Nb-Si system. Intermetallics 2002, 10, 993–999. [Google Scholar] [CrossRef]
- Murray, J. Phase Diagrams of Binary Alloys; ASM International: Metals Park, OH, USA, 1987. [Google Scholar]
- Roy, S.; Divinski, S.V.; Paul, A. Reactive diffusion in the Ti-Si system and the significance of the parabolic growth constant. Philos. Mag. 2014, 94, 683–699. [Google Scholar] [CrossRef]
- Subramanian, P.R.; Mendiratta, M.G.; Dimiduk, D.M. Microstructures and mechanical behaviour of Nb-Ti base beta + silicide alloys. Mat. Res. Soc. Symp. Proc. 1994, 322, 491–502. [Google Scholar] [CrossRef]
- Yang, Y.; Bewlay, B.P.; Chang, Y.A. Liquid—Solid phase equilibria in metal-rich Nb-Ti-Hf-Si alloys. J. Phase Equilibria Diffus. 2007, 28, 107–114. [Google Scholar] [CrossRef]
- Geng, T.; Li, C.; Bao, J.; Zhao, X.; Du, Z.; Guo, C. Thermodynamic assessment of the Nb-Si-Ti system. Intermetallics 2009, 17, 343–357. [Google Scholar] [CrossRef]
- Bulanova, M.; Fartushna, I. Niobium-silicon-titanium. In Landolt-Börnstein New Series IV/11E3; Springer: Heidelberg, Germany, 2010. [Google Scholar]
- Li, Y.; Li, C.; Du, Z.; Guo, C.; Zhao, X. As cast microstructures and solidification paths of the Nb-Si-Ti ternary alloys in Nb5Si3-Ti5Si3 region. Rare Met. 2013, 32, 502–511. [Google Scholar] [CrossRef]
- Bewlay, B.P.; Yang, Y.; Casey, R.L.; Jackson, M.R.; Chang, Y.A. Experimental study of the liquid-solid phase equilibria at the metal rich region of the Nb-Cr-Si system. Intermetallics 2009, 17, 120–127. [Google Scholar] [CrossRef]
- Yang, Y.; Chang, Y.A. Thermodynamic modelling of Nb–Cr–Si system. Intermetallics 2005, 13, 69–78. [Google Scholar] [CrossRef]
- Goldschmidt, H.J.; Brand, J.A. The constitution of the niobium-chromium-silicon system. J. Less Common Met. 1961, 3, 34–43. [Google Scholar] [CrossRef]
- Zhao, J.C.; Jackson, M.R.; Peluso, L.A. Determination of the Nb-Cr-Si phase diagram using diffusion multiples. Acta Mater. 2003, 51, 6395–6405. [Google Scholar] [CrossRef]
- Geng, J.; Shao, G.; Tsakiropoulos, P. Study of three phase equilibrium in the Nb rich corner of Nb-Si-Cr system. Intermetallics 2006, 14, 832–837. [Google Scholar] [CrossRef]
- ASM. Alloy Phase Diagram Database; Villars, P., Okamoto, H., Cenzual, K., Eds.; ASM: Zurich, Switzerland, 2016. [Google Scholar]
- Stein, F.; Palm, M.; Sauthoff, G. Structure and stability of Laves phases part II—Structure type variations in binary and ternary systems. Intermetallics 2005, 13, 1056–1074. [Google Scholar] [CrossRef]
- Argent, B.B.; Phelps, B. The oxidation of Niobium-titanium and Niobium-molybdenum alloys. J. Less Common Met. 1960, 2, 181–190. [Google Scholar] [CrossRef]
- Thandorn, T.; Tsakiropoulos, P. Study of the role of b addition on the microstructure of the Nb-24Ti-18Si-8B alloy. Intermetallics 2010, 18, 1033–1038. [Google Scholar] [CrossRef]
- Tsakiropoulos, P.; Zelenitsas, K.; Vellios, N. Study of the effect of Al, Cr and Sn additions on the microstructure and properties of Nb silicide based alloys. Mater. Res. Soc. Symp. Proc. 2011, 1295. [Google Scholar] [CrossRef]
- Tsakiropoulos, P. Alloying and hardness of eutectics with Nbss and Nb5Si3 in Nb-silicide based alloys. Materials 2108, 11, 592. [Google Scholar] [CrossRef] [PubMed]
- Utton, C.A.; Papadimitriou, I.; Kinoshita, H.; Tsakiropoulos, P. Experimental and thermodynamic assessment of the Ge-Nb-Si ternary phase diagram. J. Alloys Compd. 2017, 717, 303–316. [Google Scholar] [CrossRef]
- Gigolotti, J.C.J.; Coelho, G.C.; Nunes, C.A.; Suzuki, P.A.; Joubert, J.-M. Experimental evaluation of the Nb-Si-Ti system from as-cast alloys. Intermetallics 2017, 82, 76–92. [Google Scholar] [CrossRef]
- Lafaye, P.; Toffolon-Masclet, C.; Crivello, J.; Joubert, J. CALPHAD: Computer coupling of phase diagrams and thermochemistry. PubMed J. 2017, 57, 37–45. [Google Scholar]
- Gao, M.C.; Zhang, C.; Gao, P.; Zhang, F.; Ouyang, L.Z.; Widom, M.; Hawk, J.A. Thermodynamics of concentrated solid solution alloys. Curr. Opin. Solid State Mater. Sci. 2017, 21, 238–251. [Google Scholar] [CrossRef]
- Tsakiropoulos, P. On Nb silicide based alloys, Part II. J. Alloys Compd. 2018, 748, 569–576. [Google Scholar] [CrossRef]
- Tsakiropoulos, P. On the alloying and properties of tetragonal Nb5Si3 in Nb-silicide based alloys. Materials 2018, 11, 69. [Google Scholar] [CrossRef] [PubMed]
- Tsakiropoulos, P. Alloying and properties of C14-NbCr2 and A15-Nb3X (X = Al, Ge, Si, Sn) in Nb-silicide based alloys. Materials 2018, 11, 395. [Google Scholar] [CrossRef] [PubMed]
- Ang, G.J. Activattion energies and diffusion coefficients of oxygen and nitrogen in niobium and trantalum. Acta Metall. 1953, 1, 123–129. [Google Scholar] [CrossRef]
- Kelly, K.K. Contributions to the data on theoretical metallurgy. Bull. Bur. Mines 1949, 476, 22–29. [Google Scholar]
- Ghosh, G.; Olson, G.B. Integrated design of Nb-based superalloys: Ab initio calculations, computational thermodynamics and kinetics and experimental results. Acta Mater. 2007, 55, 3281–3303. [Google Scholar] [CrossRef]
- Wagner, C. Theoretical analysis of the diffusion processes determining the oxidation rate of alloys. J. Electrochem. Soc. 1952, 99, 369–380. [Google Scholar] [CrossRef]
- Hume-Rothery, W.; Mabbott, G.W.; Channel-Evans, K.M. The freezing points, melting points and solid solubility limits of the alloys of silver and copper with the elements of the B sub-groups. Philos. Trans. R. Soc. Lond. Ser. A 1934, 233, 1–97. [Google Scholar] [CrossRef]
- Bryant, R.T. The solubility of oxygen in transition metal alloys. J. Less Common Met. 1962, 4, 62–68. [Google Scholar] [CrossRef]
- Taylor, A.; Doyle, N.J. The solid solubility of oxygen in Nb and Nb-rich Nb-Hf, Nb-Mo and Nb-W alloys: Part II. The ternary systems Nb-Mo-O and Nb-W-O. J. Less Common Met. 1967, 13, 338–351. [Google Scholar] [CrossRef]
- Mizutani, U. Hume-Rothery Rules for Structurally Complex Alloy Phases; CRS Press: Boca Raton, FL, USA, 2011. [Google Scholar]
- Liu, S.; Shang, J.; Wang, F.; Liu, S.; Zhang, Y.; Li, D.; Shields, D.; Xue, W.; Liu, Y.; Dang, H.; et al. Oxidation of the two phase Nb/Nb5Si3 composite: The role of energetics, thermodynamics, segregation and interfaces. J. Chem. Phys. 2013, 138. [Google Scholar] [CrossRef] [PubMed]
- Liu, S.; Liu, S.; Li, D.; Wang, S.; Guo, J.; Shen, Y. Ab initio atomistic thermodynamics study on the oxidation mechanism of binary and ternary alloy surfaces. J. Chem. Phys. 2015, 142. [Google Scholar] [CrossRef] [PubMed]
- Xu, Z.; Tsakiropoulos, P. Role of Sn in the microstructure of Nb-silicide based alloys. University of Sheffield: Sheffield, UK, Unpublished research. 2015. [Google Scholar]
- Sheasby, J.S.; Cox, B. Oxygen diffusion in alpha niobium pentoxide. J. Less Common Met. 1968, 15, 129–135. [Google Scholar] [CrossRef]
- Andersson, J.; Collen, B.; Kuylenstierna, U.; Magneli, A. Phase analysis studies in the titanium-oxygen system. Acta Chem. Scand. 1957, 11, 1641–1652. [Google Scholar] [CrossRef]
- Coutures, J.P.; Coutures, J. The system HfO2-TiO2. J. Am. Ceram. Soc. 1987, 70, 383–387. [Google Scholar] [CrossRef]
- Waring, J.L.; Roth, R.S. Effect of oxide additions on the polymorphism of tantalum pentoxide (system Ta2O5-TiO2). J. Res. Nat. Bur. Stand. 1968, 72A, 175–186. [Google Scholar] [CrossRef]
- Anton, D.L.; Shah, D.M. High temperature evaluation of topologically close packed intermetallics. Mater. Sci. Eng. 1992, A153, 410–415. [Google Scholar] [CrossRef]
- Marinder, B.O.; Magneli, A. Rutile type phases in some systems of mixed transition metal dioxides. Acta Chem. Stand. 1985, 12, 1345–1347. [Google Scholar] [CrossRef]
- Roth, R.S.; Coughanour, L.W. Phase equilibrium relations in the systems titania-niobia and zirconia-niobia. J. Res. Nat. Bur. Stand. 1955, 55, 209–213. [Google Scholar] [CrossRef]
- Wadsley, A.D. Mixed oxides of titanium and niobium. I. Acta Crystallogr. 1961, 14, 660–664. [Google Scholar] [CrossRef]
- Wadsley, A.D. Mixed oxides of titanium and niobium II: The crystal structures of the dimorphic forms Ti2Nb10O29. Acta Crystallogr. 1961, 14, 664–670. [Google Scholar] [CrossRef]
- von Dreele, R.B.; Cheetham, A.K. The structure of some titanium-niobium oxides by powder neutron diffraction. Proc. R. Soc. Lond. Sect. A 1974, 338, 311–326. [Google Scholar] [CrossRef]
- Roth, R.S.; Waring, J.L. Phase equilibria as related to crystal structure in the system niobium pentoxide-tungsten trioxide. J. Res. Nat. Bur. Stand. 1966, 70A, 281–303. [Google Scholar] [CrossRef]
- Casais, M.; Gutierrez-Puebla, E.; Monge, M.A.; Rasines, I.; Ruiz-Valero, C. VM9O25 (M = Nb, Ta) a combination of tetrahedral VO4 and octahedral MO6 units. J. Solid State Chem. 1993, 102, 261–266. [Google Scholar] [CrossRef]
- Dobal, P.S.; Katyar, R.S. Micro-Raman scattering and X-ray diffraction studies of (Ta2O5)1−x(TiO2)x ceramics. J. Appl. Phys. 2000, 87, 8688–8694. [Google Scholar] [CrossRef]
- Sawada, H.; Kawakami, K. Electronic structure of oxygen vacancy in Ta2O5. J. Appl. Phys. 1999, 86, 956–959. [Google Scholar] [CrossRef]
- Makovec, D.; Zuo, J.M.; Twesten, R.; Payne, D.A. A high temperature structure for Ta2O5 with modulations of TiO2 substitution. J. Solid State Chem. 2006, 179, 1782–1791. [Google Scholar] [CrossRef]
- Marschall, H.R.; Dohmen, R.; Ludwig, T. Diffusion induced fractionation of niobium and tantalum during continental crust formation. Earth Planet. Sci. Lett. 2013, 375, 361–371. [Google Scholar] [CrossRef]
- Li, Y.; Langdon, T.G. Fundamental aspects of creep in metal matrix composites. Metall. Mater. Trans. A 1999, 30A, 315–324. [Google Scholar] [CrossRef]
- Begley, R.T.; Harod, D.L.; Gold, R.E. High Temperature Creep and Fracture Behaviour of the Refractory Metals, in Refractory Metals and Alloys: Metallurgy and Technology; Machlin, I., Begley, R.T., Weisert, E.D., Eds.; Plenum Press: New York, NY, USA, 1968. [Google Scholar]
- Shah, D.M.; Anton, D.L. Evaluation of refractory intermetallics with A15 structure for high temperature structural applications. Mater. Sci. Eng. 1992, A153, 402–409. [Google Scholar] [CrossRef]
- Barth, E.P.; Tien, J.K.; Uejo, S.; Kambara, S. High temperature strength of niobium aluminide intermetallics. Mater. Sci. Eng. 1992, A153, 398–401. [Google Scholar] [CrossRef]
- Es-Souni, M.; Wagner, R.; Beavan, P.A. Creep behaviour of dual-phase intermetallics based on (Ti,Nb)3(Al,Si) and (Ti,Nb)5(Si,Al)3. Mater. Sci. Eng. 1992, A153, 444–450. [Google Scholar] [CrossRef]
- Geng, J.; Tsakiropoulos, P. A study of the microstructures and oxidation of Nb-Si-Cr-Al-Mo in situ composites alloyed with Ti, Hf and Sn. Intermetallics 2007, 15, 382–395. [Google Scholar] [CrossRef]
- Li, Z.; Tsakiropoulos, P. The microstructures of Nb-18Si-5Ge-5Al and Nb-24Ti-18Si-5Ge-5Al in situ composites. J. Alloys Compd. 2013, 550, 553–560. [Google Scholar] [CrossRef]
- Steinhardt, H.; Haasen, P. Creep and dislocation velocities in gallium arsenide. Phys. Status Solidi 1978, 49, 93–101. [Google Scholar] [CrossRef]
- Li, J.C.M. Kinetics and dynamics in dislocation plasticity. In Dislocation Dynamics; Rosenfield, A.R., Hahn, G.T., Bement, A.L., Jaffe, R.I., Eds.; McGraw Hill: New York, NY, USA, 1968. [Google Scholar]
- Bonneville, J.; Escaig, B.; Martin, J.L. A study of cross-slip activation parameters in pure copper. Acta Metall. 1988, 36, 1989–2002. [Google Scholar] [CrossRef]
- Pandey, K.K.M.; Prakash, O.; Bhattacharya, B. Variation of activation volume with temperature for Fe, Si and Ge. Mater. Lett. 2003, 57, 4319–4322. [Google Scholar] [CrossRef]
- Gilman, J.J. Why silicon is hard. Science 1993, 261, 1436–1439. [Google Scholar] [CrossRef] [PubMed]
- Weinberger, C.R.; Boyce, B.L.; Battaile, C.C. Slip planes in bcc transition metals. Int. Mater. Rev. 2013, 58, 296–314. [Google Scholar] [CrossRef]
- Bulatov, V.V.; Justo, J.F.; Cai, W.; Yip, S. Kink asymmetry and multiplicity in dislocation cores. Phys. Rev. Lett. 1997, 79, 5042–5045. [Google Scholar] [CrossRef]
- Lin, Y.-S.; Vitek, V. Core structure of ½<111> screw dislocations in refractory bcc high entropy alloys. In Proceedings of the TMS Annual Meeting, Phoenix, AZ, USA, 11–15 March 2018. [Google Scholar]
- Pizzagalli, L.; Pedersen, A.; Arnaldsson, A.; Jonsson, H.; Beauchamp, P. Theoretical study of kinks on screw dislocations in silicon. Phys. Rev. B 2008, 77. [Google Scholar] [CrossRef]
- Gilman, J.J.; Cumberland, R.W.; Kaner, R.B. Design of hard crystals. Int. J. Refract. Met. Hard Met. 2006, 24, 1–5. [Google Scholar] [CrossRef]
- Lau, K.; NcCurdy, A.K. Elastic anisotropy factors for orthorhombic, tetragonal and hexagonal crystals. Phys. Rev. B 1998, 58, 8980–8984. [Google Scholar] [CrossRef]
- Papadimitriou, I.; Utton, C.; Tsakiropoulos, P. Ab initio investigation of the Nb-Al system. Comput. Mater. Sci. 2015, 107, 116–121. [Google Scholar] [CrossRef]
- The Materials Project. Available online: https://materialsproject.org/ (accessed on 5 March 2018).
- Hu, Y.; Shang, S.; Wang, Y.; Darling, K.A.; Butler, B.G.; Kecskes, L.J.; Liu, Z. Effects of alloying elements and temperature on the elastic properties of W-based alloys by first-principles calculations. J Alloys Compd. 2016, 671, 267–275. [Google Scholar] [CrossRef]
- Papadimitriou, I.; Utton, C.; Tsakiropoulos, P. On the Nb-Ge binary system. Metall. Mater. Trans. 2015, 46, 5526–5536. [Google Scholar] [CrossRef]
- Chen, Y.; Hammerschmidt, T.; Pettifor, D.G.; Shang, J.; Zhang, Y. Influence of vibrational entropy on structural stability of Nb-Si and Mo-Si systems at elevated temperatures. Acta Mater. 2009, 57, 2657–2664. [Google Scholar] [CrossRef]
- Papadimitriou, I.; Utton, C.; Scott, A.; Tsakiropoulos, P. Ab initio study of the intermetallics in the Nb-Si binary system. Intermetallics 2014, 54, 125–132. [Google Scholar] [CrossRef]
- Tao, X.; Jund, P.; Colinet, C.; Tedenac, J. Phase stability and physical properties of Ta5Si3 compounds from first-principles calculations. Phys. Rev. B 2009, 80. [Google Scholar] [CrossRef]
- Bonny, C.; Bakaev, A.; Terentyev, D.; Mastrinkov, Y.A. Elastic properties of the sigma W-Re phase: A first-principles investigation. Scr. Mater. 2107, 128, 45–48. [Google Scholar] [CrossRef]
- Tromans, D. Elastic anisotropy of hcp metal crystals and polycrystals. Int. J. Recent Res. Appl. Stud. 2011, 6, 462–483. [Google Scholar]
- Available online: https://materialsproject.org/materials/mp-7506/ (accessed on 5 March 2018).
- Papadimitriou, I.; Utton, C.; Tsakiropoulos, P. The impact of Ti and temperature on the stability of Nb5Si3 phases: A first-principles study. Sci. Technol. Adv. Mater. 2017, 18, 467–479. [Google Scholar] [CrossRef] [PubMed]
- Tao, X.; Chen, H.; Tong, X.; Ouyang, Y.; Jund, P.; Tedenac, J. Structural, electronic and elastic properties of V5Si3 phases from first-principles calculations. Comput. Mater. Sci. 2012, 53, 169–174. [Google Scholar] [CrossRef]
- Papadimitriou, I.; Utton, C.; Tsakiropoulos, P. Ab initio investigation of the intermetallics in the Nb-Sn binary system. Acta Mater. 2105, 86, 23–33. [Google Scholar] [CrossRef]
- Papadimitriou, I.; Utton, C.; Scott, A.; Tsakiropoulos, P. Ab initio study of binary and ternary Nb3(X,Y) A15 intermetallic phases (X, Y = Al, Ge, Si, Sn). Metall. Mater. Trans. 2105, 46, 566–576. [Google Scholar] [CrossRef]
- Chan, K.S. Alloying effects on fracture mechanisms in Nb-based intermetallic in-situ composites. Mater. Sci. Eng. 2002, A329–A331, 513–522. [Google Scholar] [CrossRef]
- Zhao, J.; Tsakiropoulos, P. Refractory Metals in Nb-Silicide Based Alloys. University of Sheffield: Sheffield, UK, Unpublished research. 2016. [Google Scholar]
- Subramanian, P.R.; Parthasarathy, T.A.; Mendiratta, M.G.; Dimiduk, D.M. Compressive creep behaviour of Nb5Si3. Scr. Met. Mater. 1995, 32, 1227–1232. [Google Scholar] [CrossRef]
- Bewlay, B.P.; Braint, C.L.; Sylven, E.T.; Jackson, M.R.; Xiao, G. Creep studies of monolithic phases in Nb-silicide based in-situ composites. Mater Res. Soc. Symp. Proc. 2001, 646. [Google Scholar] [CrossRef]
- Bewlay, B.P.; Briant, C.L.; Davis, A.W.; Jackson, M.R. The effect of silicide volume fraction on the creep behaviour of Nb-silicide based in-situ composites. Mater Res. Soc. Symp. Proc. 2001, 646. [Google Scholar] [CrossRef]
- Wadsworth, J.; Dougherty, S.E.; Kramer, P.A.; Nieh, T.G. Evidence for dislocation glide controlled creep in Nb-base alloys. Scr. Met. Mater. 1992, 27, 71–76. [Google Scholar] [CrossRef]
- Wadsworth, J.; Roberts, C.A.; Rennhack, E.H. Creep behaviour of hot isostatically pressed niobium alloy powder compacts. J. Mater. Sci. 1982, 17, 2539–2546. [Google Scholar] [CrossRef]
- Begley, R.T. Columbium Alloy Development at Westinghouse, in Evolution of Refractory Metals and Alloys; Dalder, E.N.C., Grobstein, T., Olsen, C.S., Eds.; TMS: Warrendale, PA, USA, 1994. [Google Scholar]
- Zelenitsas, K. Study of Niobium Silicide Based Alloys for Operational Temperatures beyond 1150 °C. Ph.D. Thesis, University of Surrey, Surrey, UK, 2005. [Google Scholar]
- Geng, J. Development of Nbss/Nb5Si3 Based in Situ Composites. Ph.D. Thesis, University of Surrey, Surrey, UK, 2006. [Google Scholar]
- Thandorn, T.; Tsakiropoulos, P. Role o B additions on the oxidation of Nb silicide based alloys. University of Sheffield: Sheffield, UK, Unpublished research. 2008. [Google Scholar]
- Li, Z.; Tsakiropoulos, P. Oxidation of Nb-silicide based alloys with Ge additions. University of Sheffield: Sheffield, UK, Unpublished research. 2010. [Google Scholar]
- Nelson, J. Study of the Effects of Cr, Hf and Sn with Refractory Metal Additions on the Microstructure and Properties of Nb-silicide Based Alloys. Ph.D. Thesis, University of Sheffield, Sheffield, UK, 2015. [Google Scholar]
- Ghadyani, M.H. Study of the Microstructure and Oxidation of Alloys of the Al-Hf-Nb-Si-Ti System. Ph.D. Thesis, University of Sheffield, Sheffield, UK, 2017. [Google Scholar]
- Drawin, S.; Heilmaier, M.; Jehanno, P.; Hu, D.; Belaygue, P.; Tsakiropoulos, P.; Vilasi, M. Creep and oxidation resistance of refractory metal silicide based materials. In Proceedings of the 17th International Plansee Seminar on High Performance P/M Materials, Reutte, Austria, 25–29 May 2009. [Google Scholar]
- Tsakiropoulos, P. Encyclopaedia of Aerospace Engineering; Blockley, R., Syy, W., Eds.; John Wiley & Sons, Ltd.: Hoboken, NJ, USA, 2010. [Google Scholar]
- Jackson, M.R.; Bewlay, B.P.; Briant, C.L. Creep Resistant Nb-Silicide Based Two-Phase Composites. U.S. Patent 6,447,623,B1, 10 September 2002. [Google Scholar]
Figure 1.
Plots of 3C44[C11-C12]/(4C44 + [C11-C12]) versus (a) VEC; (b) χI and (c) ri for cubic metals in Nb-silicide based alloys.
Figure 1.
Plots of 3C44[C11-C12]/(4C44 + [C11-C12]) versus (a) VEC; (b) χI and (c) ri for cubic metals in Nb-silicide based alloys.

Figure 2.
Plots of [C11-C12]/[2B] versus (a) VEC; (b) χI and (c) ri for cubic metals in Nb-silicide based alloys.
Figure 2.
Plots of [C11-C12]/[2B] versus (a) VEC; (b) χI and (c) ri for cubic metals in Nb-silicide based alloys.

Figure 3.
Plots of 2C44/(C11-C12) for (a) cubic and hexagonal metals; (b) 5-3 silicides with W5Si3 prototype; (c) 5-3 silicides with Cr5B3 prototype and (d) A15 compounds. Red color data points are for alloyed (Nb,Ti)5Si3, see text. In (b,c) the red arrows point from low to high Ti concentration in (Nb,Ti)5Si3, i.e., from 3.125 to 12.5 at.% Ti.

Figure 4.
Plots of G/B versus ri for (a) A15-Nb3X compounds and (d) 5-3 silicides with Cr5B3 prototype and G/B versus Δχ for (b) 5-3 silicides with W5Si3 prototype and (c) 5-3 silicides with Cr5B3 prototype. Red color data points are for (Nb,Ti)5Si3, see text. In (b–d) the red arrows point from low to high Ti concentration in (Nb,Ti)5Si3, i.e., from 3.125 to 12.5 at.% Ti.

Figure 5.
Maps of Δχ (ordinate) versus (abscissa) valence electron concentration (VEC) (a) of Nbss (blue triangles), Nb5Si3 (green diamonds), C14-NbCr2 Laves (red diamonds) and A15-Nb3X (purple diamonds) phases where Boron containing Nbss and Nb5Si3 are shown in light blue and light green and (b) of Nbss (blue triangles), Nb5Si3 (green diamonds), eutectics with Nbss and Nb5Si3 (orange circles), C14-NbCr2 Laves (red diamonds) and A15-Nb3X (purple diamonds) phases.

Figure 6.
Maps of Δχ (ordinate) versus (abscissa) VEC for the Nbss, (A) data for all solid solutions and (B) data for Nbss with no Si and Nbss rich in Ti (see [6]). In (B) the series 2 data are for the Nbss rich in Ti and the series 3 is for the Nbss with no Si, see text. For the gap in Δχ values see [6]. See Figure 7C and text for the alloys represented by a, b, c and d in (B).

Figure 7.
Norton plots for 1200 °C creep rate (s−1) (ordinate) versus (abscissa) stress (MPa), (A) for all types of phases in Nb silicide-based alloys namely unalloyed and alloyed Nb5Si3, NbCr2 Laves, Nb solid solution and Nb3Al (for 18 at.% Al); (B) for the 5-3 silicide and (C) for the bcc Nb solid solution. In (B) the data is for tetragonal 5-3 silicide where (a) αNb5Si3 [110], (b) αNb5Si3 [111], (c) (Nb,Ti)5Si3, (d) (Nb,Ti,Cr,Hf)5(Si,Al,B)3 and (e) (Nb,Ti,Cr,Hf)5(Si,Al,B)3 [111]. In (C) data for (a) Nb-1Si [108], (b) Nb-46Ti-1Si [112] (c) Nb-27Ti-5Hf-2Al-2Cr-0.9Si [112] (d) Nb-5.4Hf-2Ti for Q = 316 kJ/mol, see text and (e) Nb-5.4Hf-2Ti for Q = 374 kJ/mol, see text. The alloys in (C) are shown in Figure 2b.

Figure 8.
Young’s modulus (ordinate) E (GPa) of solute elements in Nb versus (abscissa) their atomic radius ri (a) and Pauling electronegativity χi (b). In (a) elements in series a: Hf, Mo, Nb, Ti, W, in series b: Cr, Hf, Nb, Sn, Ti, in series c: Al, B, Ge, Nb, Si, Sn. In (b) elements in series a: Al, Hf, Mo, Sn, W, in series b: Al, Ge, Hf, Mo, W, in series c: Al, B, Cr, Hf, Nb, Ti, W.


Figure 9.
Weight-gain ΔW/A (g/cm2) (ordinate) at 800 °C versus (abscissa) the alloy parameter VEC for the elements Al, Cr, Ge, Hf, Mo, Nb, Si, Sn, Ta, Ti, W in Nb-silicide based alloys.
Figure 9.
Weight-gain ΔW/A (g/cm2) (ordinate) at 800 °C versus (abscissa) the alloy parameter VEC for the elements Al, Cr, Ge, Hf, Mo, Nb, Si, Sn, Ta, Ti, W in Nb-silicide based alloys.

Figure 10.
Creep rate (s−1) (ordinate) at 1050 °C and 100 MPa versus (abscissa) (a) VEC; (b) δ and (c) Δχ of Nb-silicide based alloys with Al, Cr, Hf, Mo, Si, Ti, W. In (a) the concentrations of Al, Si and Ti were different between the series a (R2 = 0.9755) and series b (R2 = 0.9187) alloys. In (b) the series a (R2 = 0.8699) and series b (R2 = 0.9243) alloys had different concentrations of Al and Ti. MASC alloy data is shown by green diamonds.

Figure 11.
Macrosegregation of Si (MACSi, at.%) (ordinate) in Nb-silicide based alloys versus (abscissa) the ΔHmsd, see [12].
Figure 11.
Macrosegregation of Si (MACSi, at.%) (ordinate) in Nb-silicide based alloys versus (abscissa) the ΔHmsd, see [12].

Figure 12.
(a) (ordinate) Hf concentration (at.%) in alloy versus (abscissa) the alloy parameter Δχ for the elements Al, B, Cr, Ge, Hf, Mo, Nb, Si, Sn, Ta, Ti, W in Nb-silicide based alloys; (b) (ordinate) W concentration (at.%) in alloy versus (abscissa) the alloy parameter VEC for the elements Al, Cr, Ge, Hf, Mo, Nb, Si, Sn, Ti, W in Nb-silicide based alloys.

Figure 13.
(Ordinate) ([ΔW/A]/at.%)i/([ΔW/A]/at.%)Nb at 1200 °C versus (abscissa) atomic radius ri (Å) (a) and VECi of element I (b). In (a) elements in series a: Hf, Mo, Nb, Ti, W, in series b: Al, Hf, Mo, Nb, Sn, Ti, W, in series c: Al, B, Cr, Ge, Hf, Sn, in series d: B, Mo, Nb, Si, Ti and in (b) elements in series a: Hf, Mo, Nb, Ti, W, in series b: Al, Ge, Hf, Nb, Sn, W, in series c: B, Cr, Hf, Ti, in series d: B, Mo, Nb, Ti and in series e: Al, B, Si, W.


Figure 14.
(Ordinate) [lnέ/at.%]i/[lnέ/at.%]Nb at 1200 °C and 170 MPa (ordinate) versus (abscissa) Pauling electronegativity χi of element i. Elements in series a: B, Ge, Mo, Nb, Sn, W, in series b: Al, B, Hf, Si, Ti, in series c: Al, B, Cr, Hf, Mo, Sn, Ti, W.
Figure 14.
(Ordinate) [lnέ/at.%]i/[lnέ/at.%]Nb at 1200 °C and 170 MPa (ordinate) versus (abscissa) Pauling electronegativity χi of element i. Elements in series a: B, Ge, Mo, Nb, Sn, W, in series b: Al, B, Hf, Si, Ti, in series c: Al, B, Cr, Hf, Mo, Sn, Ti, W.

Figure 15.
Schematic diagram of Niobium Intermetallic Composite Elaboration (NICE) alloy design(selection) methodology (* see text, + see [6]).
Figure 15.
Schematic diagram of Niobium Intermetallic Composite Elaboration (NICE) alloy design(selection) methodology (* see text, + see [6]).

Figure 16.
W in alloy (ordinate) versus (abscissa) W in normal Nbss. Data for Nb-silicide based alloys with Al, Cr, Ge, Hf, Mo, Nb, Si, Sn, Ta, Ti, W.
Figure 16.
W in alloy (ordinate) versus (abscissa) W in normal Nbss. Data for Nb-silicide based alloys with Al, Cr, Ge, Hf, Mo, Nb, Si, Sn, Ta, Ti, W.

Figure 17.
Relationship between VECNbss and VECalloy. Data for Nb-silicide based alloys with Al, Cr, Ge, Hf, Mo, Si, Sn, Ta, Ti, W.
Figure 17.
Relationship between VECNbss and VECalloy. Data for Nb-silicide based alloys with Al, Cr, Ge, Hf, Mo, Si, Sn, Ta, Ti, W.

Figure 18.
(Ordinate) Δχ versus (abscissa) VEC of eutectics with Nbss and Nb5Si3. Data for series e (R2 = 0.9895) in Figure 5 in reference. [41], alloying elements Al, Cr, Ge, Hf, Mo, Si, Sn, Ti, W. The blue color data point corresponds to alloy B (see text).
Figure 18.
(Ordinate) Δχ versus (abscissa) VEC of eutectics with Nbss and Nb5Si3. Data for series e (R2 = 0.9895) in Figure 5 in reference. [41], alloying elements Al, Cr, Ge, Hf, Mo, Si, Sn, Ti, W. The blue color data point corresponds to alloy B (see text).

Figure 19.
Creep rate (s−1) at 1050 °C and 150 MPa (ordinate) versus (abscissa) Nb/(Ti + Hf) ratio. Elements in Nb silicide-based alloys Al, Cr, Hf, Mo, Nb, Si, Ti, W. The MASC alloy is indicated in green. For MASC see [1,2]. Creep data from the EU FP6-ULTMAT project [122].


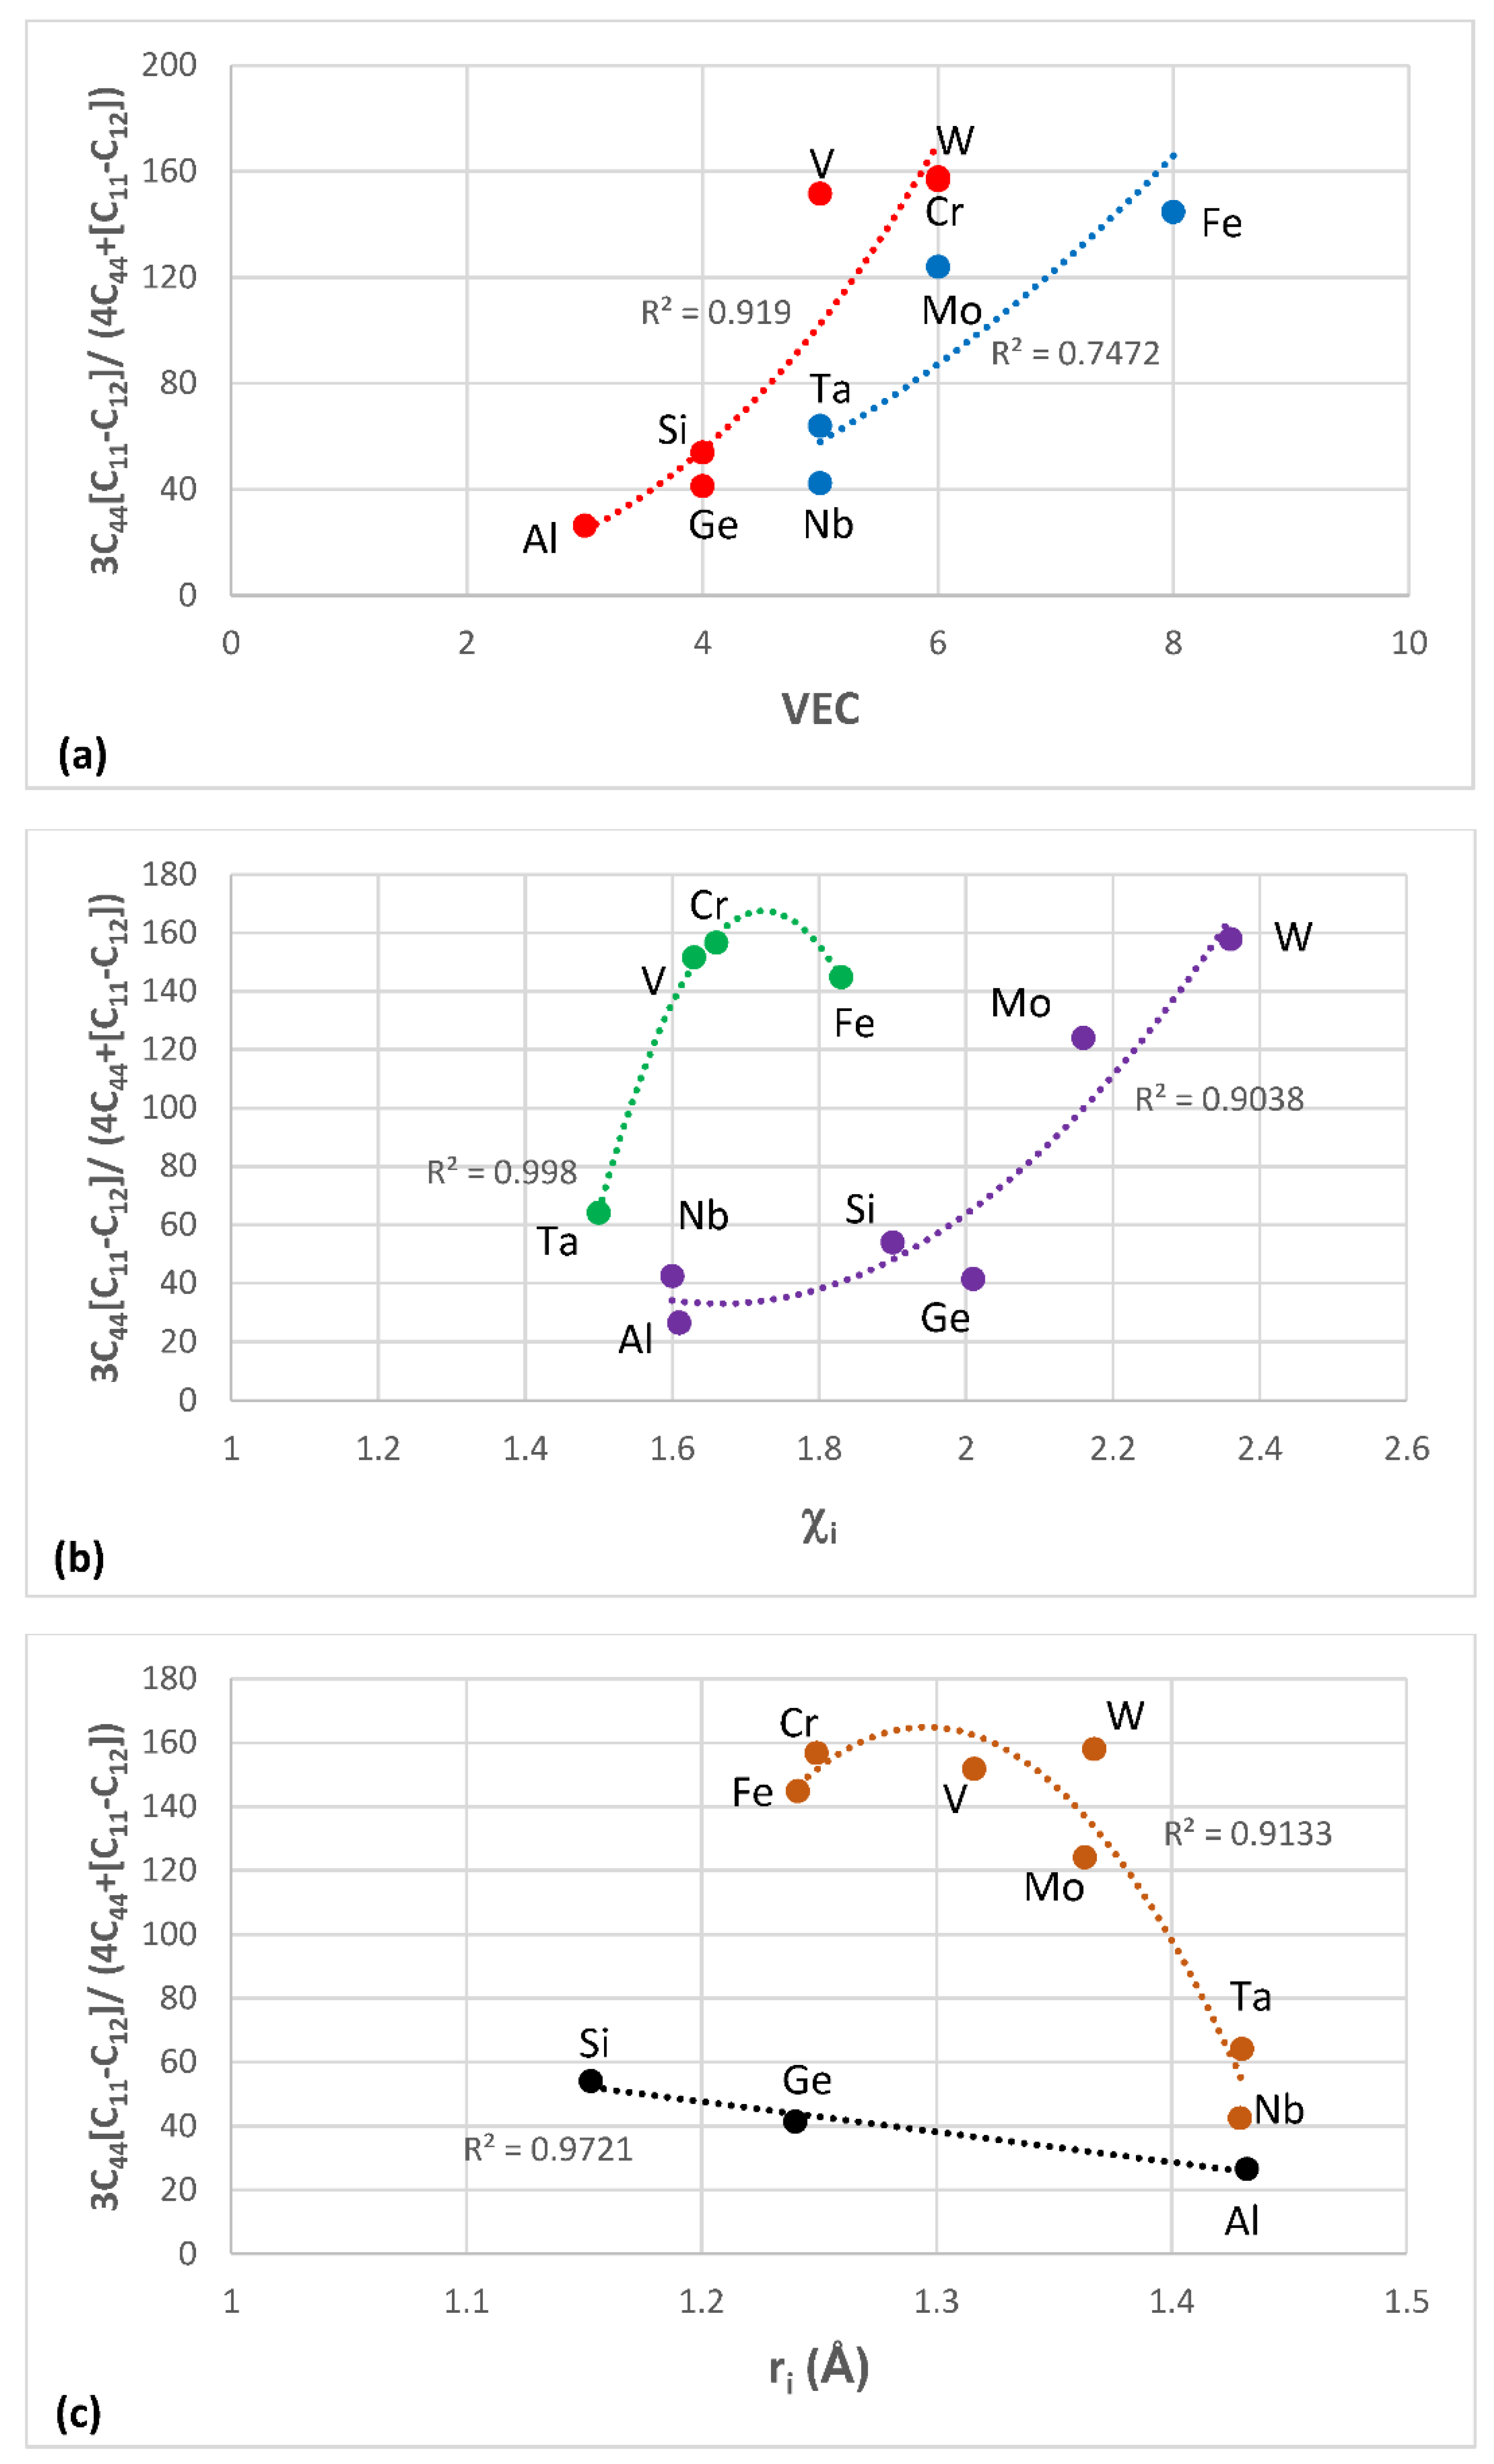
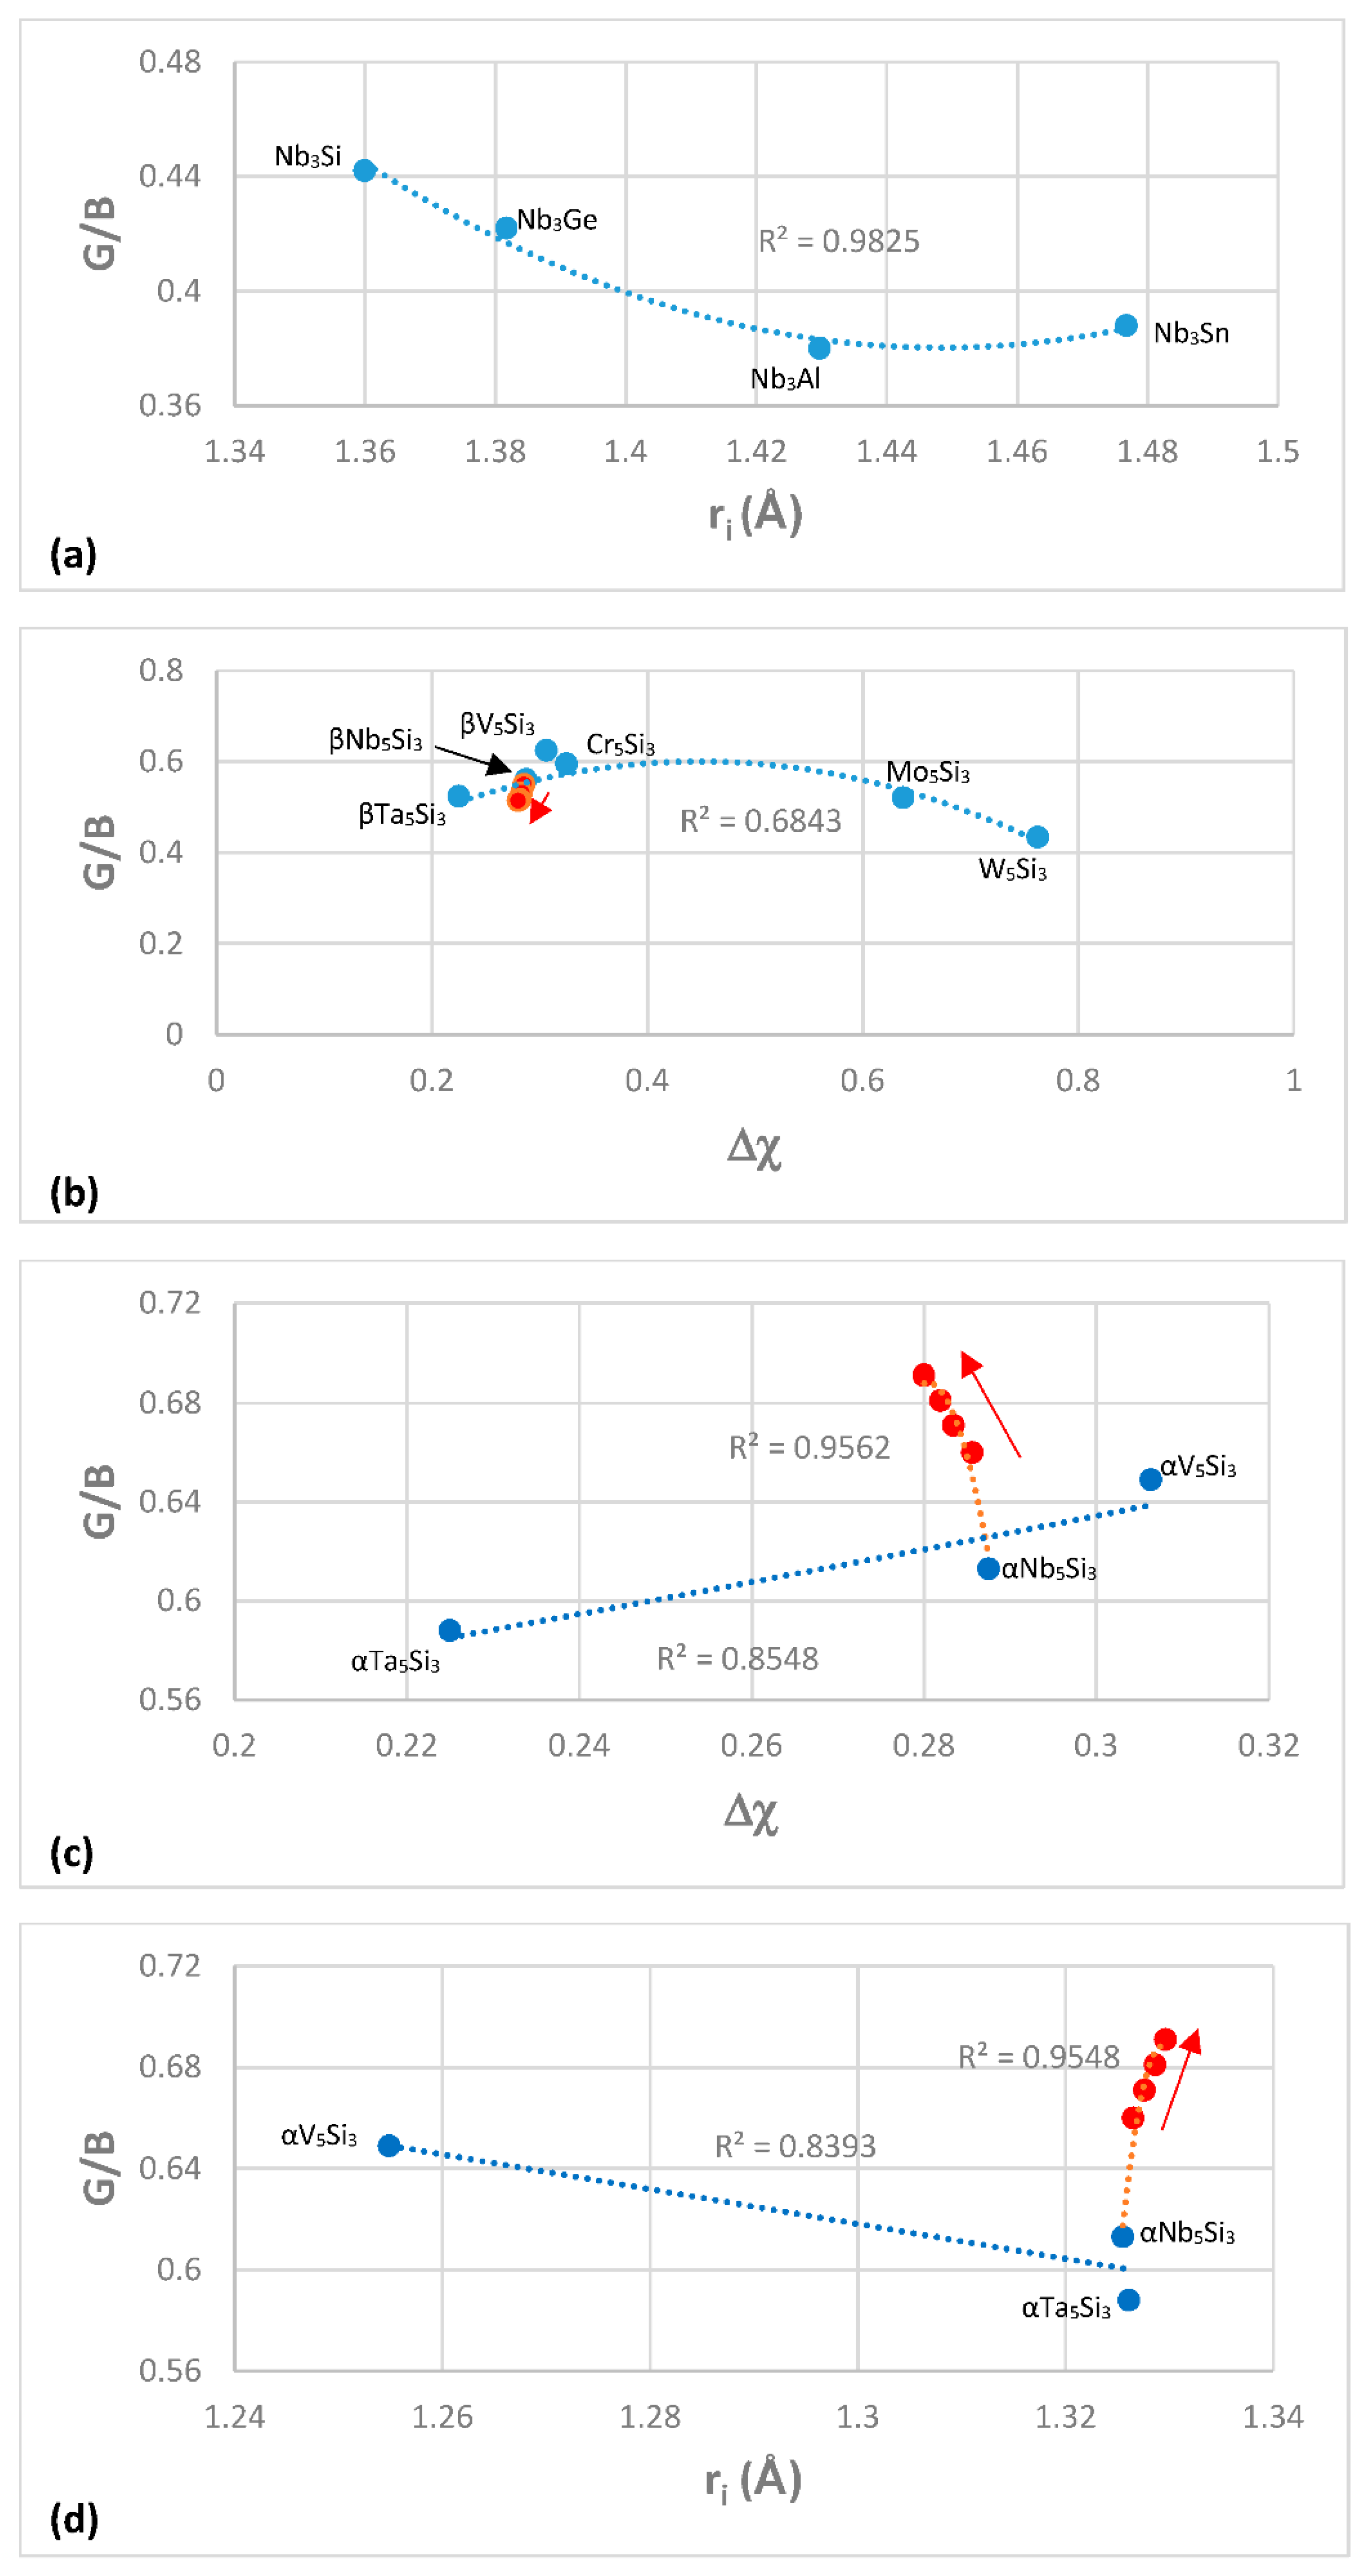
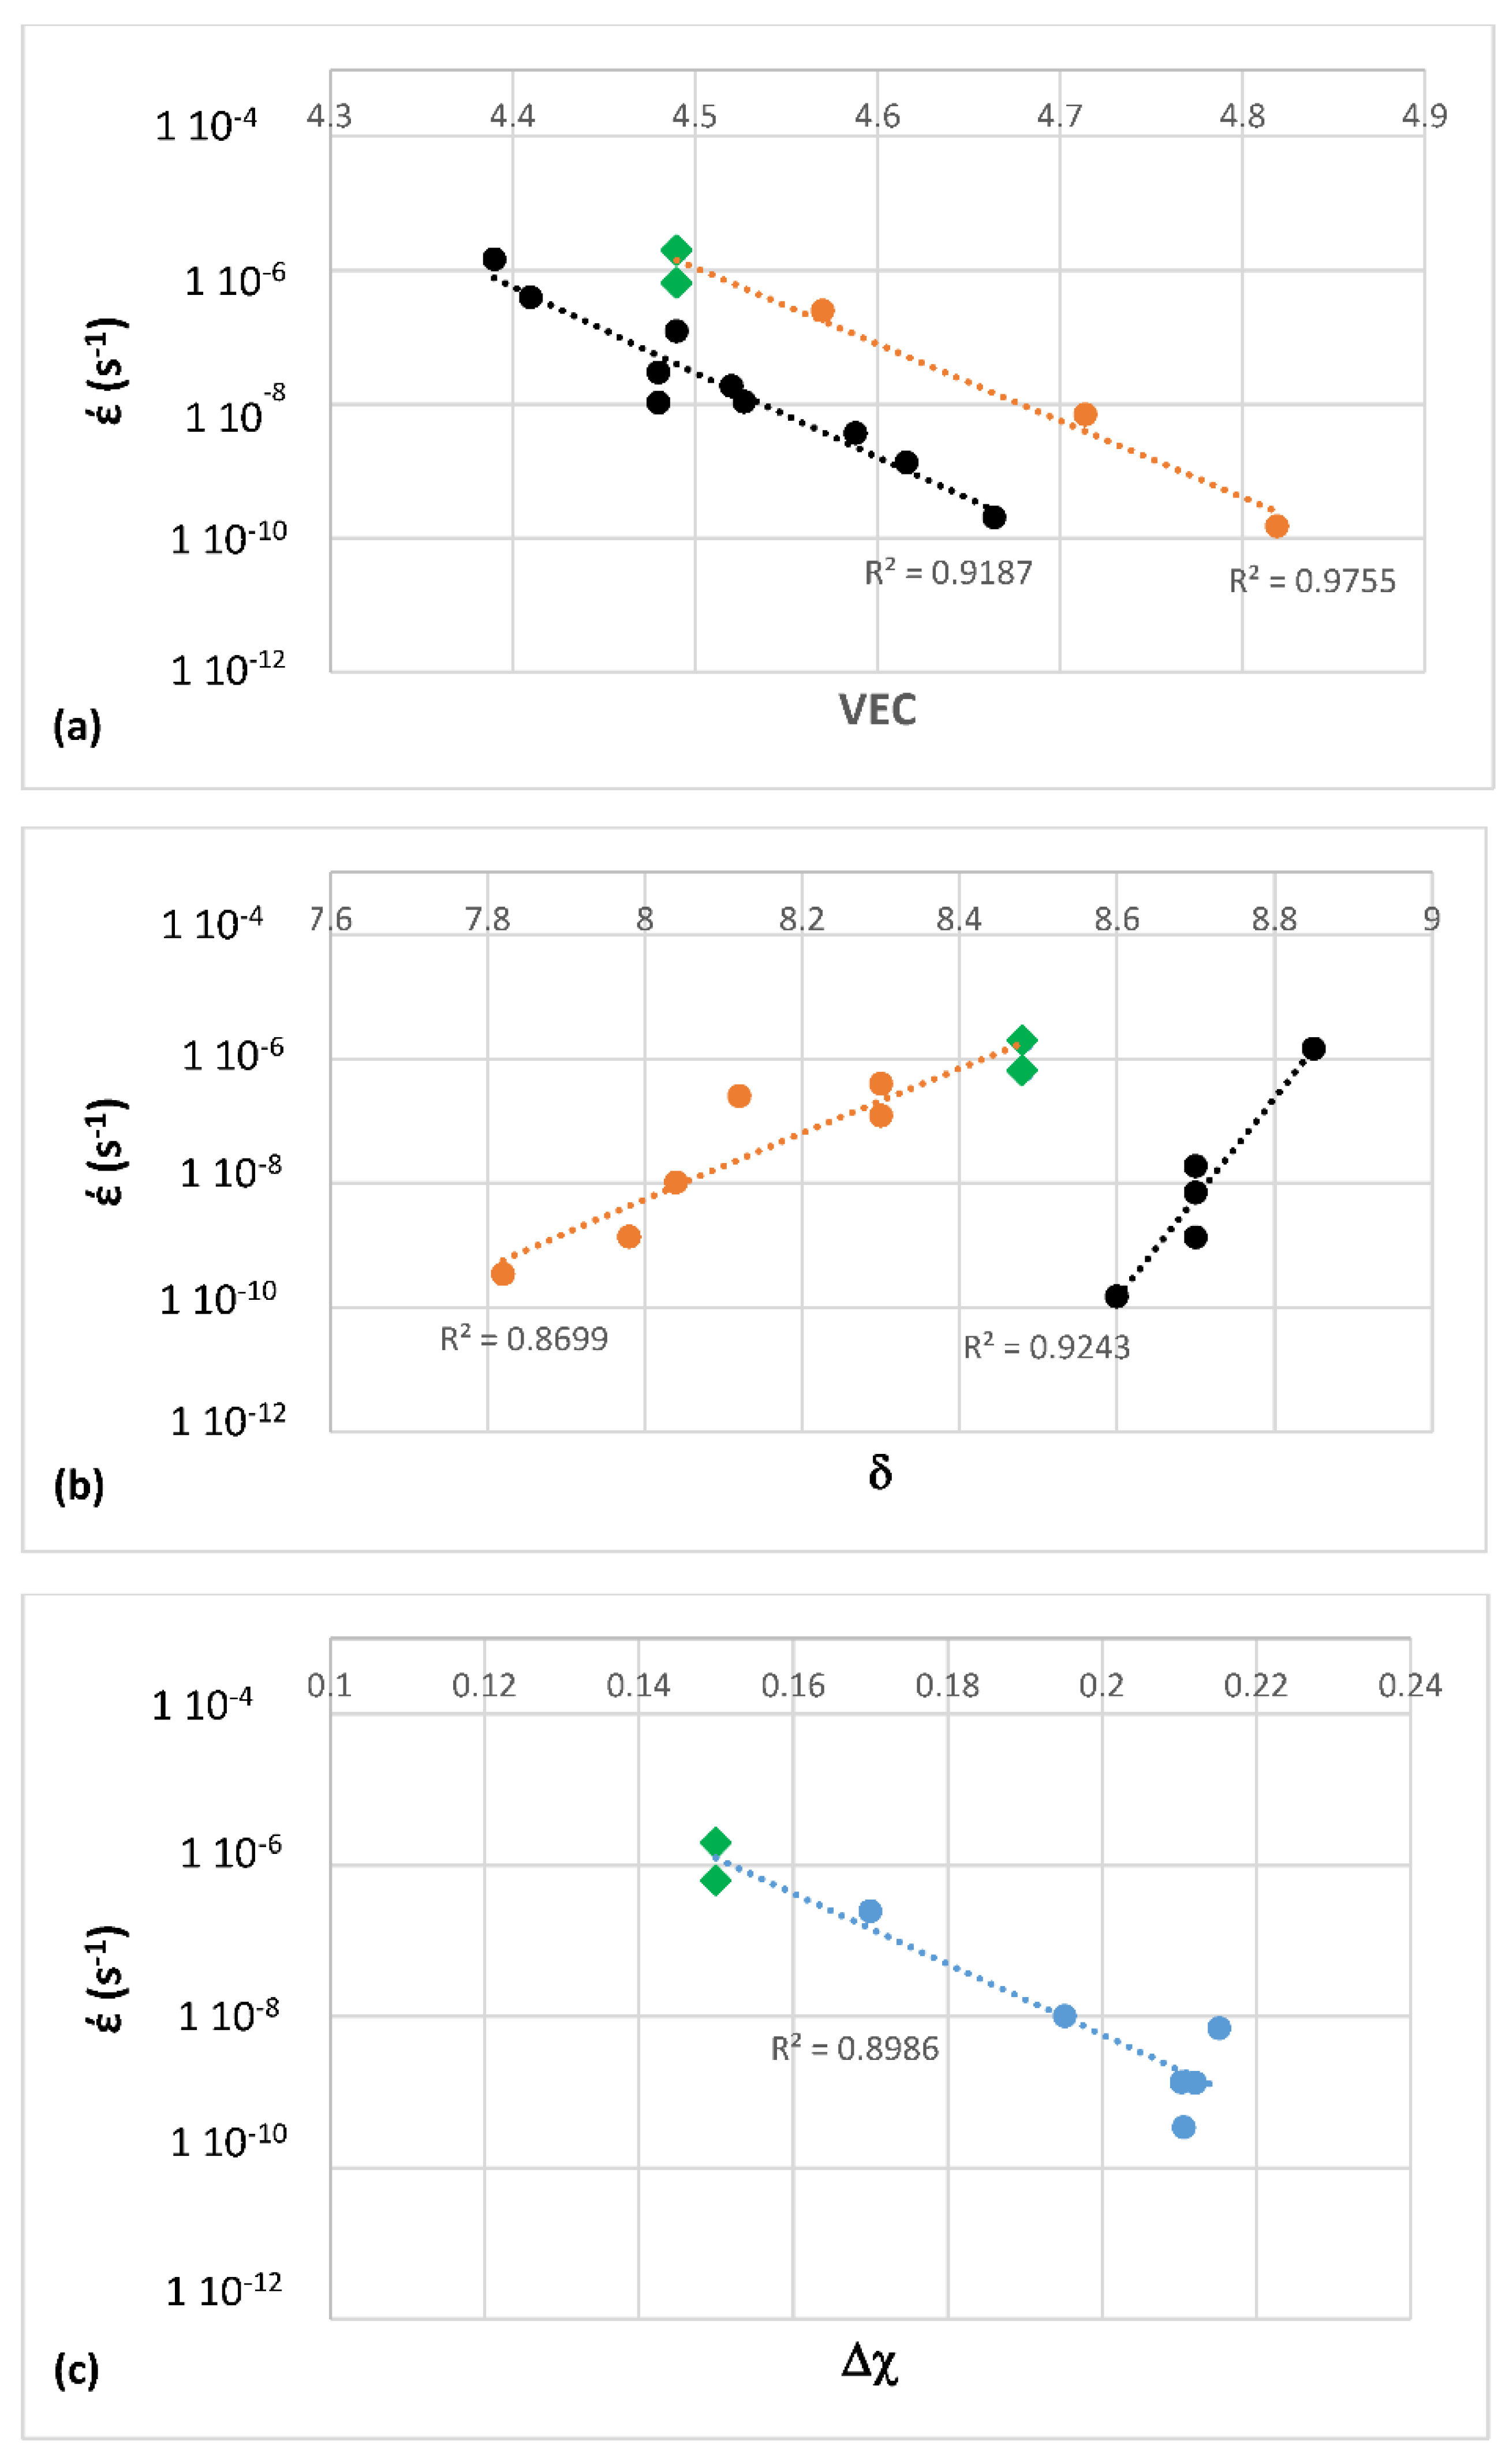
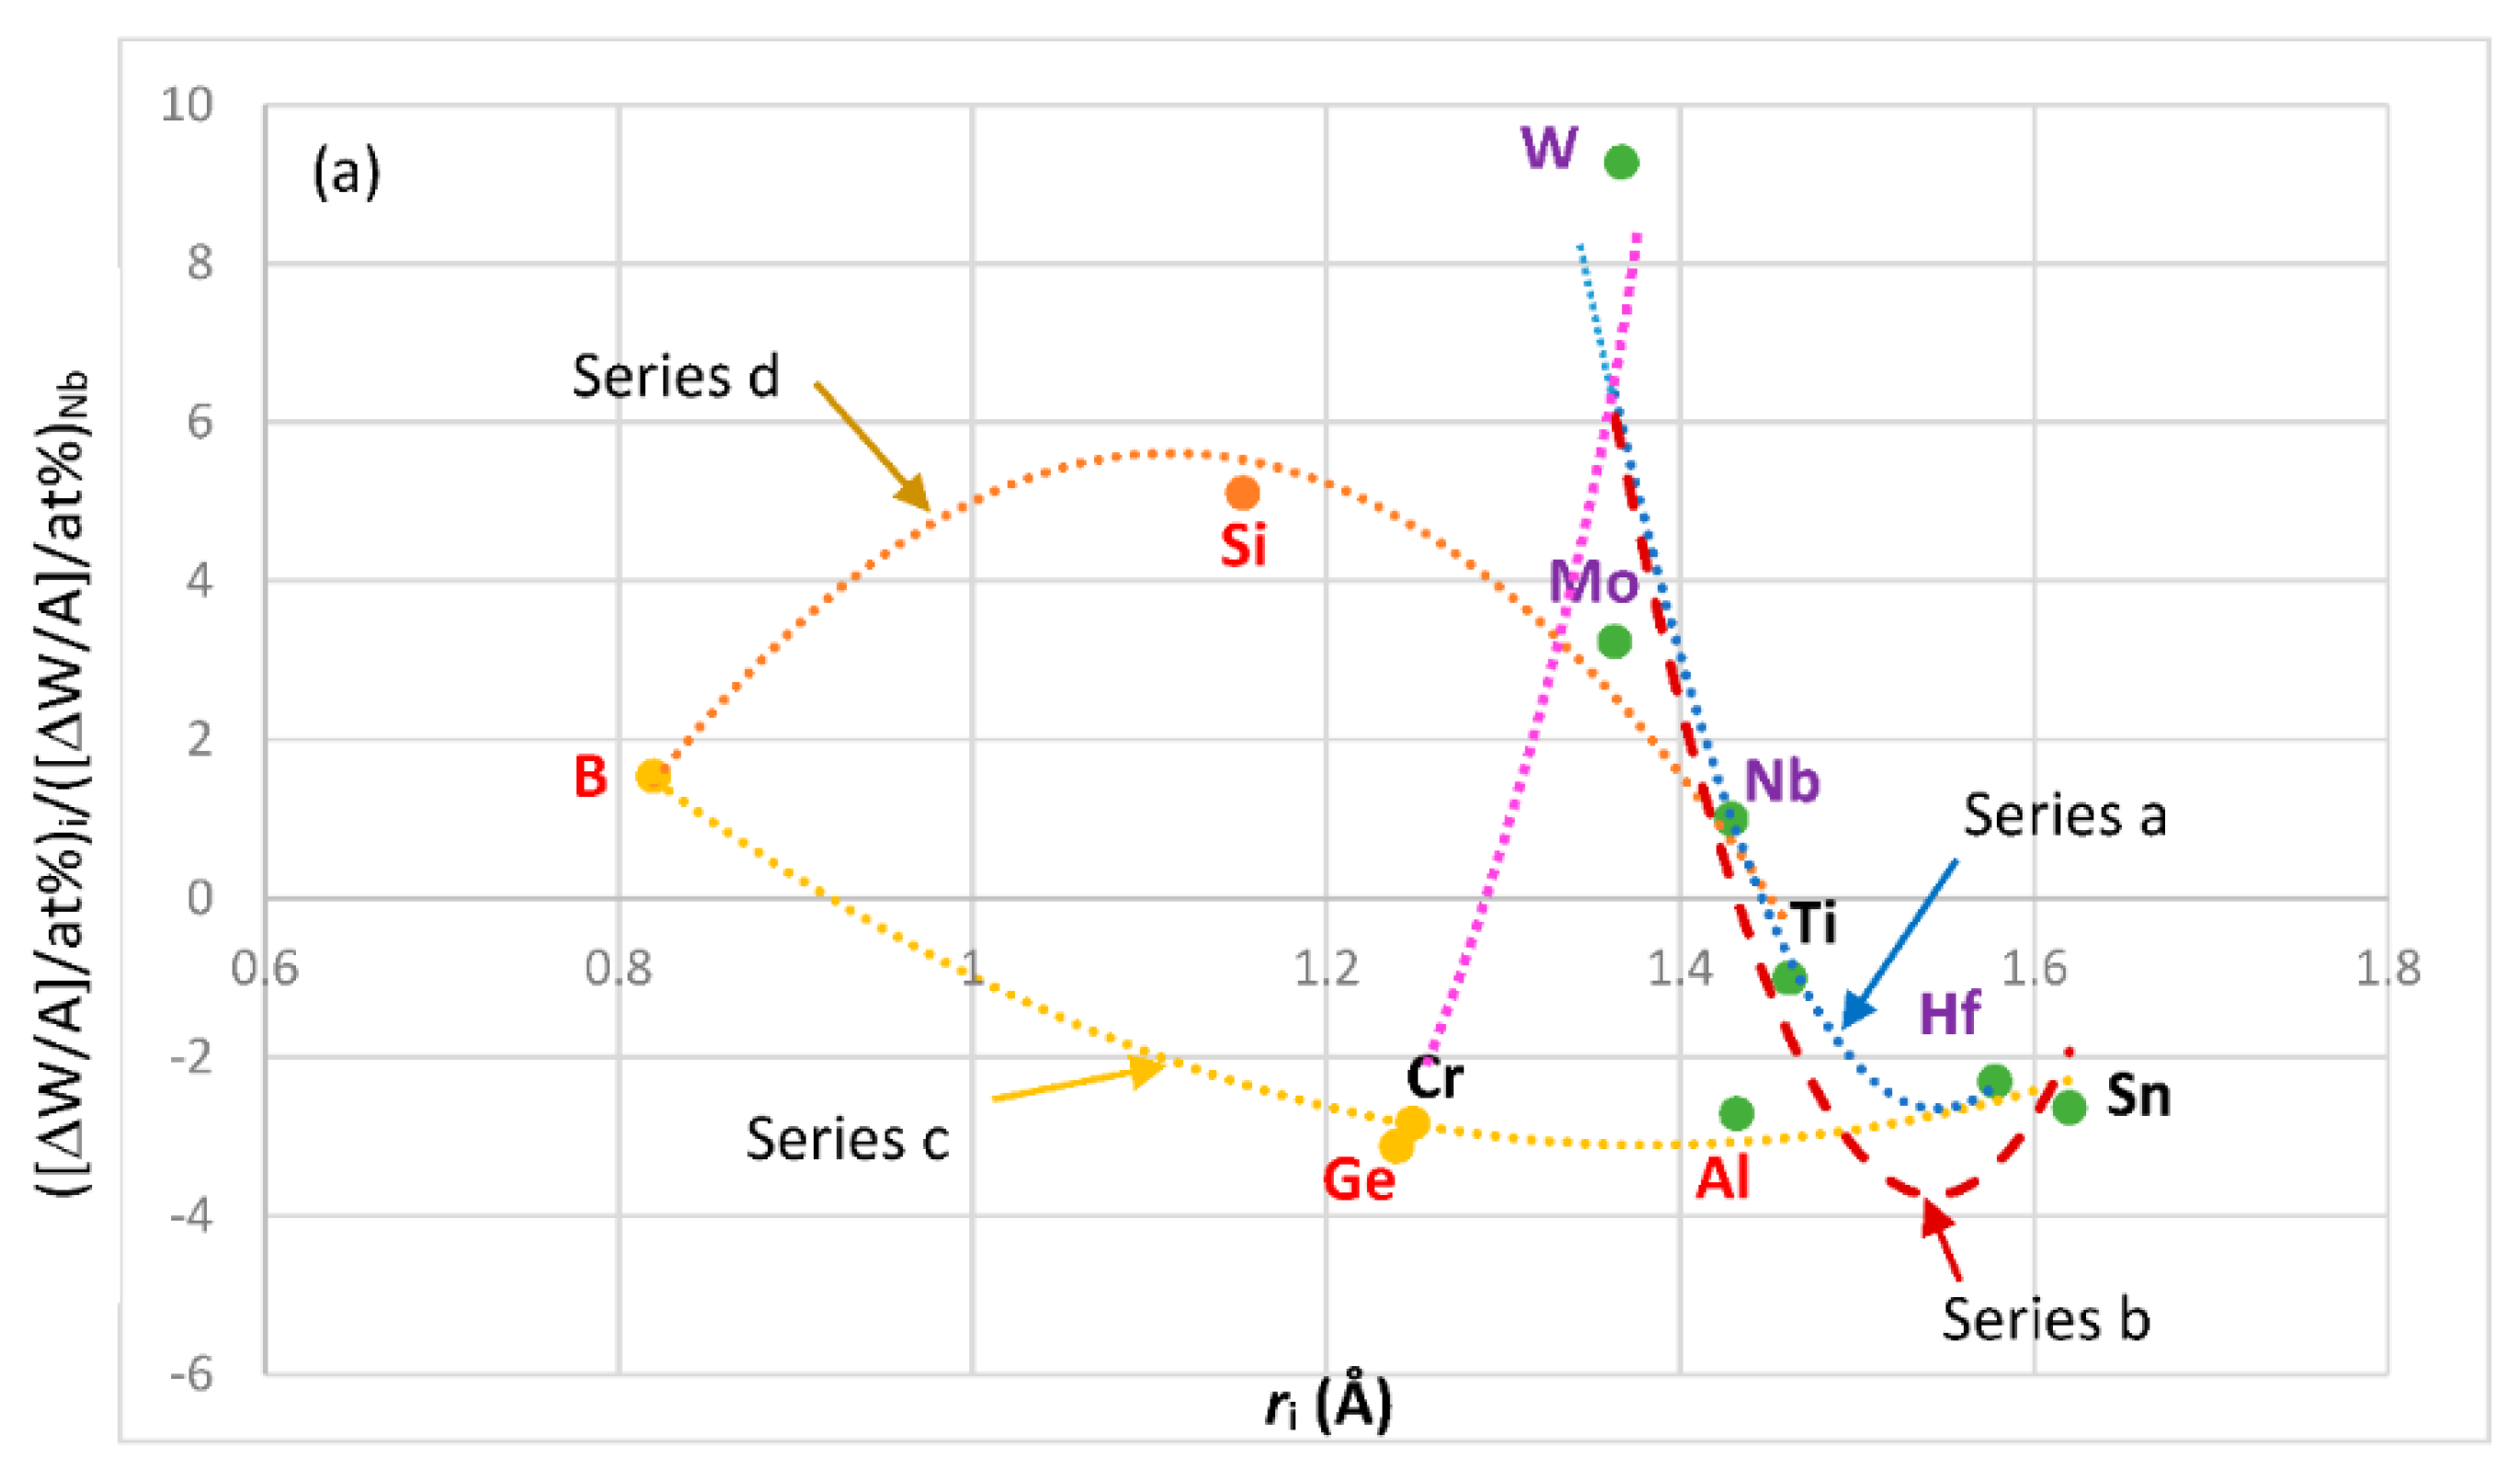
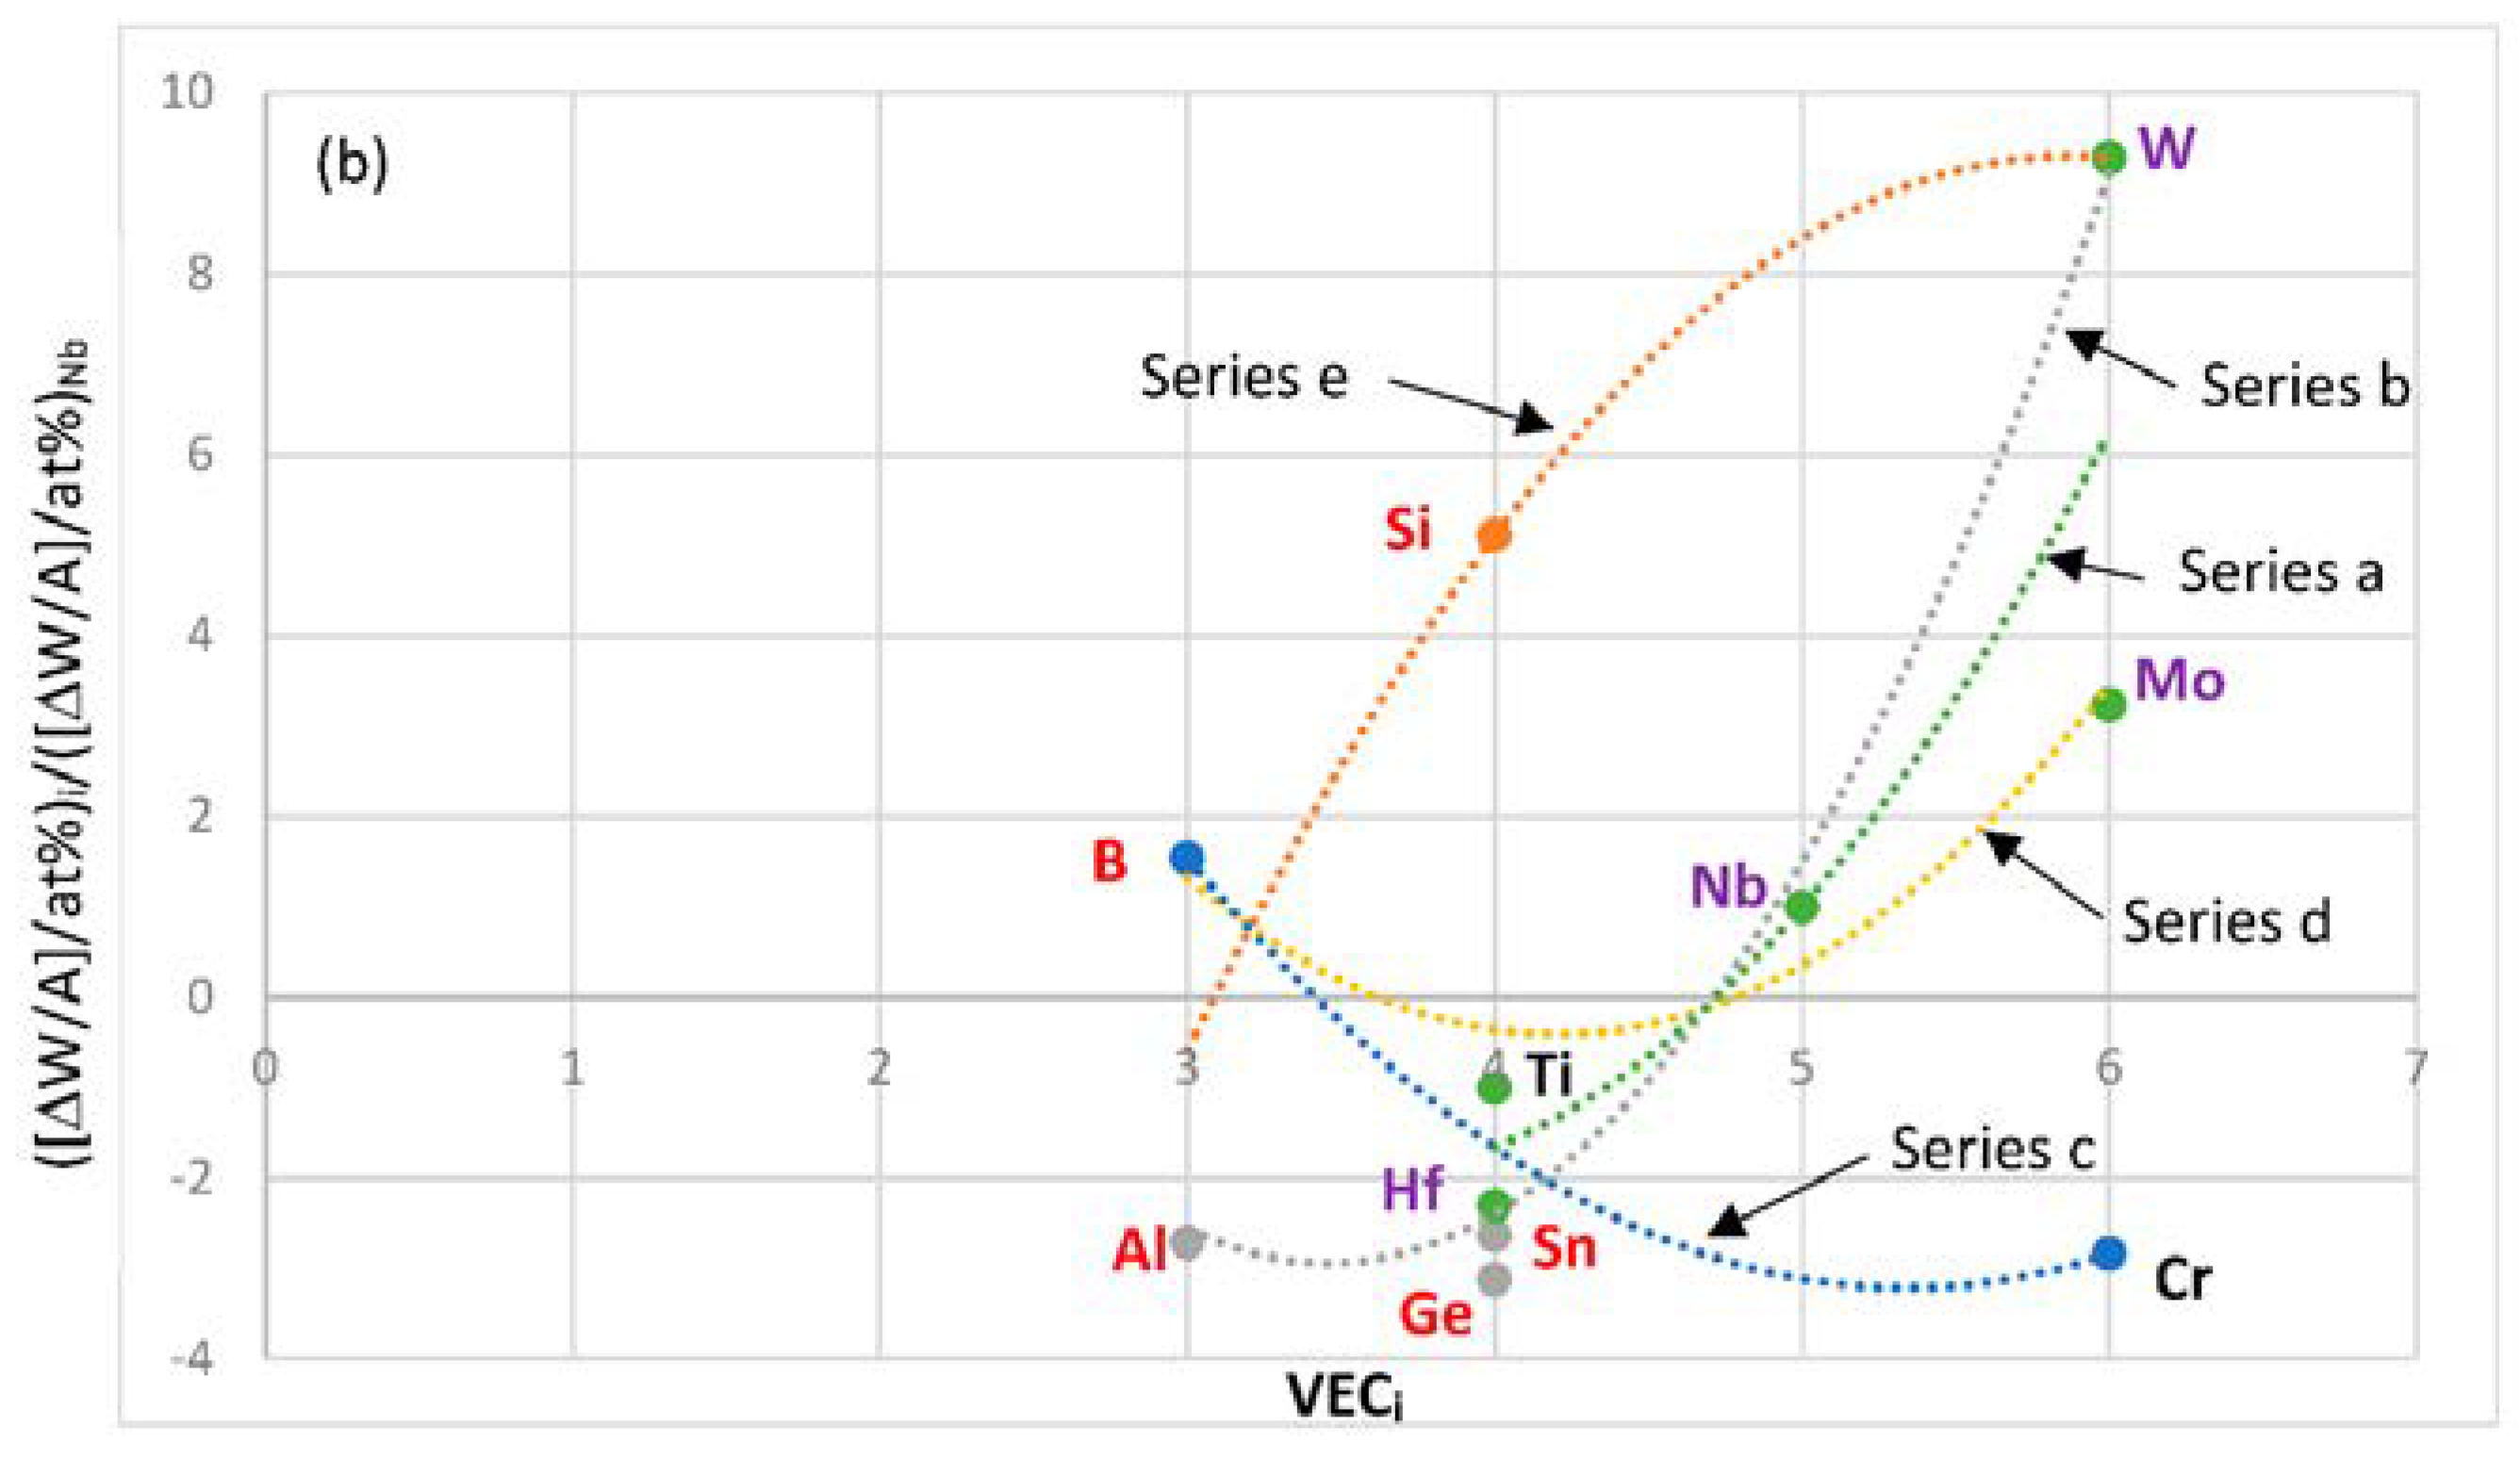
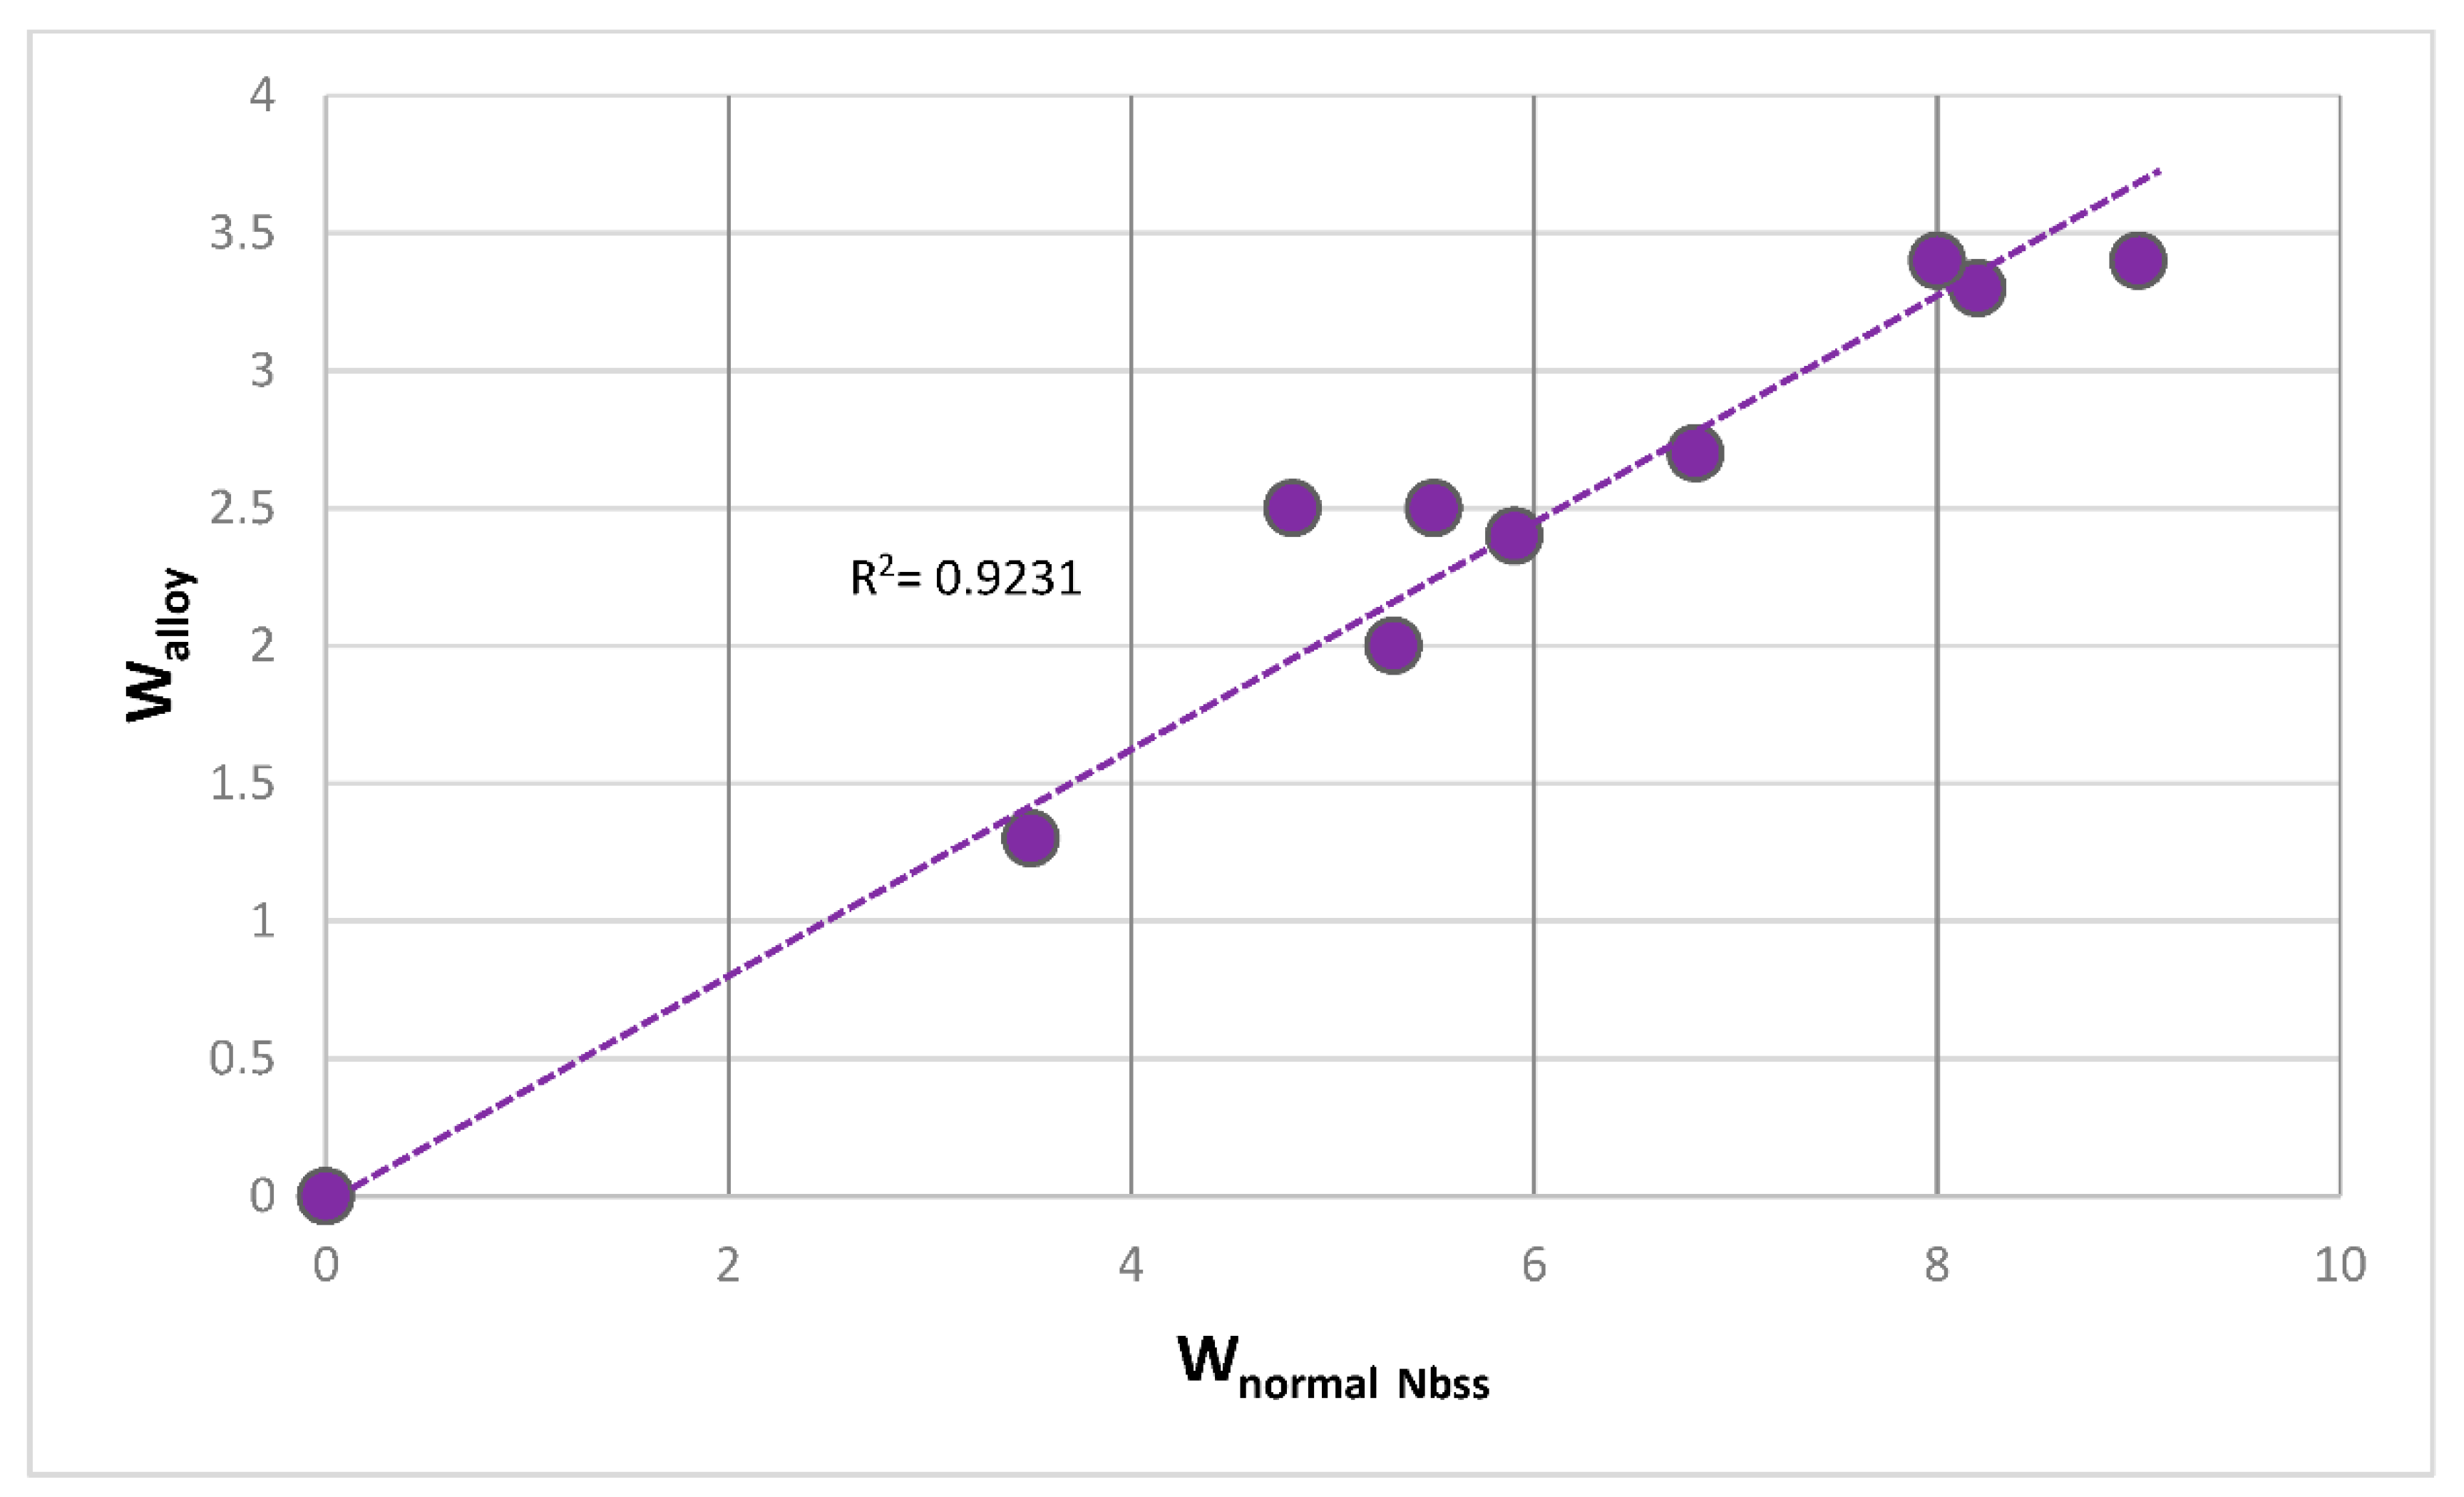
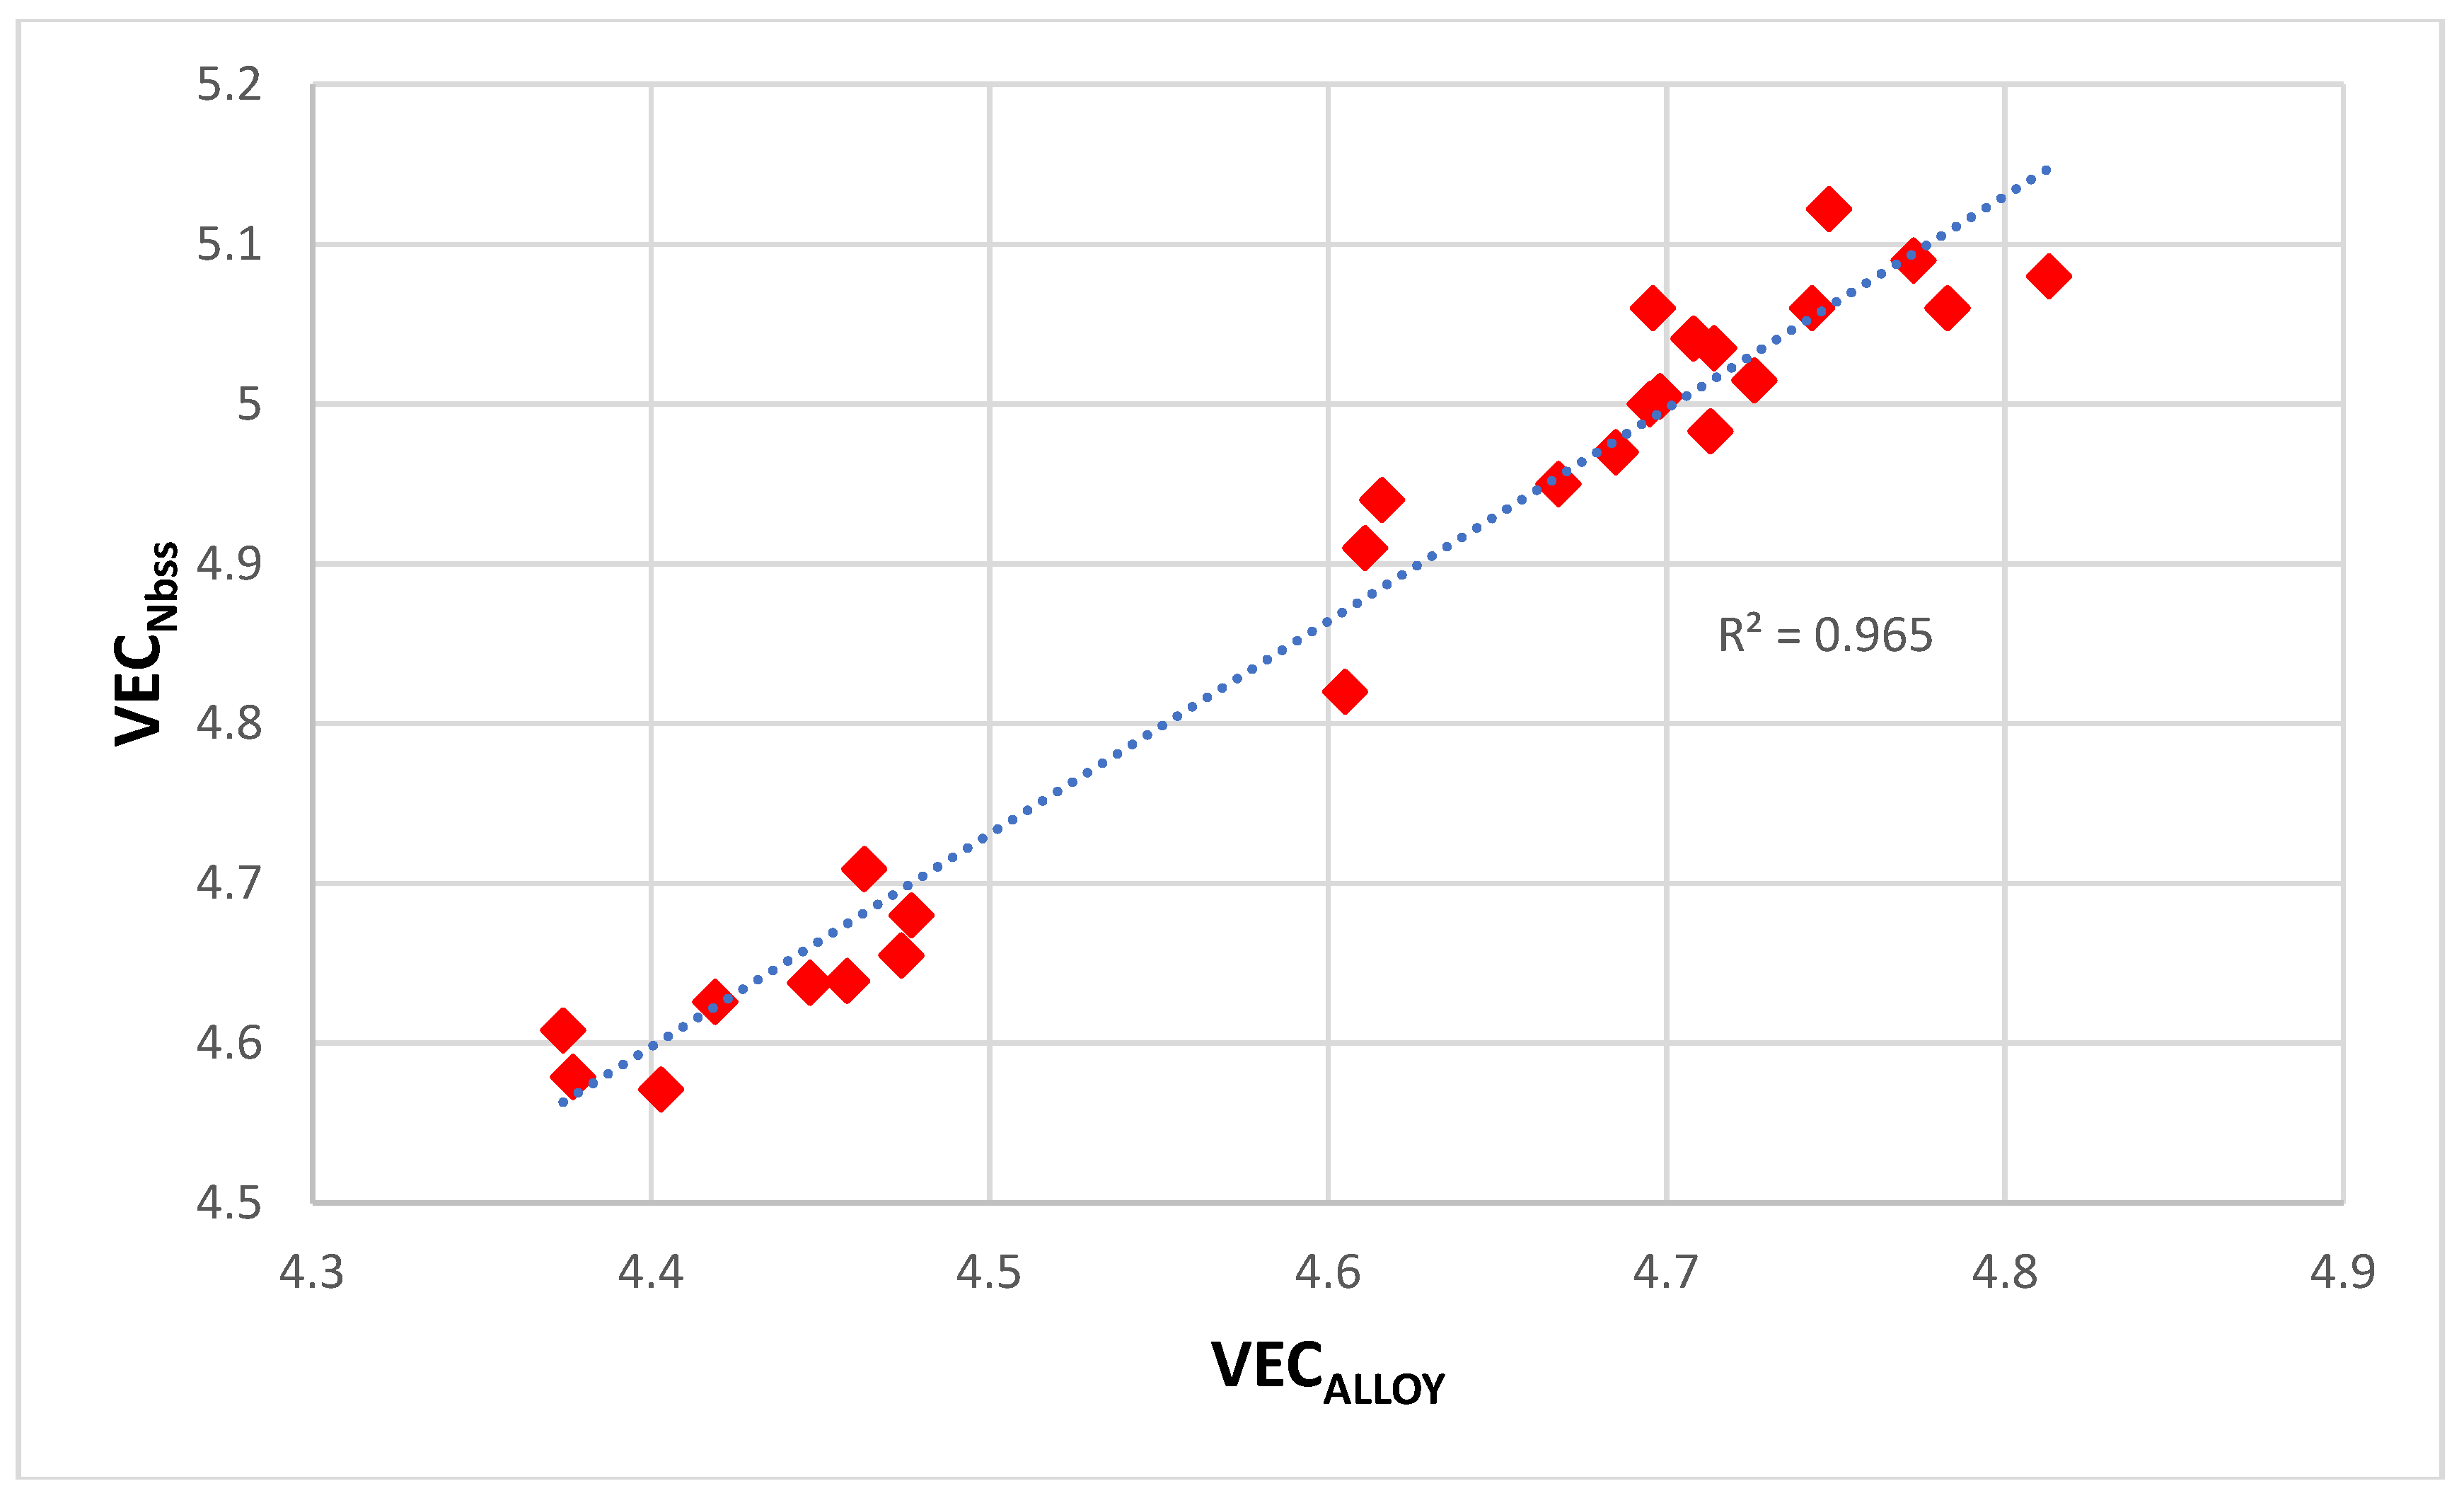
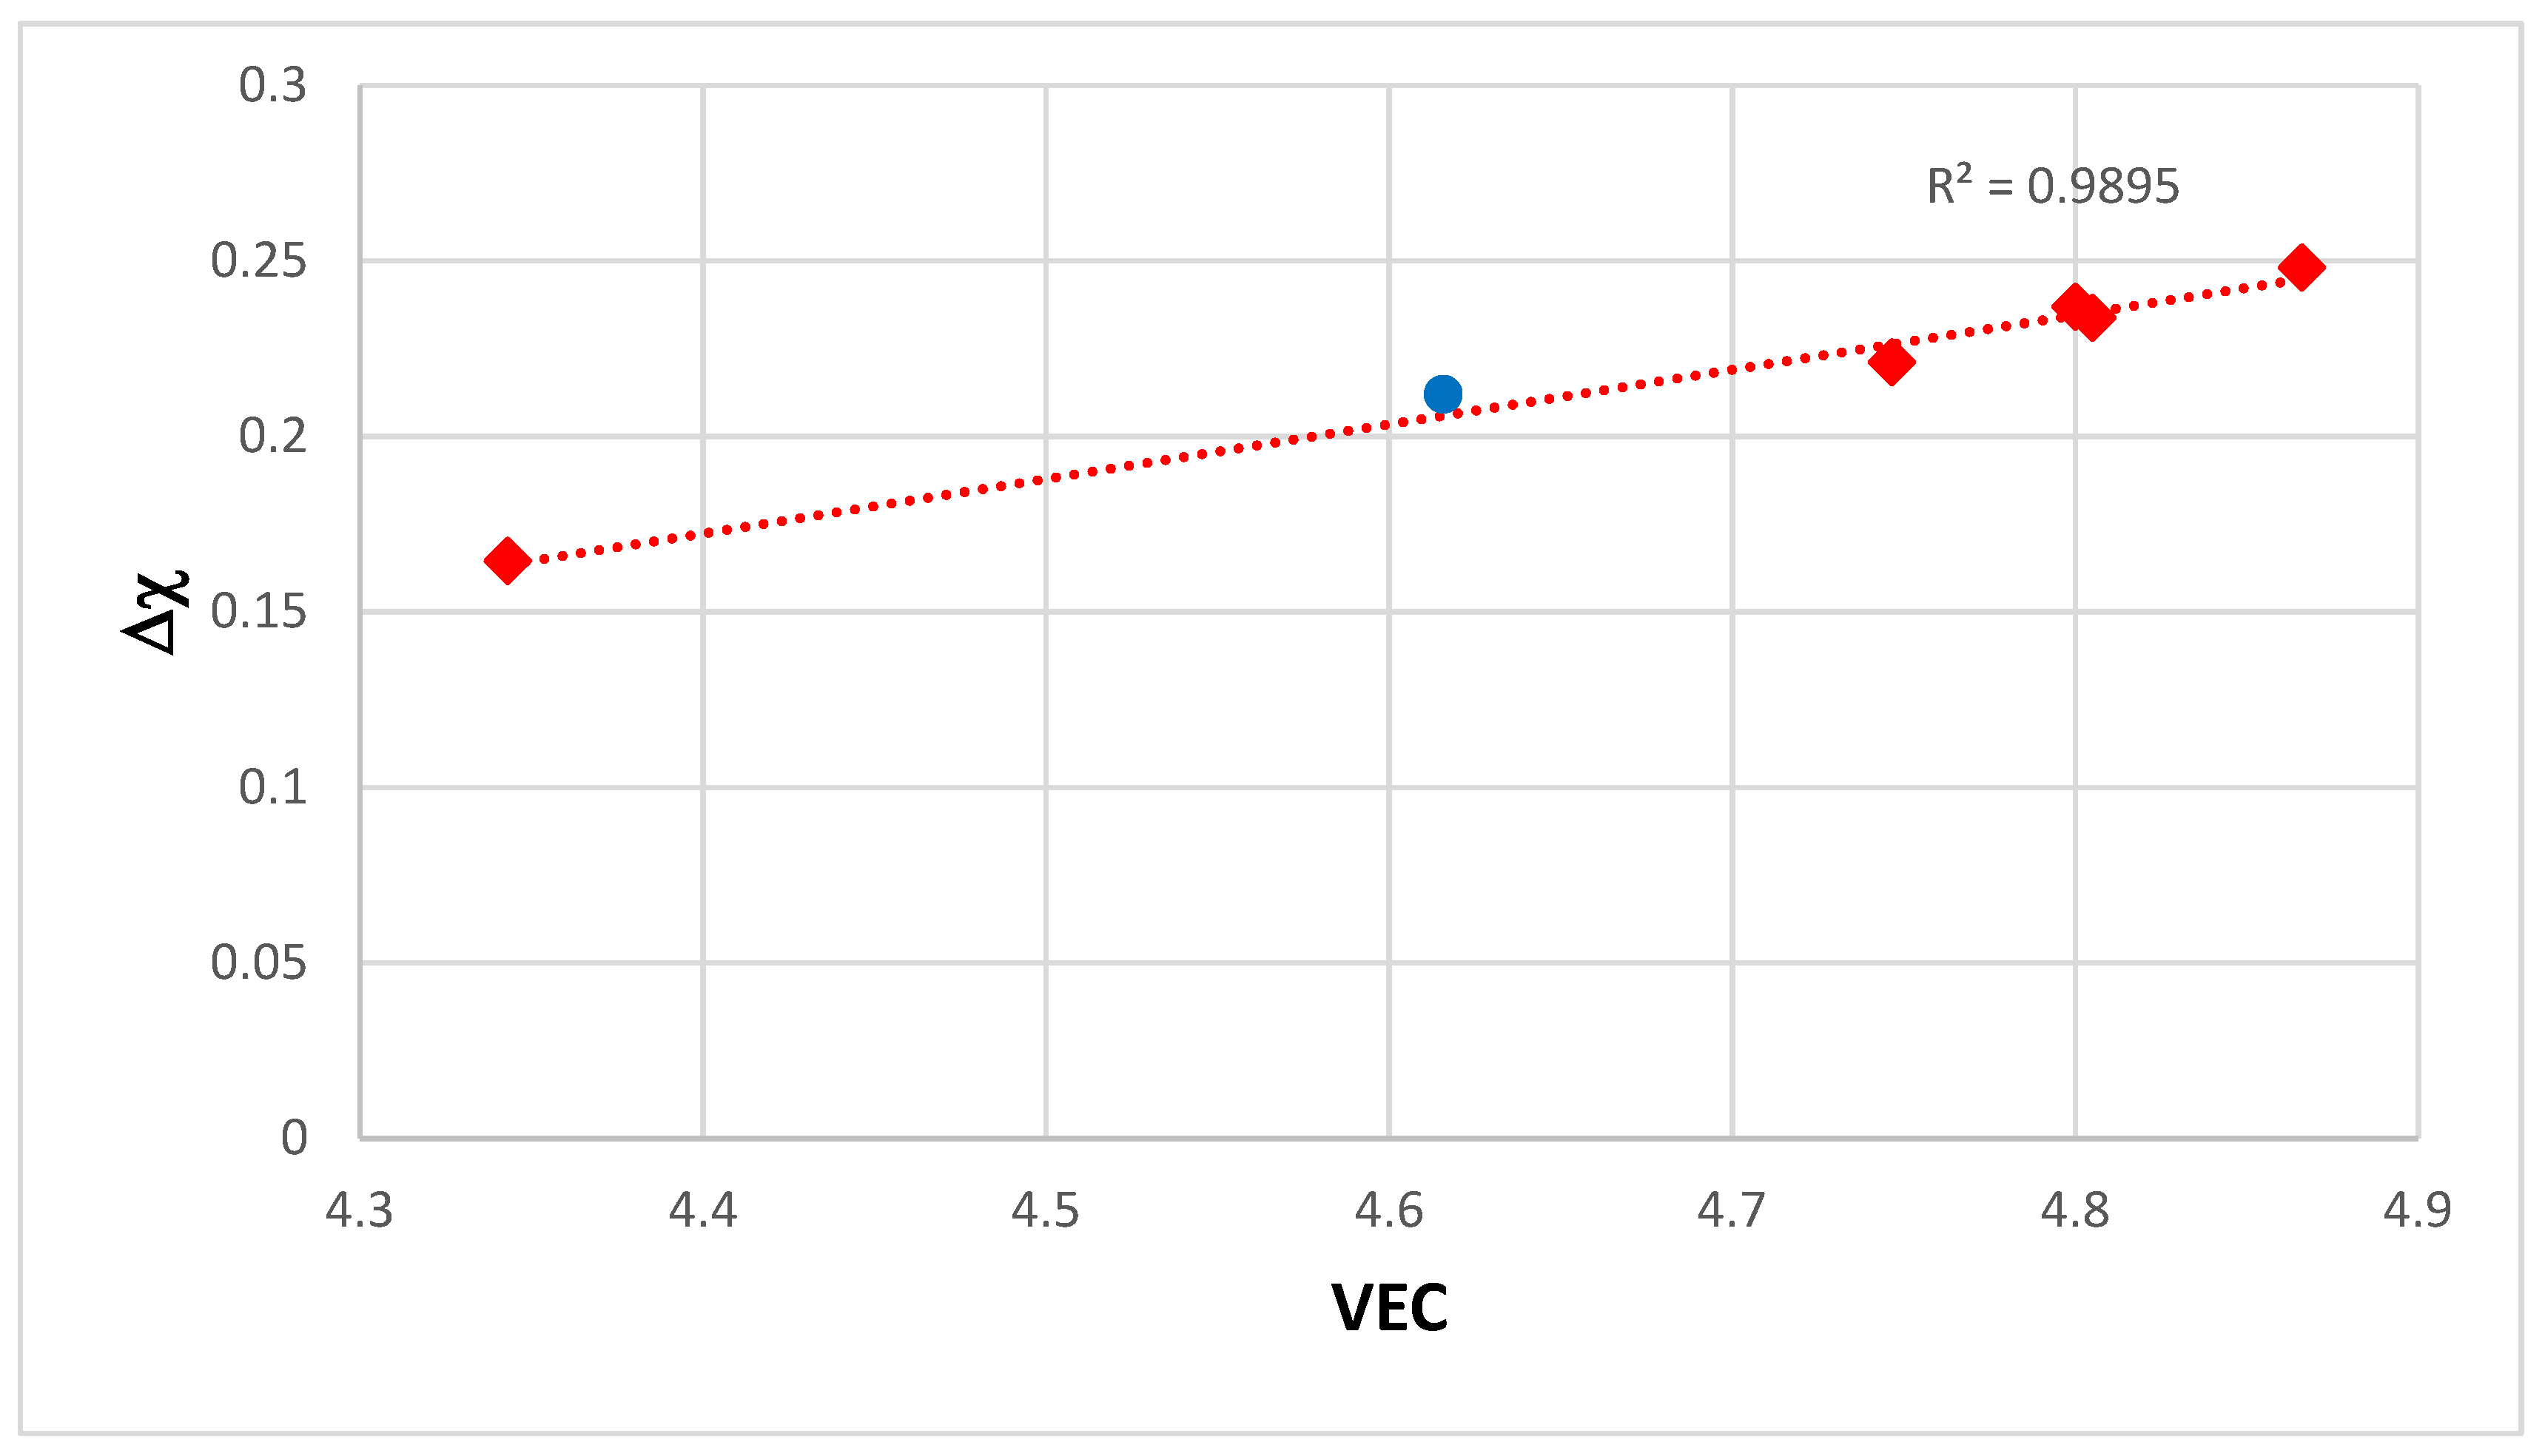
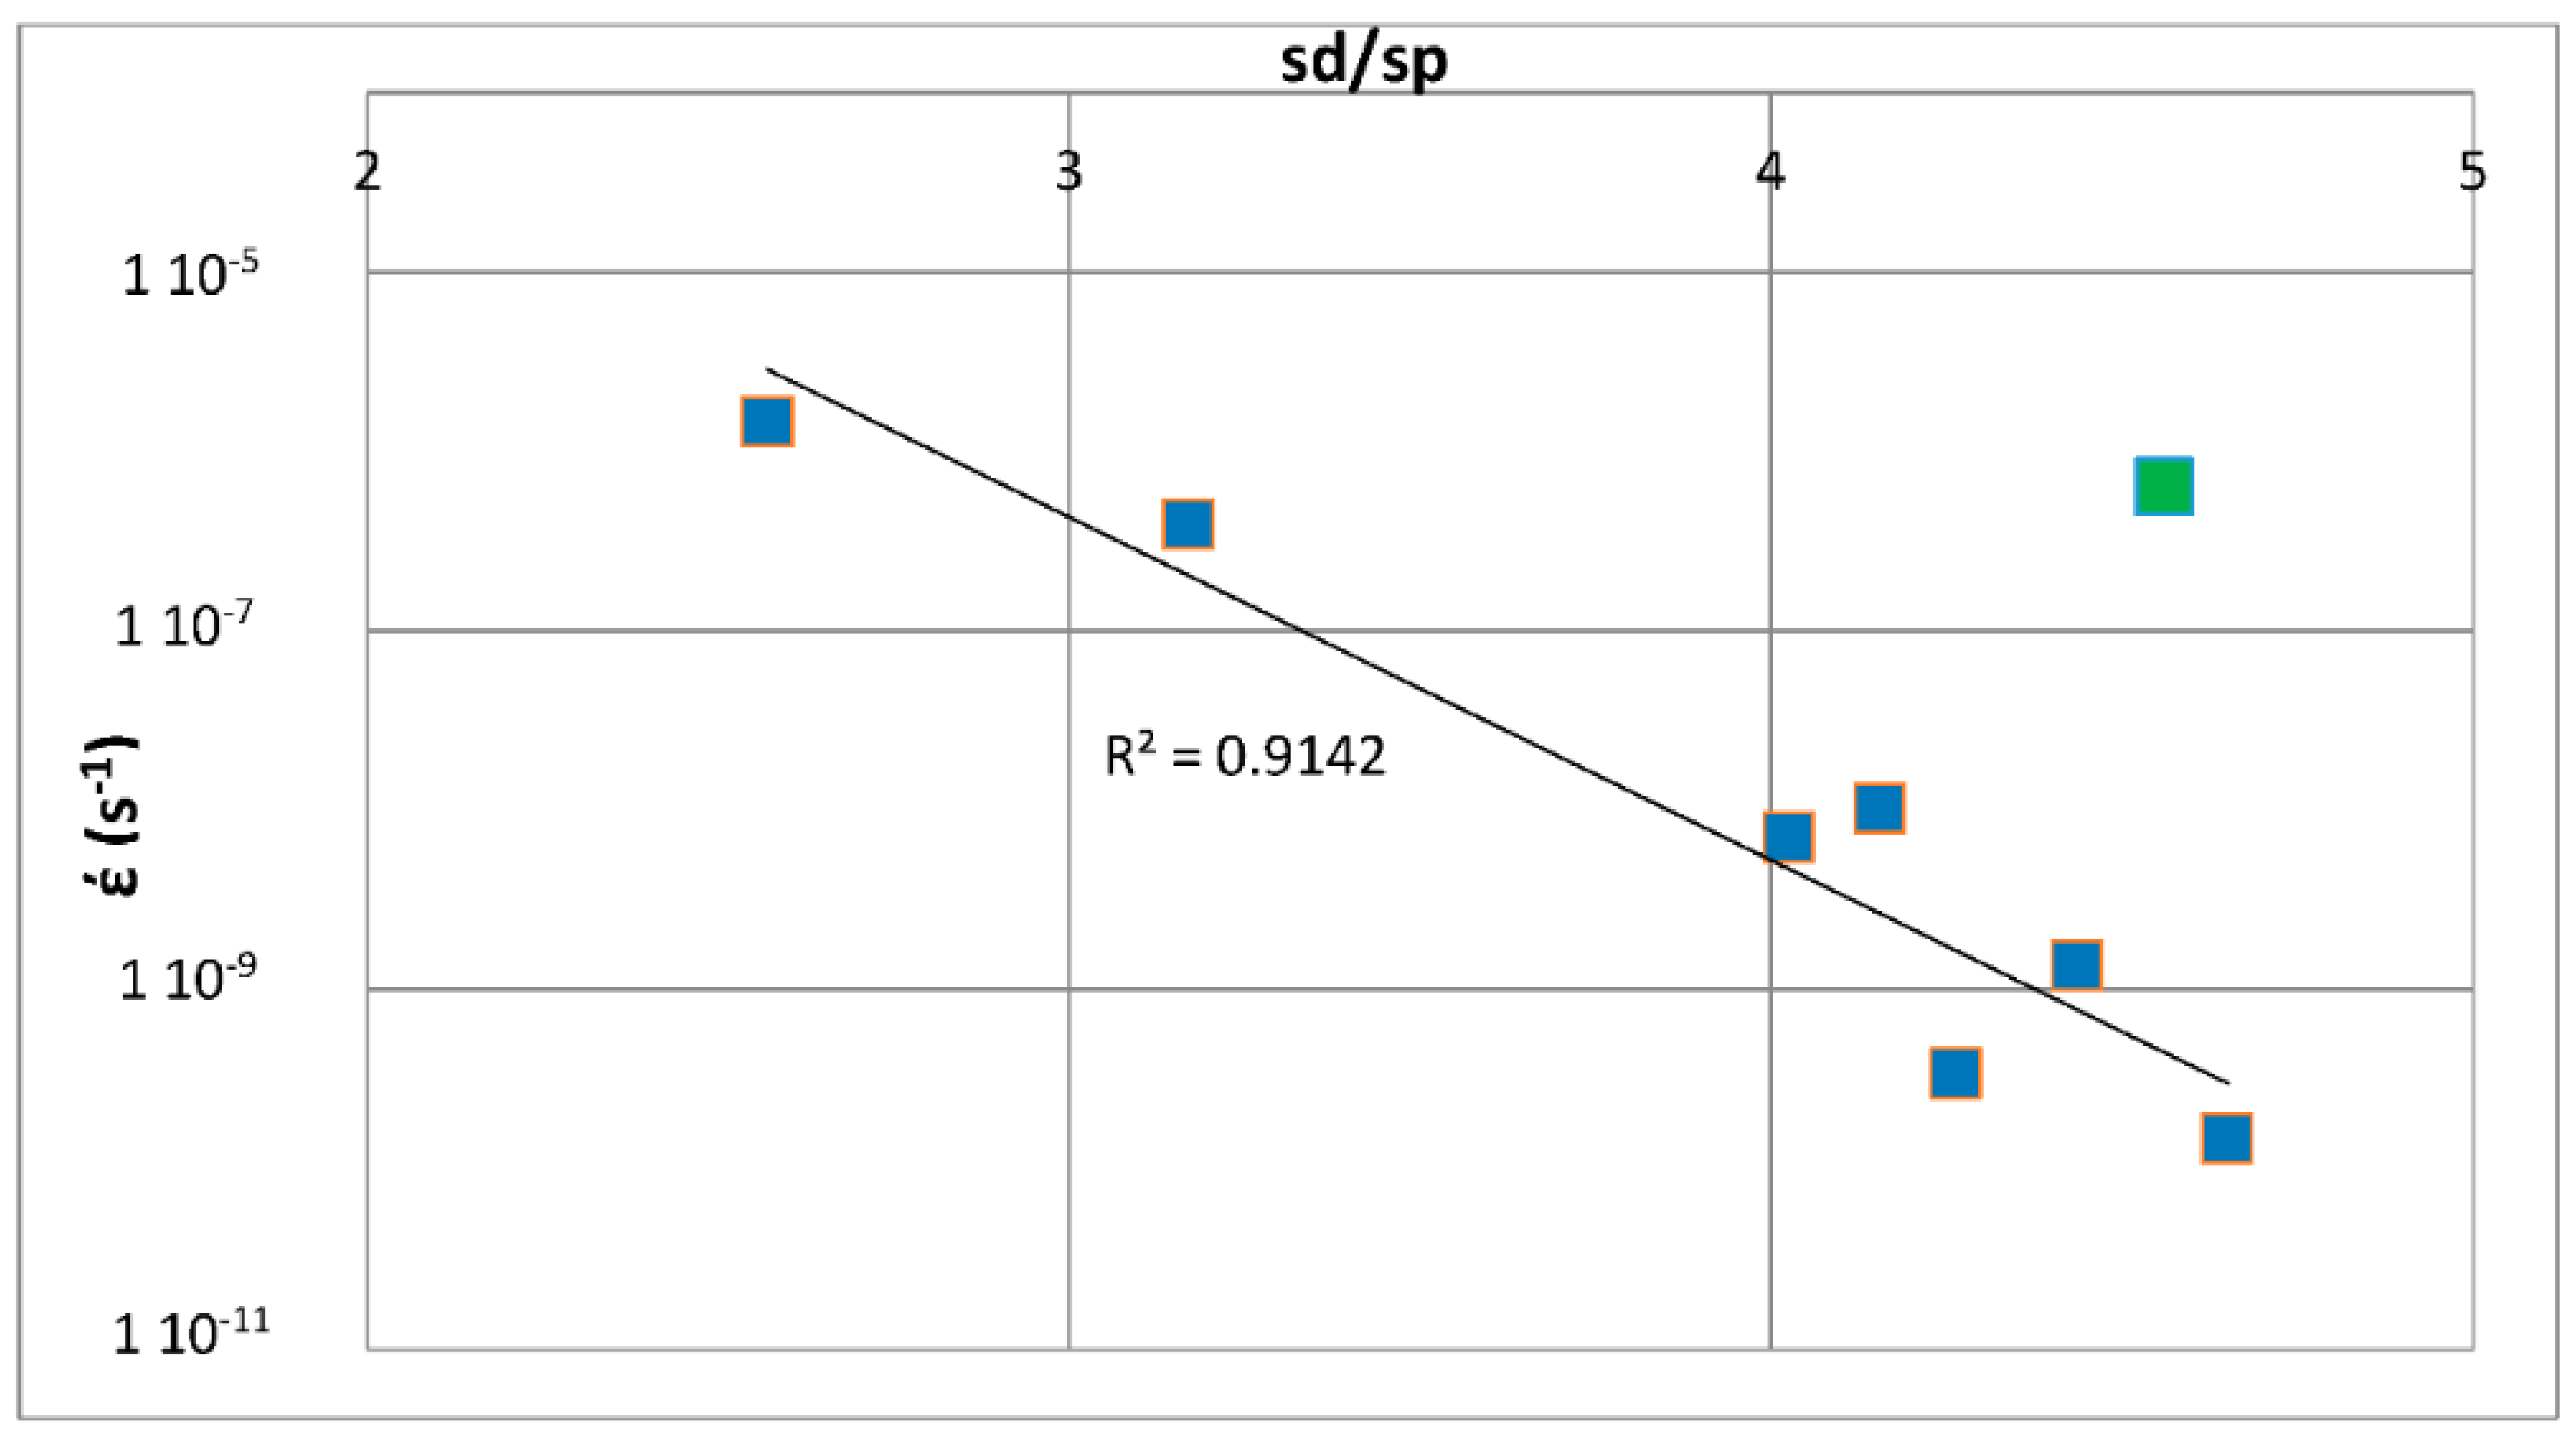
© 2018 by the author. Licensee MDPI, Basel, Switzerland. This article is an open access article distributed under the terms and conditions of the Creative Commons Attribution (CC BY) license (http://creativecommons.org/licenses/by/4.0/).
Share and Cite
MDPI and ACS Style
Tsakiropoulos, P. On Nb Silicide Based Alloys: Alloy Design and Selection. Materials 2018, 11, 844. https://doi.org/10.3390/ma11050844
AMA Style
Tsakiropoulos P. On Nb Silicide Based Alloys: Alloy Design and Selection. Materials. 2018; 11(5):844. https://doi.org/10.3390/ma11050844
Chicago/Turabian StyleTsakiropoulos, Panos. 2018. "On Nb Silicide Based Alloys: Alloy Design and Selection" Materials 11, no. 5: 844. https://doi.org/10.3390/ma11050844
Note that from the first issue of 2016, this journal uses article numbers instead of page numbers. See further details here.