Degradation of Methylene Blue Dye in the Presence of Visible Light Using SiO2@α-Fe2O3 Nanocomposites Deposited on SnS2 Flowers

 ,
, 
 ,
,  and
and
Abstract
1. Introduction
2. Experimental Procedure
2.1. Materials Used
2.2. Synthesis of Flower-Like SnS2
2.3. Synthesis of SiO2@α-Fe2O3 Composite Spheres
2.4. Preparation of SnS2- SiO2@α-Fe2O3 Nanocomposites
2.5. Degradation of MB Dye
2.6. Characterization
3. Results and Discuss
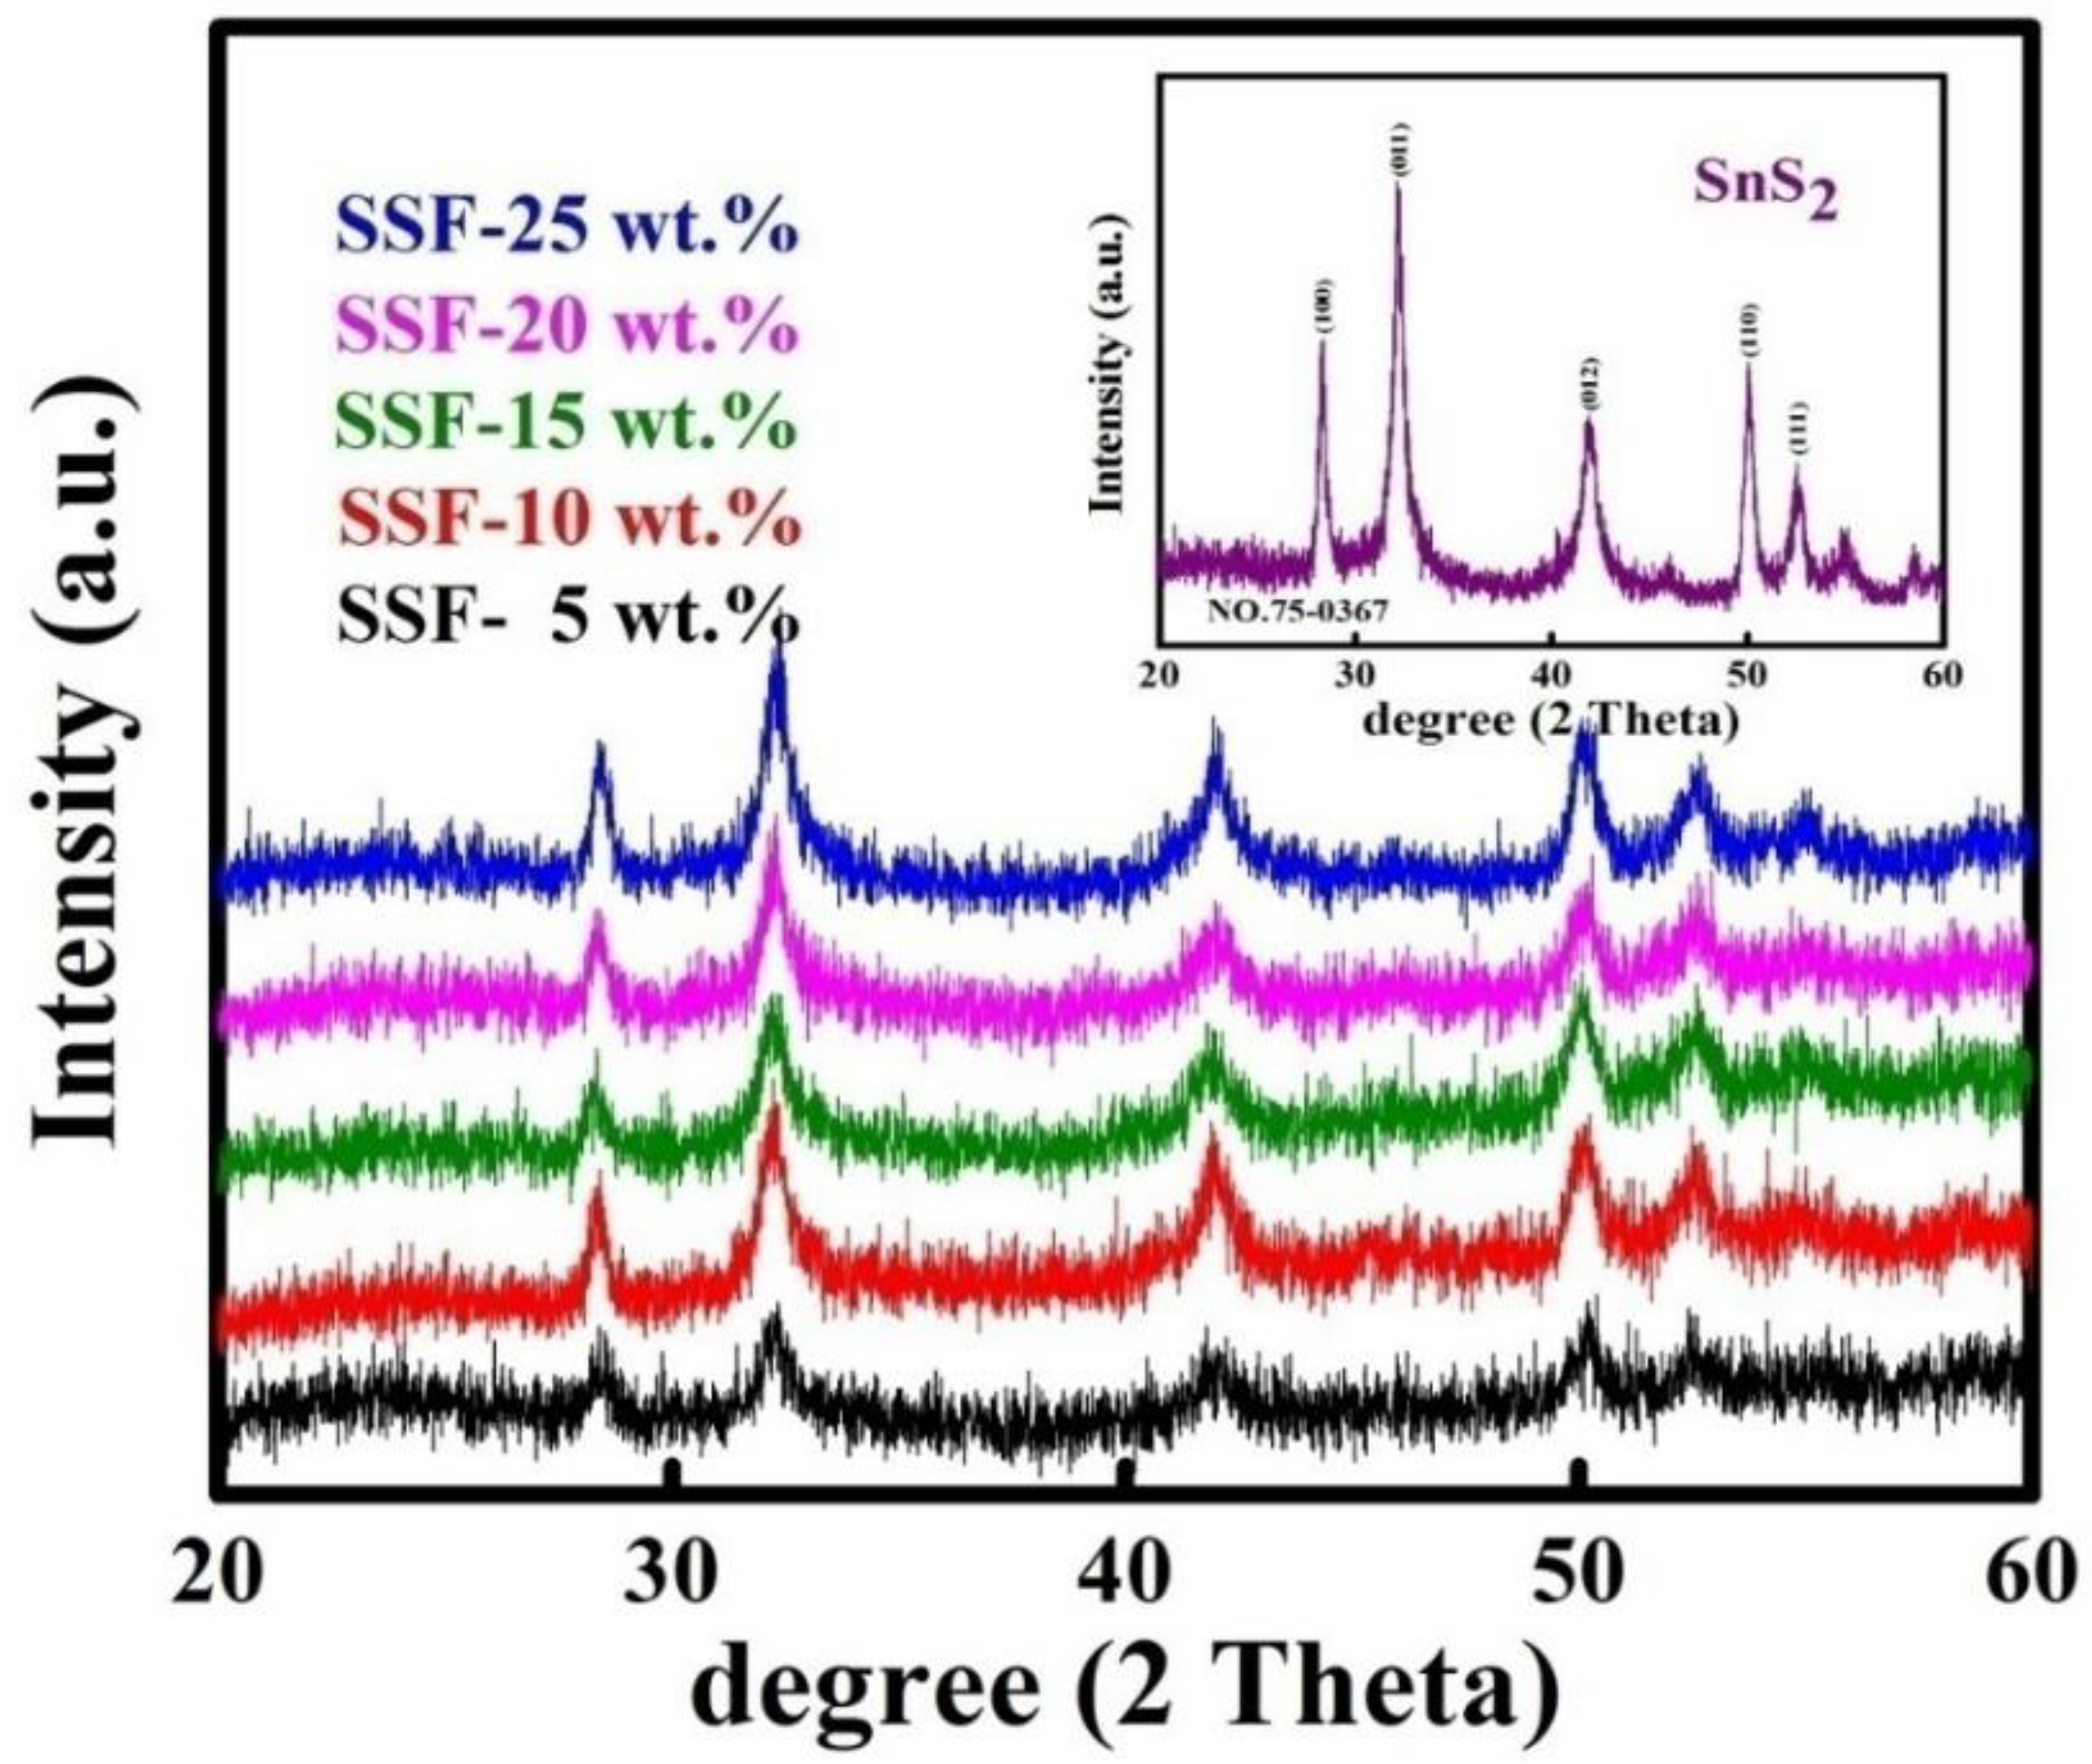
3.1. X-Ray Diffraction
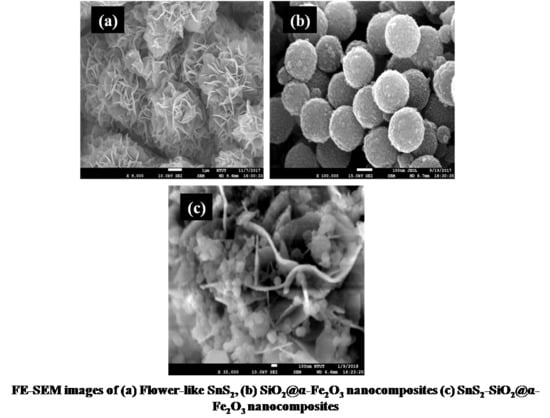
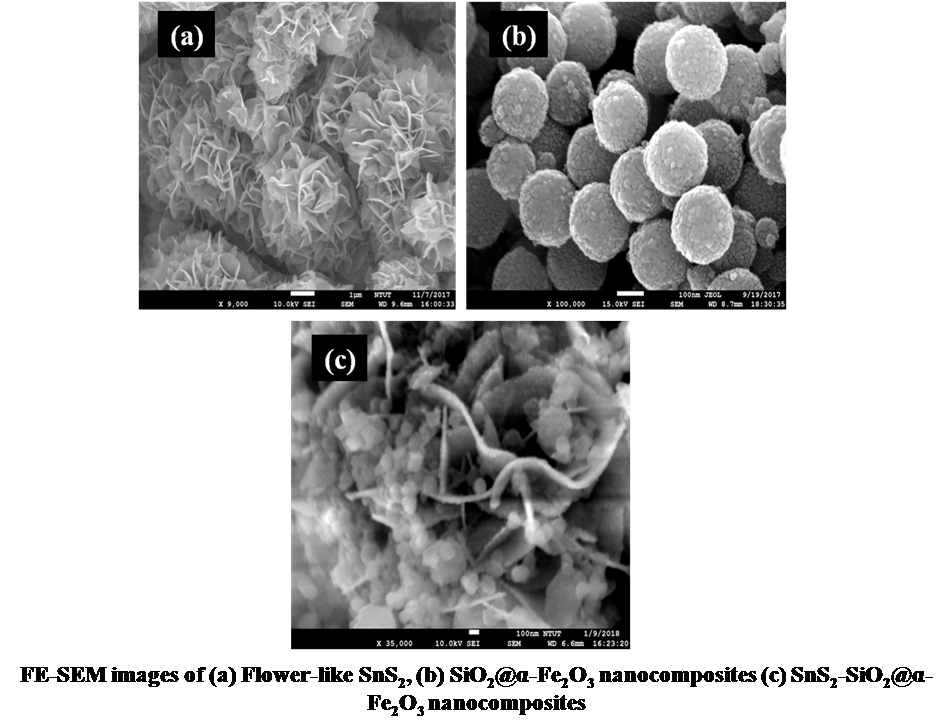
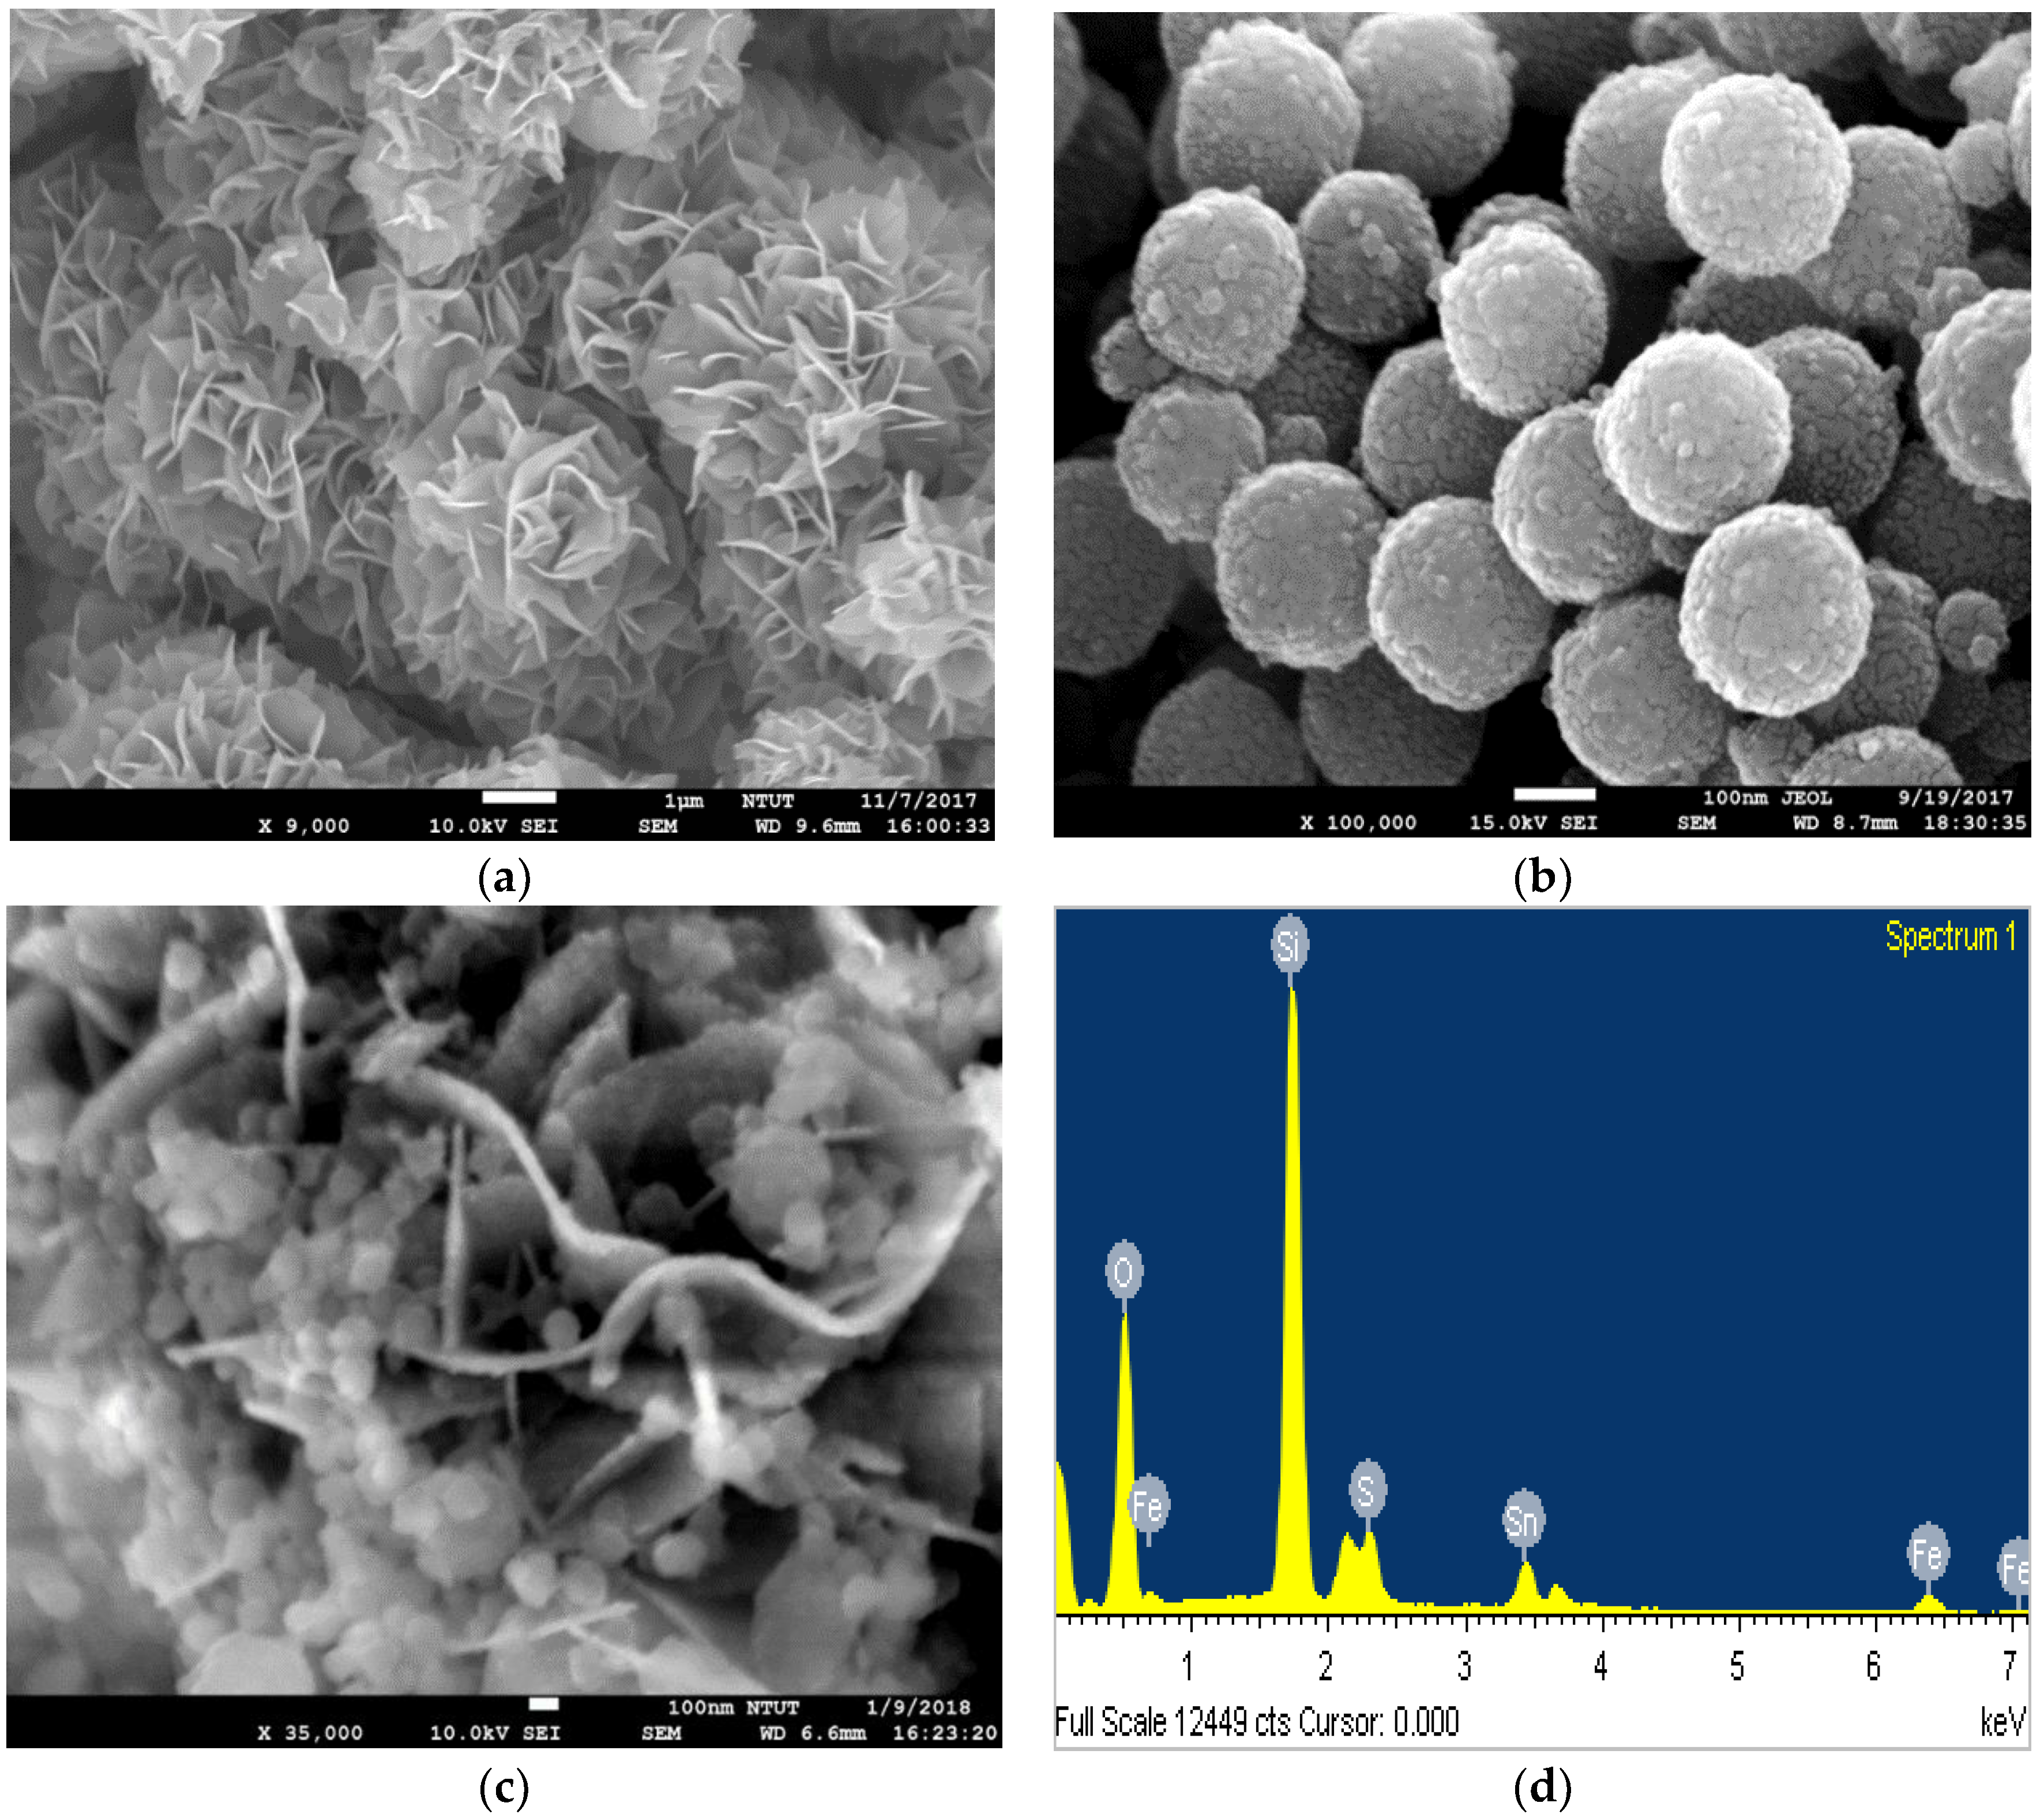
3.2. FE-SEM Structure
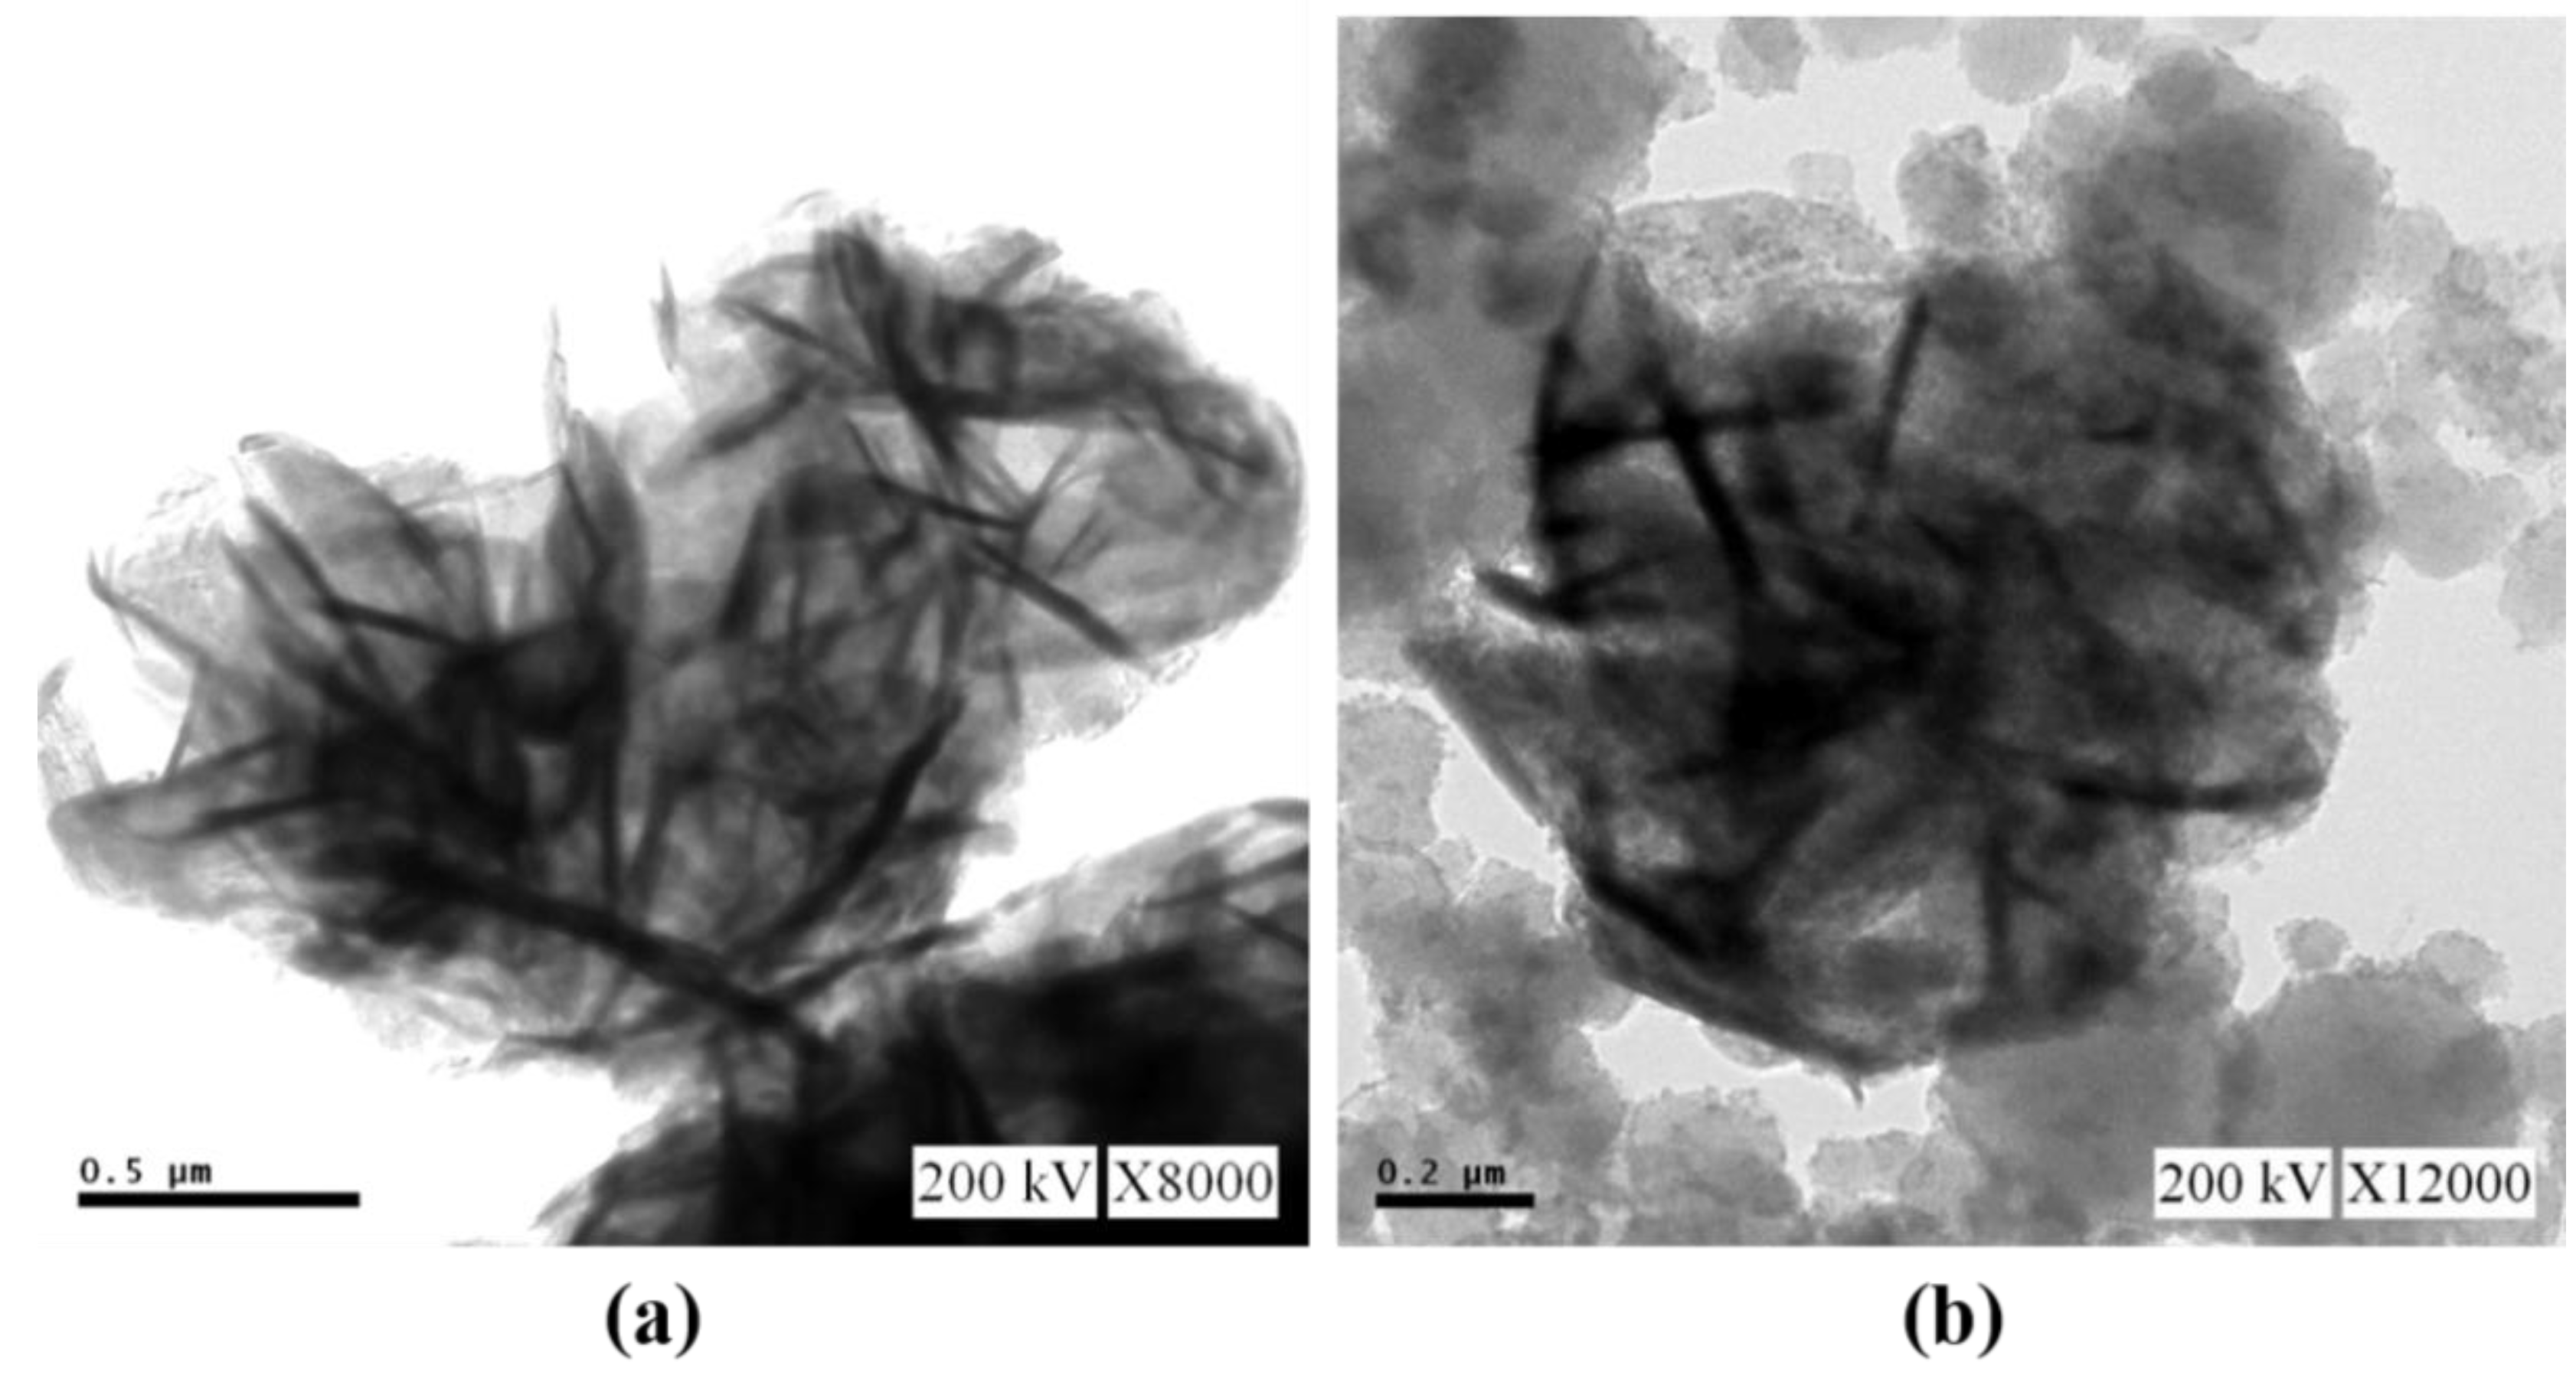
3.3. TEM
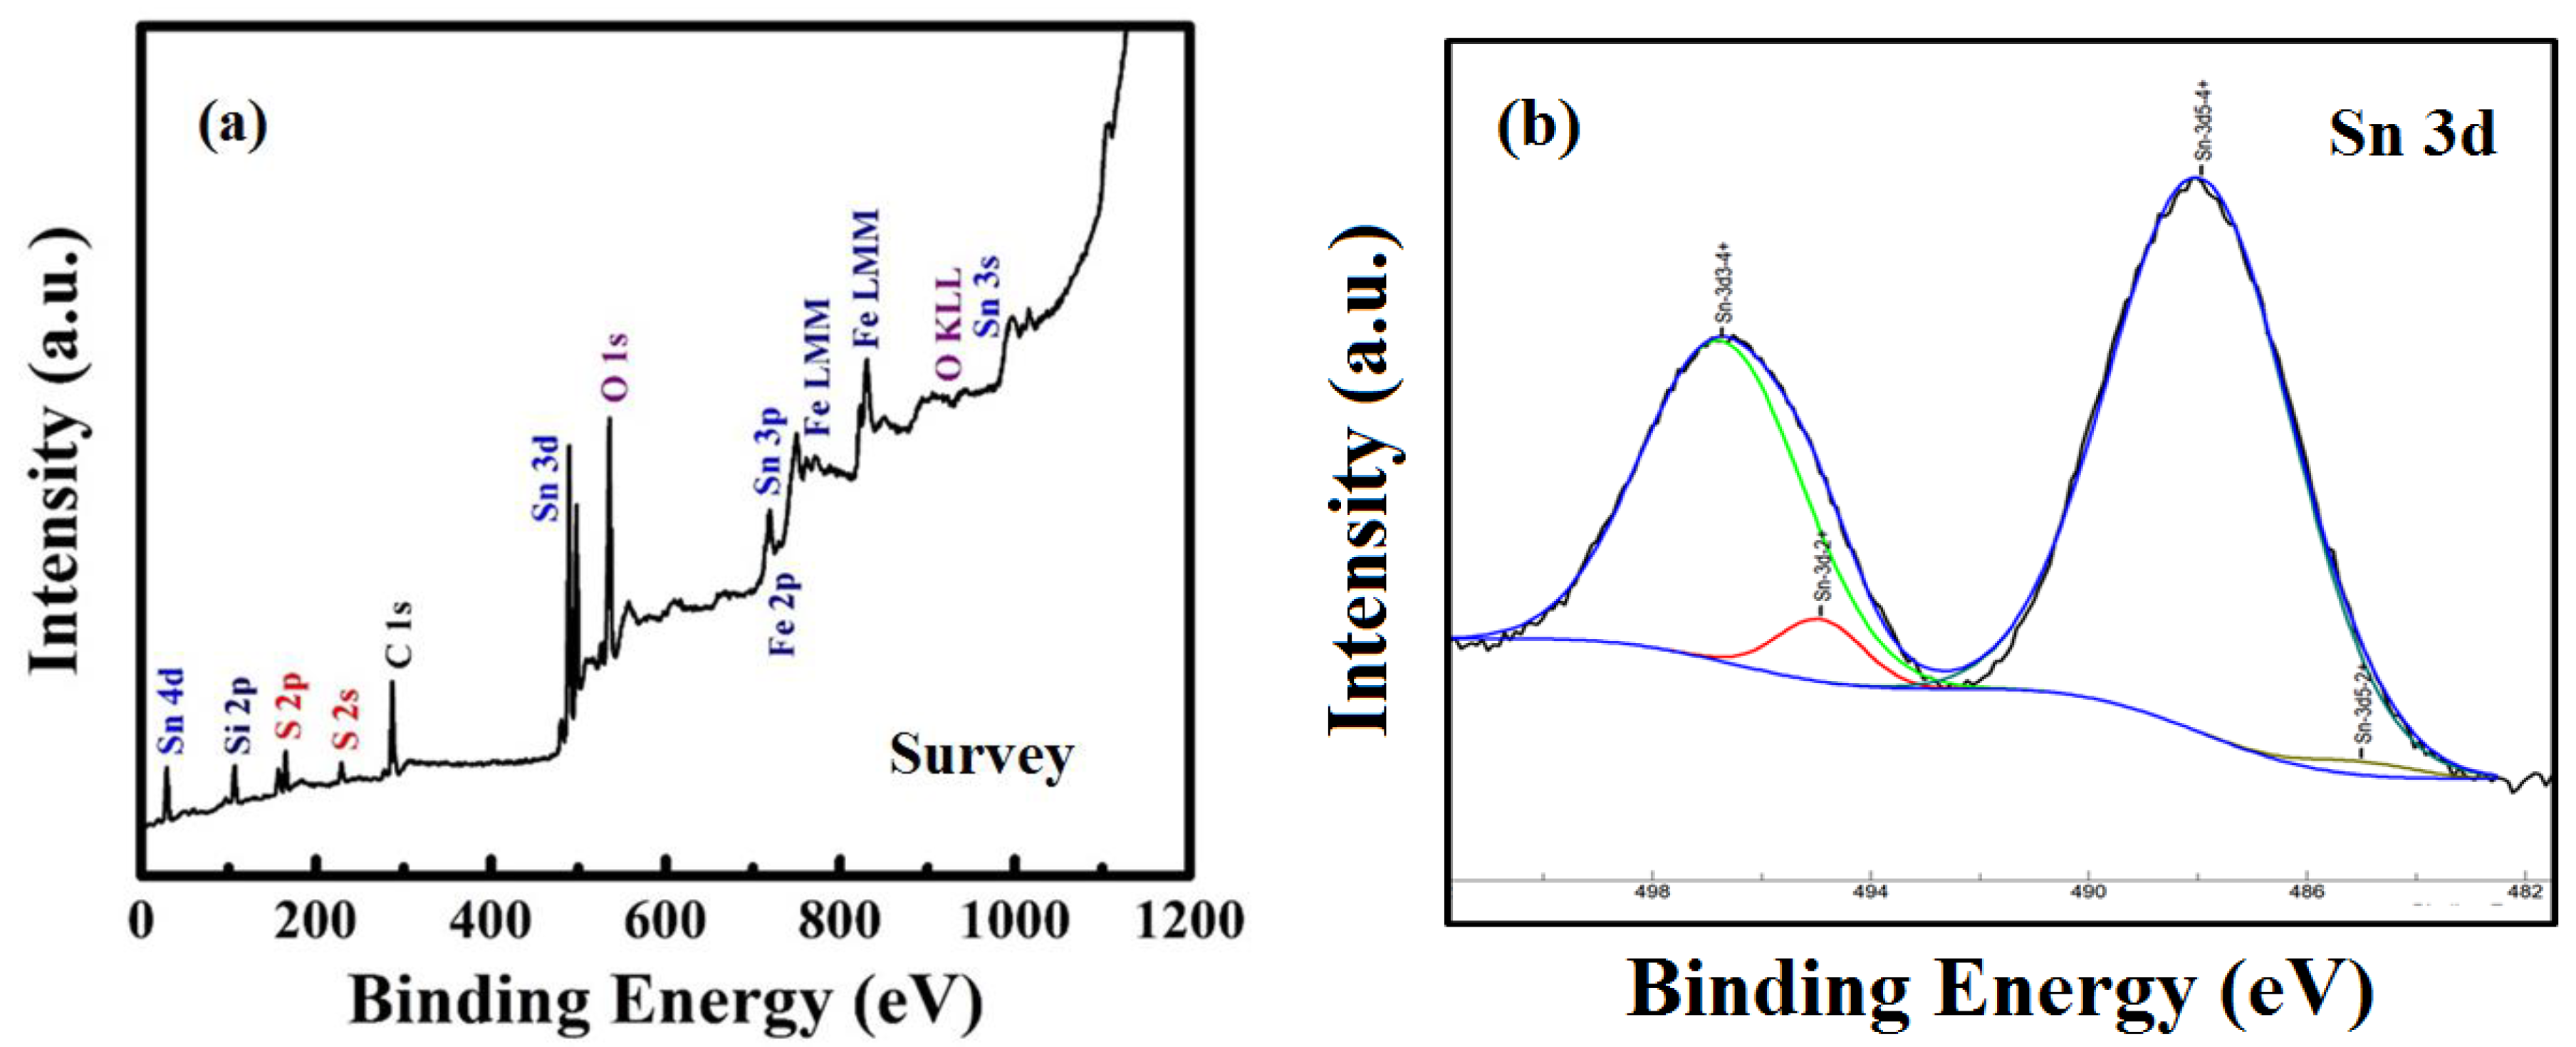
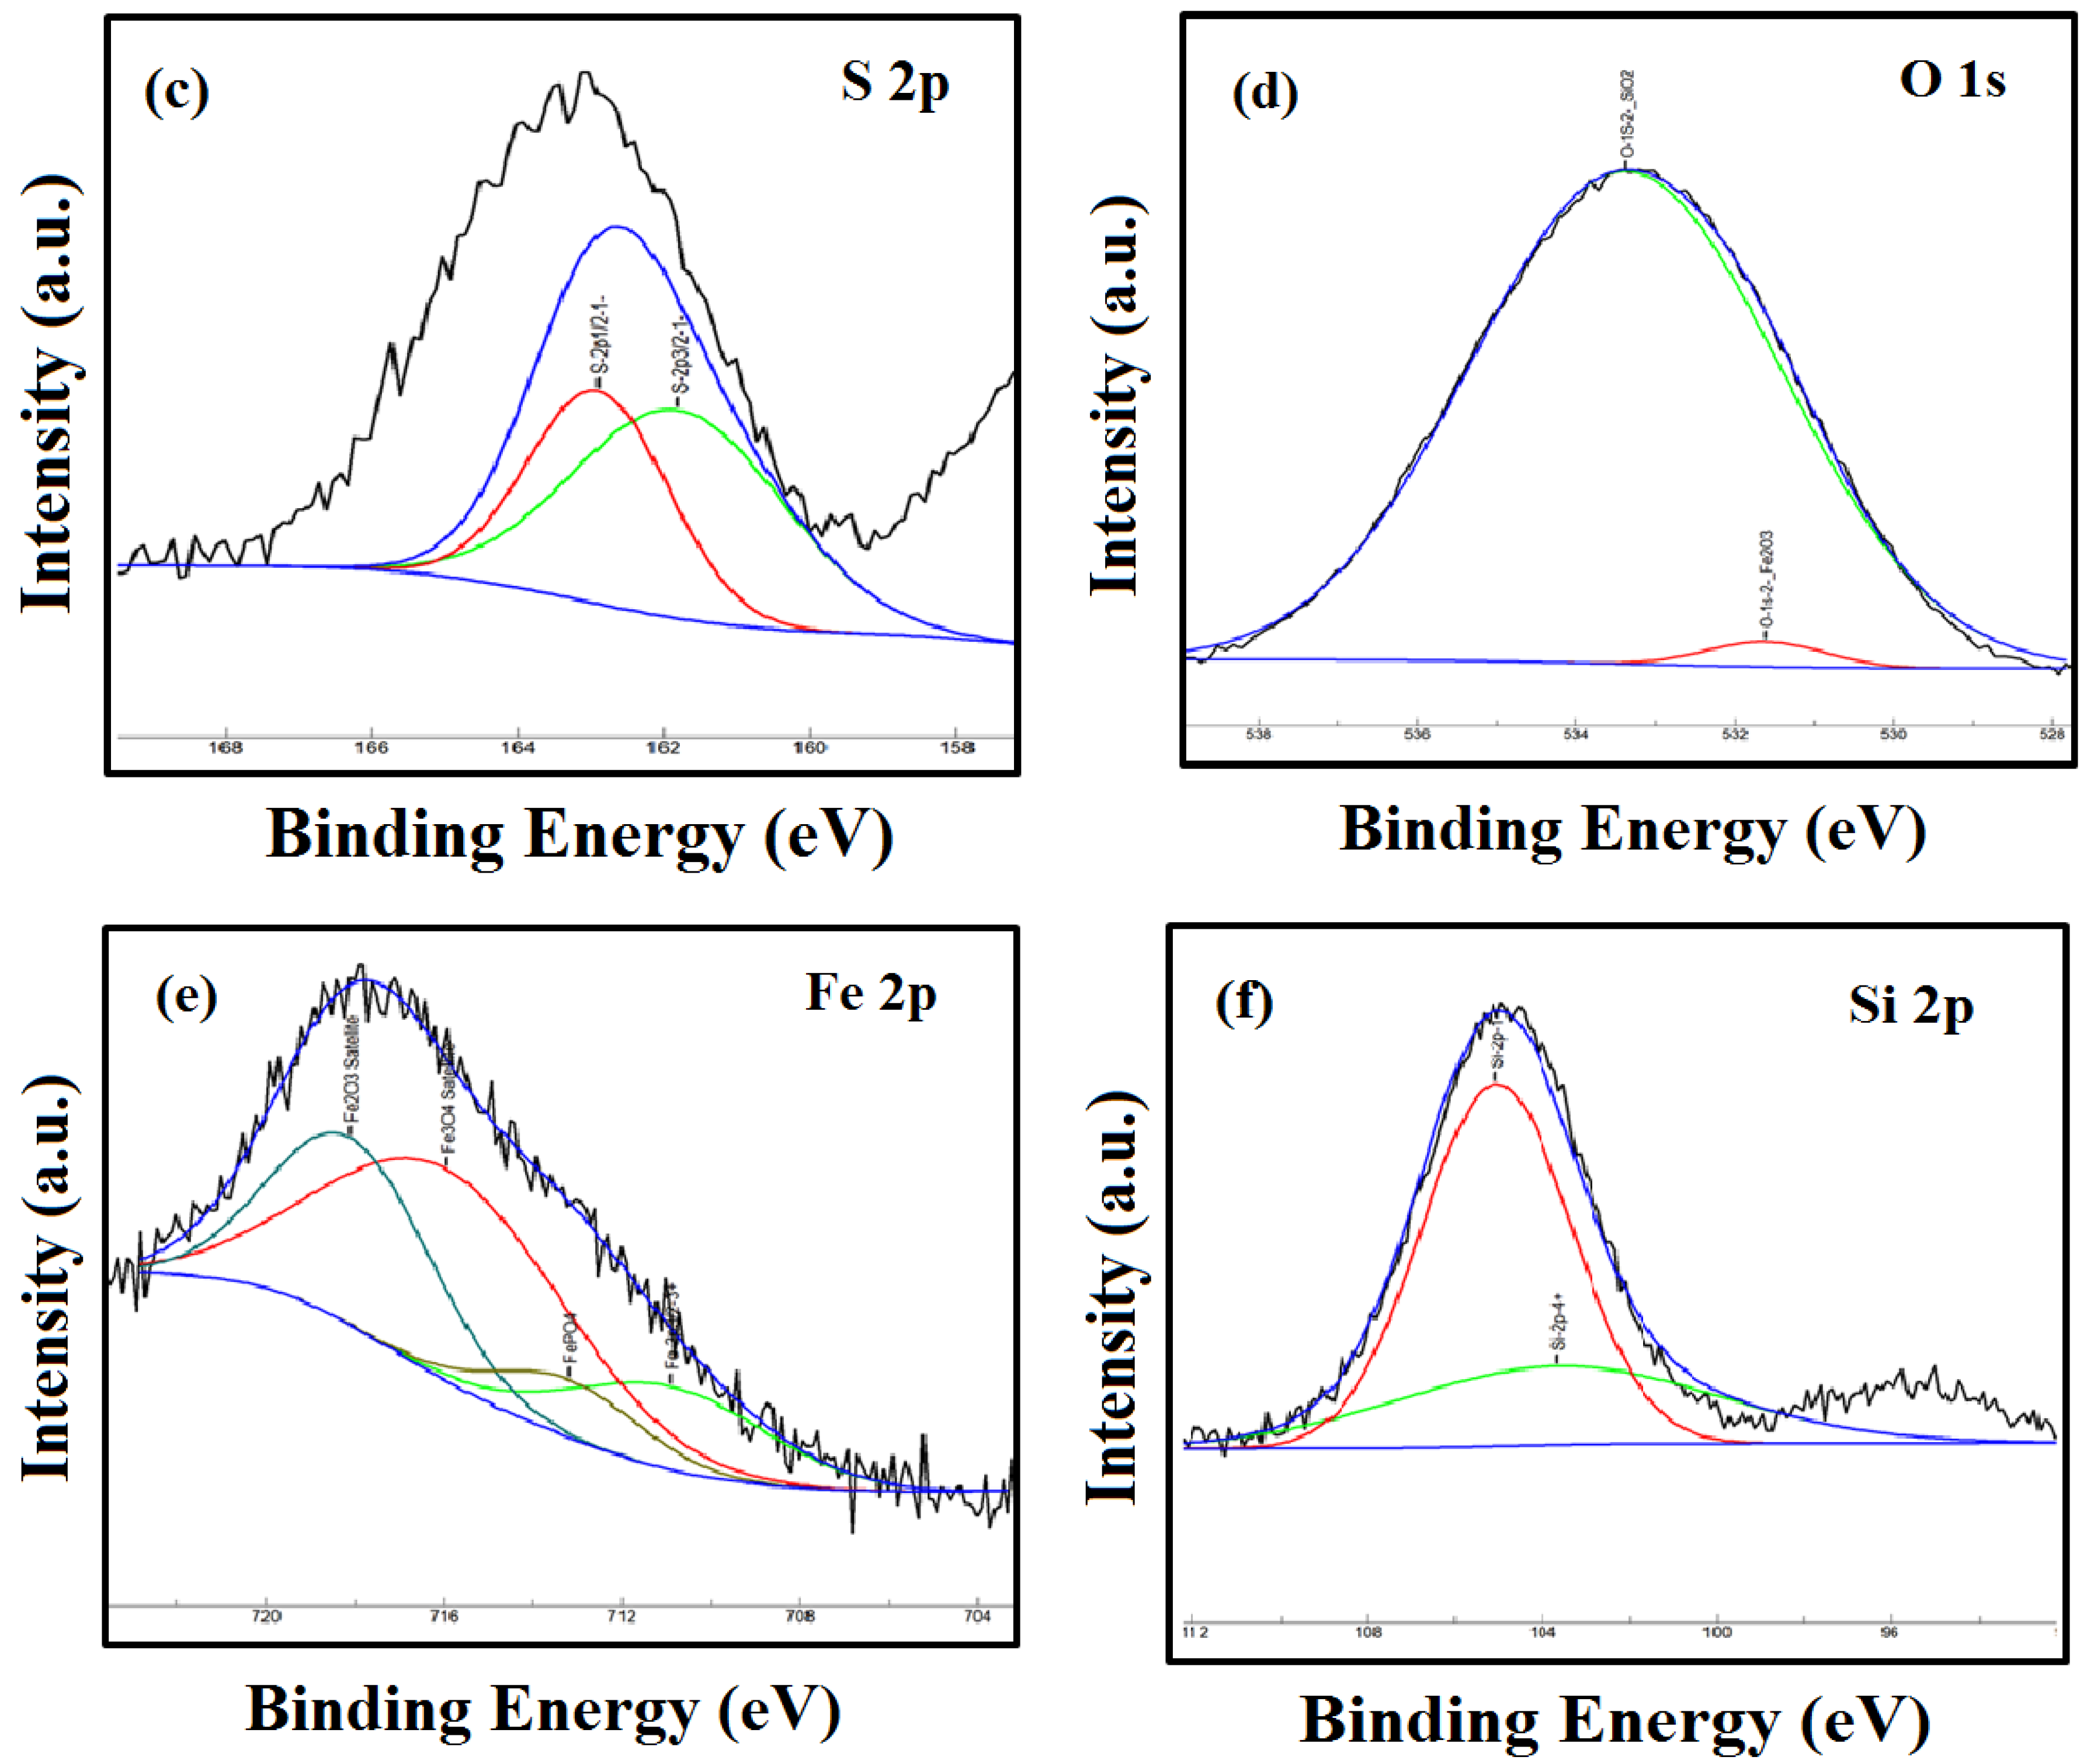
3.4. XPS
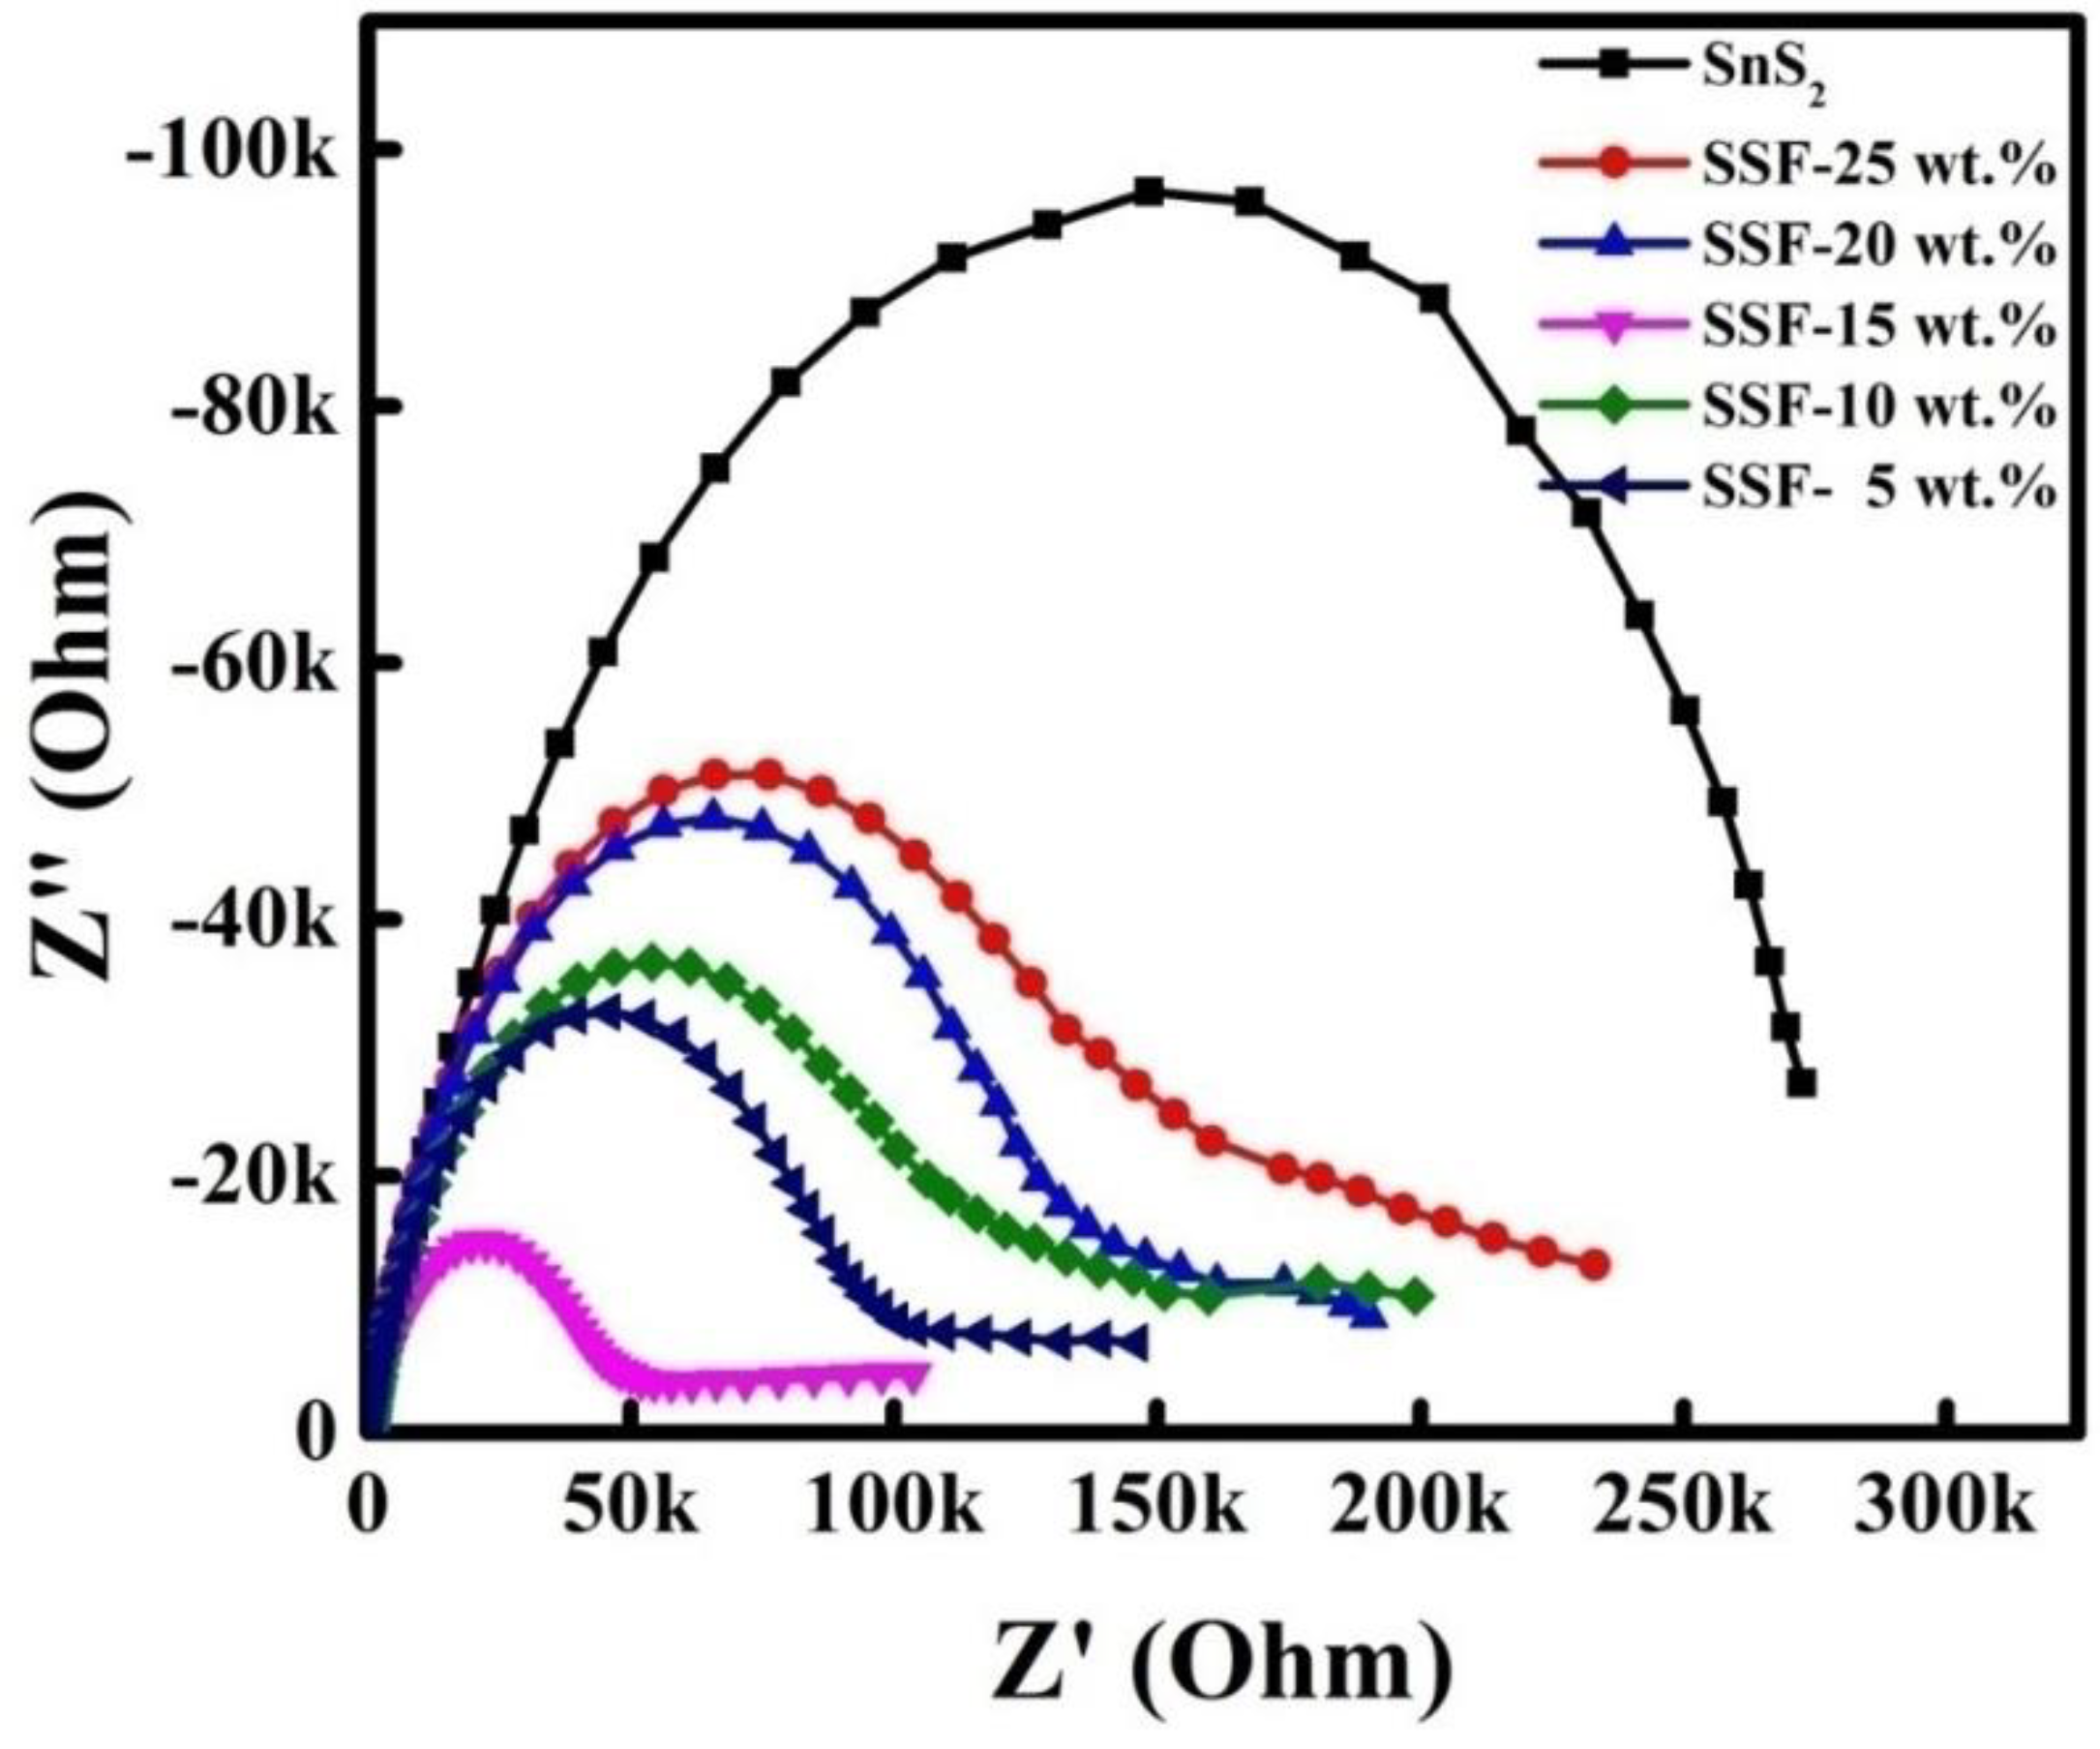
3.5. EIS Spectra
3.6. UV–Vis DRS Spectra
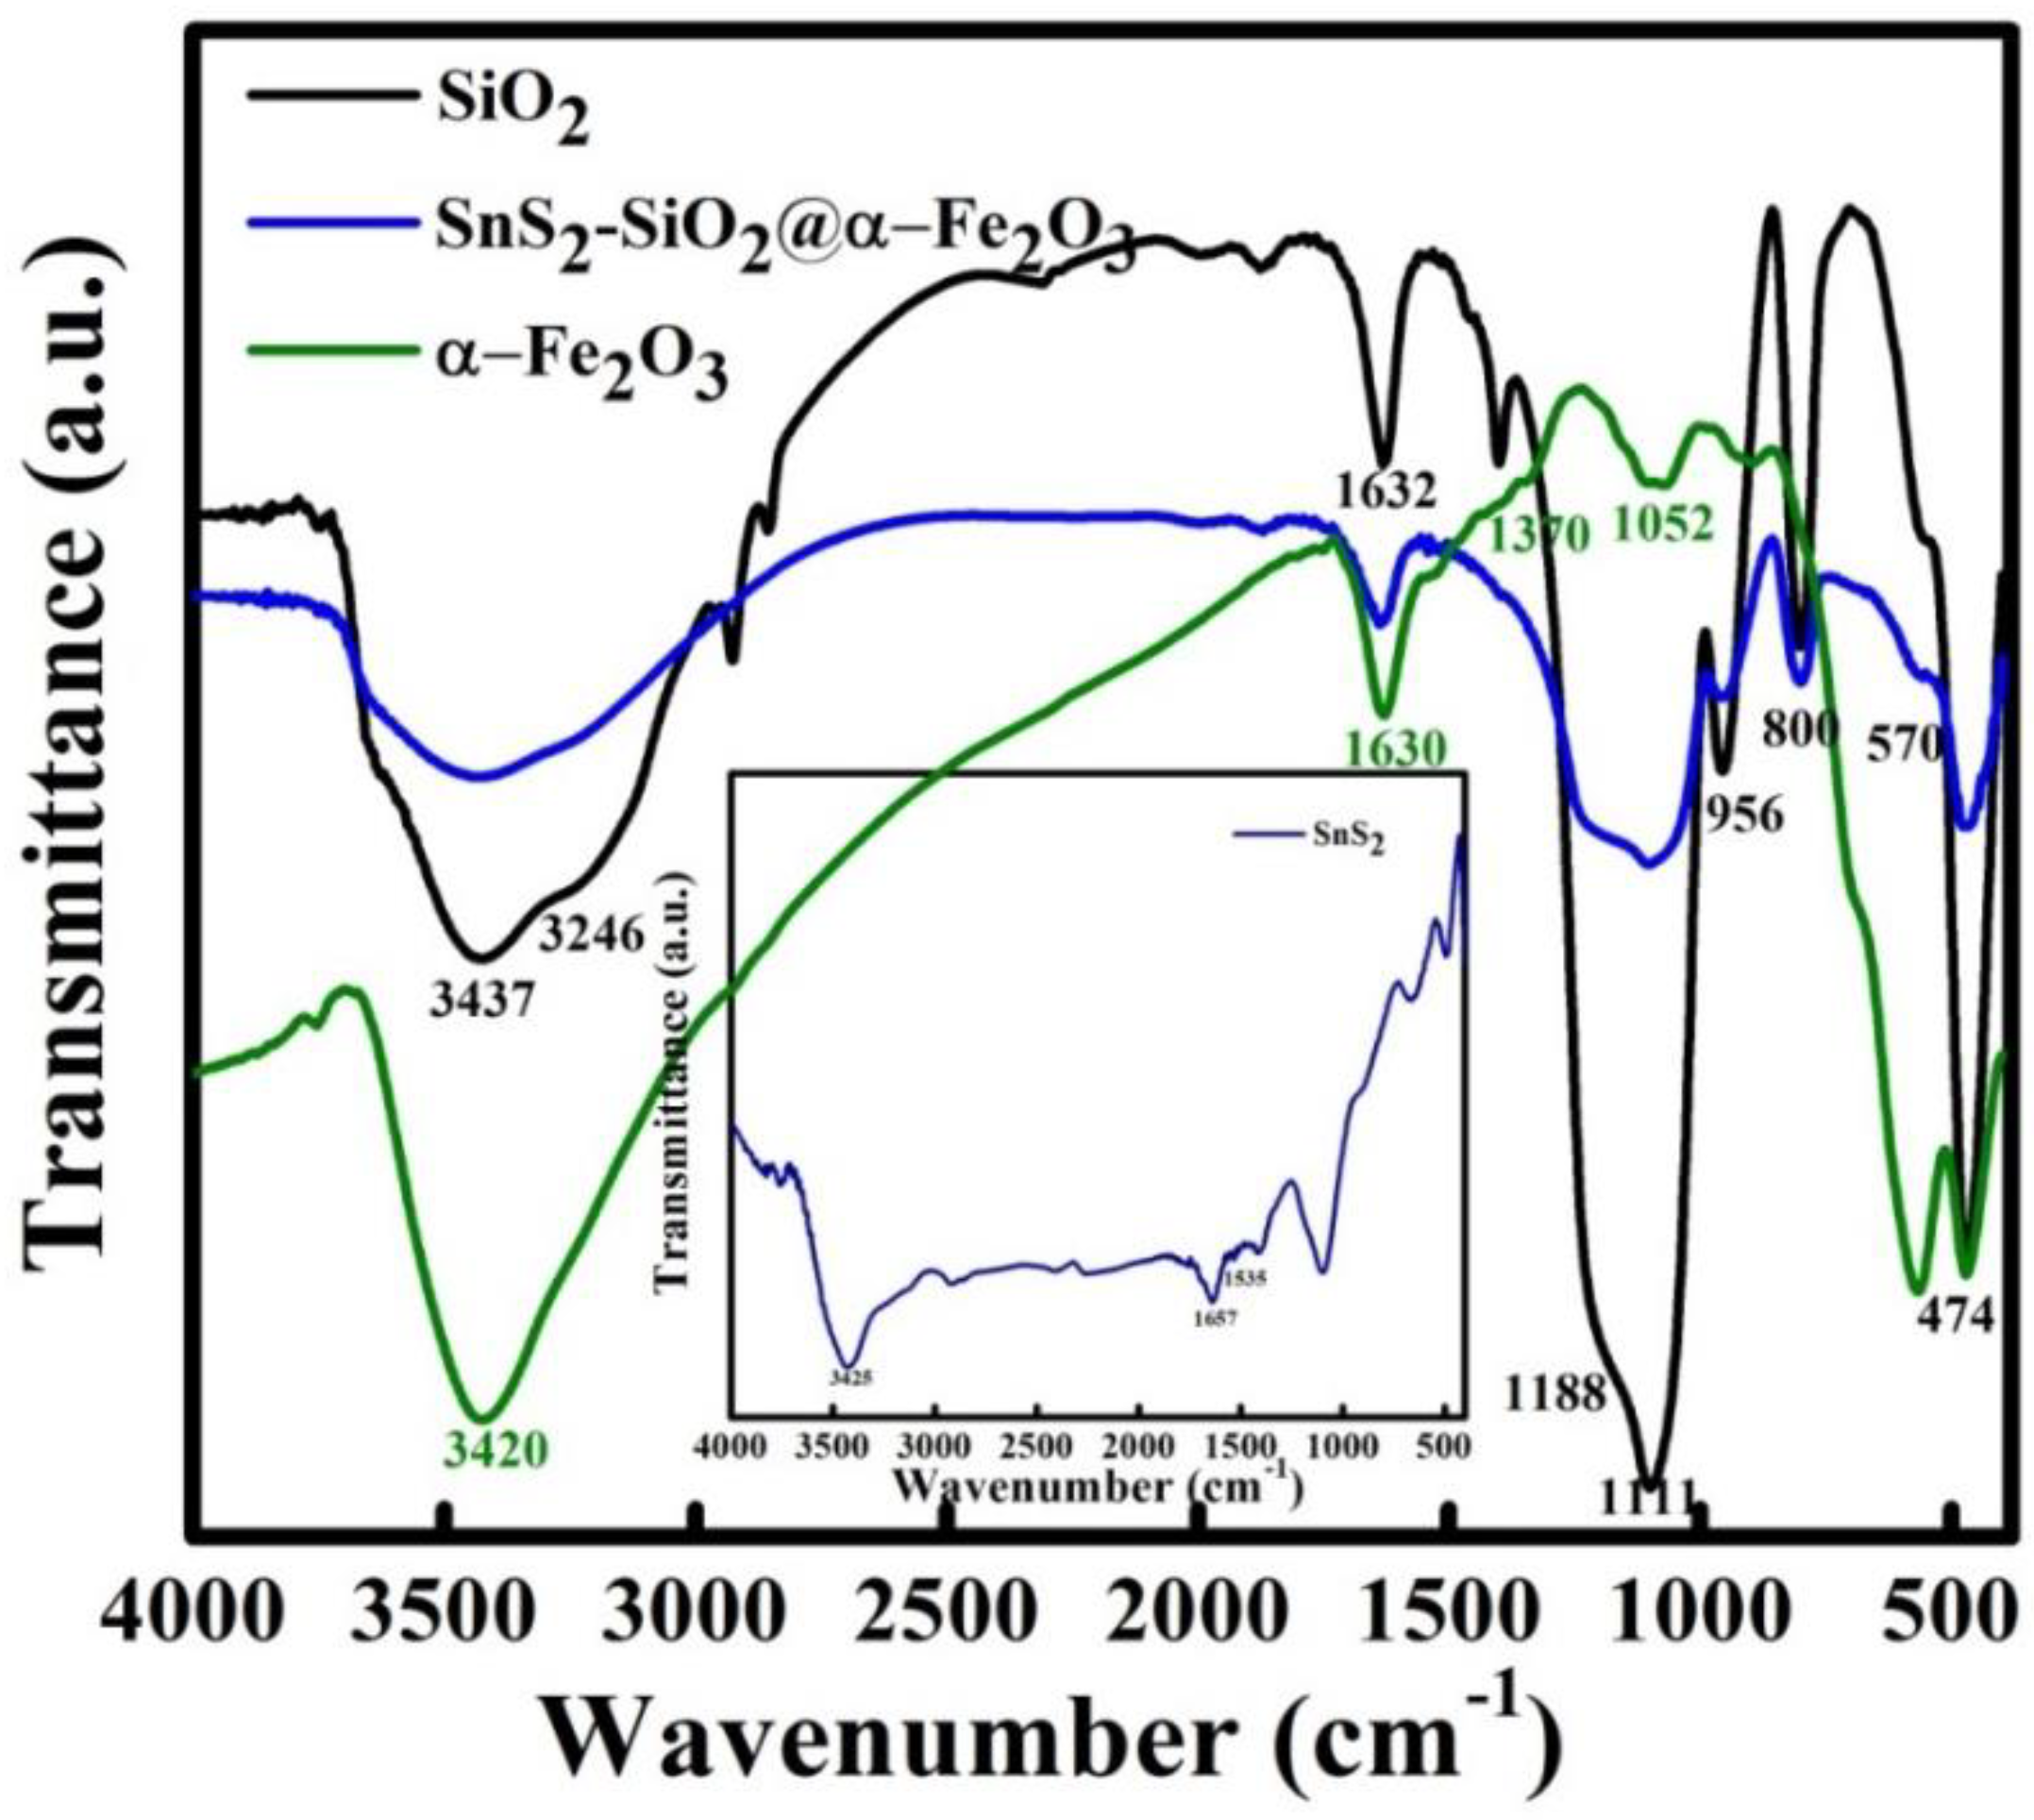
3.7. FTIR Spectra
3.8. Raman Spectroscopy
3.9. BET Surface
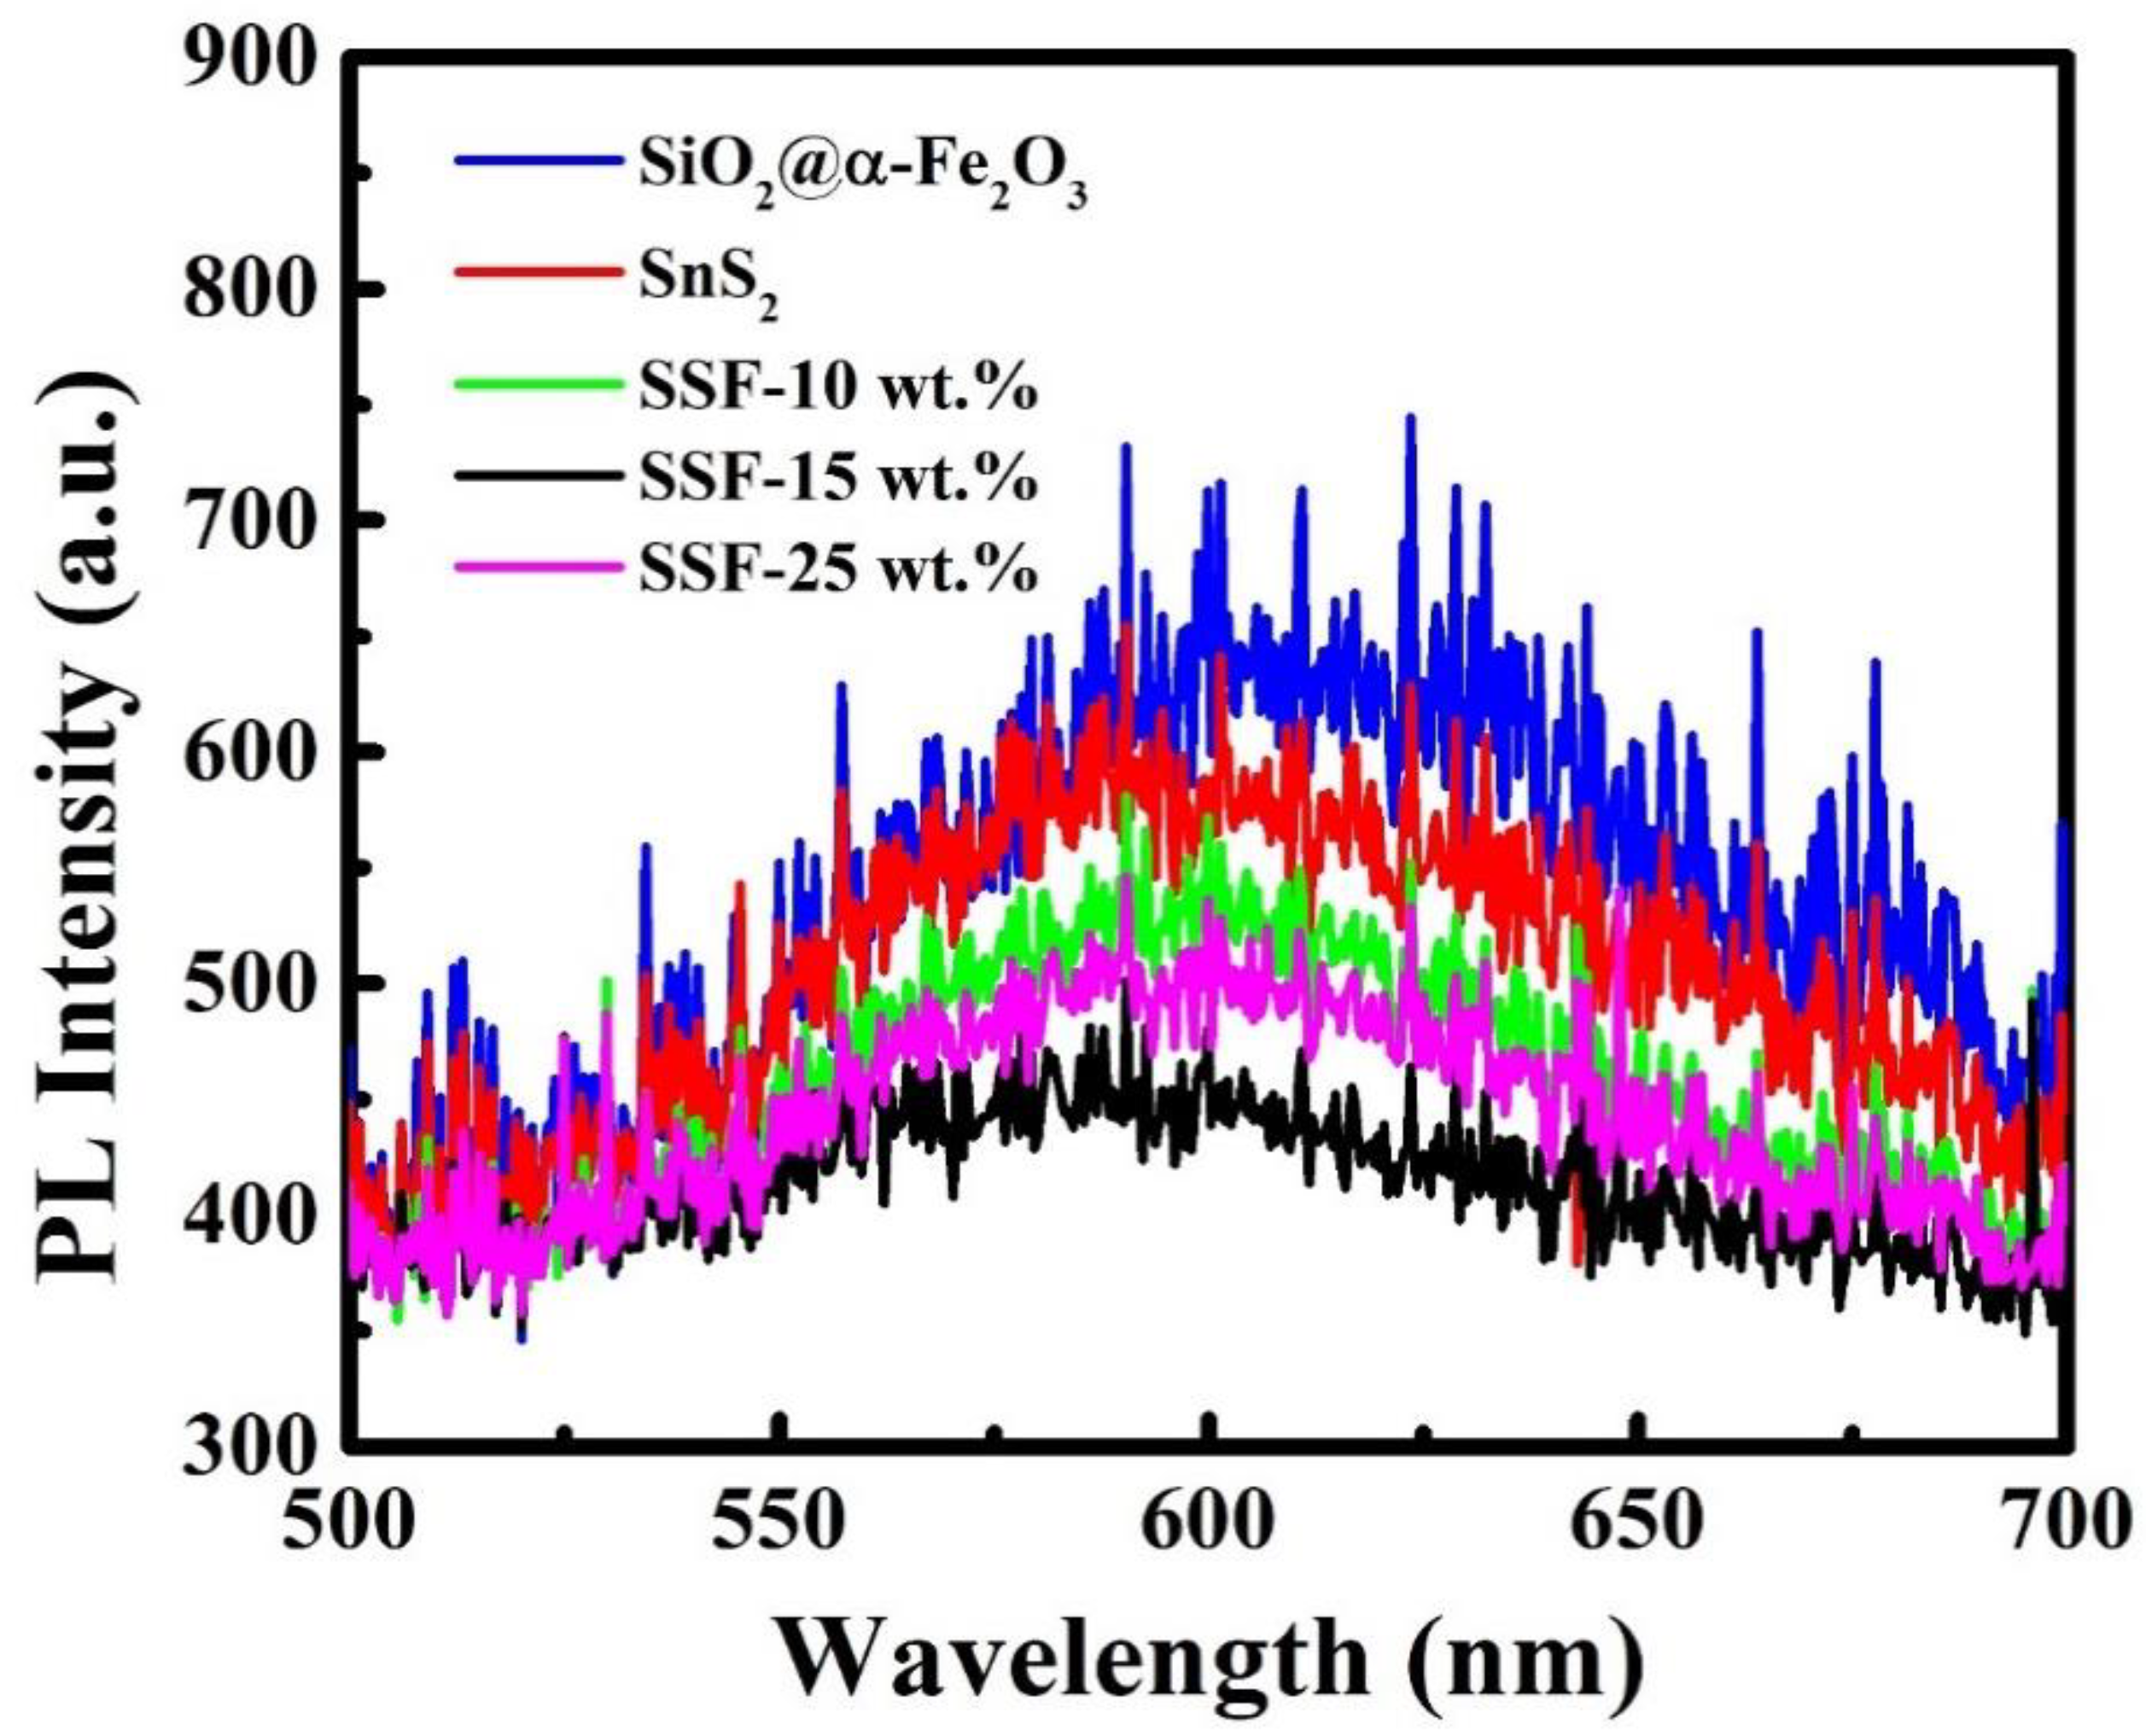
3.10. PL Measurement
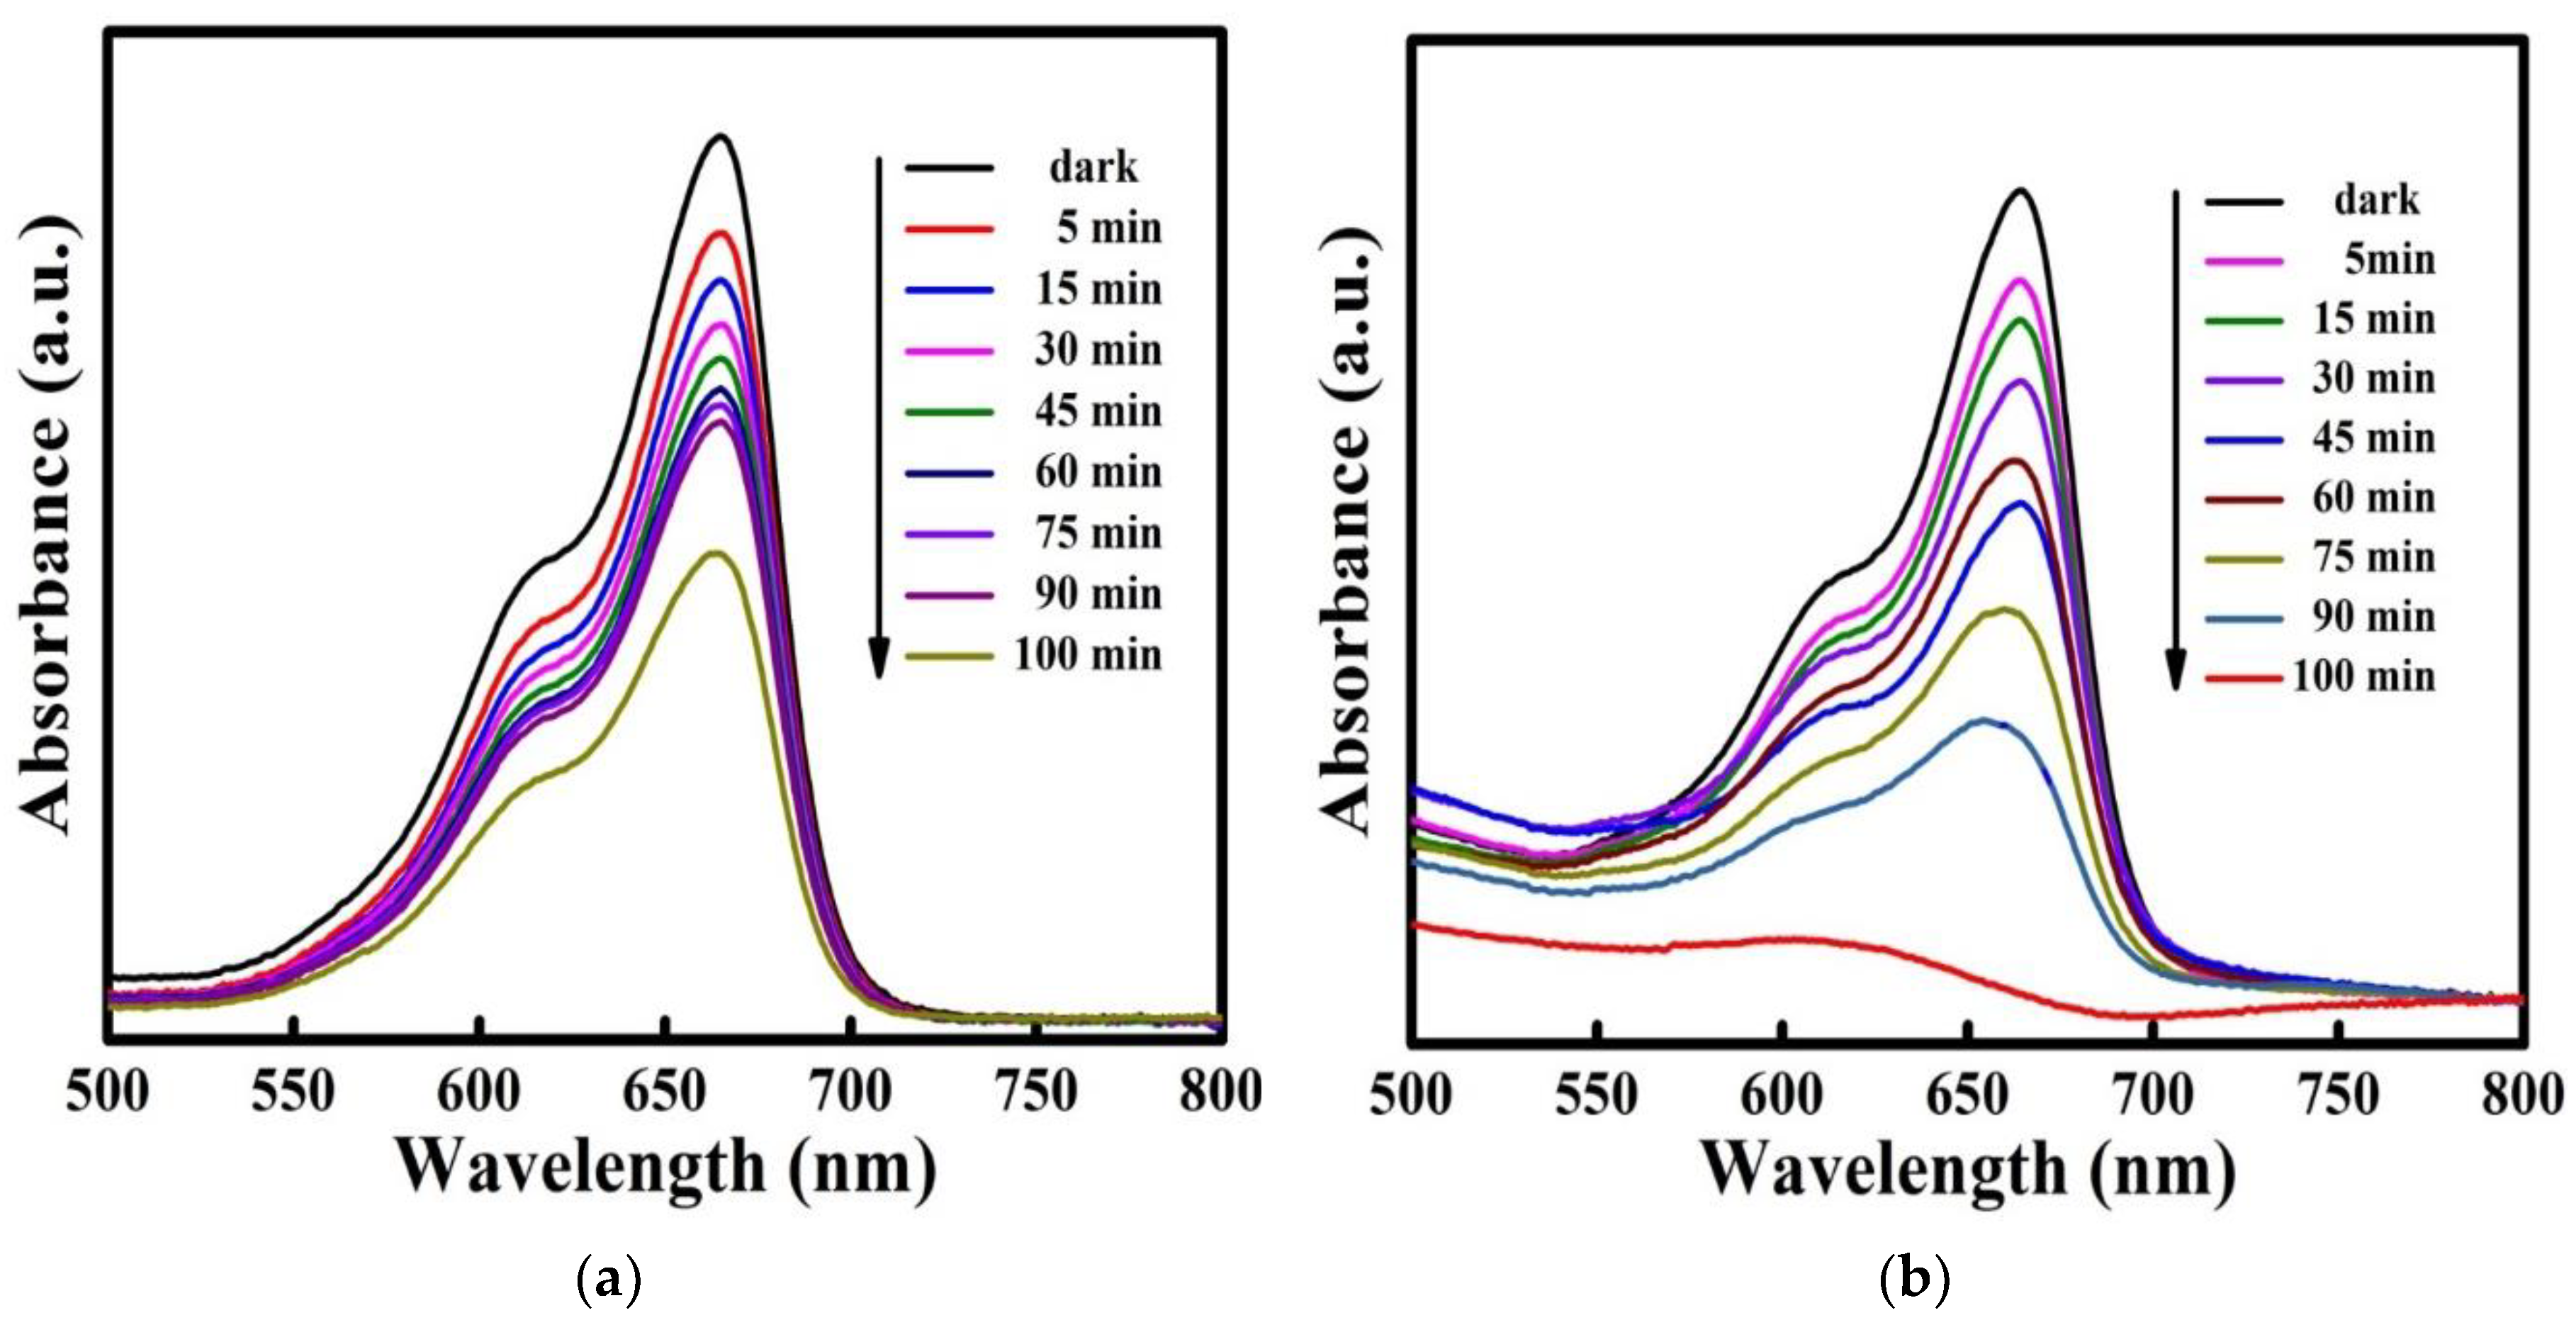
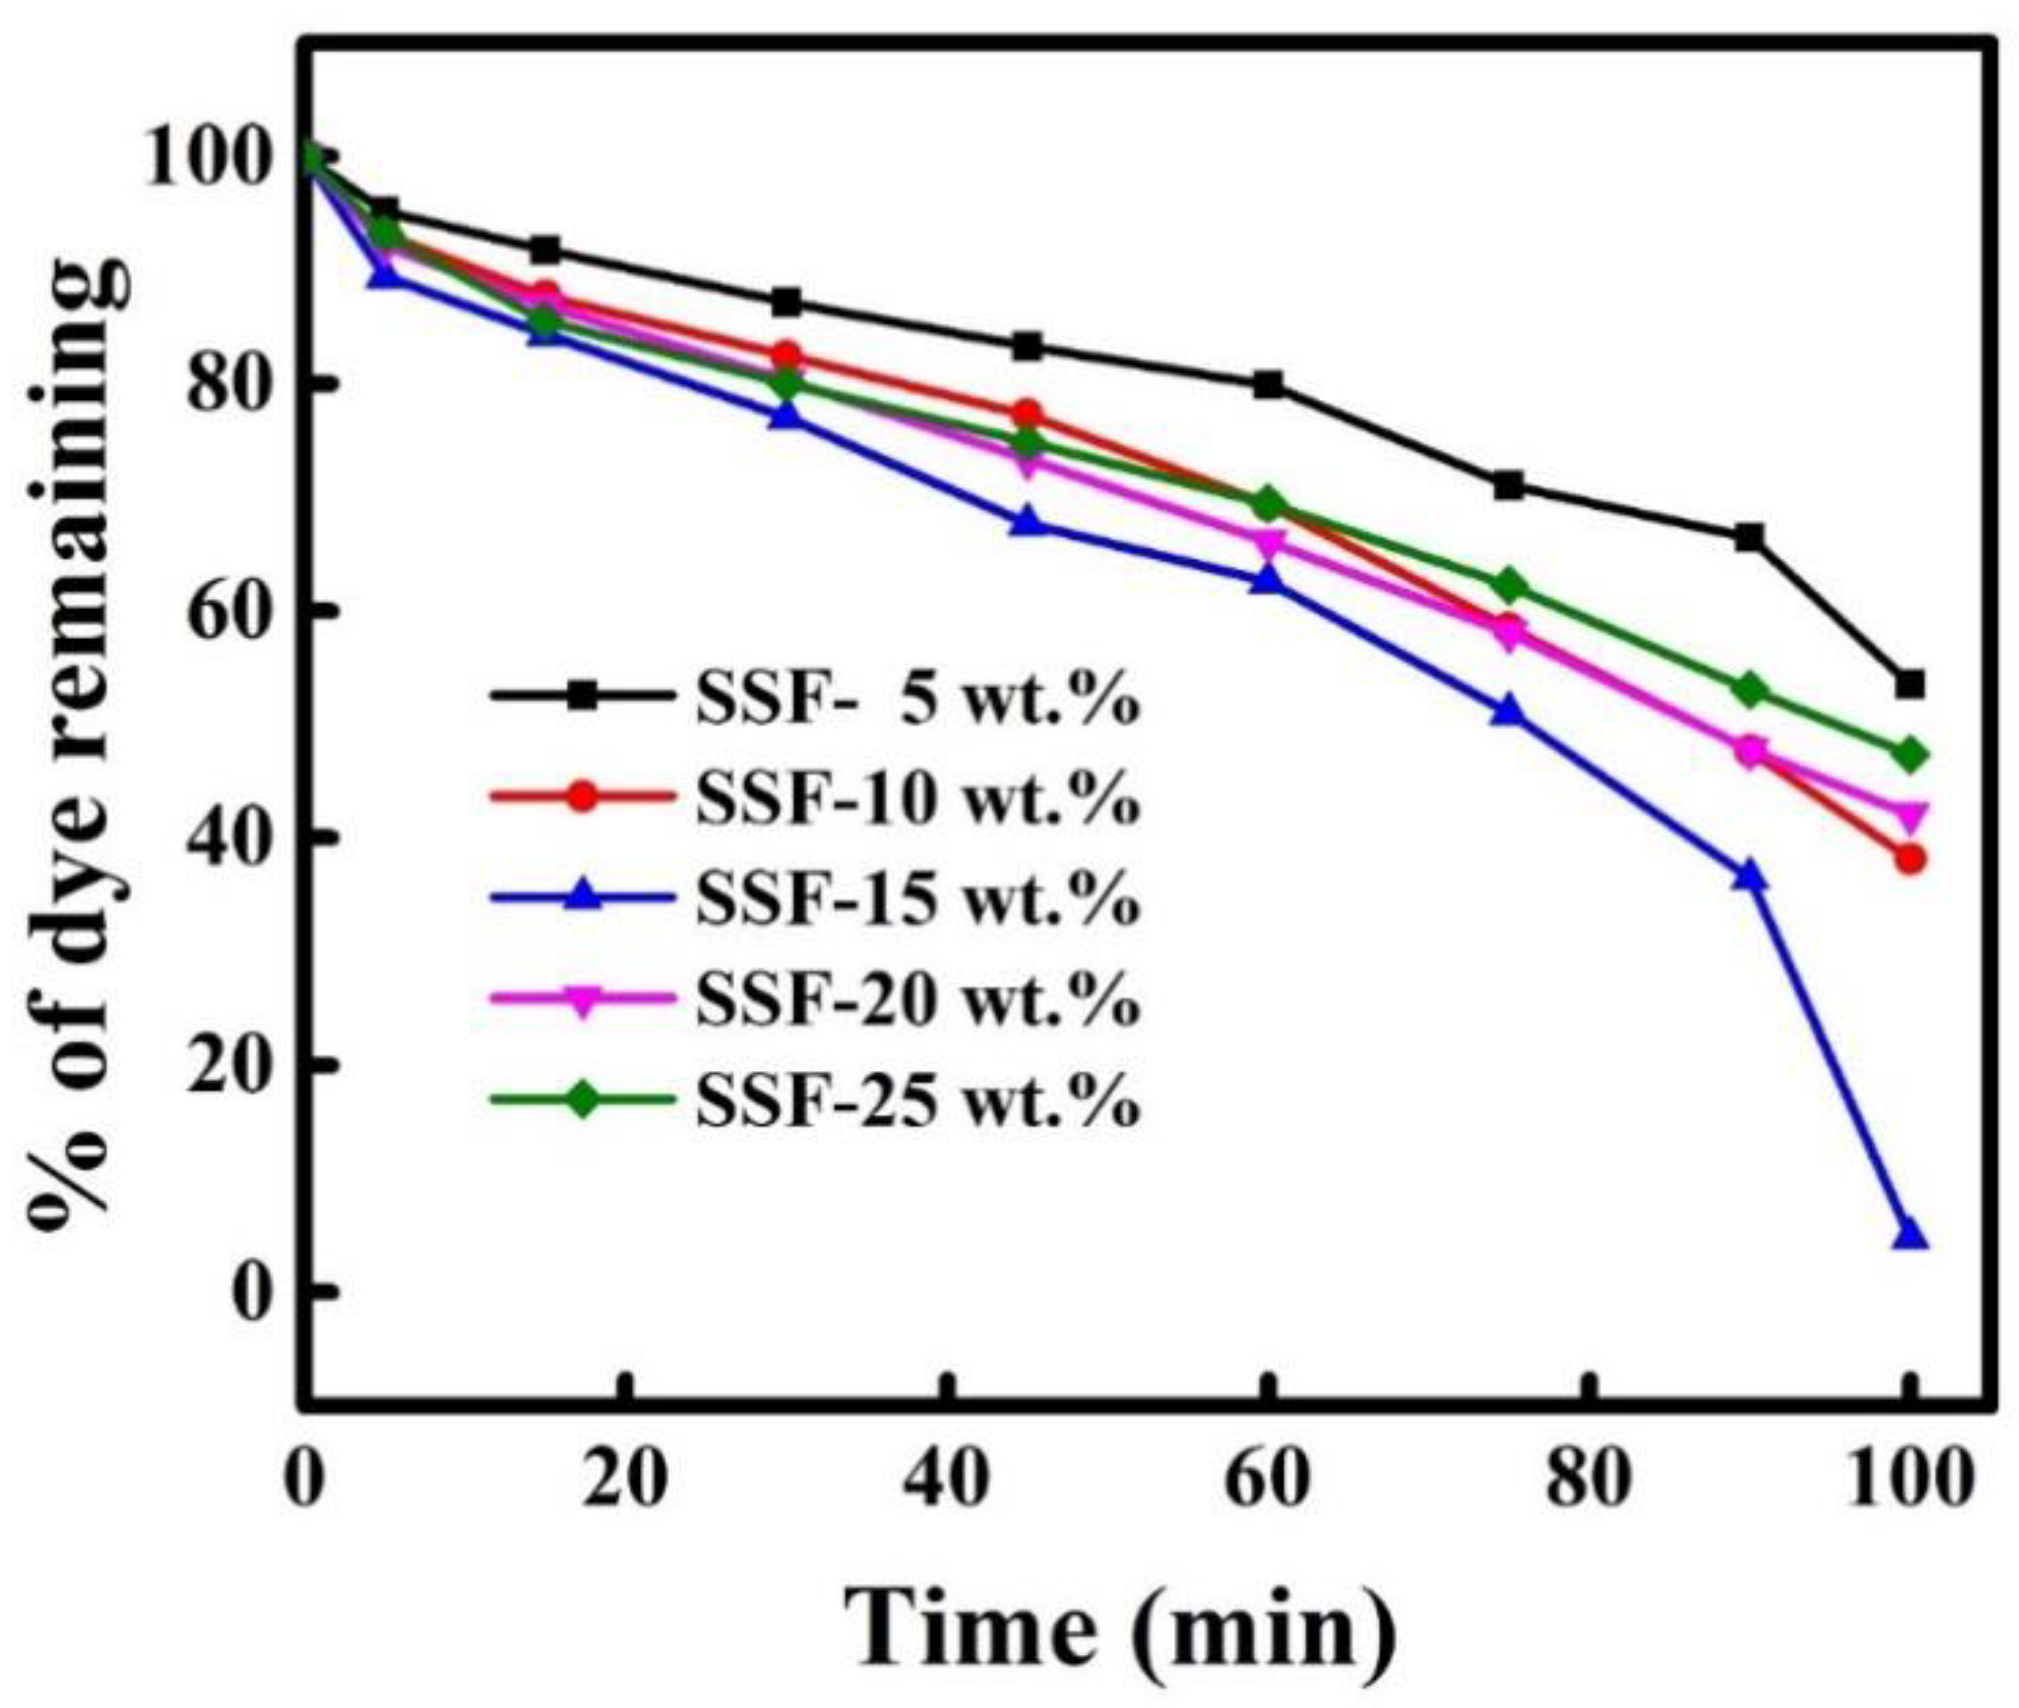
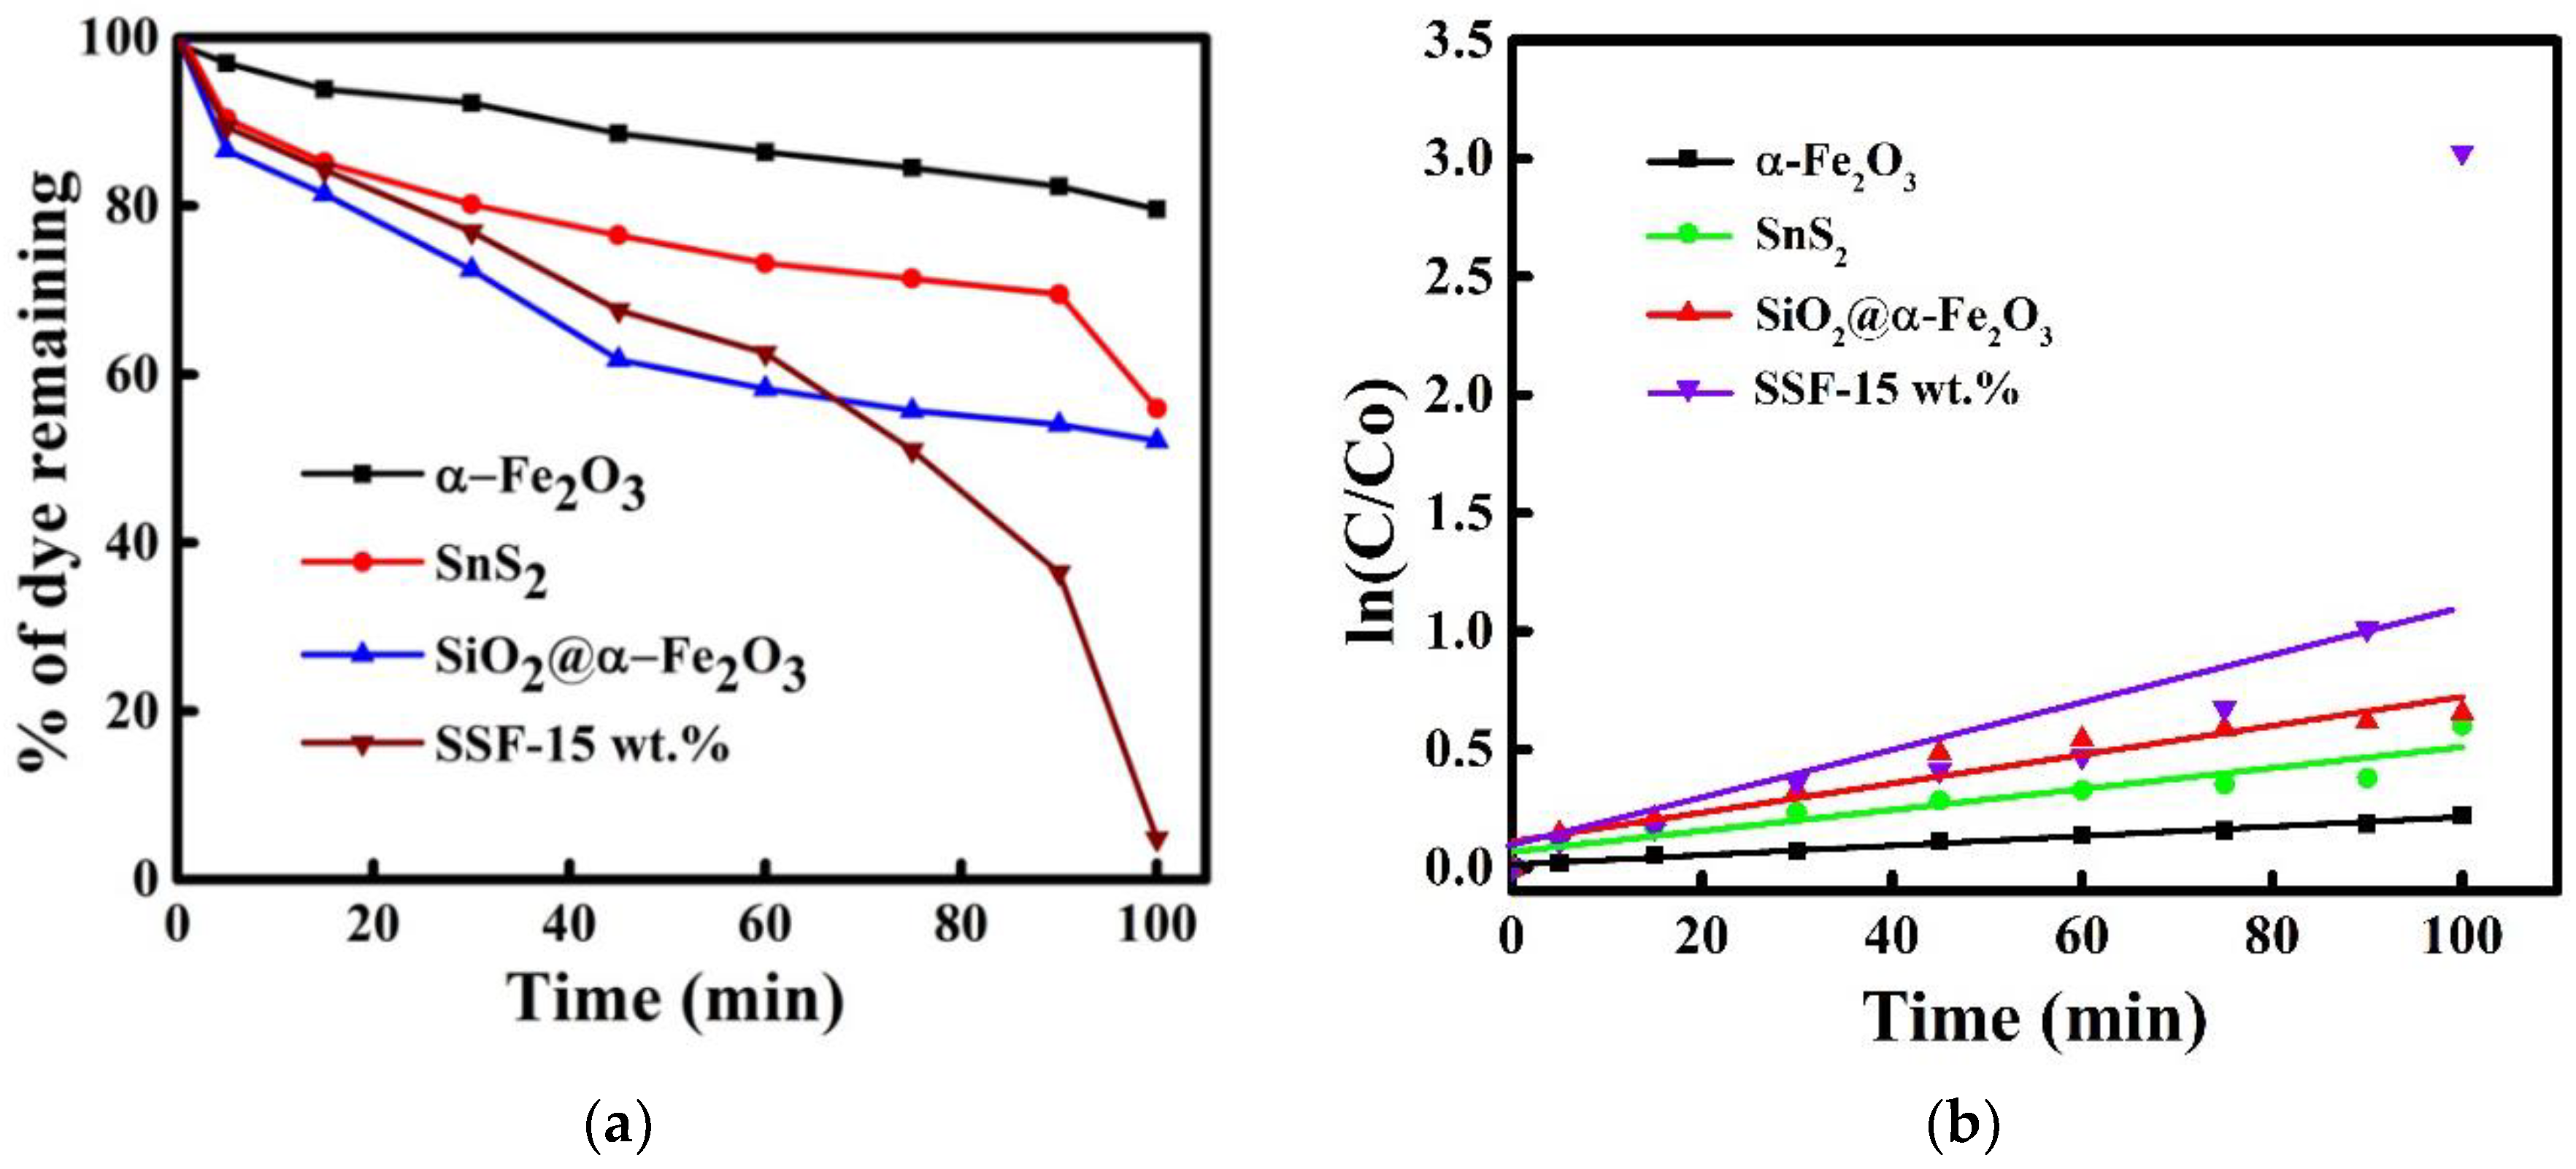
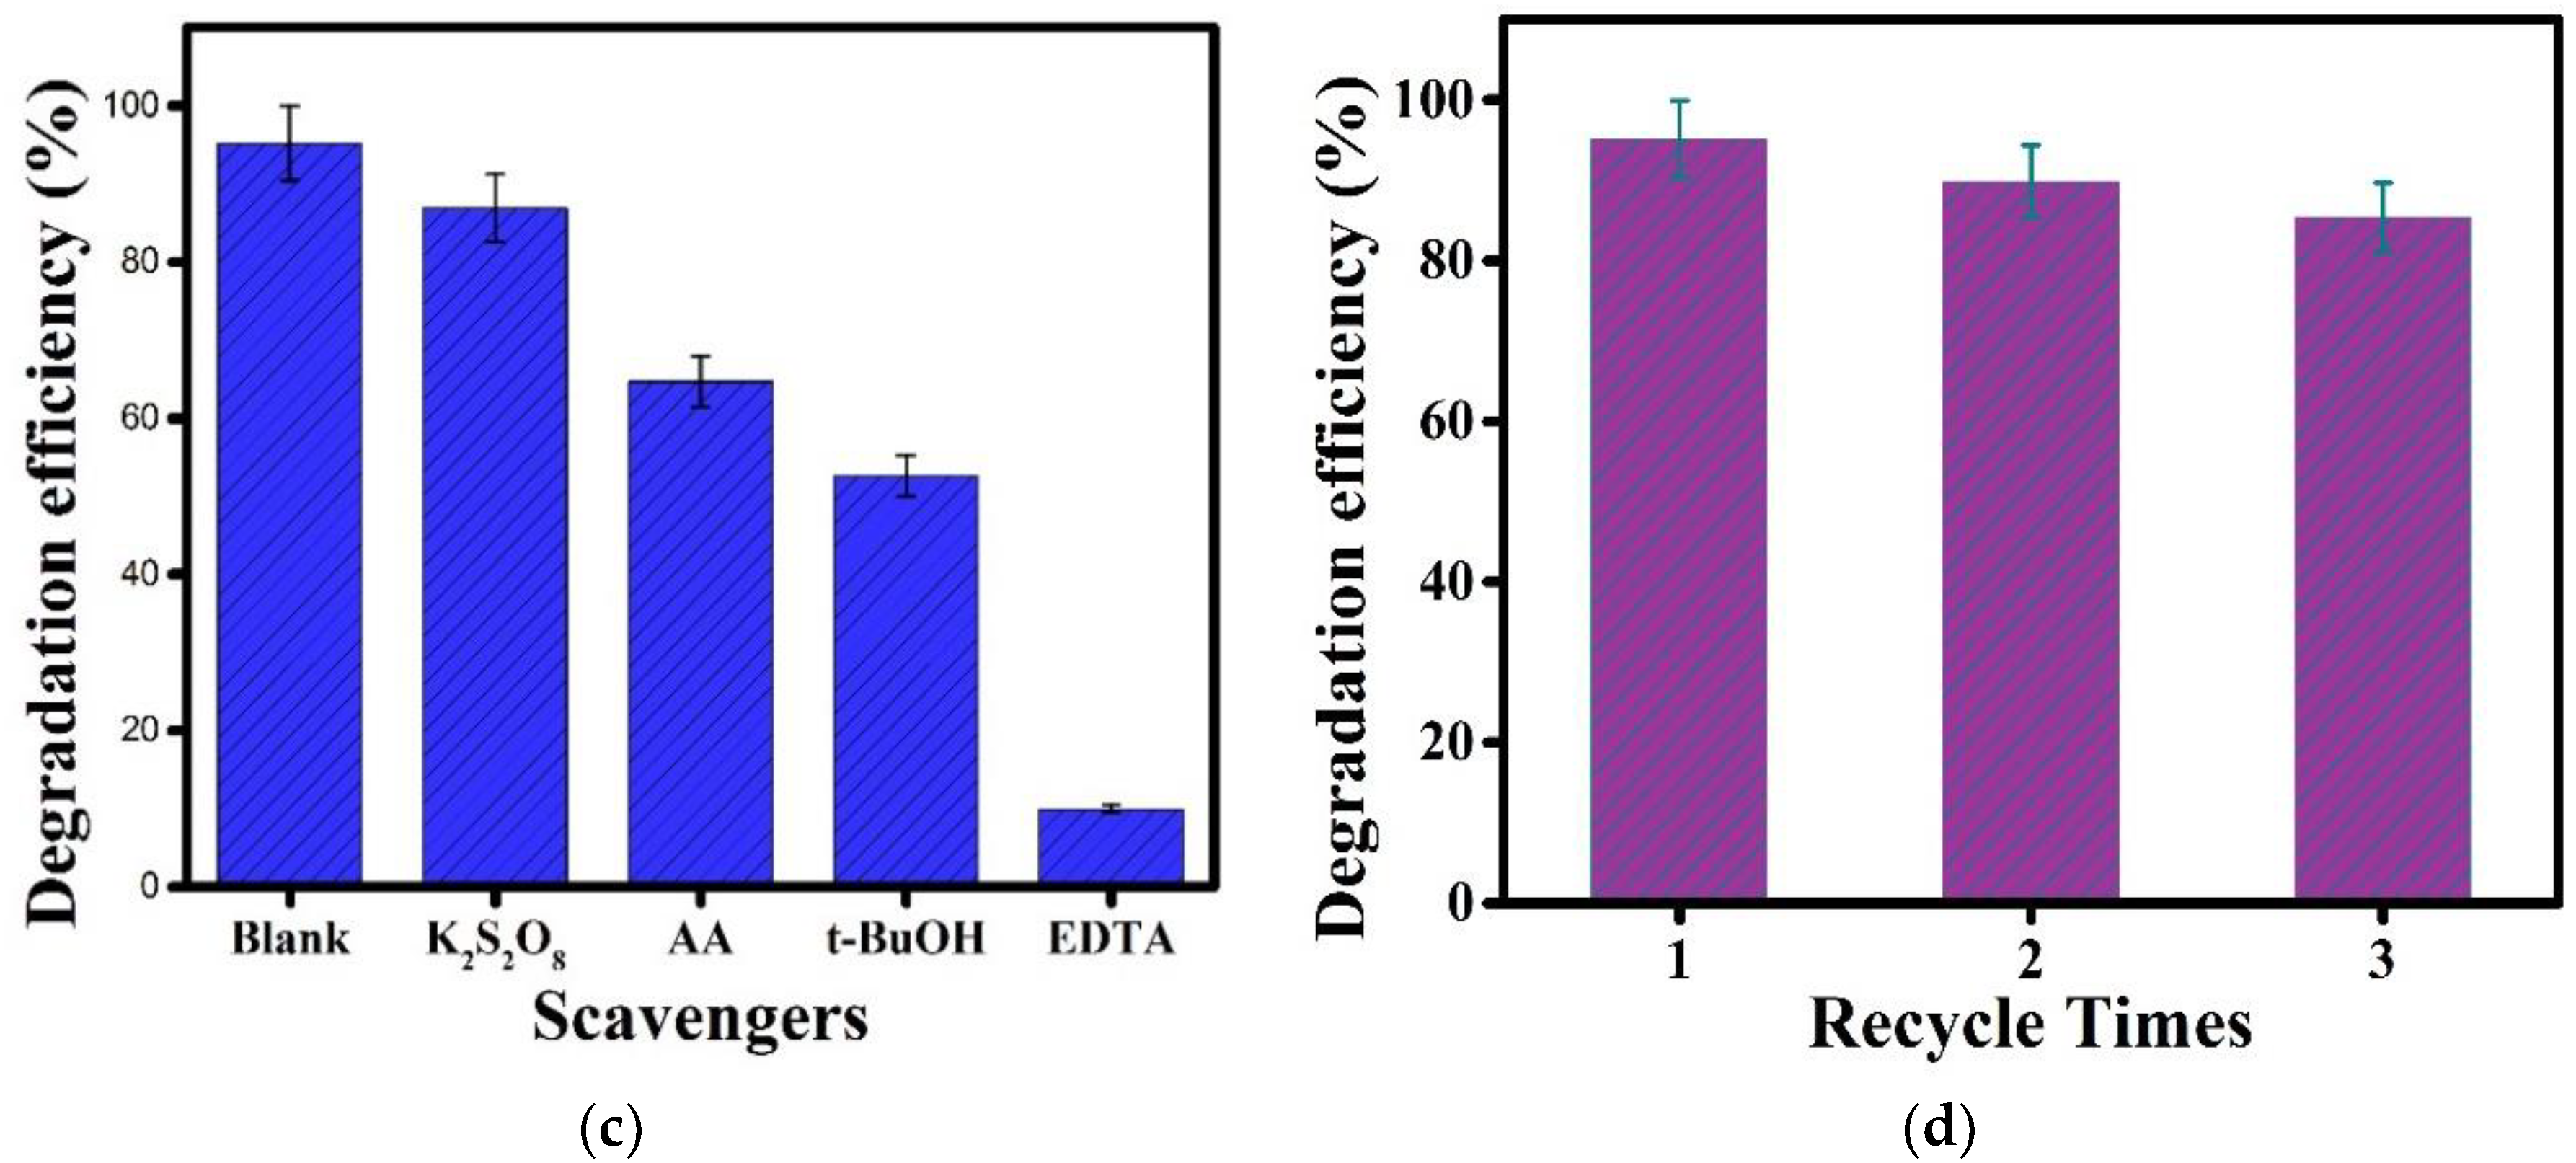
3.11. Dye Degradation
4. Conclusions
Supplementary Materials
Author Contributions
Funding
Acknowledgments
Conflicts of Interest
References
- Ahmad, A.; Mohd-Setapar, S.H.; Chuong, C.S.; Khatoon, A.; Wani, W.A.; Kumar, R.; Rafatullah, M. Recent advances in new generation dye removal technologies: Novel search for approaches to reprocess wastewater. RSC Adv. 2015, 5, 30801–30818. [Google Scholar] [CrossRef]
- Gordon, P.F.; Gregory, P. Organic Chemistry in Colour; Springer Science & Business Media: Berlin/Heidelberg, Germany, 2012. [Google Scholar]
- Ali, I.; Asim, M.; Khan, T.A. Low cost adsorbents for the removal of organic pollutants from wastewater. J. Environ. Manag. 2012, 113, 170–183. [Google Scholar] [CrossRef] [PubMed]
- Panizza, M.; Cerisola, G. Removal of organic pollutants from industrial wastewater by electrogenerated Fenton’s reagent. Water Res. 2001, 35, 3987–3992. [Google Scholar] [CrossRef]
- Soltani, N.; Saion, E.; Hussein, M.Z.; Erfani, M.; Abedini, A.; Bahmanrokh, G.; Navasery, M.; Vaziri, P. Visible light-induced degradation of methylene blue in the presence of photocatalytic ZnS and CdS nanoparticles. Int. J. Mol. Sci. 2012, 13, 12242–12258. [Google Scholar] [CrossRef] [PubMed]
- Huang, J.; Ren, H.; Liu, X.; Li, X.; Shim, J.-J. Facile synthesis of porous TiO2 nanospheres and their photocatalytic properties. Superlattices Microstruct. 2015, 81, 16–25. [Google Scholar] [CrossRef]
- Karimi, L.; Zohoori, S.; Yazdanshenas, M.E. Photocatalytic degradation of azo dyes in aqueous solutions under UV irradiation using nano-strontium titanate as the nanophotocatalyst. J. Saudi Chem. Soc. 2014, 18, 581–588. [Google Scholar] [CrossRef]
- Habib, M.A.; Ismail, I.M.I.; Mahmood, A.J.; Ullah, M.R. Photocatalytic decolorization of brilliant golden yellow in TiO2 and ZnO suspensions. J. Saudi Chem. Soc. 2012, 16, 423–429. [Google Scholar] [CrossRef]
- Huang, Y.; Ding, D.; Zhu, M.; Meng, W.; Huang, Y.; Geng, F.; Li, J.; Lin, J.; Tang, C.; Lei, Z. Facile synthesis of α-Fe2O3 nanodisk with superior photocatalytic performance and mechanism insight. Sci. Technol. Adv. Mater. 2015, 16, 014801. [Google Scholar] [CrossRef] [PubMed]
- Chen, C.; Ma, W.; Zhao, J. Semiconductor-mediated photodegradation of pollutants under visible-light irradiation. Chem. Soc. Rev. 2010, 39, 4206–4219. [Google Scholar] [CrossRef] [PubMed]
- Ponnusami, V.; Madhuram, R.; Krithika, V.; Srivastava, S.N. Effects of process variables on kinetics of methylene blue sorption onto untreated guava (Psidium guajava) leaf powder: Statistical analysis. Chem. Eng. J. 2008, 140, 609–613. [Google Scholar] [CrossRef]
- Rafatullah, M.; Sulaiman, O.; Hashim, R.; Ahmad, A. Adsorption of methylene blue on low-cost adsorbents: A review. J. Hazard. Mater. 2010, 177, 70–80. [Google Scholar] [CrossRef] [PubMed]
- Janani, S.; Sudha Rani, K.S.; Ellappan, P.; Miranda, L.R. Photodegradation of methylene blue using magnetically reduced graphene oxide bismuth oxybromide composite. J. Environ. Chem. Eng. 2016, 4, 534–541. [Google Scholar]
- Li, M.; Qiang, Z.; Pulgarin, C.; Kiwi, J. Accelerated methylene blue (MB) degradation by Fenton reagent exposed to UV or VUV/UV light in an innovative micro photo-reactor. Appl. Catal. B Environ. 2016, 187, 83–89. [Google Scholar] [CrossRef]
- Barroso, M.; Cowan, A.J.; Pendlebury, S.R.; Grätzel, M.; Klug, D.R.; Durrant, J.R. The role of cobalt phosphate in enhancing the photocatalytic activity of α-Fe2O3 toward water oxidation. J. Am. Chem. Soc. 2011, 133, 14868–14871. [Google Scholar] [CrossRef] [PubMed]
- Liu, X.; Chen, K.; Shim, J.-J.; Huang, J. Facile synthesis of porous Fe2O3 nanorods and their photocatalytic properties. J. Saudi Chem. Soc. 2015, 19, 479–484. [Google Scholar] [CrossRef]
- Mor, G.K.; Prakasam, H.E.; Varghese, O.K.; Shankar, K.; Grimes, C.A. Vertically oriented Ti−Fe−O nanotube array films: Toward a useful material architecture for solar spectrum water photoelectrolysis. Nano Lett. 2007, 7, 2356–2364. [Google Scholar] [CrossRef] [PubMed]
- Klahr, B.; Gimenez, S.; Fabregat-Santiago, F.; Hamann, T.; Bisquert, J. Water oxidation at hematite photoelectrodes: The role of surface states. J. Am. Chem. Soc. 2012, 134, 4294–4302. [Google Scholar] [CrossRef] [PubMed]
- Hassena, H. Photocatalytic degradation of methylene blue by using Al2O3/Fe2O3 nano composite under visible light. Mod. Chem. Appl. 2016. [Google Scholar] [CrossRef]
- Pal, B.; Sharon, M.; Nogami, G. Preparation and characterization of TiO2/Fe2O3 binary mixed oxides and its photocatalytic properties. Mater. Chem. Phys. 1999, 59, 254–261. [Google Scholar] [CrossRef]
- Zhang, Y.C.; Du, Z.N.; Li, K.W.; Zhang, M.; Dionysiou, D.D. High-performance visible-light-driven SnS2/SnO2 nanocomposite photocatalyst prepared via in situ hydrothermal oxidation of SnS2 nanoparticles. ACS Appl. Mater. Interfaces 2011, 3, 1528–1537. [Google Scholar] [CrossRef] [PubMed]
- Yao, K.; Li, J.; Shan, S.; Jia, Q. One-step synthesis of urchinlike SnS/SnS2 heterostructures with superior visible-light photocatalytic performance. Catal. Commun. 2017, 101, 51–56. [Google Scholar] [CrossRef]
- Burton, L.A.; Colombara, D.; Abellon, R.D.; Grozema, F.C.; Peter, L.M.; Savenije, T.J.; Dennler, G.; Walsh, A. Synthesis, characterization, and electronic structure of single-crystal SnS, Sn2S3, and SnS2. Chem. Mater. 2013, 25, 4908–4916. [Google Scholar] [CrossRef]
- Chaudhuri, T.K.; Tiwari, D. Earth-abundant non-toxic Cu2ZnSnS4 thin films by direct liquid coating from metal–thiourea precursor solution. Sol. Energy Mater. Sol. Cells 2012, 101, 46–50. [Google Scholar] [CrossRef]
- Yang, H.; Jauregui, L.A.; Zhang, G.; Chen, Y.P.; Wu, Y. Nontoxic and abundant copper zinc tin sulfide nanocrystals for potential high-temperature thermoelectric energy harvesting. Nano Lett. 2012, 12, 540–545. [Google Scholar] [CrossRef] [PubMed]
- An, X.; Jimmy, C.Y.; Tang, J. Biomolecule-assisted fabrication of copper doped SnS2 nanosheet–reduced graphene oxide junctions with enhanced visible-light photocatalytic activity. J. Mater. Chem. A 2014, 2, 1000–1005. [Google Scholar] [CrossRef]
- Lei, Y.; Song, S.; Fan, W.; Xing, Y.; Zhang, H. Facile synthesis and assemblies of flowerlike SnS2 and In3+-doped SnS2: Hierarchical structures and their enhanced photocatalytic property. J. Phys. Chem. C 2009, 113, 1280–1285. [Google Scholar] [CrossRef]
- Anderson, C.; Bard, A.J. Improved photocatalytic activity and characterization of mixed TiO2/SiO2 and TiO2/Al2O3 materials. J. Phys. Chem. B 1997, 101, 2611–2616. [Google Scholar] [CrossRef]
- Zou, L.; Luo, Y.; Hooper, M.; Hu, E. Removal of VOCs by photocatalysis process using adsorption enhanced TiO2–SiO2 catalyst. Chem. Eng. Process. Process Intensif. 2006, 45, 959–964. [Google Scholar] [CrossRef]
- Tang, W.; Su, Y.; Wang, X.; Li, Q.; Gao, S.; Shang, J.K. Synthesis of a superparamagnetic MFNs@SiO2@Ag4SiW12O40/Ag composite photocatalyst, its superior photocatalytic performance under visible light illumination, and its easy magnetic separation. RSC Adv. 2014, 4, 30090–30099. [Google Scholar] [CrossRef]
- Fu, Y.Y.; Yang, C.X.; Yan, X.P. Fabrication of ZIF-8@SiO2 Core–Shell Microspheres as the Stationary Phase for High-Performance Liquid Chromatography. Chem. Eur. J. 2013, 19, 13484–13491. [Google Scholar] [CrossRef] [PubMed]
- Wu, H.-S.; Sun, L.-D.; Zhou, H.-P.; Yan, C.-H. Novel TiO2–Pt@SiO2 nanocomposites with high photocatalytic activity. Nanoscale 2012, 4, 3242–3247. [Google Scholar] [CrossRef] [PubMed]
- Zhu, S.-R.; Qi, Q.; Zhao, W.-N.; Wu, M.-K.; Fang, Y.; Tao, K.; Yi, F.-Y.; Han, L. Hierarchical core–shell SiO2@PDA@BiOBr microspheres with enhanced visible-light-driven photocatalytic performance. Dalton Trans. 2017, 46, 11451–11458. [Google Scholar] [CrossRef] [PubMed]
- Tatsuo, K.; Yusuke, Y.; Nobuyoshi, M. Highly Photoactive Porous Anatase Films Obtained by Deformation of 3D Mesostructures. Chem. Eur. J. 2011, 17, 4005–4011. [Google Scholar]
- Hamid, O.; Simin, R.; Xiangfen, J.; Yoshihiro, N.; Ali, B.; Soichi, W.; Yusuke, Y. Unusual Antibacterial Property of Mesoporous Titania Films: Drastic Improvement by Controlling Surface Area and Crystallinity. Chem. Asian J. 2010, 5, 1978–1983. [Google Scholar]
- Zhang, W.; Fröba, M.; Wang, J.; Tanev, P.T.; Wong, J.; Pinnavaia, T.J. Mesoporous Titanosilicate Molecular Sieves Prepared at Ambient Temperature by Electrostatic (S+I-, S+X-I+) and Neutral (S°I°) Assembly Pathways: A Comparison of Physical Properties and Catalytic Activity for Peroxide Oxidations. J. Am. Chem. Soc. 1996, 118, 9164–9171. [Google Scholar] [CrossRef]
- Xiong, Y.; Xu, W.; Ding, D.; Lu, W.; Zhu, L.; Zhu, Z.; Wang, Y.; Xue, Q. Ultra-sensitive NH3 sensor based on flower-shaped SnS2 nanostructures with sub-ppm detection ability. J. Hazard. Mater. 2018, 341, 159–167. [Google Scholar] [CrossRef] [PubMed]
- Uma, K.; Arjun, N.; Pan, G.-T.; Yang, T.C.-K. The photodeposition of surface plasmon Ag metal on SiO2@ α-Fe2O3 nanocomposites sphere for enhancement of the photo-Fenton behavior. Appl. Surf. Sci. 2017, 425, 377–383. [Google Scholar] [CrossRef]
- Wei, R.; Zhou, T.; Hu, J.; Li, J. Glutatione modified ultrathin SnS2 nanosheets with highly photocatalytic activity for wastewater treatment. Mater. Res. Express 2014, 1, 025018. [Google Scholar] [CrossRef]
- Liu, J.; Jing, L.; Gao, G.; Xu, Y.; Xie, M.; Huang, L.; Ji, H.; Xie, J.; Li, H. Ag2S quantum dots in situ coupled to hexagonal SnS2 with enhanced photocatalytic activity for MO and Cr (vi) removal. RSC Adv. 2017, 7, 46823–46831. [Google Scholar] [CrossRef]
- Smart, R.S.C.; Skinner, W.M.; Gerson, A.R. XPS of sulphide mineral surfaces: Metal-deficient, polysulphides, defects and elemental sulphur. Surf. Interface Anal. 1999, 28, 101–105. [Google Scholar] [CrossRef]
- Merino, N.A.; Barbero, B.P.; Eloy, P.; Cadús, L.E. La1−xCaxCoO3 perovskite-type oxides: Identification of the surface oxygen species by XPS. Appl. Surf. Sci. 2006, 253, 1489–1493. [Google Scholar] [CrossRef]
- Grosvenor, A.; Kobe, B.; Biesinger, M.; McIntyre, N. Investigation of multiplet splitting of Fe 2p XPS spectra and bonding in iron compounds. Surf. Interface Anal. 2004, 36, 1564–1574. [Google Scholar] [CrossRef]
- Yamashita, T.; Hayes, P. Analysis of XPS spectra of Fe2+ and Fe3+ ions in oxide materials. Appl. Surf. Sci. 2008, 254, 2441–2449. [Google Scholar] [CrossRef]
- Mitchell, D.; Clark, K.; Bardwell, J.; Lennard, W.; Massoumi, G.; Mitchell, I. Film thickness measurements of SiO2 by XPS. Surf. Interface Anal. 1994, 21, 44–50. [Google Scholar] [CrossRef]
- Huang, Y.; Sutter, E.; Sadowski, J.T.; Cotlet, M.; Monti, O.L.; Racke, D.A.; Neupane, M.R.; Wickramaratne, D.; Lake, R.K.; Parkinson, B.A. Tin Disulfide—An Emerging Layered Metal Dichalcogenide Semiconductor: Materials Properties and Device Characteristics. ACS Nano 2014, 8, 10743–10755. [Google Scholar] [CrossRef] [PubMed]
- He, M.; Yuan, L.-X.; Huang, Y.-H. Acetylene black incorporated three-dimensional porous SnS2 nanoflowers with high performance for lithium storage. RSC Adv. 2013, 3, 3374–3383. [Google Scholar] [CrossRef]
- Pawar, R.C.; Kang, S.; Park, J.H.; Kim, J.-H.; Ahn, S.; Lee, C.S. Evaluation of a multi-dimensional hybrid photocatalyst for enrichment of H2 evolution and elimination of dye/non-dye pollutants. Catal. Sci. Technol. 2017, 7, 2579–2590. [Google Scholar] [CrossRef]
- Sanatgar-Delshade, E.; Habibi-Yangjeh, A.; Khodadadi-Moghaddam, M. Hydrothermal low-temperature preparation and characterization of ZnO nanoparticles supported on natural zeolite as a highly efficient photocatalyst. Monatshefte Chem. Chem. Mon. 2011, 142, 119–129. [Google Scholar] [CrossRef]
- Shanthi, M.; Kuzhalosai, V. Photocatalytic Degradation of an azo dye, Acid Red 27, in Aqueous Solution Using Nano ZnO; NISCAIR-CSIR: New Delhi, India, 2012. [Google Scholar]


| Sample | BET Surface Area |
|---|---|
| SnS2 flowers | 41.88 m2/g |
| SSF-5 wt % | 41.61 m2/g |
| SSF-10 wt % | 39.41 m2/g |
| SSF-15 wt % | 42.82 m2/g |
| SSF-20 wt % | 41.93 m2/g |
| SSF-25 wt % | 42.47 m2/g |
© 2018 by the authors. Licensee MDPI, Basel, Switzerland. This article is an open access article distributed under the terms and conditions of the Creative Commons Attribution (CC BY) license (http://creativecommons.org/licenses/by/4.0/).
Share and Cite
Balu, S.; Uma, K.; Pan, G.-T.; Yang, T.C.-K.; Ramaraj, S.K. Degradation of Methylene Blue Dye in the Presence of Visible Light Using SiO2@α-Fe2O3 Nanocomposites Deposited on SnS2 Flowers. Materials 2018, 11, 1030. https://doi.org/10.3390/ma11061030
Balu S, Uma K, Pan G-T, Yang TC-K, Ramaraj SK. Degradation of Methylene Blue Dye in the Presence of Visible Light Using SiO2@α-Fe2O3 Nanocomposites Deposited on SnS2 Flowers. Materials. 2018; 11(6):1030. https://doi.org/10.3390/ma11061030
Chicago/Turabian StyleBalu, Sridharan, Kasimayan Uma, Guan-Ting Pan, Thomas C.-K. Yang, and Sayee Kannan Ramaraj. 2018. "Degradation of Methylene Blue Dye in the Presence of Visible Light Using SiO2@α-Fe2O3 Nanocomposites Deposited on SnS2 Flowers" Materials 11, no. 6: 1030. https://doi.org/10.3390/ma11061030
APA StyleBalu, S., Uma, K., Pan, G.-T., Yang, T. C.-K., & Ramaraj, S. K. (2018). Degradation of Methylene Blue Dye in the Presence of Visible Light Using SiO2@α-Fe2O3 Nanocomposites Deposited on SnS2 Flowers. Materials, 11(6), 1030. https://doi.org/10.3390/ma11061030