Influence of Interfacial Traps on the Operating Temperature of Perovskite Solar Cells


Abstract

1. Introduction
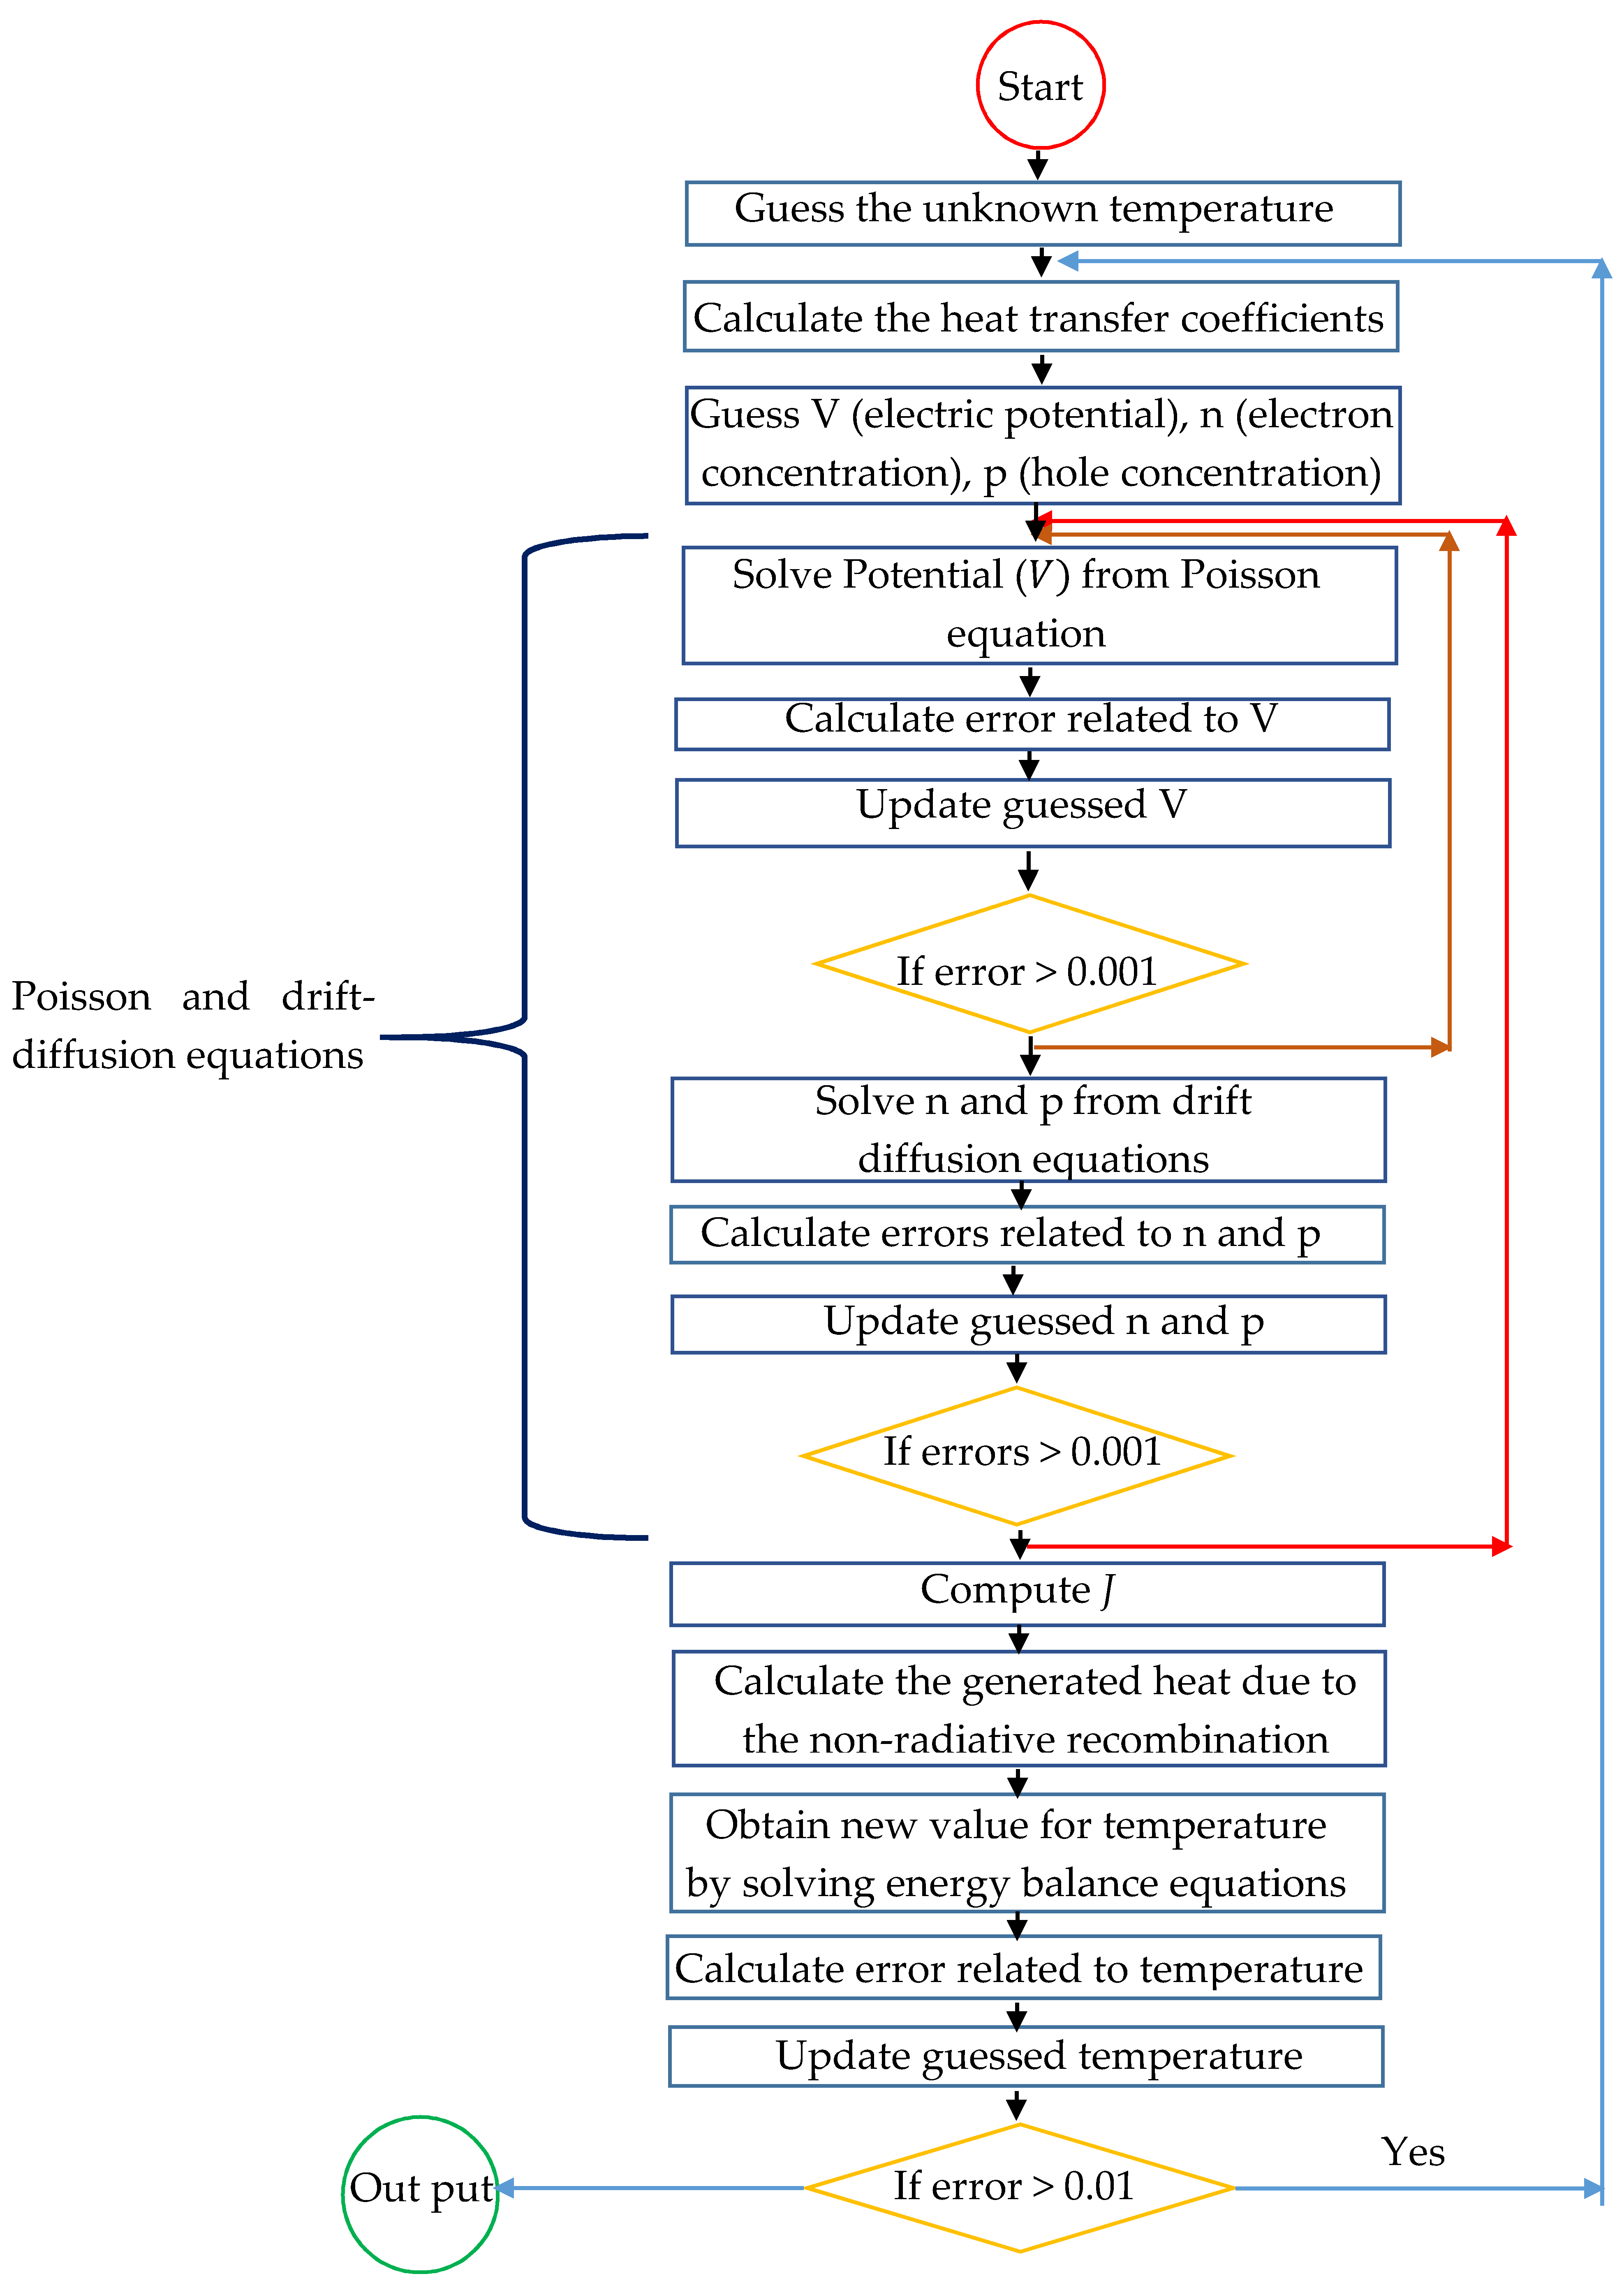
2. Methods
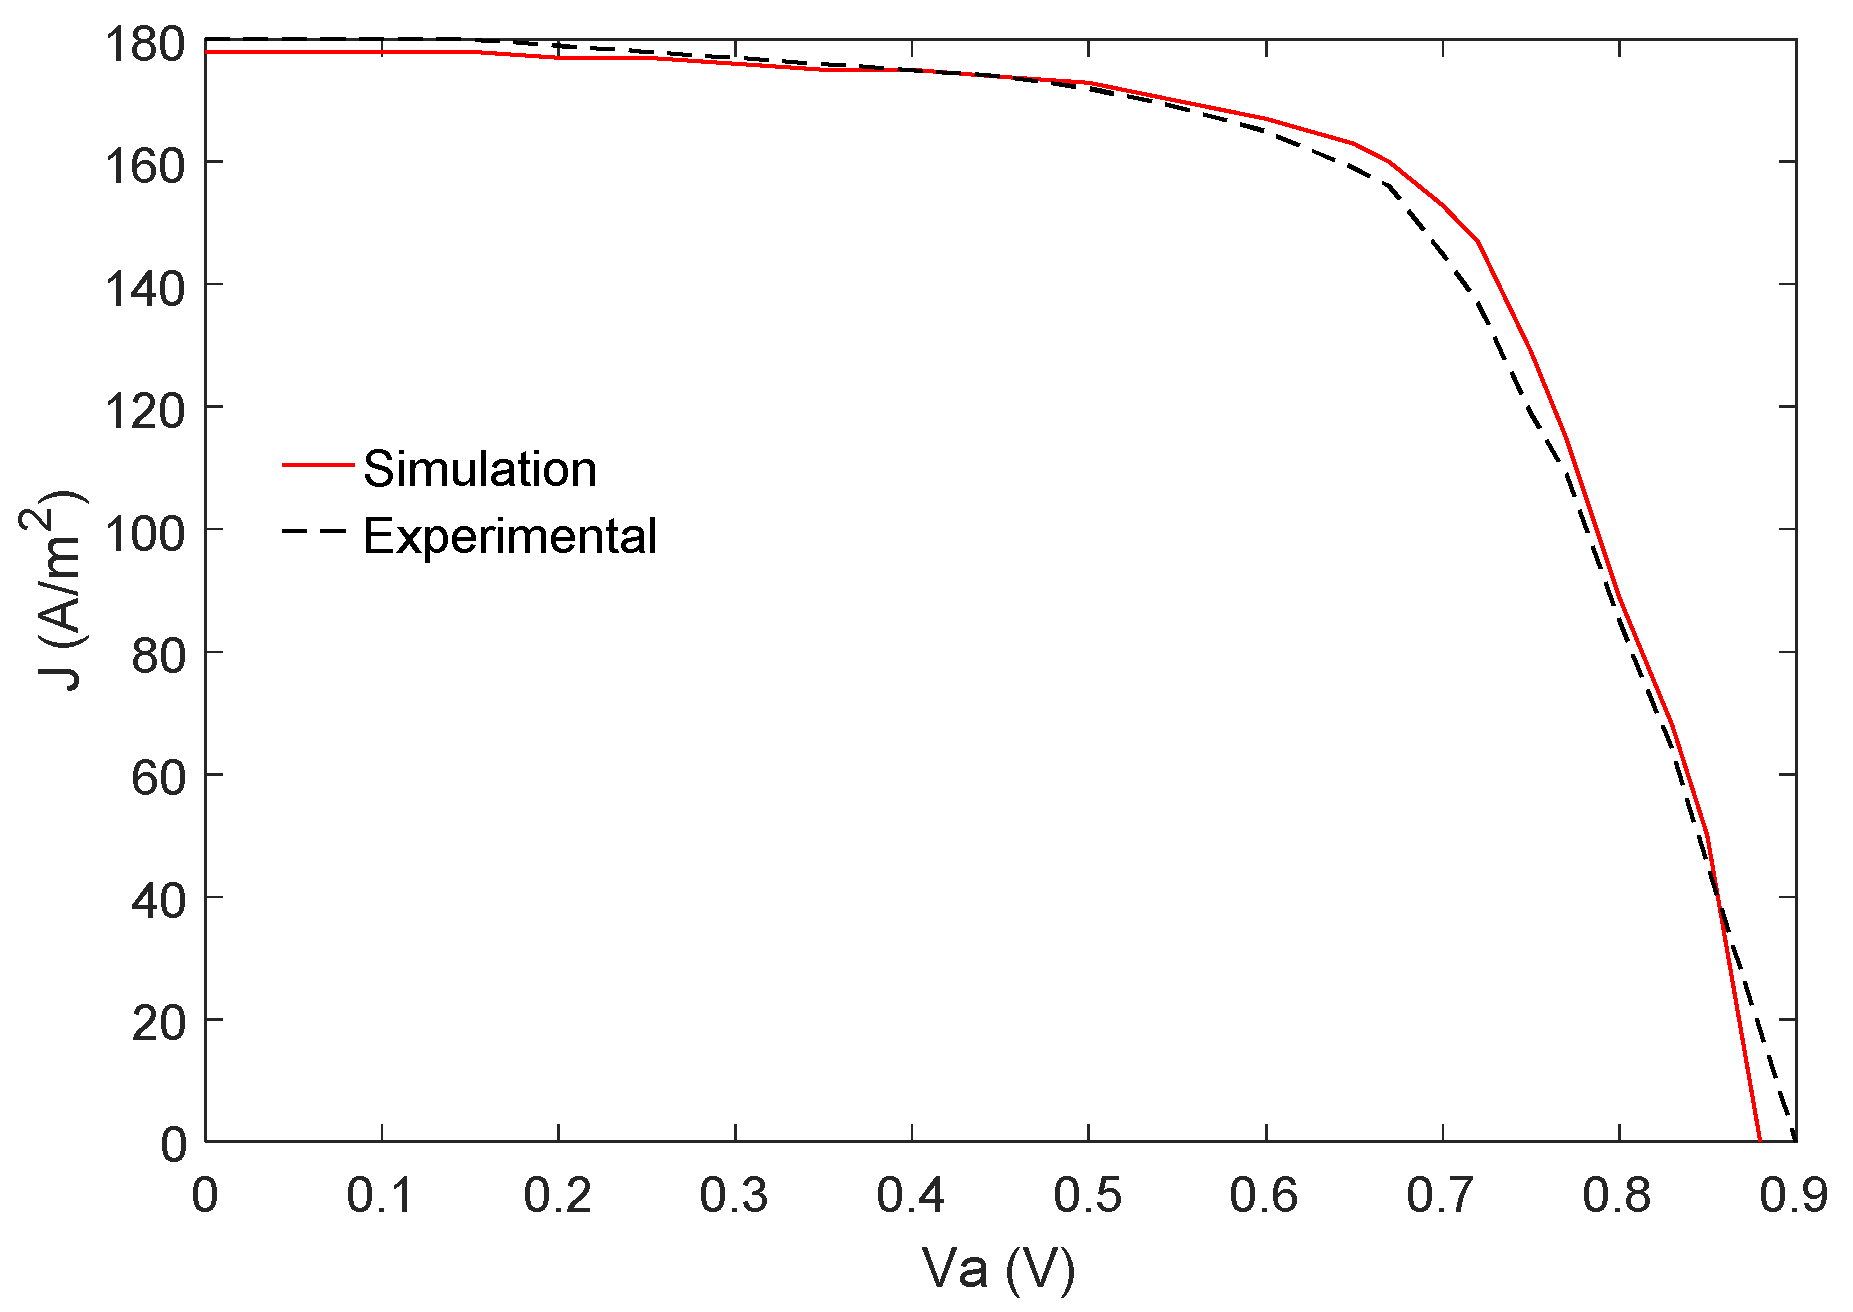
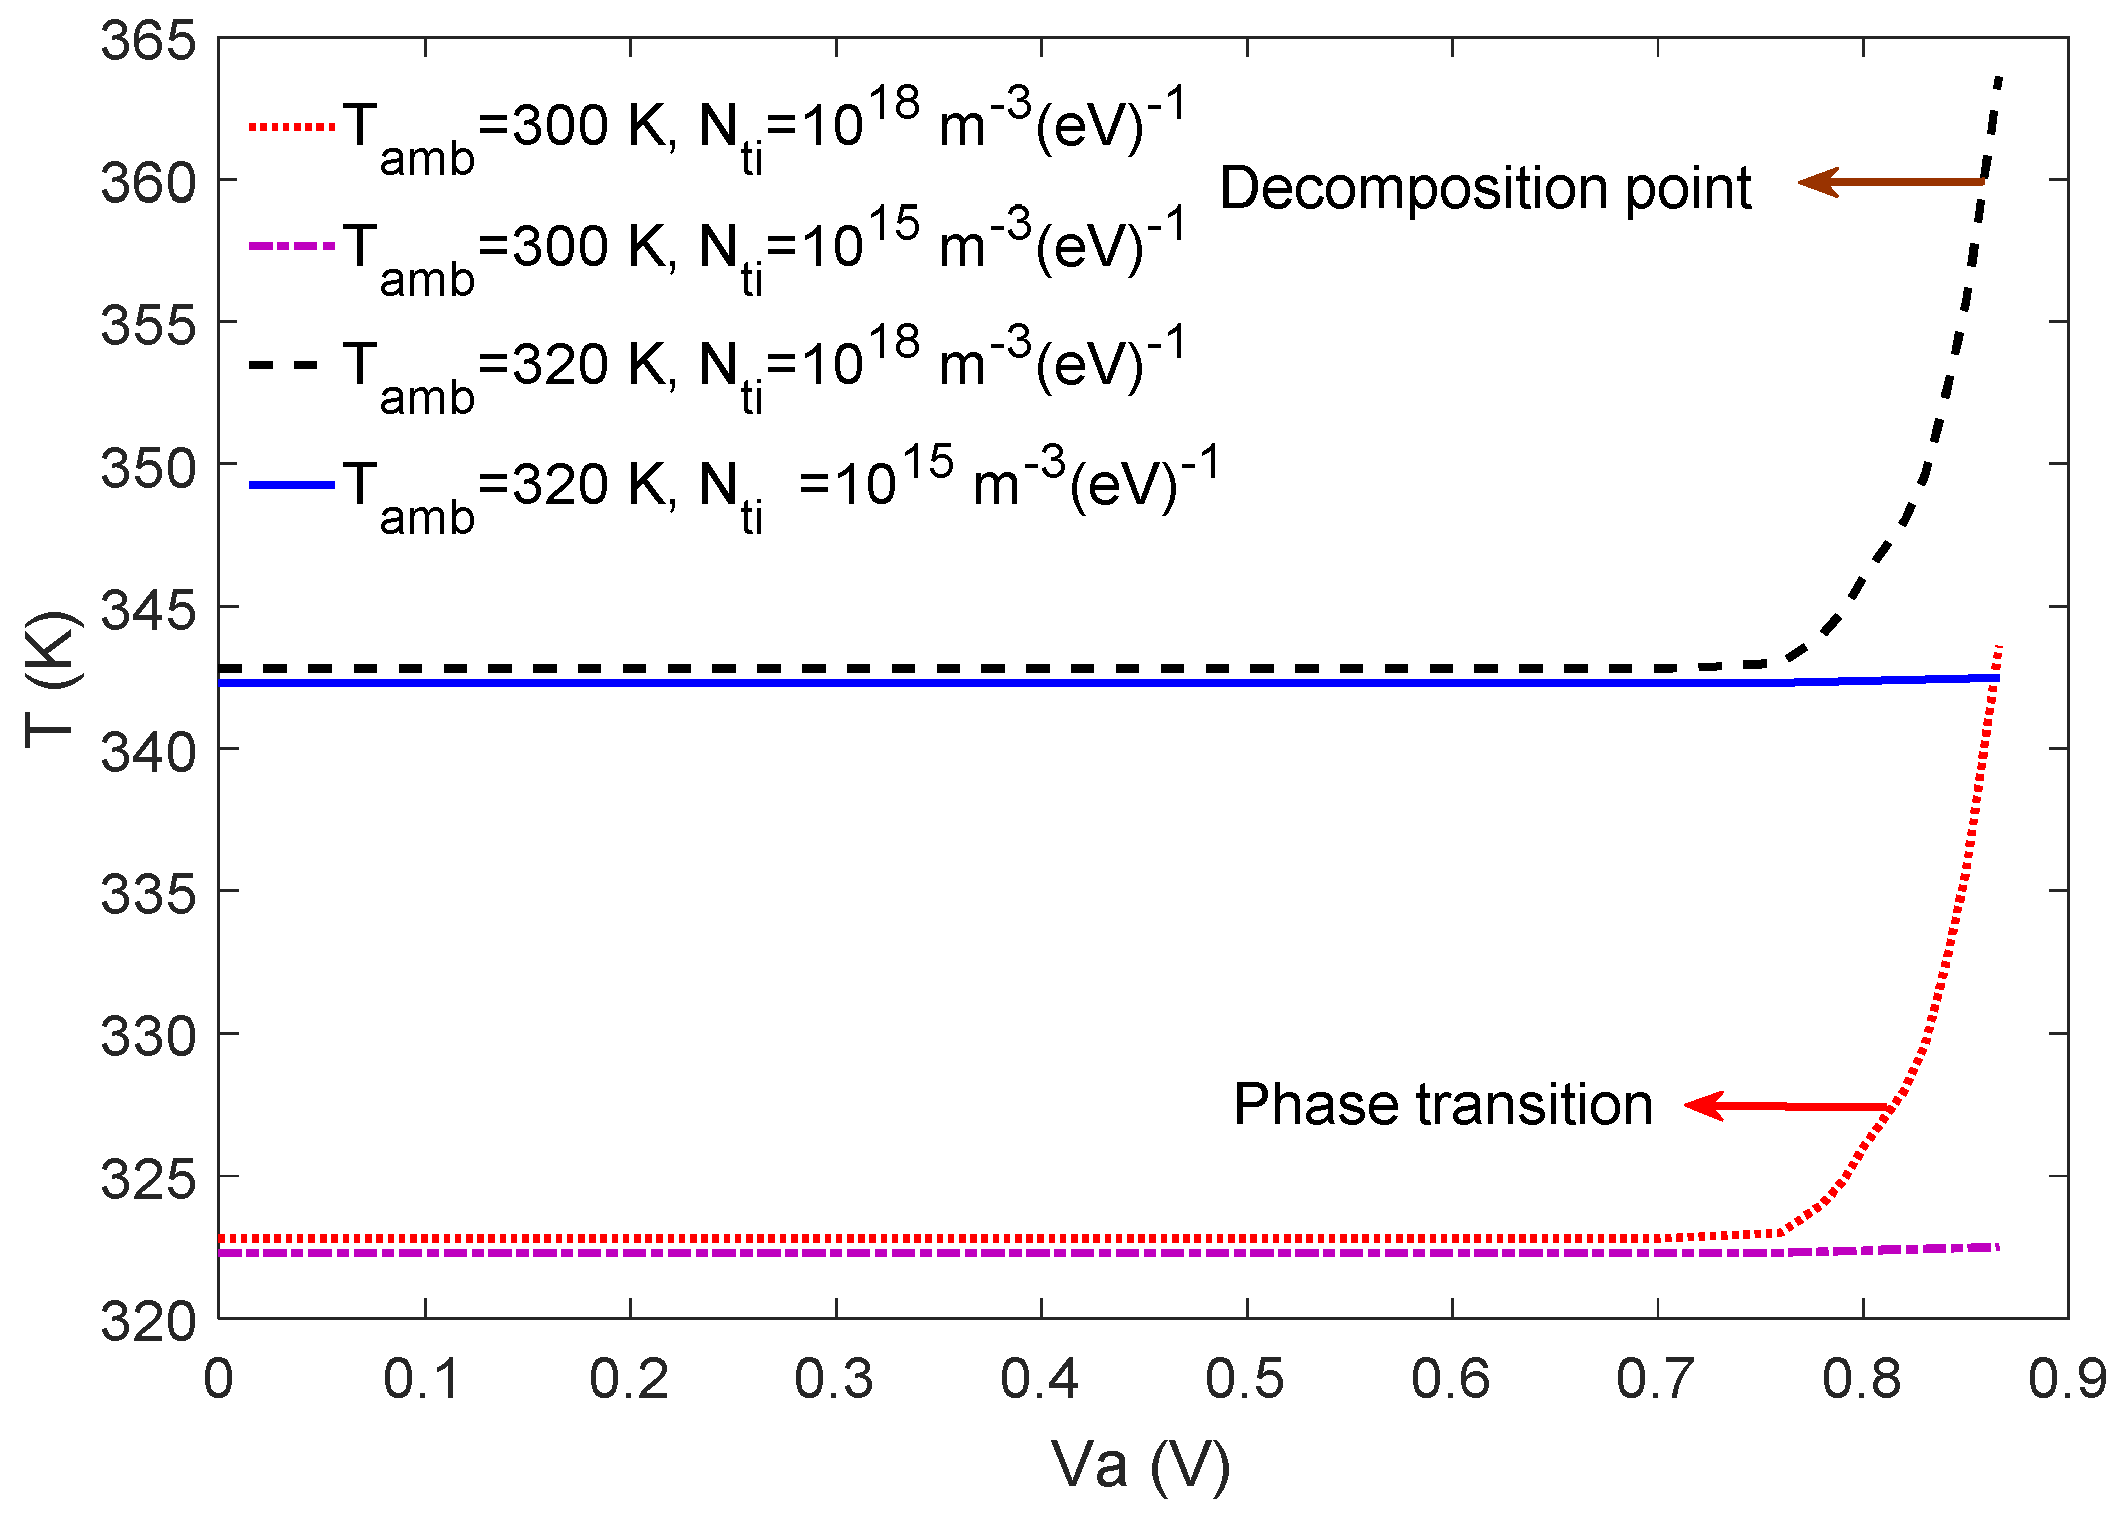
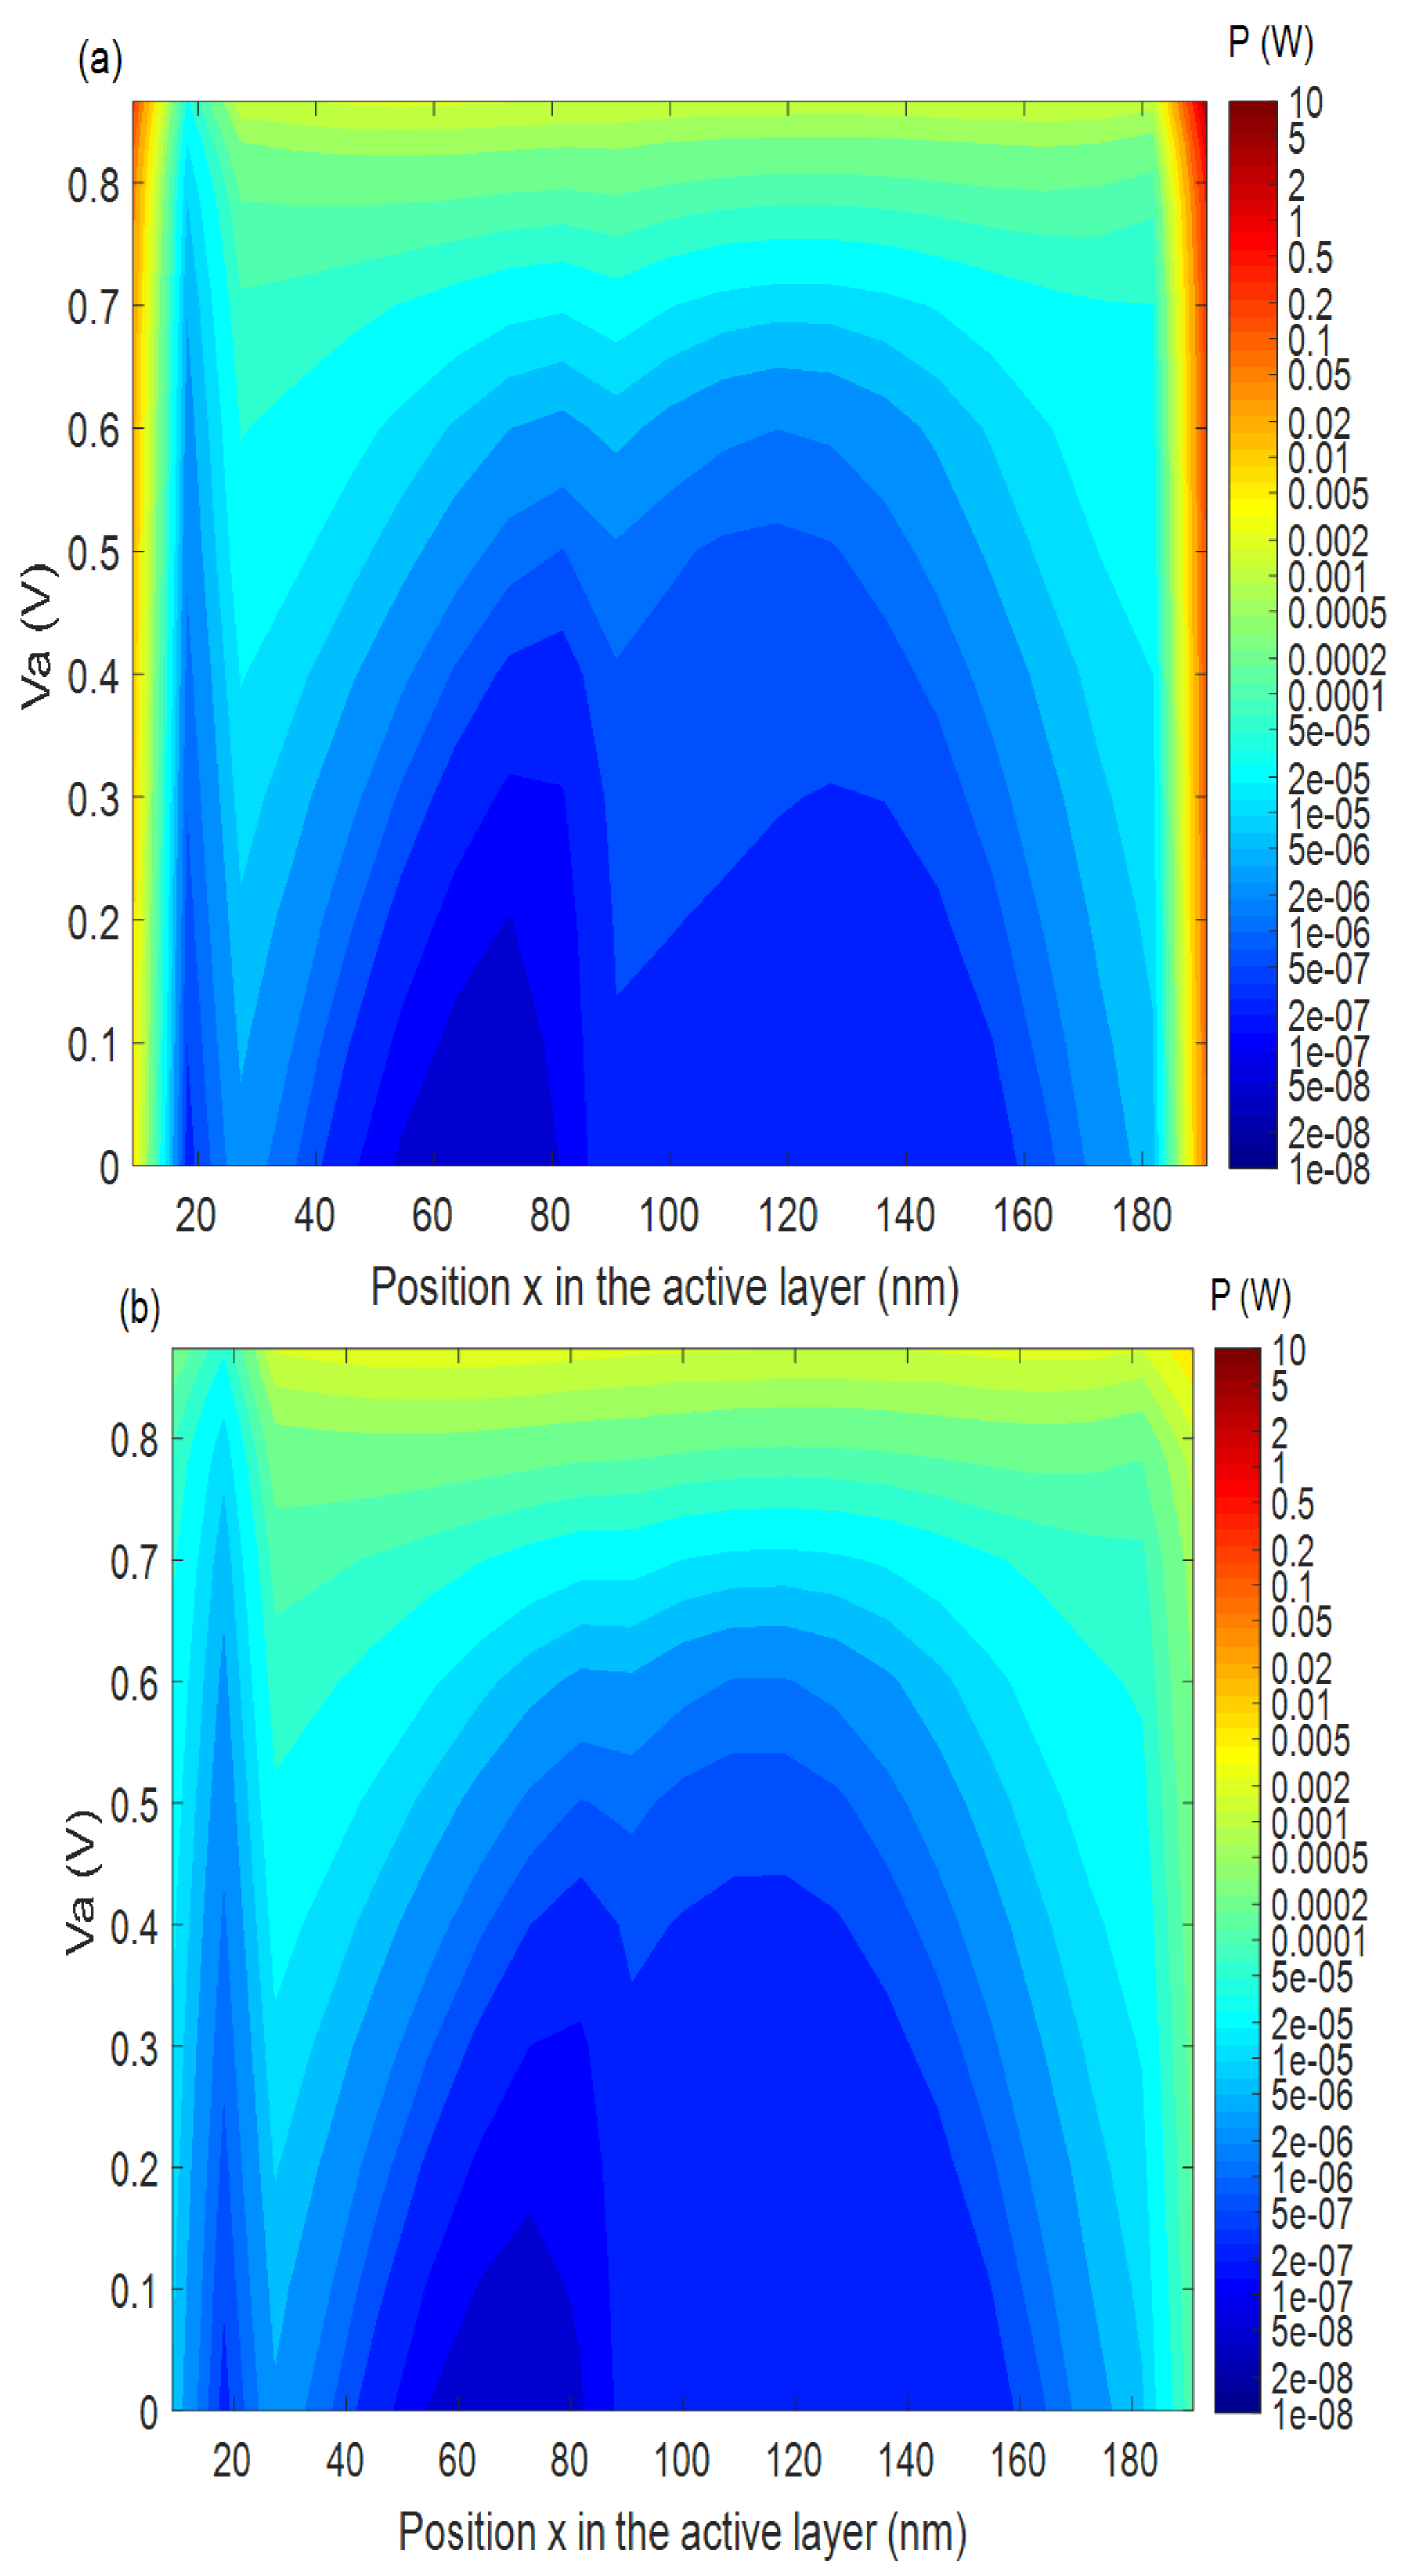
3. Results and Discussions
4. Conclusions
Author Contributions
Funding
Conflicts of Interest
References
- Schmager, R.; Gomard, G.; Richards, B.S.; Paetzold, U.W. Nanophotonic perovskite layers for enhanced current generation and mitigation of lead in perovskite solar cells. Sol. Energy Mater. Sol. Cells 2019, 192, 65–71. [Google Scholar] [CrossRef]
- Prochowicz, D.; Runjhun, R.; Tavakoli, M.M.; Yadav, P.; Saski, M.; Alanazi, A.Q.; Kubicki, D.J.; Kaszkur, Z.; Zakeeruddin, S.M.; Lewiński, J.; et al. Engineering of Perovskite Materials Based on Formamidinium and Cesium Hybridization for High-Efficiency Solar Cells. Chem. Mater. 2019, 31, 1620–1627. [Google Scholar] [CrossRef]
- Jeon, N.J.; Na, H.; Jung, E.H.; Yang, T.Y.; Lee, Y.G.; Kim, G.; Shin, H.W.; Il Seok, S.; Lee, J.; Seo, J. A fluorene-terminated hole-transporting material for highly efficient and stable perovskite solar cells. Nat. Energy 2018, 3, 682–689. [Google Scholar] [CrossRef]
- Yang, D.; Yang, R.; Wang, K.; Wu, C.; Zhu, X.; Feng, J.; Ren, X.; Fang, G.; Priya, S.; Liu, S. High efficiency planar-type perovskite solar cells with negligible hysteresis using EDTA-complexed SnO2. Nat. Commun. 2018, 9, 3239. [Google Scholar] [CrossRef] [PubMed]
- Vidal, S.; Izquierdo, M.; Filippone, S.; Fernández, I.; Akin, S.; Seo, J.Y.; Zakeeruddin, S.M.; Grätzel, M.; Martín, N. Site-selective Synthesis of β-[70]PCBM-like Fullerenes: Efficient Application in Perovskite Solar Cells. Chem. A Eur. J. 2019, 25, 3224–3228. [Google Scholar] [CrossRef] [PubMed]
- Oxford PV Perovskite Solar Cell Achieves 28% Efficiency. Available online: https://www.oxfordpv.com/news/oxford-pv-perovskite-solar-cell-achieves-28-efficiency (accessed on 20 December 2018).
- Milot, R.L.; Eperon, G.E.; Snaith, H.J.; Johnston, M.B.; Herz, L.M. Temperature-Dependent Charge-Carrier Dynamics in CH3NH3PbI3 Perovskite Thin Films. Adv. Funct. Mater. 2015, 25, 6218–6227. [Google Scholar] [CrossRef]
- Zhang, H.; Qiao, X.; Shen, Y.; Wang, M. Effect of temperature on the efficiency of organometallic perovskite solar cells. J. Energy Chem. 2015, 24, 729–735. [Google Scholar] [CrossRef]
- Mehdizadeh-Rad, H.; Singh, J. Influence of Urbach Energy, Temperature, and Longitudinal Position in the Active Layer on Carrier Diffusion Length in Perovskite Solar Cells. ChemPhysChem 2019, in press. [Google Scholar] [CrossRef]
- Conings, B.; Drijkoningen, J.; Gauquelin, N.; Babayigit, A.; D’Haen, J.; D’Olieslaeger, L.; Ethirajan, A.; Verbeeck, J.; Manca, J.; Mosconi, E.; et al. Intrinsic Thermal Instability of Methylammonium Lead Trihalide Perovskite. Adv. Energy Mater. 2015, 5, 1500477. [Google Scholar] [CrossRef]
- Thote, A.; Jeon, I.; Lin, H.S.; Manzhos, S.; Nakagawa, T.; Suh, D.; Hwang, J.; Kashiwagi, M.; Shiomi, J.; Maruyama, S.; et al. High-Working-Pressure Sputtering of ZnO for Stable and Efficient Perovskite Solar Cells. ACS Appl. Electron. Mater. 2019, 1, 389–396. [Google Scholar] [CrossRef]
- Kim, H.S.; Seo, J.Y.; Park, N.G. Material and Device Stability in Perovskite Solar Cells. ChemSusChem 2016, 9, 2528–2540. [Google Scholar] [CrossRef] [PubMed]
- Philippe, B.; Park, B.W.; Lindblad, R.; Oscarsson, J.; Ahmadi, S.; Johansson, E.M.J.; Rensmo, H. Chemical and Electronic Structure Characterization of Lead Halide Perovskites and Stability Behavior under Different Exposures—A Photoelectron Spectroscopy Investigation. Chem. Mater. 2015, 27, 1720–1731. [Google Scholar] [CrossRef]
- Silverman, T.J.; Deceglie, M.G.; Sun, X.; Garris, R.L.; Alam, M.A.; Deline, C.; Kurtz, S. Thermal and Electrical Effects of Partial Shade in Monolithic Thin-Film Photovoltaic Modules. IEEE J. Photovolt. 2015, 5, 1742–1747. [Google Scholar] [CrossRef]
- Quarti, C.; Mosconi, E.; Ball, J.M.; D’Innocenzo, V.; Tao, C.; Pathak, S.; Snaith, H.J.; Petrozza, A.; De Angelis, F. Structural and optical properties of methylammonium lead iodide across the tetragonal to cubic phase transition: implications for perovskite solar cells. Energy Environ. Sci. 2016, 9, 155–163. [Google Scholar] [CrossRef]
- Baikie, T.; Fang, Y.; Kadro, J.M.; Schreyer, M.; Wei, F.; Mhaisalkar, S.G.; Graetzel, M.; White, T.J. Synthesis and crystal chemistry of the hybrid perovskite (CH3NH3)PbI3 for solid-state sensitised solar cell applications. J. Mater. Chem. A 2013, 1, 5628–5641. [Google Scholar] [CrossRef]
- Whitfield, P.S.; Herron, N.; Guise, W.E.; Page, K.; Cheng, Y.Q.; Milas, I.; Crawford, M.K. Corrigendum: Structures, Phase Transitions and Tricritical Behavior of the Hybrid Perovskite Methyl Ammonium Lead Iodide. Sci. Rep. 2017, 7, 42831. [Google Scholar] [CrossRef] [PubMed]
- Stoumpos, C.C.; Malliakas, C.D.; Kanatzidis, M.G. Semiconducting Tin and Lead Iodide Perovskites with Organic Cations: Phase Transitions, High Mobilities, and Near-Infrared Photoluminescent Properties. Inorg. Chem. 2013, 52, 9019–9038. [Google Scholar] [CrossRef]
- Thote, A.; Jeon, I.; Lee, J.W.; Seo, S.; Lin, H.S.; Yang, Y.; Daiguji, H.; Maruyama, S.; Matsuo, Y. Stable and Reproducible 2D/3D Formamidinium-Lead-Iodide Perovskite Solar Cells. ACS Appl. Energy Mater. 2019, 2, 2486–2493. [Google Scholar] [CrossRef]
- Ma, F.J.; Liu, H.; Liao, B.; Chen, J.; Du, Z.; Samudra, G.S.; Aberle, A.G.; Hoex, B.; Peters, I.M. Impact of Auger recombination parameterisations on predicting silicon wafer solar cell performance. J. Comput. Electron. 2014, 13, 647–656. [Google Scholar] [CrossRef]
- Marinova, N.; Valero, S.; Delgado, J.L. Organic and perovskite solar cells: Working principles, materials and interfaces. J. Colloid Interface Sci. 2017, 488, 373–389. [Google Scholar] [CrossRef]
- Bi, D.; Tress, W.; Dar, M.I.; Gao, P.; Luo, J.; Renevier, C.; Schenk, K.; Abate, A.; Giordano, F.; Correa Baena, J.P.; et al. Efficient luminescent solar cells based on tailored mixed-cation perovskites. Sci. Adv. 2016, 2. [Google Scholar] [CrossRef] [PubMed]
- Marinova, N.; Tress, W.; Humphry-Baker, R.; Dar, M.I.; Bojinov, V.; Zakeeruddin, S.M.; Nazeeruddin, M.K.; Grätzel, M. Light Harvesting and Charge Recombination in CH3NH3PbI3 Perovskite Solar Cells Studied by Hole Transport Layer Thickness Variation. ACS Nano 2015, 9, 4200–4209. [Google Scholar] [CrossRef] [PubMed]
- Wetzelaer, G.J.A.; Scheepers, M.; Sempere, A.M.; Momblona, C.; Ávila, J.; Bolink, H.J. Trap-Assisted Non-Radiative Recombination in Organic-Inorganic Perovskite Solar Cells. Adv. Mater. 2015, 27, 1837–1841. [Google Scholar] [CrossRef] [PubMed]
- Wu, X.; Trinh, M.T.; Niesner, D.; Zhu, H.; Norman, Z.; Owen, J.S.; Yaffe, O.; Kudisch, B.J.; Zhu, X.Y. Trap States in Lead Iodide Perovskites. J. Am. Chem. Soc. 2015, 137, 2089–2096. [Google Scholar] [CrossRef] [PubMed]
- Cui, P.; Fu, P.; Wei, D.; Li, M.; Song, D.; Yue, X.; Li, Y.; Zhang, Z.; Li, Y.; Mbengue, J.M. Reduced surface defects of organometallic perovskite by thermal annealing for highly efficient perovskite solar cells. RSC Adv. 2015, 5, 75622–75629. [Google Scholar] [CrossRef]
- Sherkar, T.S.; Momblona, C.; Gil-Escrig, L.; Ávila, J.; Sessolo, M.; Bolink, H.J.; Koster, L.J.A. Recombination in Perovskite Solar Cells: Significance of Grain Boundaries, Interface Traps, and Defect Ions. ACS Energy Lett. 2017, 2, 1214–1222. [Google Scholar] [CrossRef] [PubMed]
- Shao, Y.; Xiao, Z.; Bi, C.; Yuan, Y.; Huang, J. Origin and elimination of photocurrent hysteresis by fullerene passivation in CH3NH3PbI3 planar heterojunction solar cells. Nat. Commun. 2014, 5, 5784. [Google Scholar] [CrossRef] [PubMed]
- Tress, W.; Marinova, N.; Moehl, T.; Zakeeruddin, S.M.; Nazeeruddin, M.K.; Grätzel, M. Understanding the rate-dependent J-V hysteresis, slow time component, and aging in CH3NH3PbI3 perovskite solar cells: the role of a compensated electric field. Energy Environ. Sci. 2015, 8, 995–1004. [Google Scholar] [CrossRef]
- Wei, J.; Zhao, Y.; Li, H.; Li, G.; Pan, J.; Xu, D.; Zhao, Q.; Yu, D. Hysteresis Analysis Based on the Ferroelectric Effect in Hybrid Perovskite Solar Cells. J. Phys. Chem. Lett. 2014, 5, 3937–3945. [Google Scholar] [CrossRef]
- Bergmann, V.W.; Weber, S.A.L.; Javier Ramos, F.; Nazeeruddin, M.K.; Grätzel, M.; Li, D.; Domanski, A.L.; Lieberwirth, I.; Ahmad, S.; Berger, R. Real-space observation of unbalanced charge distribution inside a perovskite-sensitized solar cell. Nat. Commun. 2014, 5, 5001. [Google Scholar] [CrossRef]
- Ansari, M.I.H.; Qurashi, A.; Nazeeruddin, M.K. Frontiers, opportunities, and challenges in perovskite solar cells: A critical review. J. Photochem. Photobiol. C Photochem. Rev. 2018, 35, 1–24. [Google Scholar] [CrossRef]
- Snaith, H.J.; Abate, A.; Ball, J.M.; Eperon, G.E.; Leijtens, T.; Noel, N.K.; Stranks, S.D.; Wang, J.T.W.; Wojciechowski, K.; Zhang, W. Anomalous Hysteresis in Perovskite Solar Cells. J. Phys. Chem. Lett. 2014, 5, 1511–1515. [Google Scholar] [CrossRef] [PubMed]
- Wei, X.; Wang, X.; Jiang, H.; Huang, Y.; Han, A.; Gao, Q.; Bian, J.; Liu, Z. Numerical simulation and experimental validation of inverted planar perovskite solar cells based on NiOx hole transport layer. Superlattices Microstruct. 2017, 112, 383–393. [Google Scholar] [CrossRef]
- Li, G.; Liu, L.; Wei, F.; Xia, S.; Qian, X. Recent Progress in Modeling, Simulation, and Optimization of Polymer Solar Cells. IEEE J. Photovolt. 2012, 2, 320–340. [Google Scholar] [CrossRef]
- Incropera, F.P.; Dewitt, D.P. Fundamentals of Heat and Mass Transfer; Wiley: Hoboken, NJ, USA, 2007; p. A-5. [Google Scholar]
- Cheacharoen, R.; Rolston, N.; Harwood, D.; Bush, K.A.; Dauskardt, R.H.; McGehee, M.D. Design and understanding of encapsulated perovskite solar cells to withstand temperature cycling. Energy Environ. Sci. 2018, 11, 144–150. [Google Scholar] [CrossRef]
- Rad, H.M.; Zhu, F.; Singh, J. Profiling exciton generation and recombination in conventional and inverted bulk heterojunction organic solar cells. J. Appl. Phys. 2018, 124, 083103. [Google Scholar] [CrossRef]
- Kirchartz, T.; Pieters, B.E.; Kirkpatrick, J.; Rau, U.; Nelson, J. Recombination via tail states in polythiophene: fullerene solar cells. Phys. Rev. B 2011, 83, 115209. [Google Scholar] [CrossRef]
- Mehdizadeh-Rad, H.; Singh, J. Combined influence of Urbach’s tail width energy and mobility of charge carriers on the photovoltaic performance of bulk heterojunction organic solar cells. J. Mater. Sci.: Mater. Electron. 2019, 30, 10064–10072. [Google Scholar] [CrossRef]
- Adelard, L.; Pignolet-Tardan, F.; Mara, T.; Lauret, P.; Garde, F.; Boyer, H. Sky temperature modelisation and applications in building simulation. Renew. Energy 1998, 15, 418–430. [Google Scholar] [CrossRef]
- Rad, H.M.; Ameri, M. Energy and exergy study of unglazed transpired collector-2stage. Sol. Energy 2016, 132, 570–586. [Google Scholar] [CrossRef]
- McAdams, W.H. Heat transmission; Mcgraw-Hill Book Company, Inc.: London, UK, 1954; pp. 165–184. [Google Scholar]
- Ullbrich, S.; Fischer, A.; Tang, Z.; Ávila, J.; Bolink, H.J.; Reineke, S.; Vandewal, K. Electrothermal Feedback and Absorption-Induced Open-Circuit-Voltage Turnover in Solar Cells. Phys. Rev. Appl. 2018, 9, 051003. [Google Scholar] [CrossRef]
- Kim, K.; Jung, B.; Kumar, N.; Eom, Y.; Kim, W. Modulation of light absorption by optical spacer in perovskite solar cells. Phys. Status Solidi (RRL) Rapid Res. Lett. 2016, 10, 592–595. [Google Scholar] [CrossRef]
- Heiderhoff, R.; Haeger, T.; Pourdavoud, N.; Hu, T.; Al-Khafaji, M.; Mayer, A.; Chen, Y.; Scheer, H.C.; Riedl, T. Thermal Conductivity of Methylammonium Lead Halide Perovskite Single Crystals and Thin Films: A Comparative Study. J. Phys. Chem. C 2017, 121, 28306–28311. [Google Scholar] [CrossRef]


| Parameter | Value |
|---|---|
| 0.9 | |
| 1000 | |
| (m/s) | 0.1 |
| () | 300 |
| 0.6 | |
| (eV) | 1.5 |
| , ( | |
| (density of tail state at interface) (() | |
| (density of tail state in the active layer) ) | |
| ( | 2.5 |
| ( | 5 |
| 45 |
© 2019 by the authors. Licensee MDPI, Basel, Switzerland. This article is an open access article distributed under the terms and conditions of the Creative Commons Attribution (CC BY) license (http://creativecommons.org/licenses/by/4.0/).
Share and Cite
Mehdizadeh-Rad, H.; Singh, J. Influence of Interfacial Traps on the Operating Temperature of Perovskite Solar Cells. Materials 2019, 12, 2727. https://doi.org/10.3390/ma12172727
Mehdizadeh-Rad H, Singh J. Influence of Interfacial Traps on the Operating Temperature of Perovskite Solar Cells. Materials. 2019; 12(17):2727. https://doi.org/10.3390/ma12172727
Chicago/Turabian StyleMehdizadeh-Rad, Hooman, and Jai Singh. 2019. "Influence of Interfacial Traps on the Operating Temperature of Perovskite Solar Cells" Materials 12, no. 17: 2727. https://doi.org/10.3390/ma12172727
APA StyleMehdizadeh-Rad, H., & Singh, J. (2019). Influence of Interfacial Traps on the Operating Temperature of Perovskite Solar Cells. Materials, 12(17), 2727. https://doi.org/10.3390/ma12172727