Development of Organosilicon-Based Superhydrophobic Coatings through Atmospheric Pressure Plasma Polymerization of HMDSO in Nitrogen Plasma


Abstract
:1. Introduction
2. Experimental Procedure
- Facilitates the ignition and maintenance of weaker plasmas, which leads to lower monomer fragmentation and is generally favorable in hydrophobic applications;
- Limits the diffusion of oxygen from the ambient air into the discharge zone;
- Increases the coating thickness by reducing the loss of reactive species into the ambient atmosphere;
- Increases the cross-linking of the silica-like network by increasing the Si-O-Si chain lengths.
3. Results and Discussion
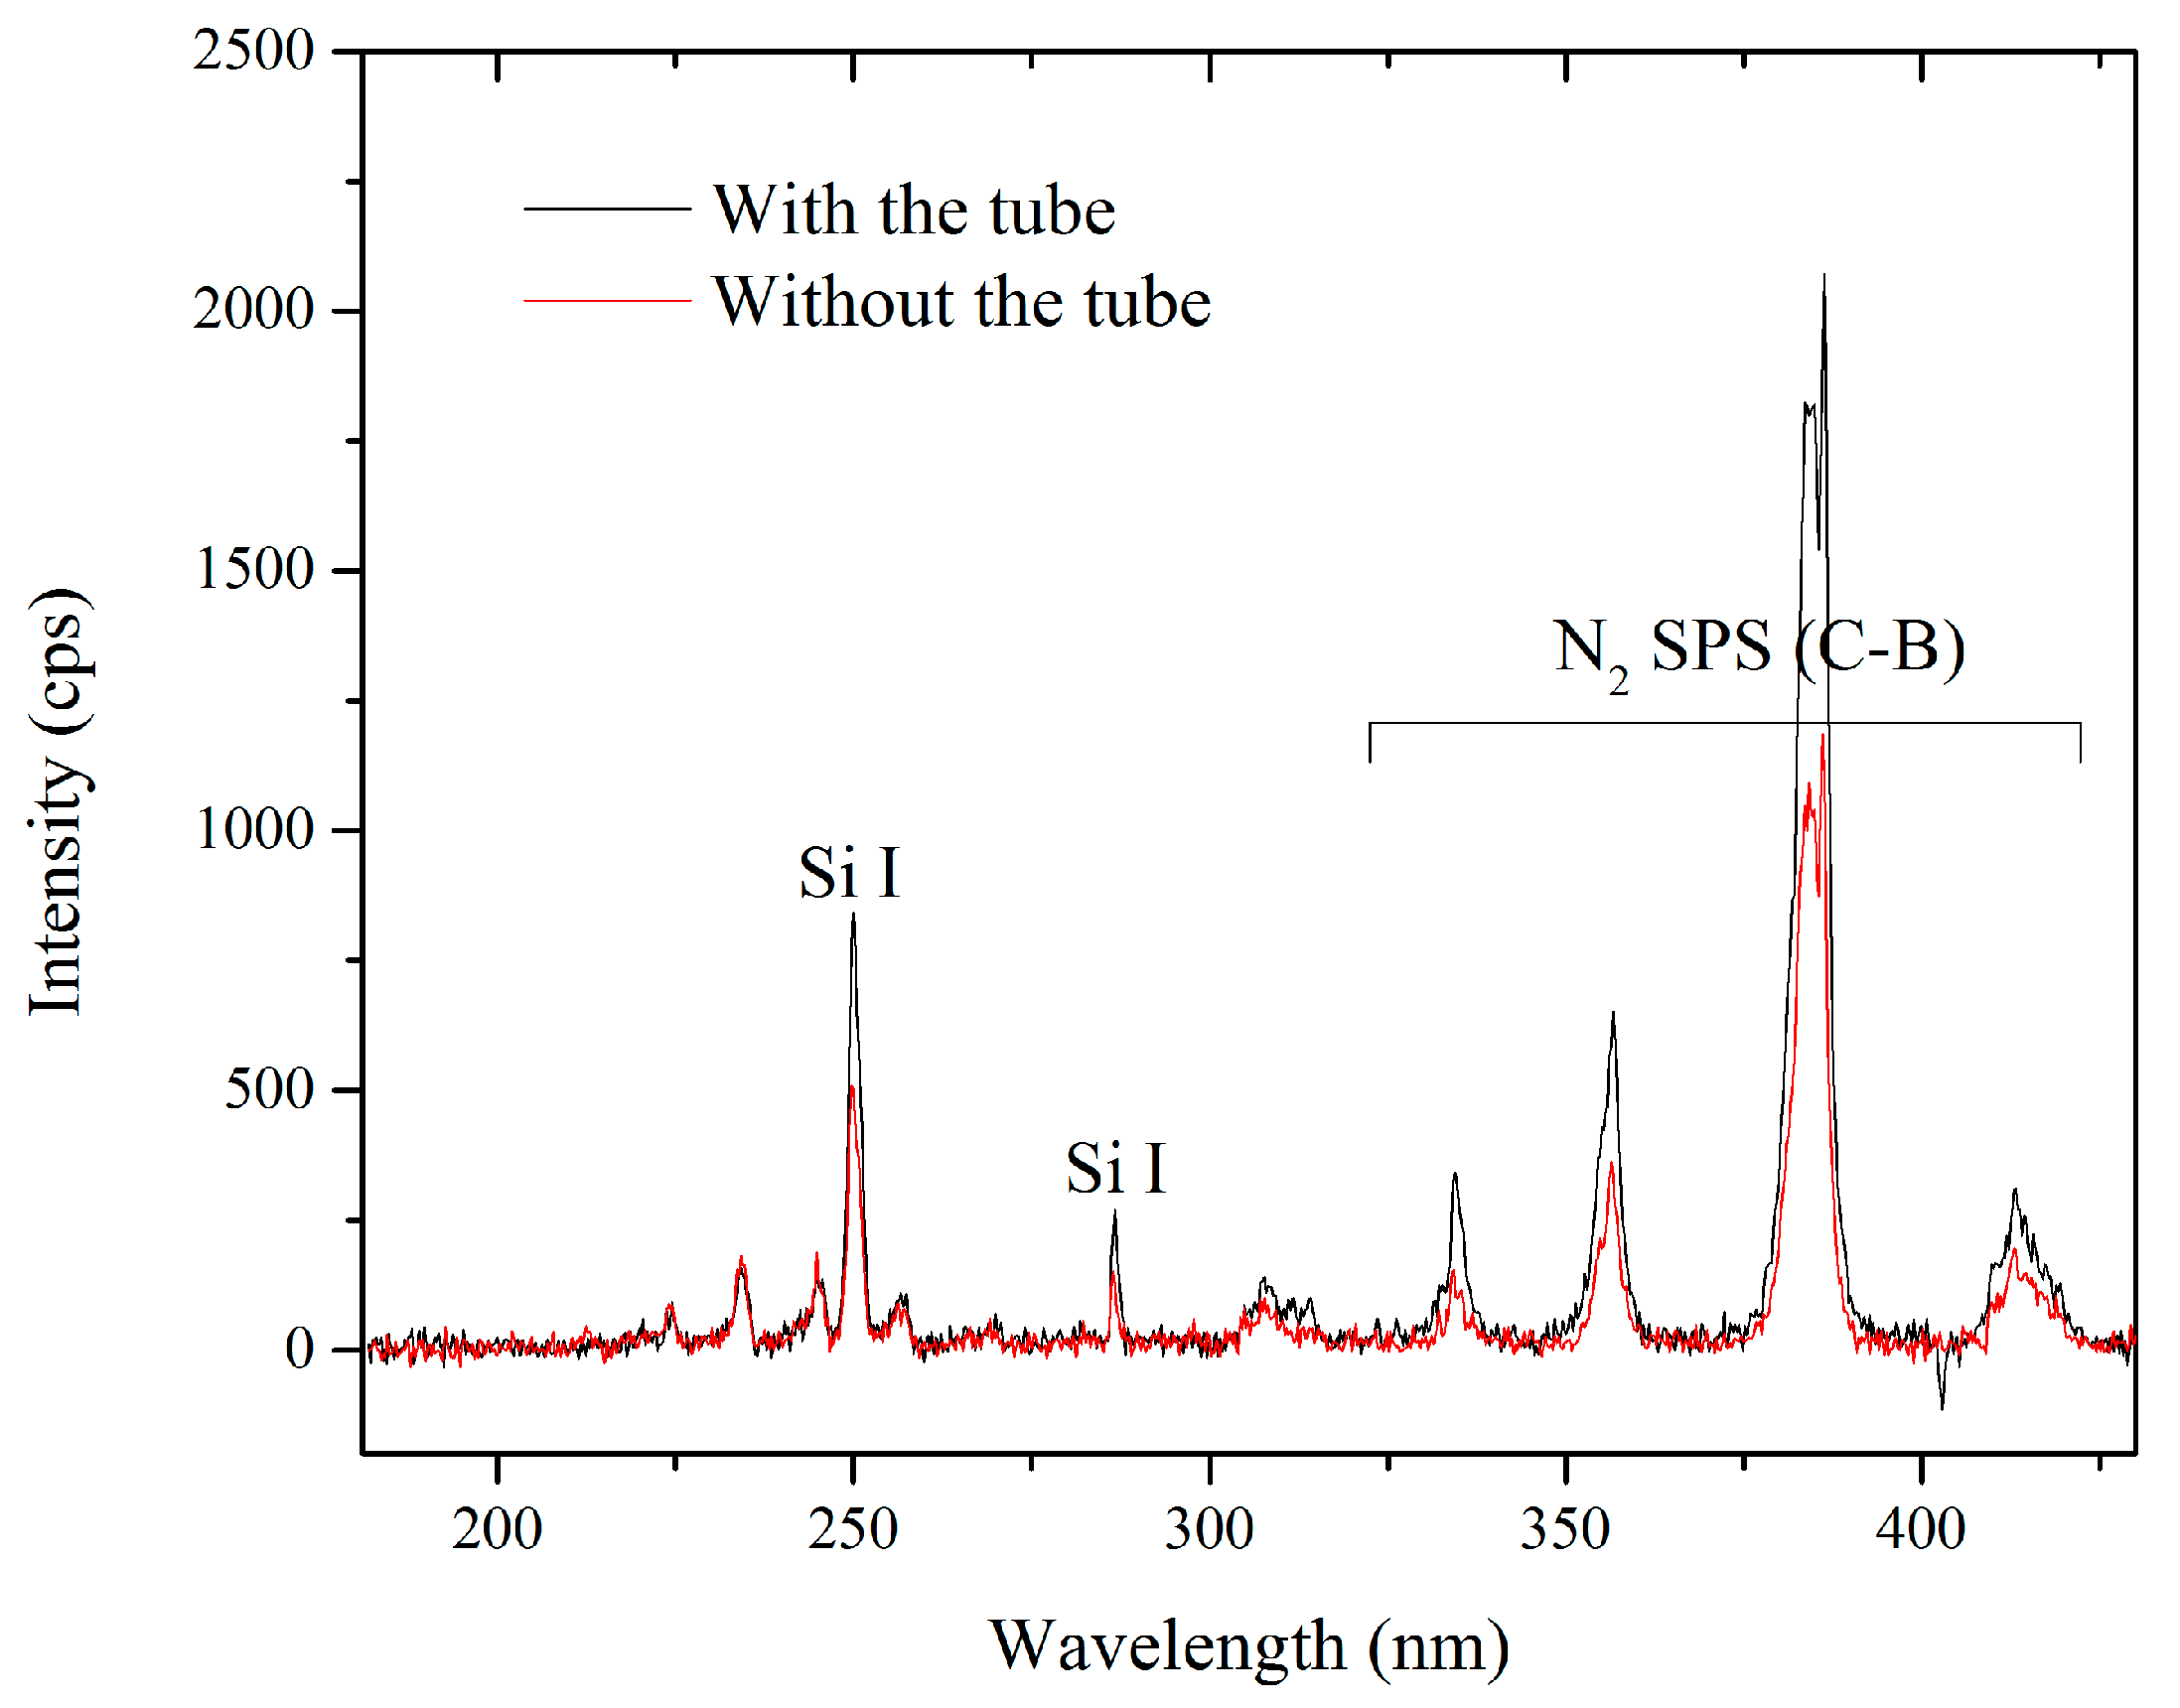
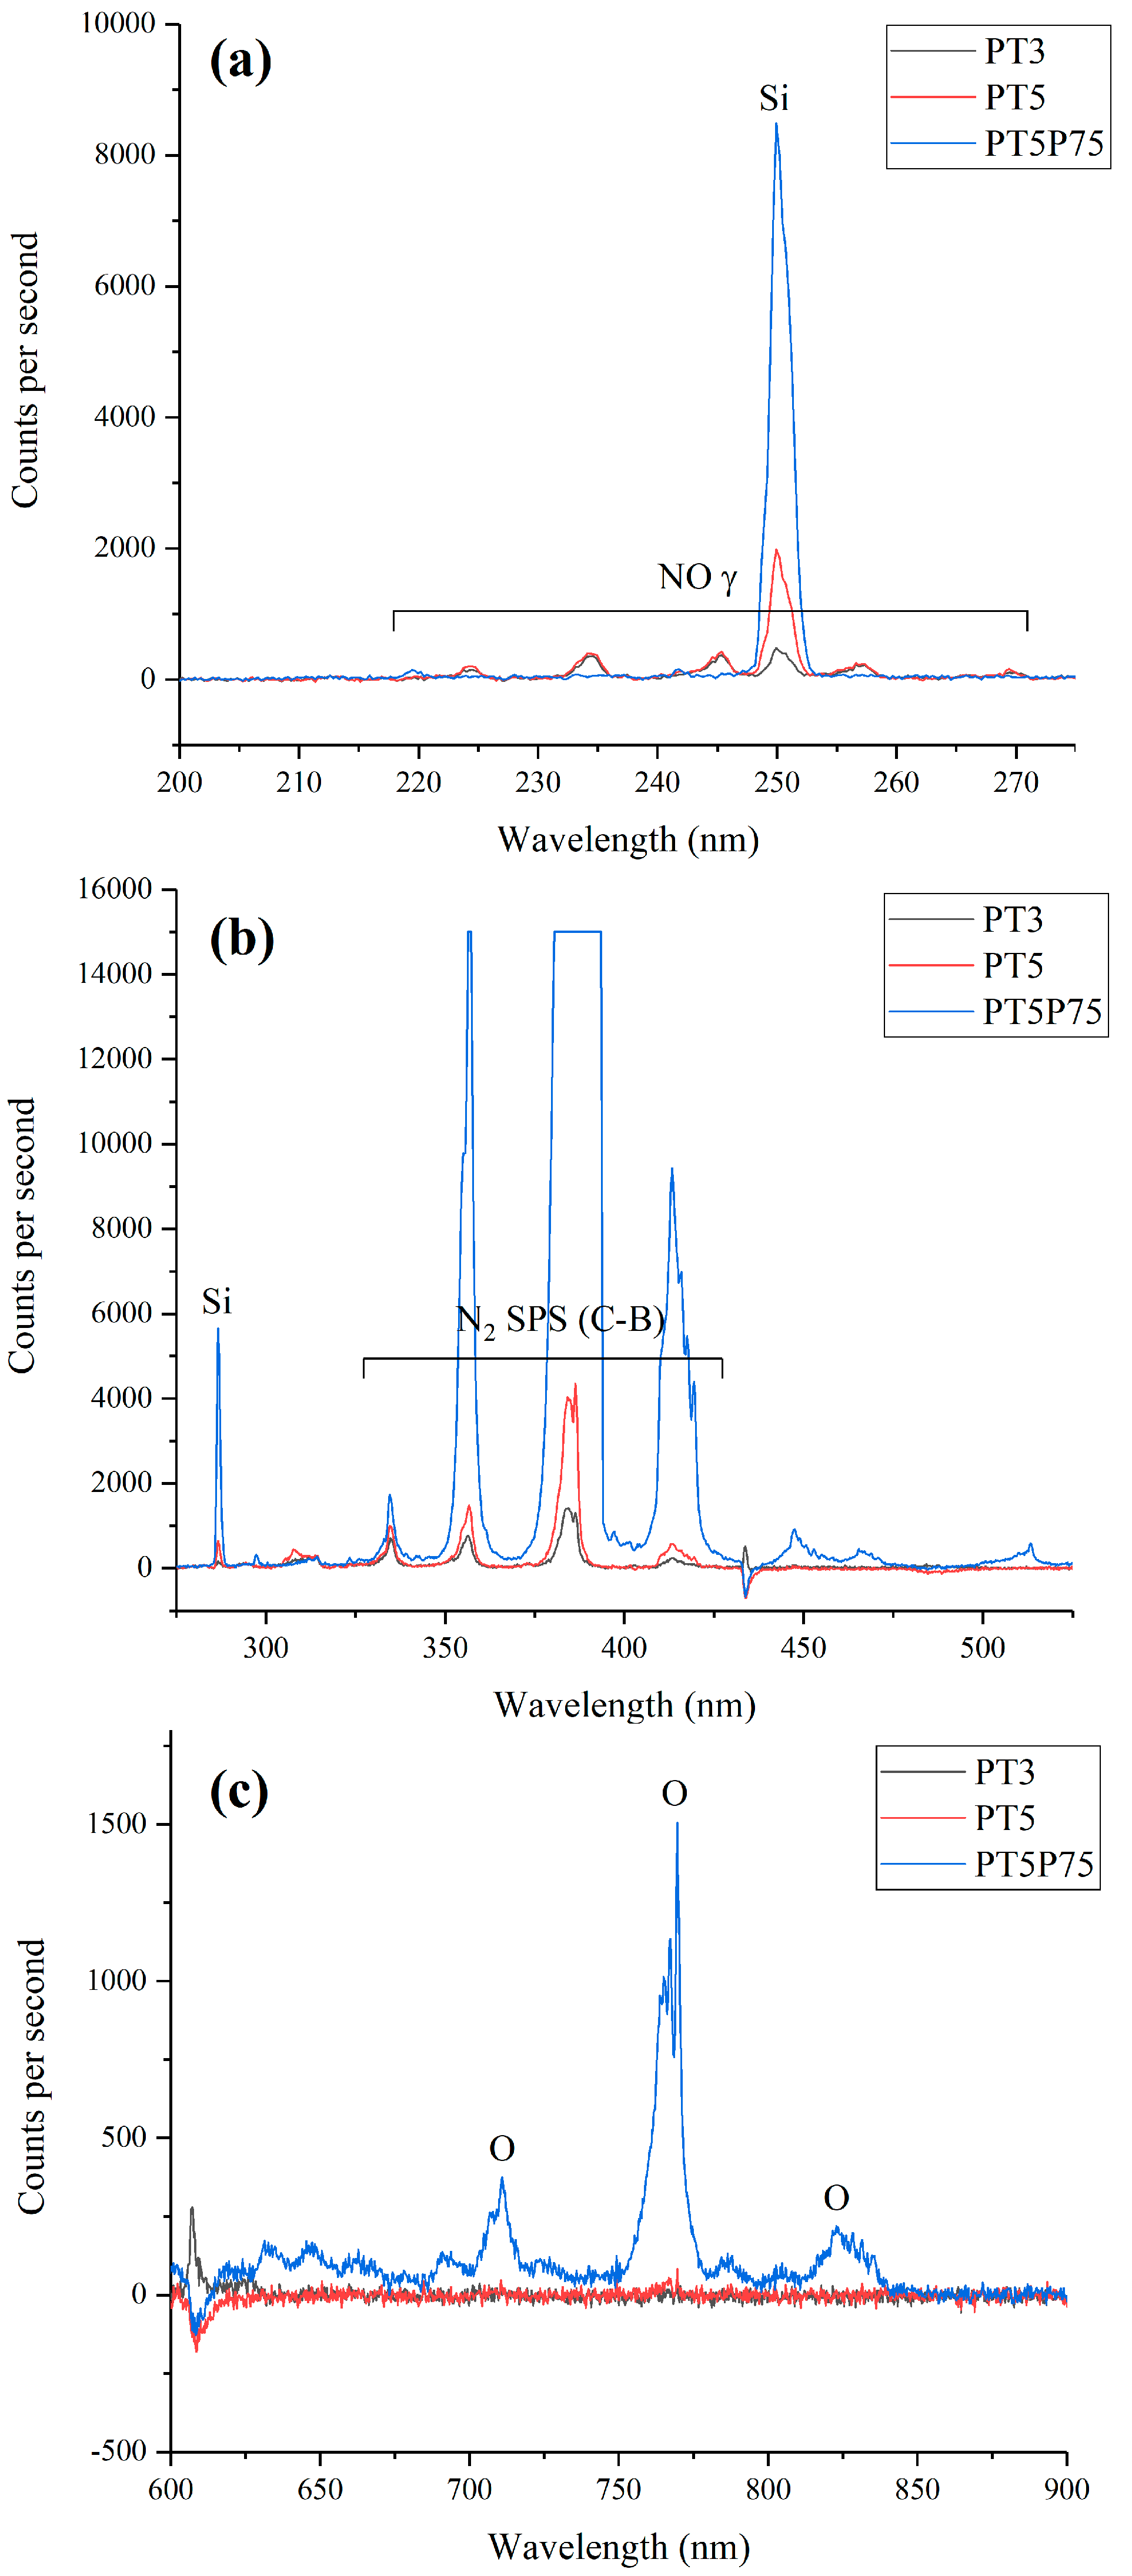
3.1. Optical Emission Spectroscopy
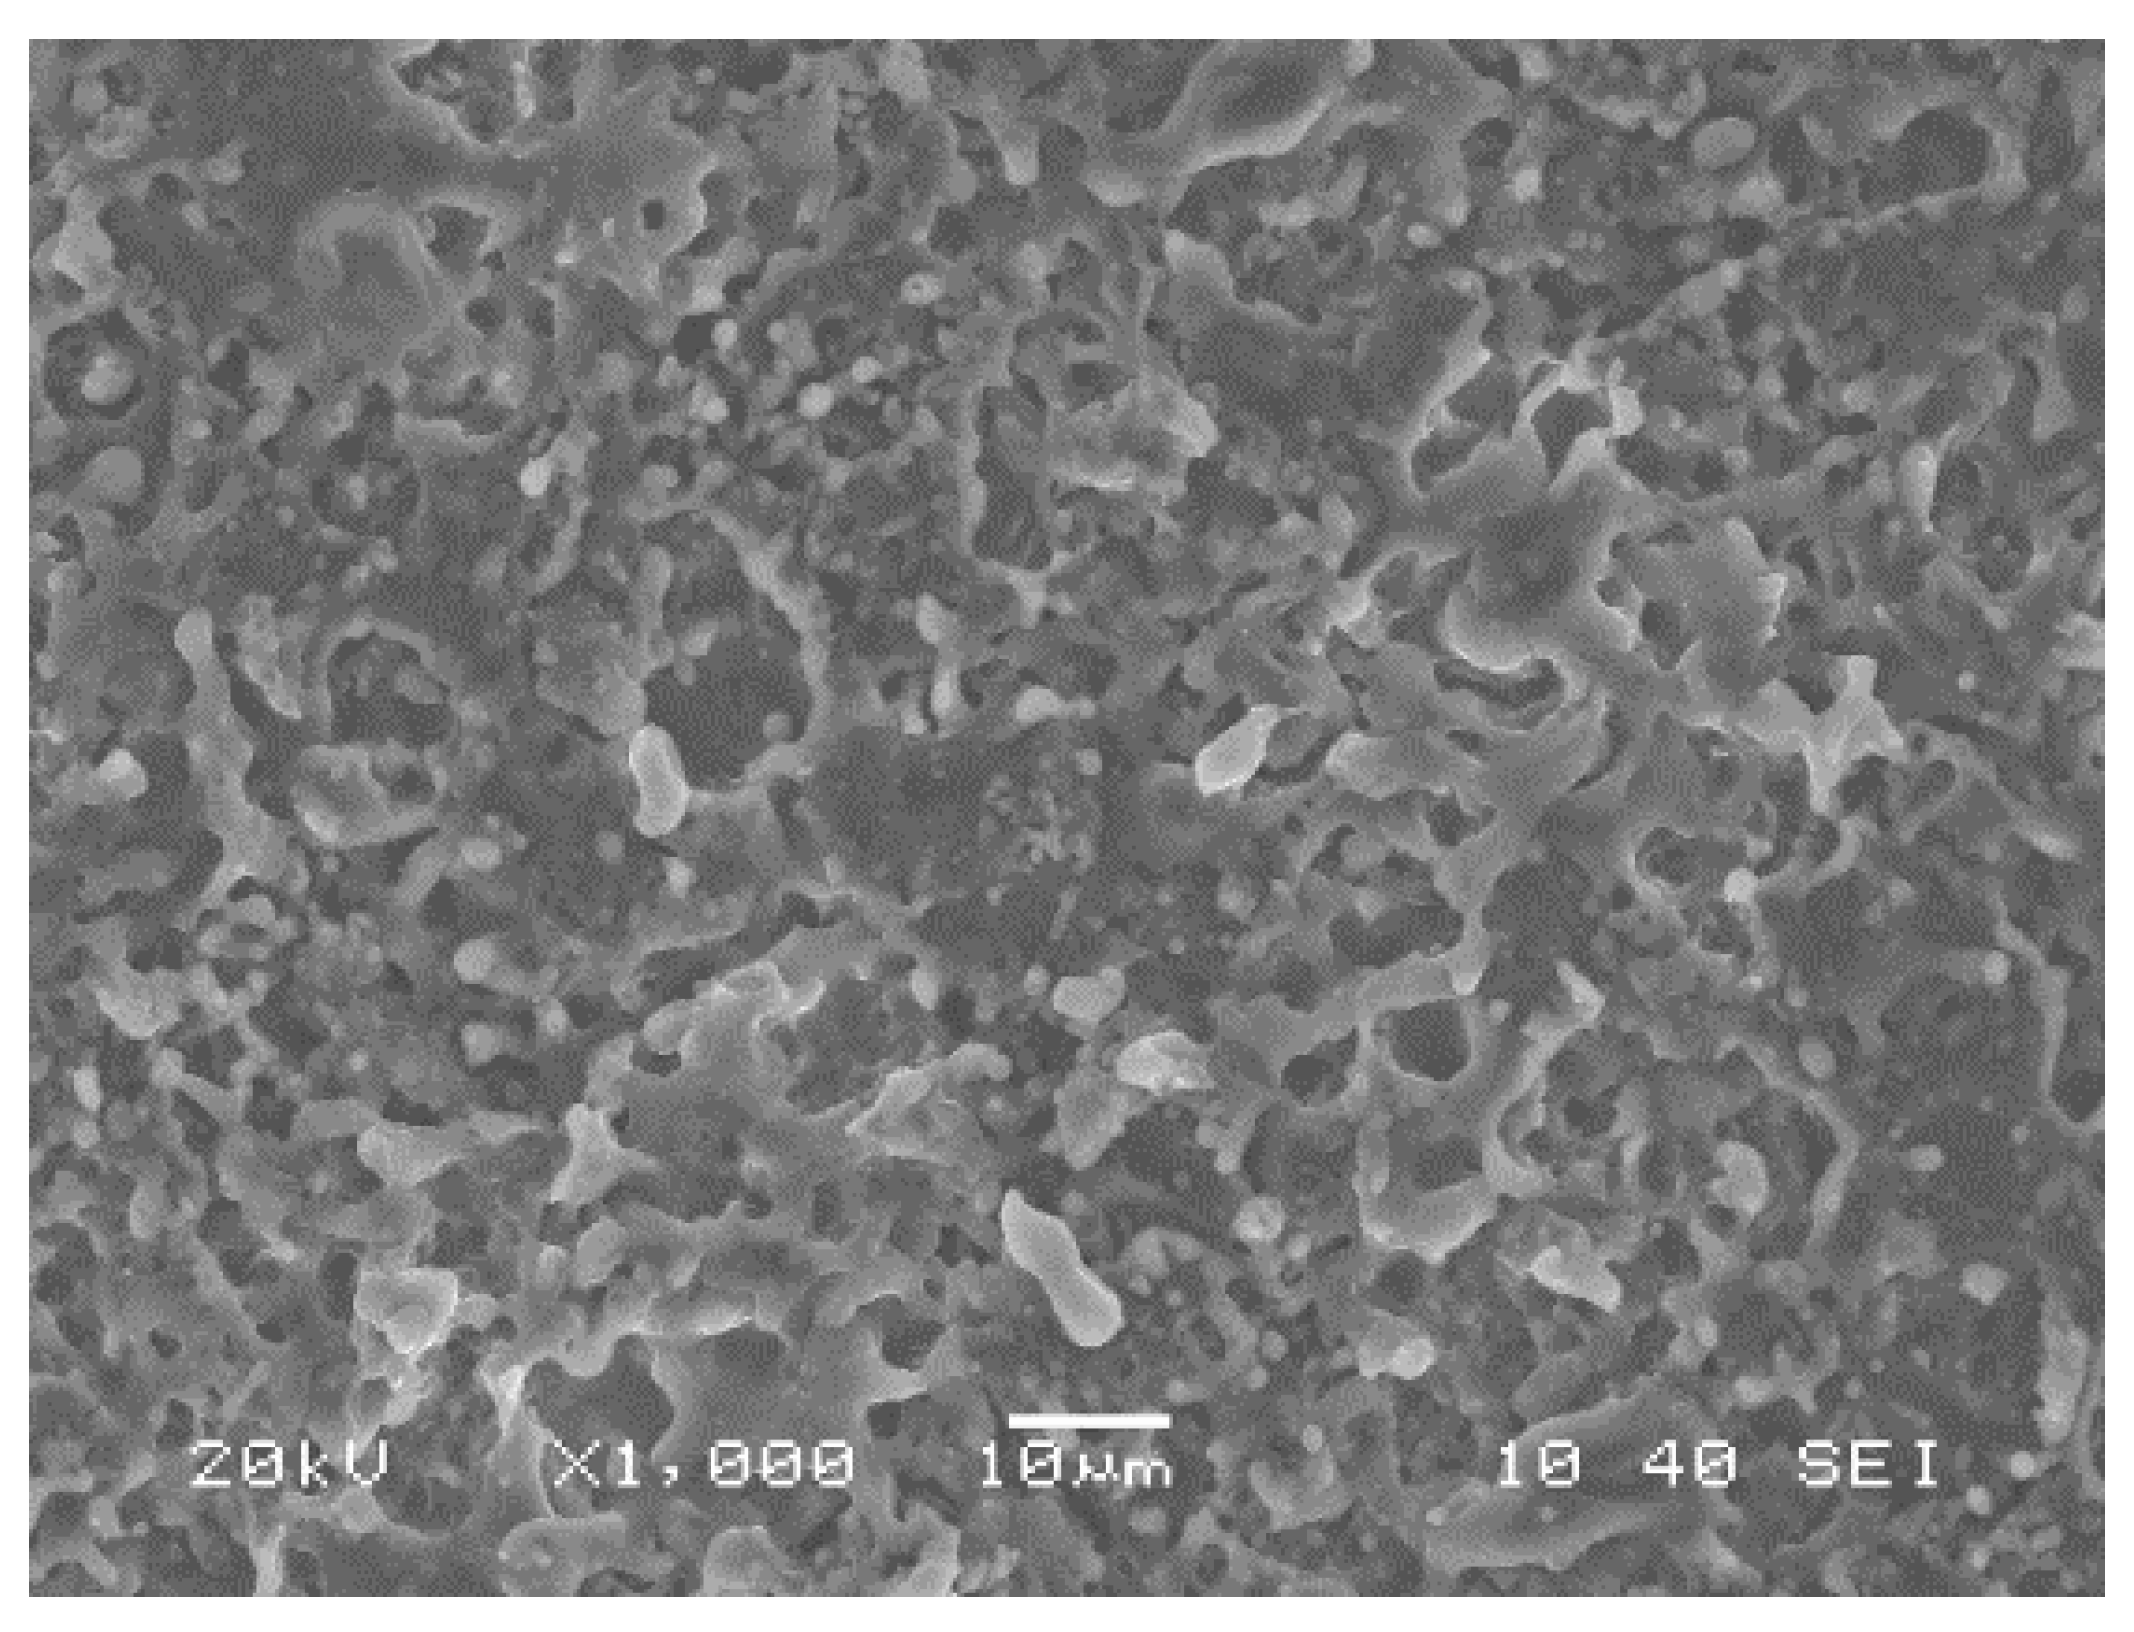
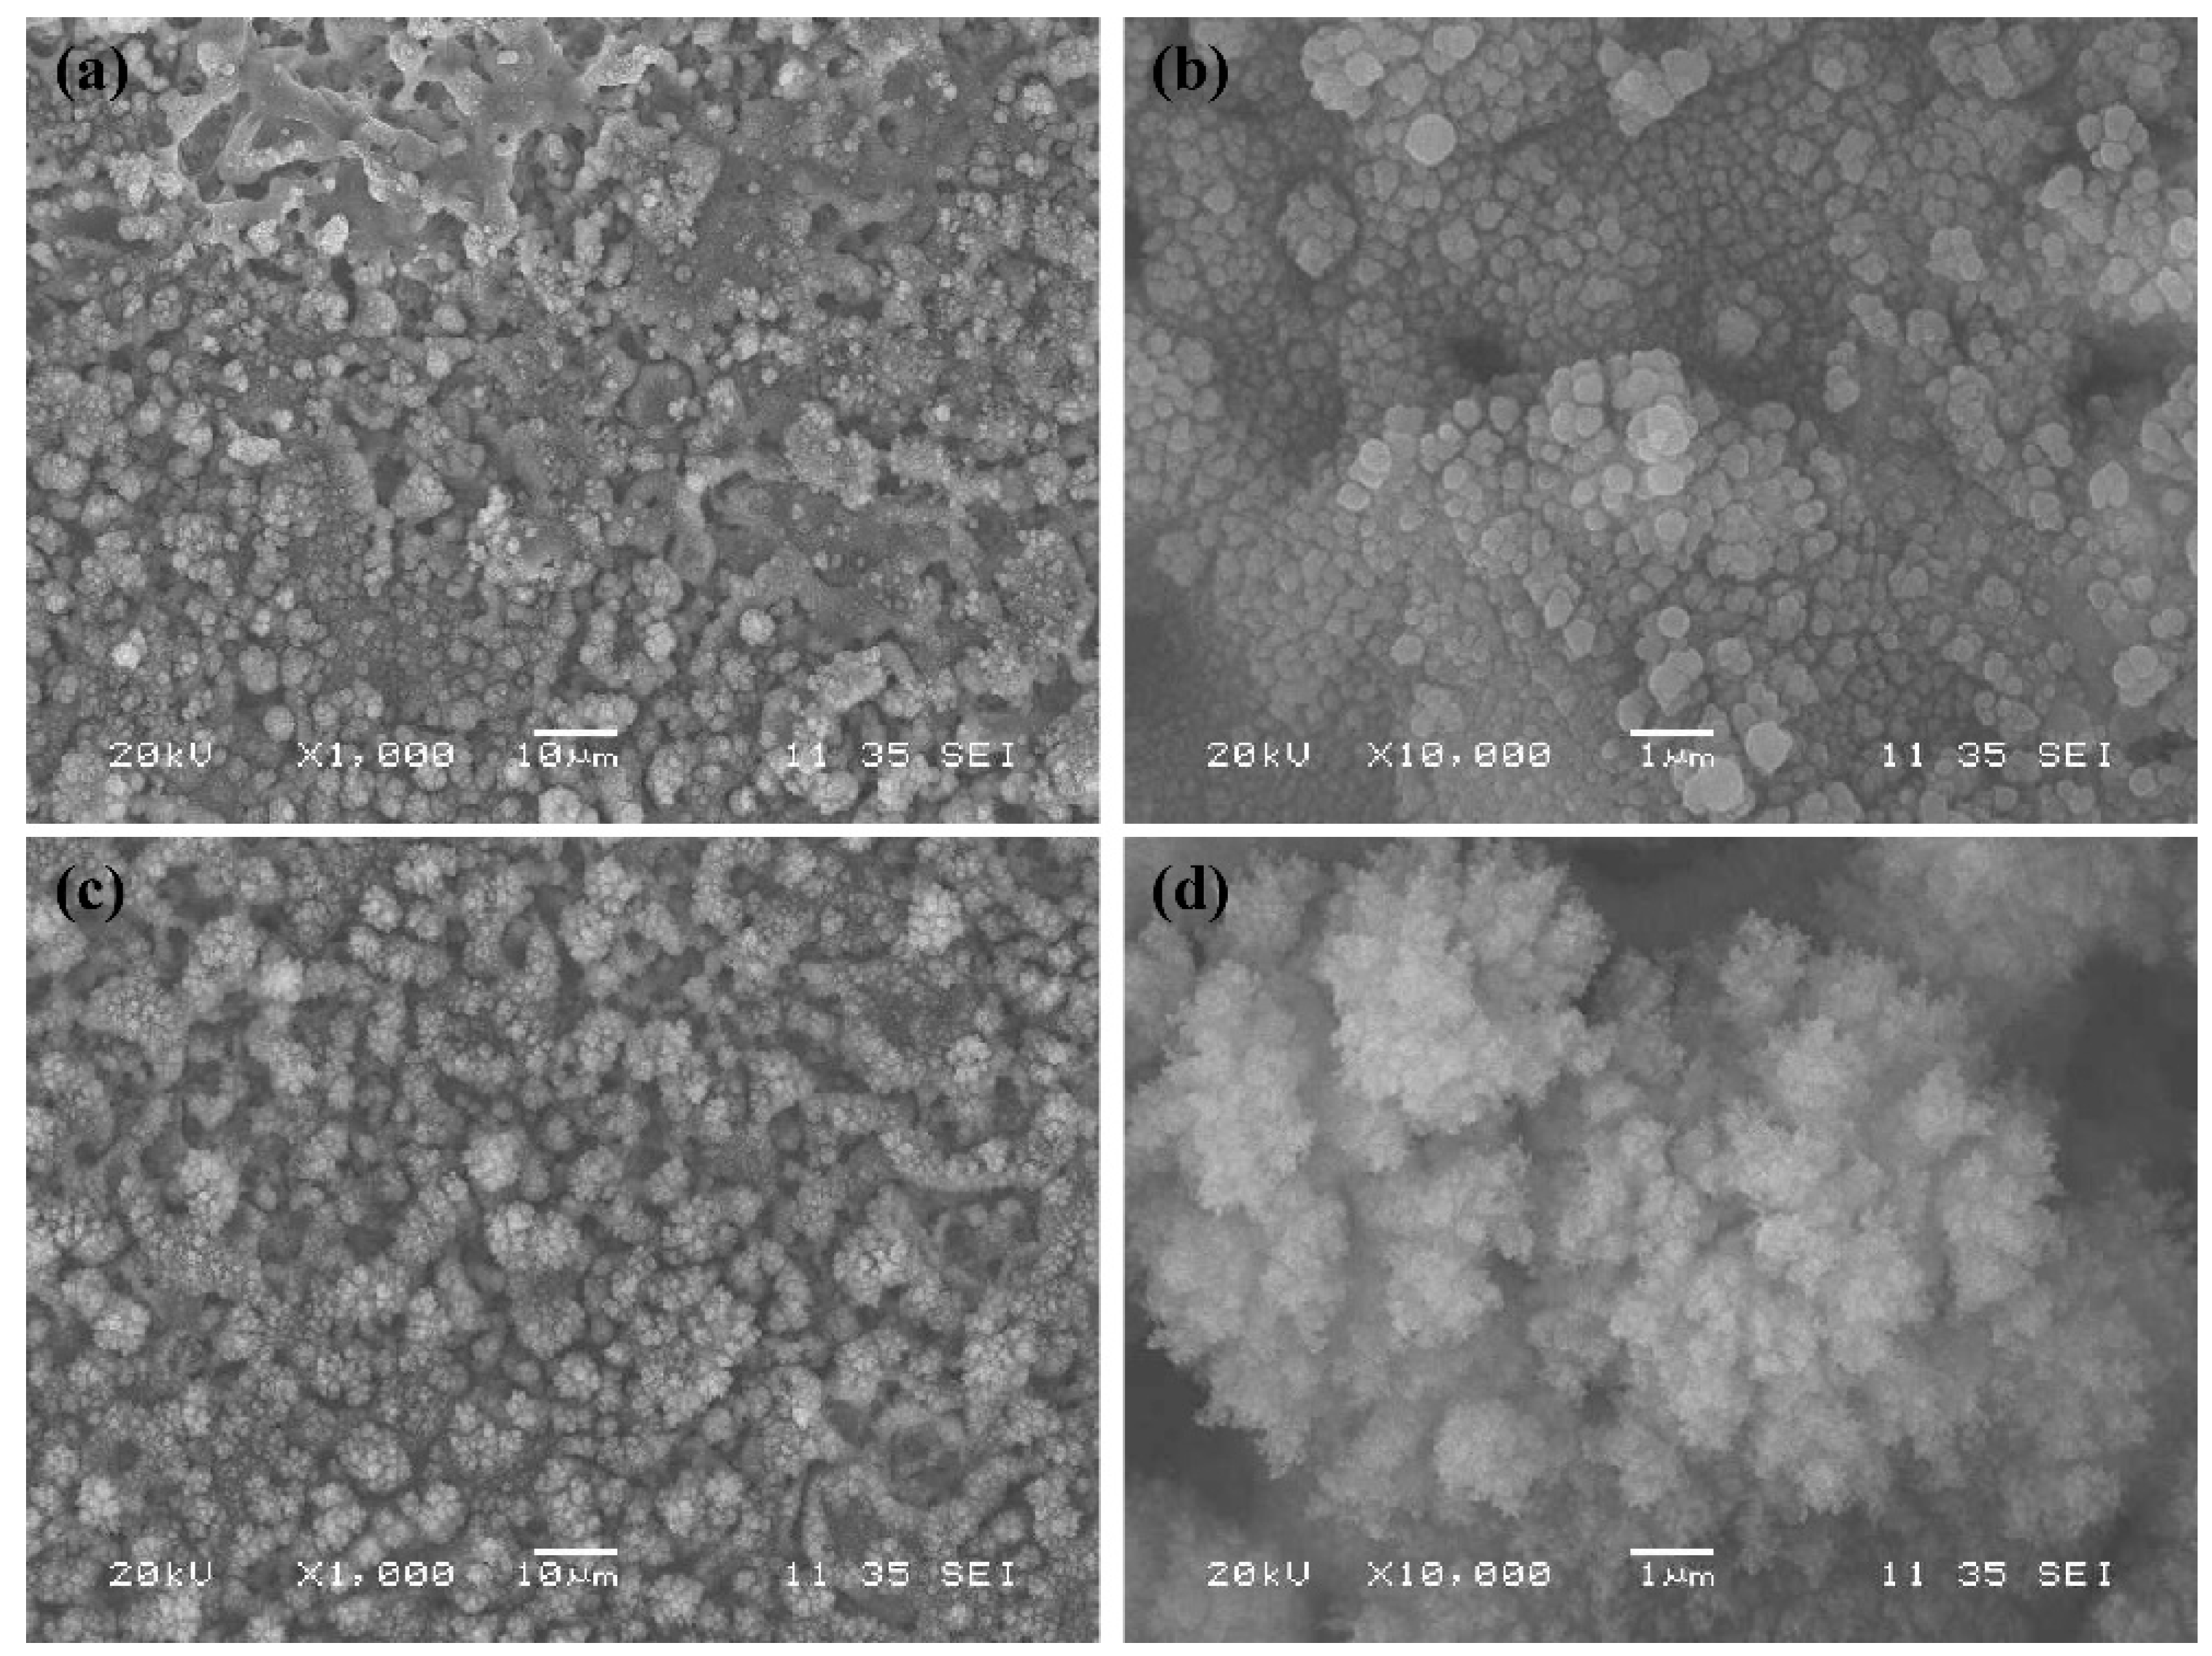
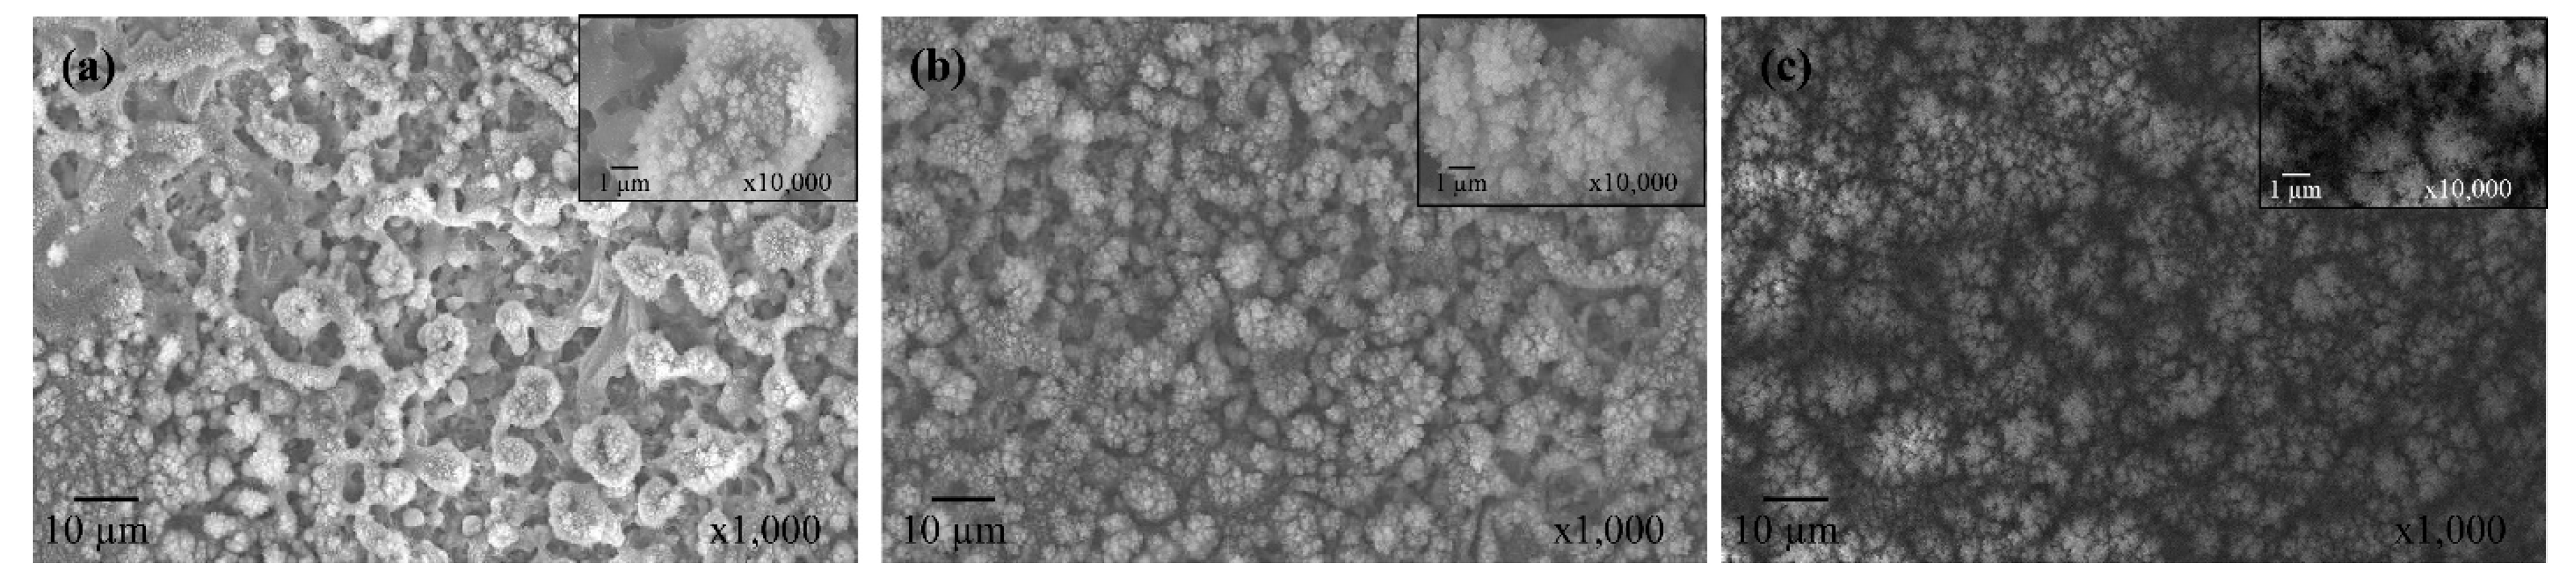
3.2. Surface Morphology
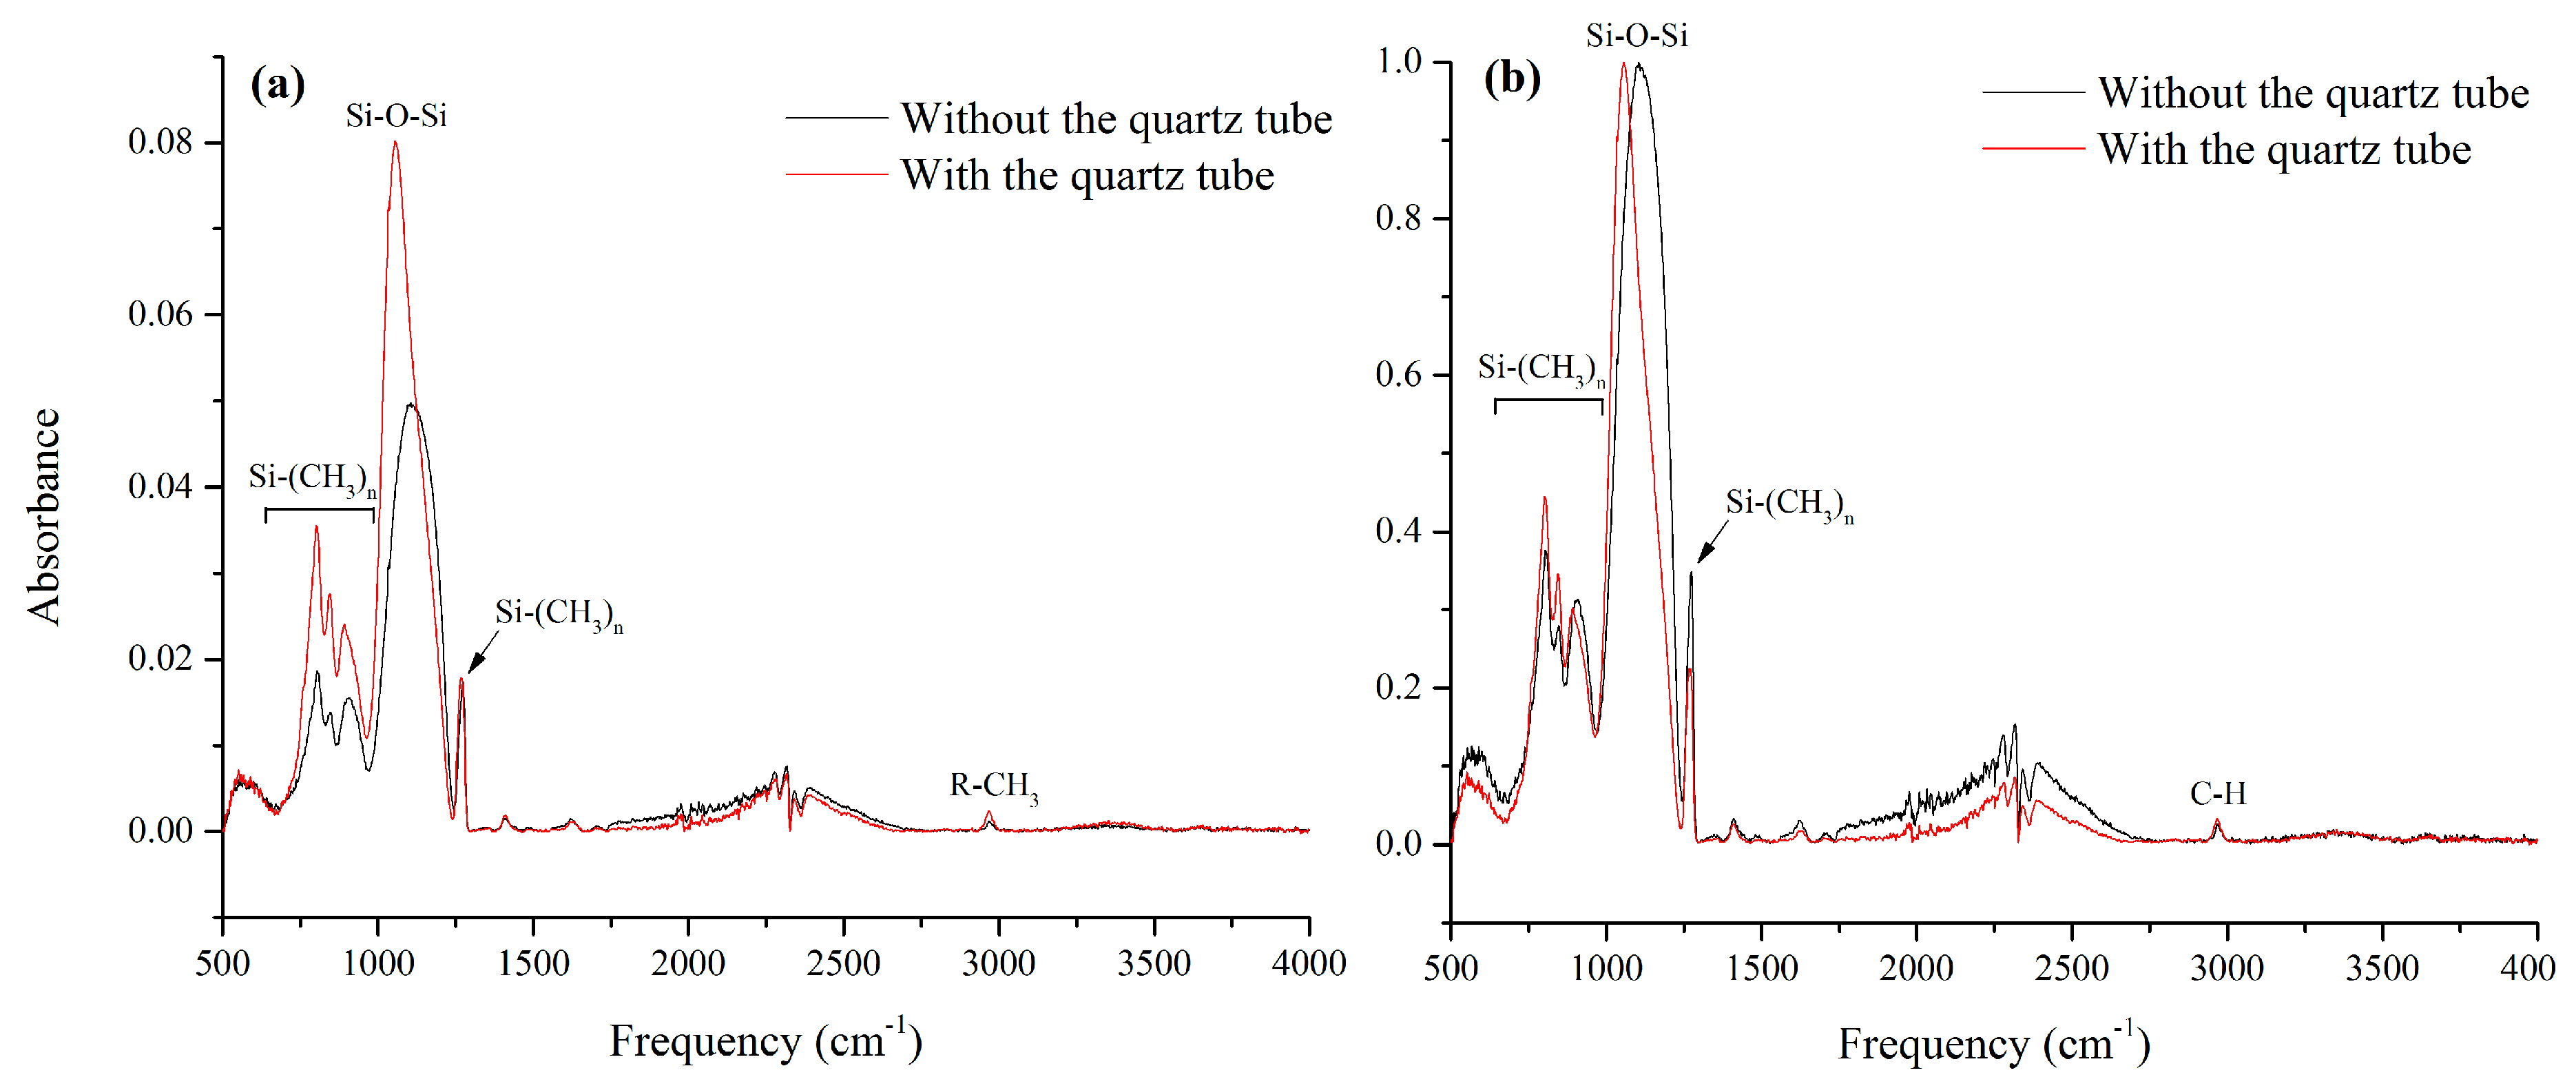
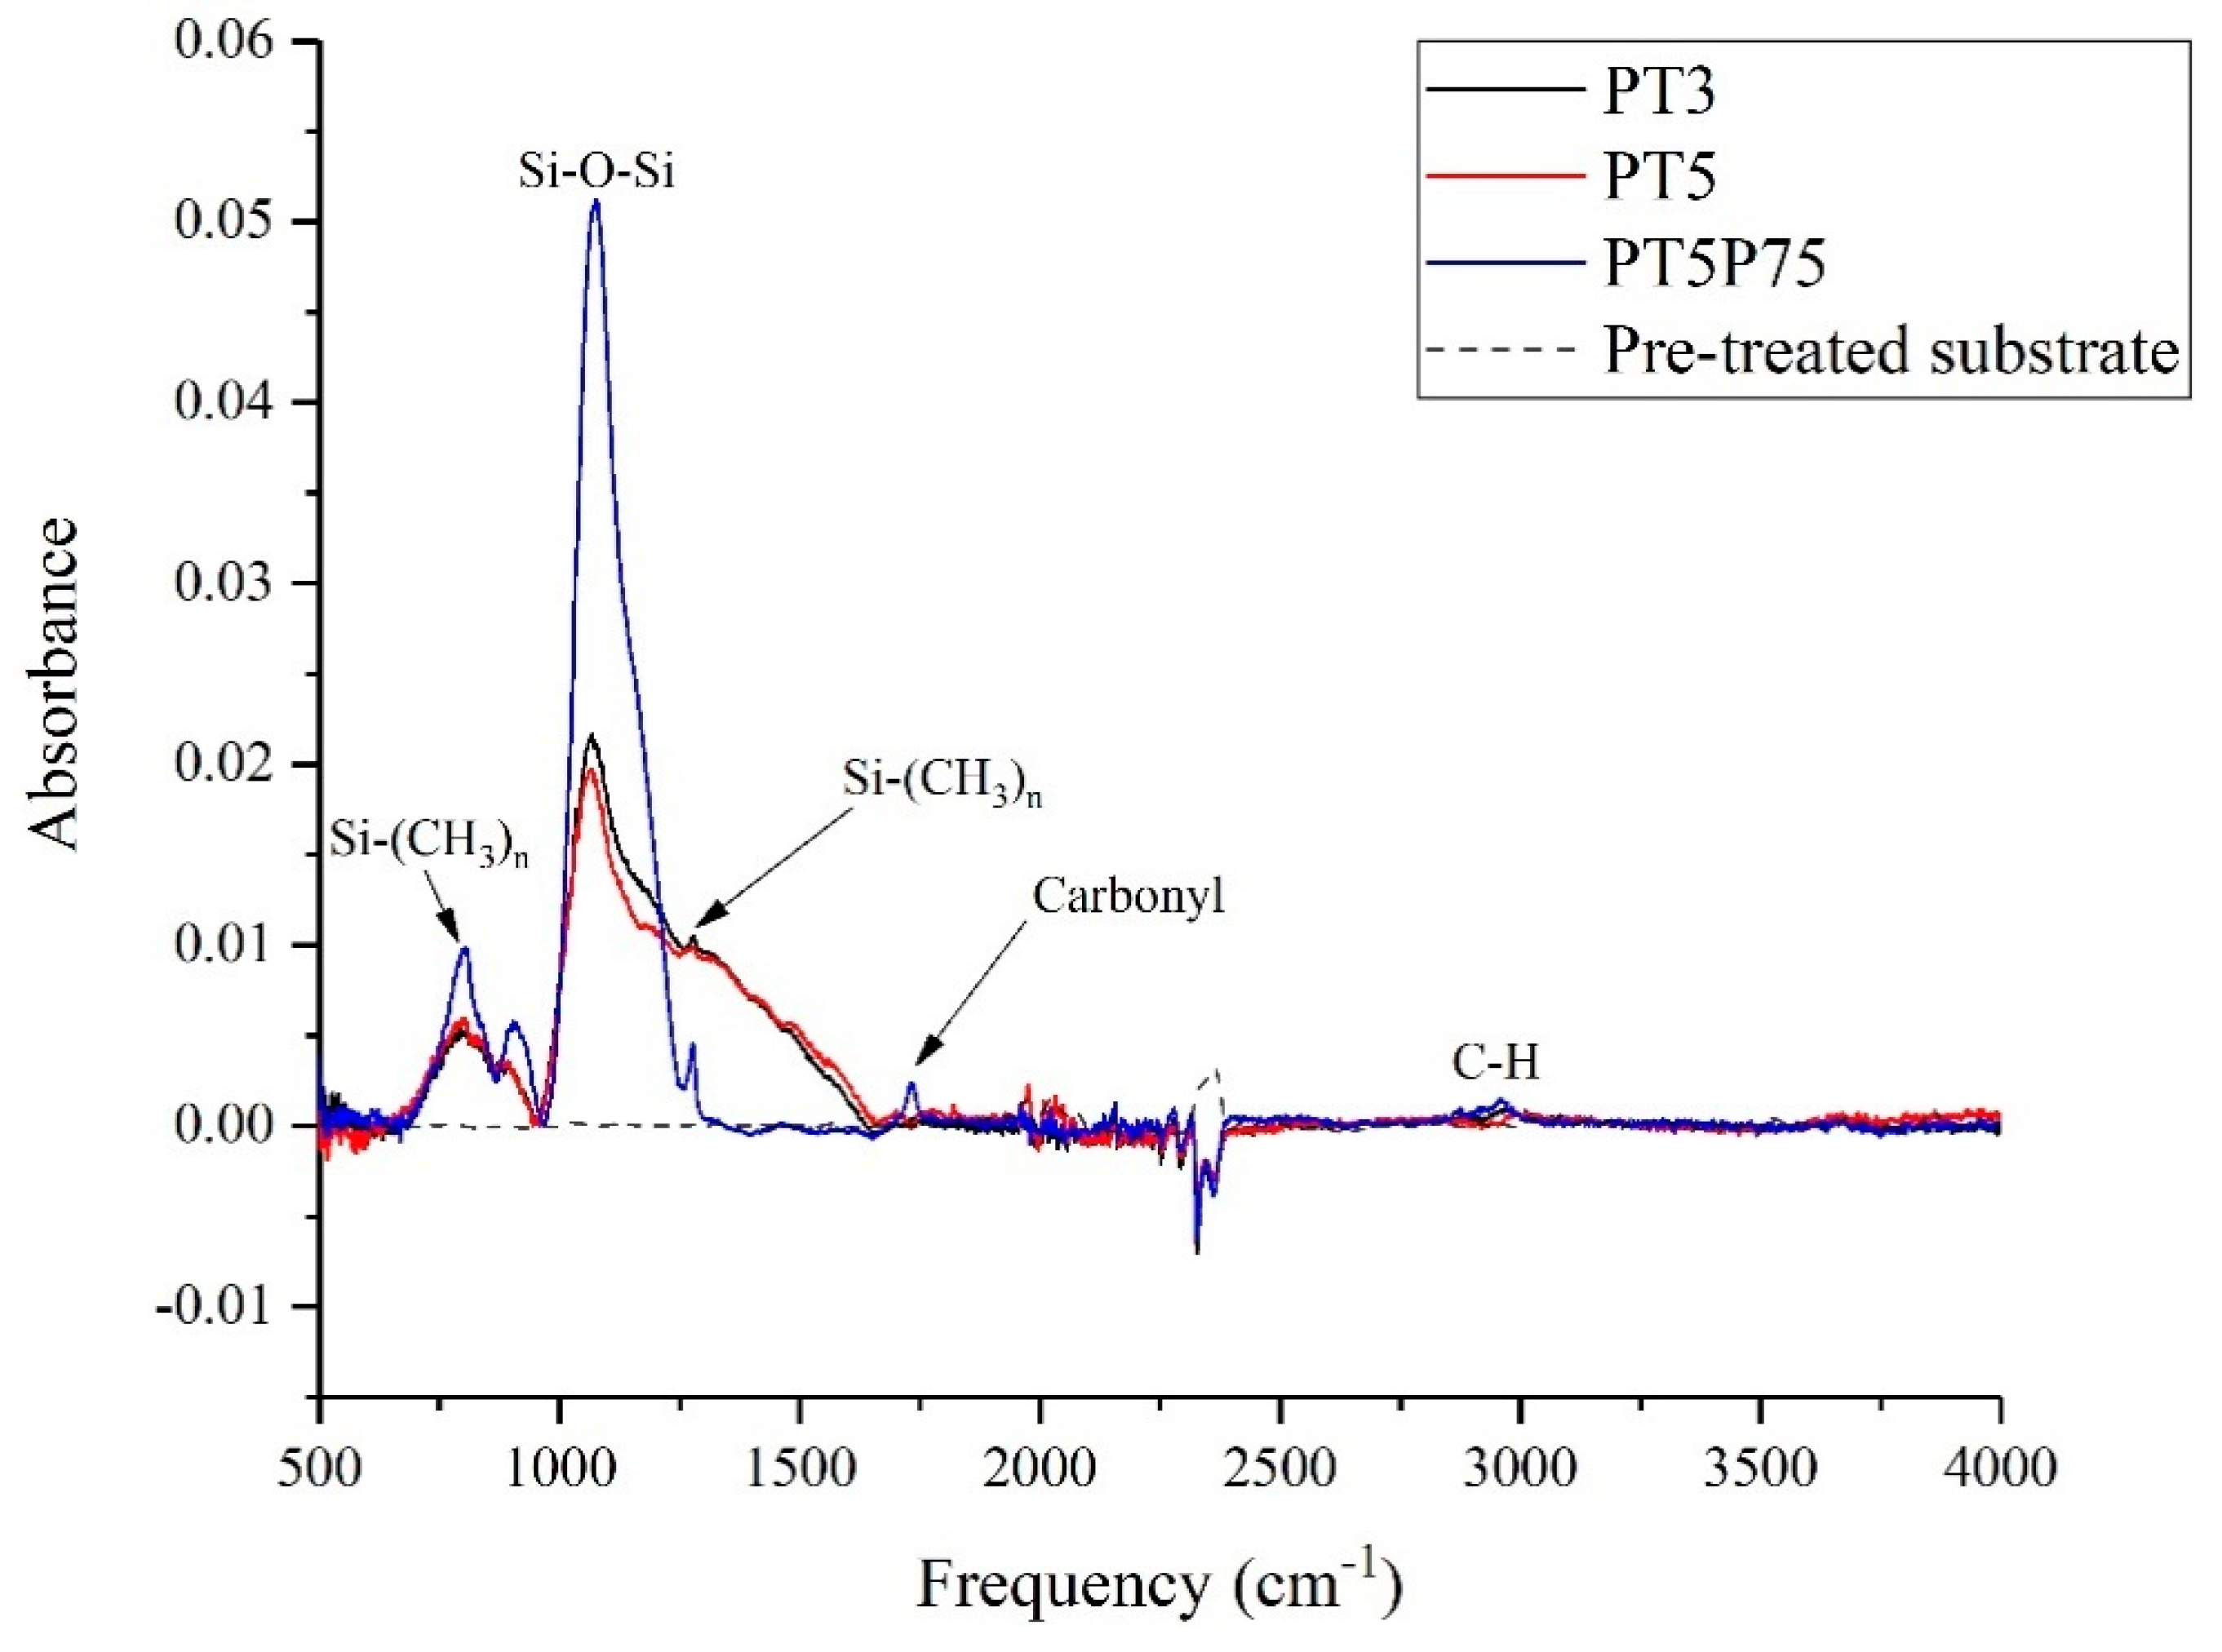
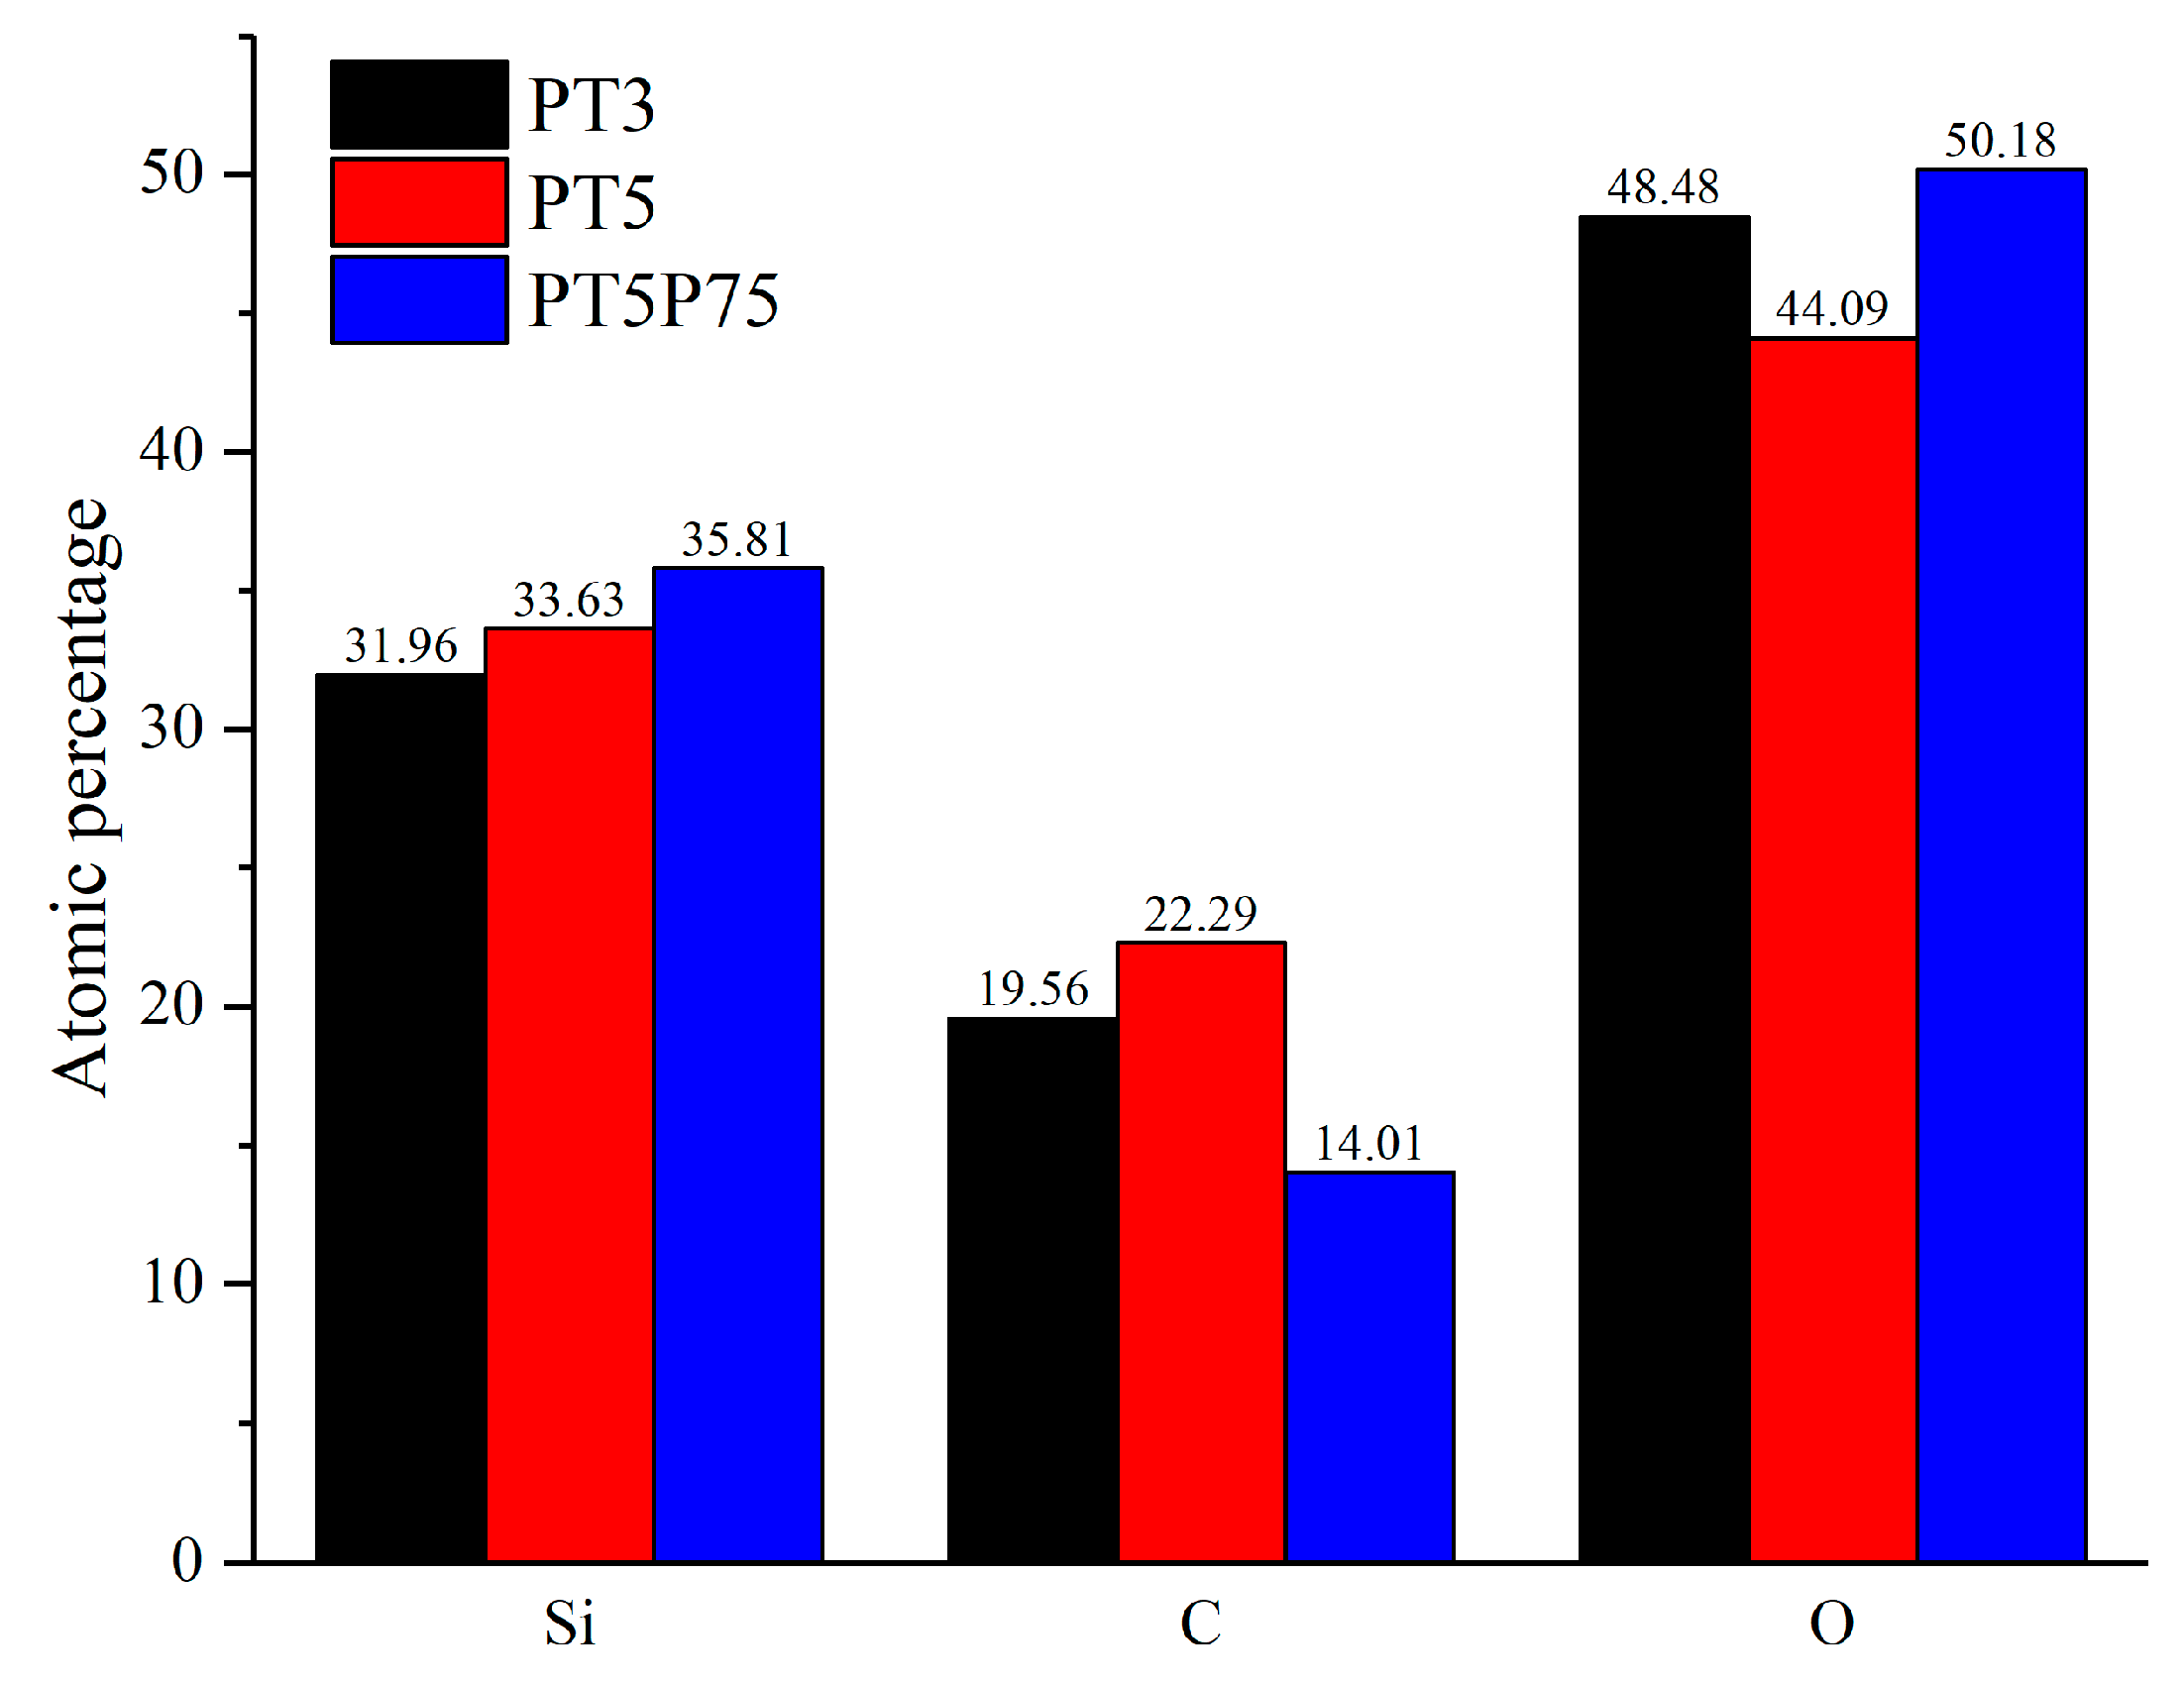
3.3. Chemical Composition
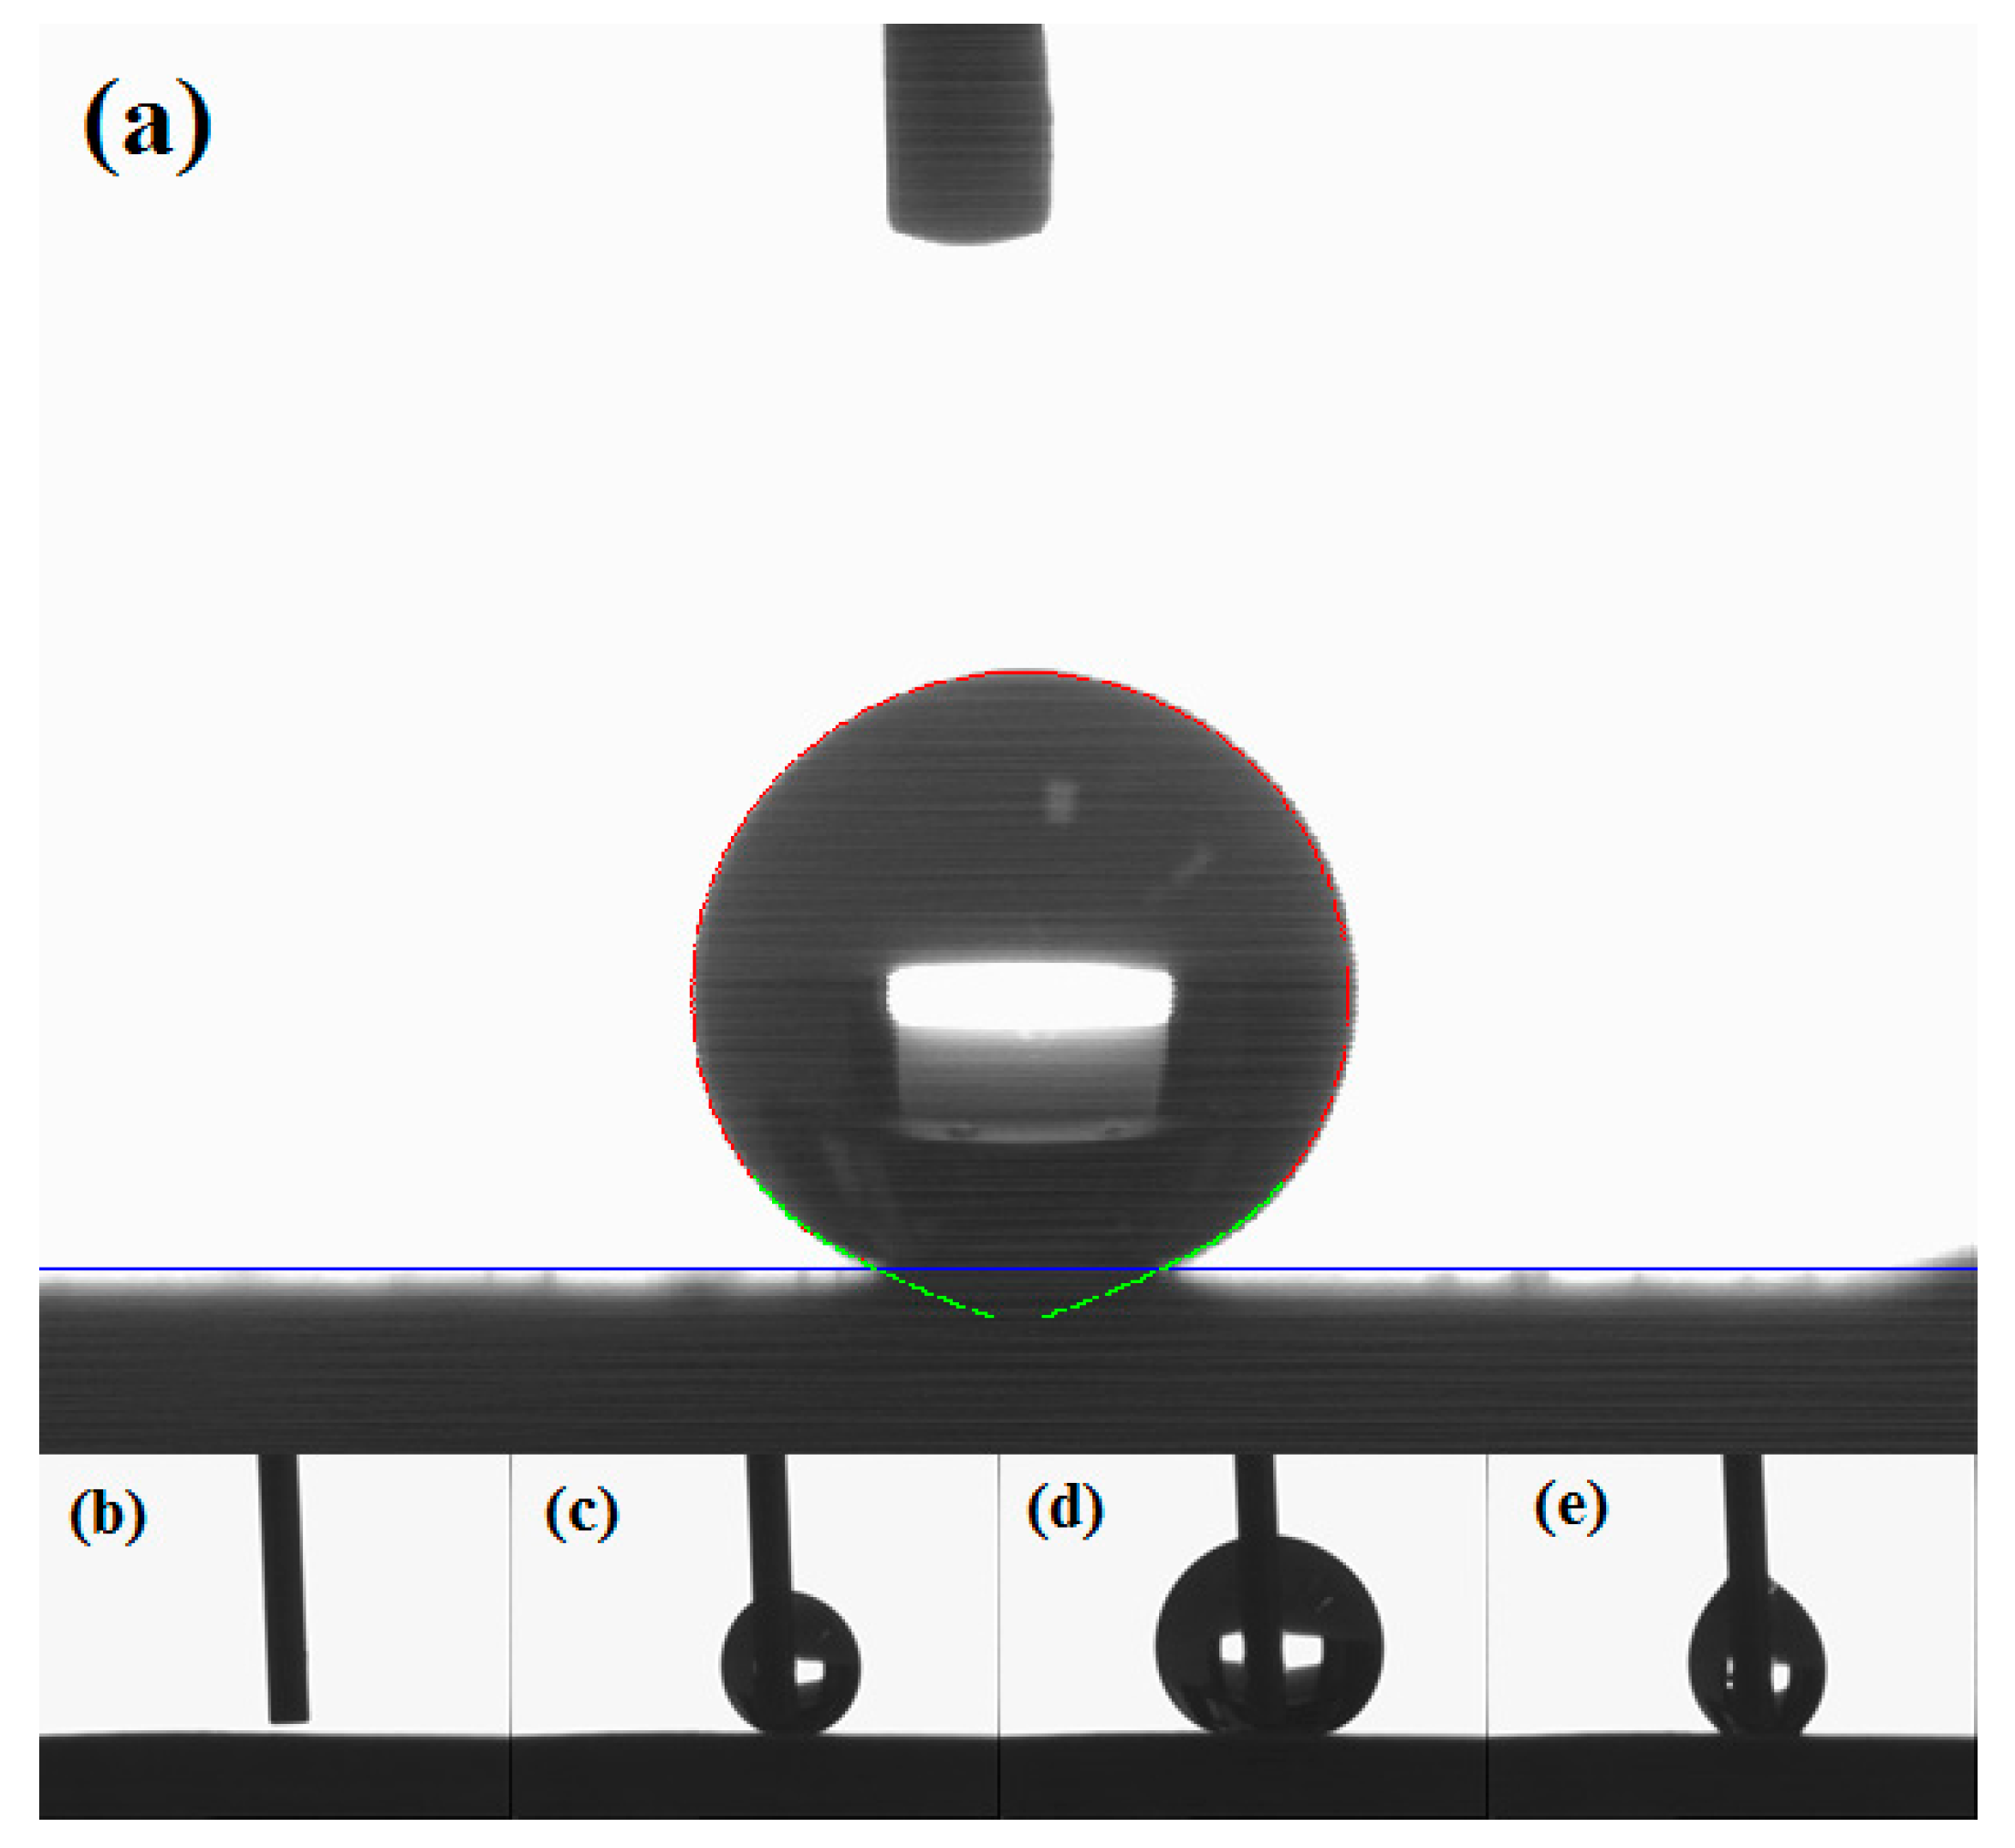
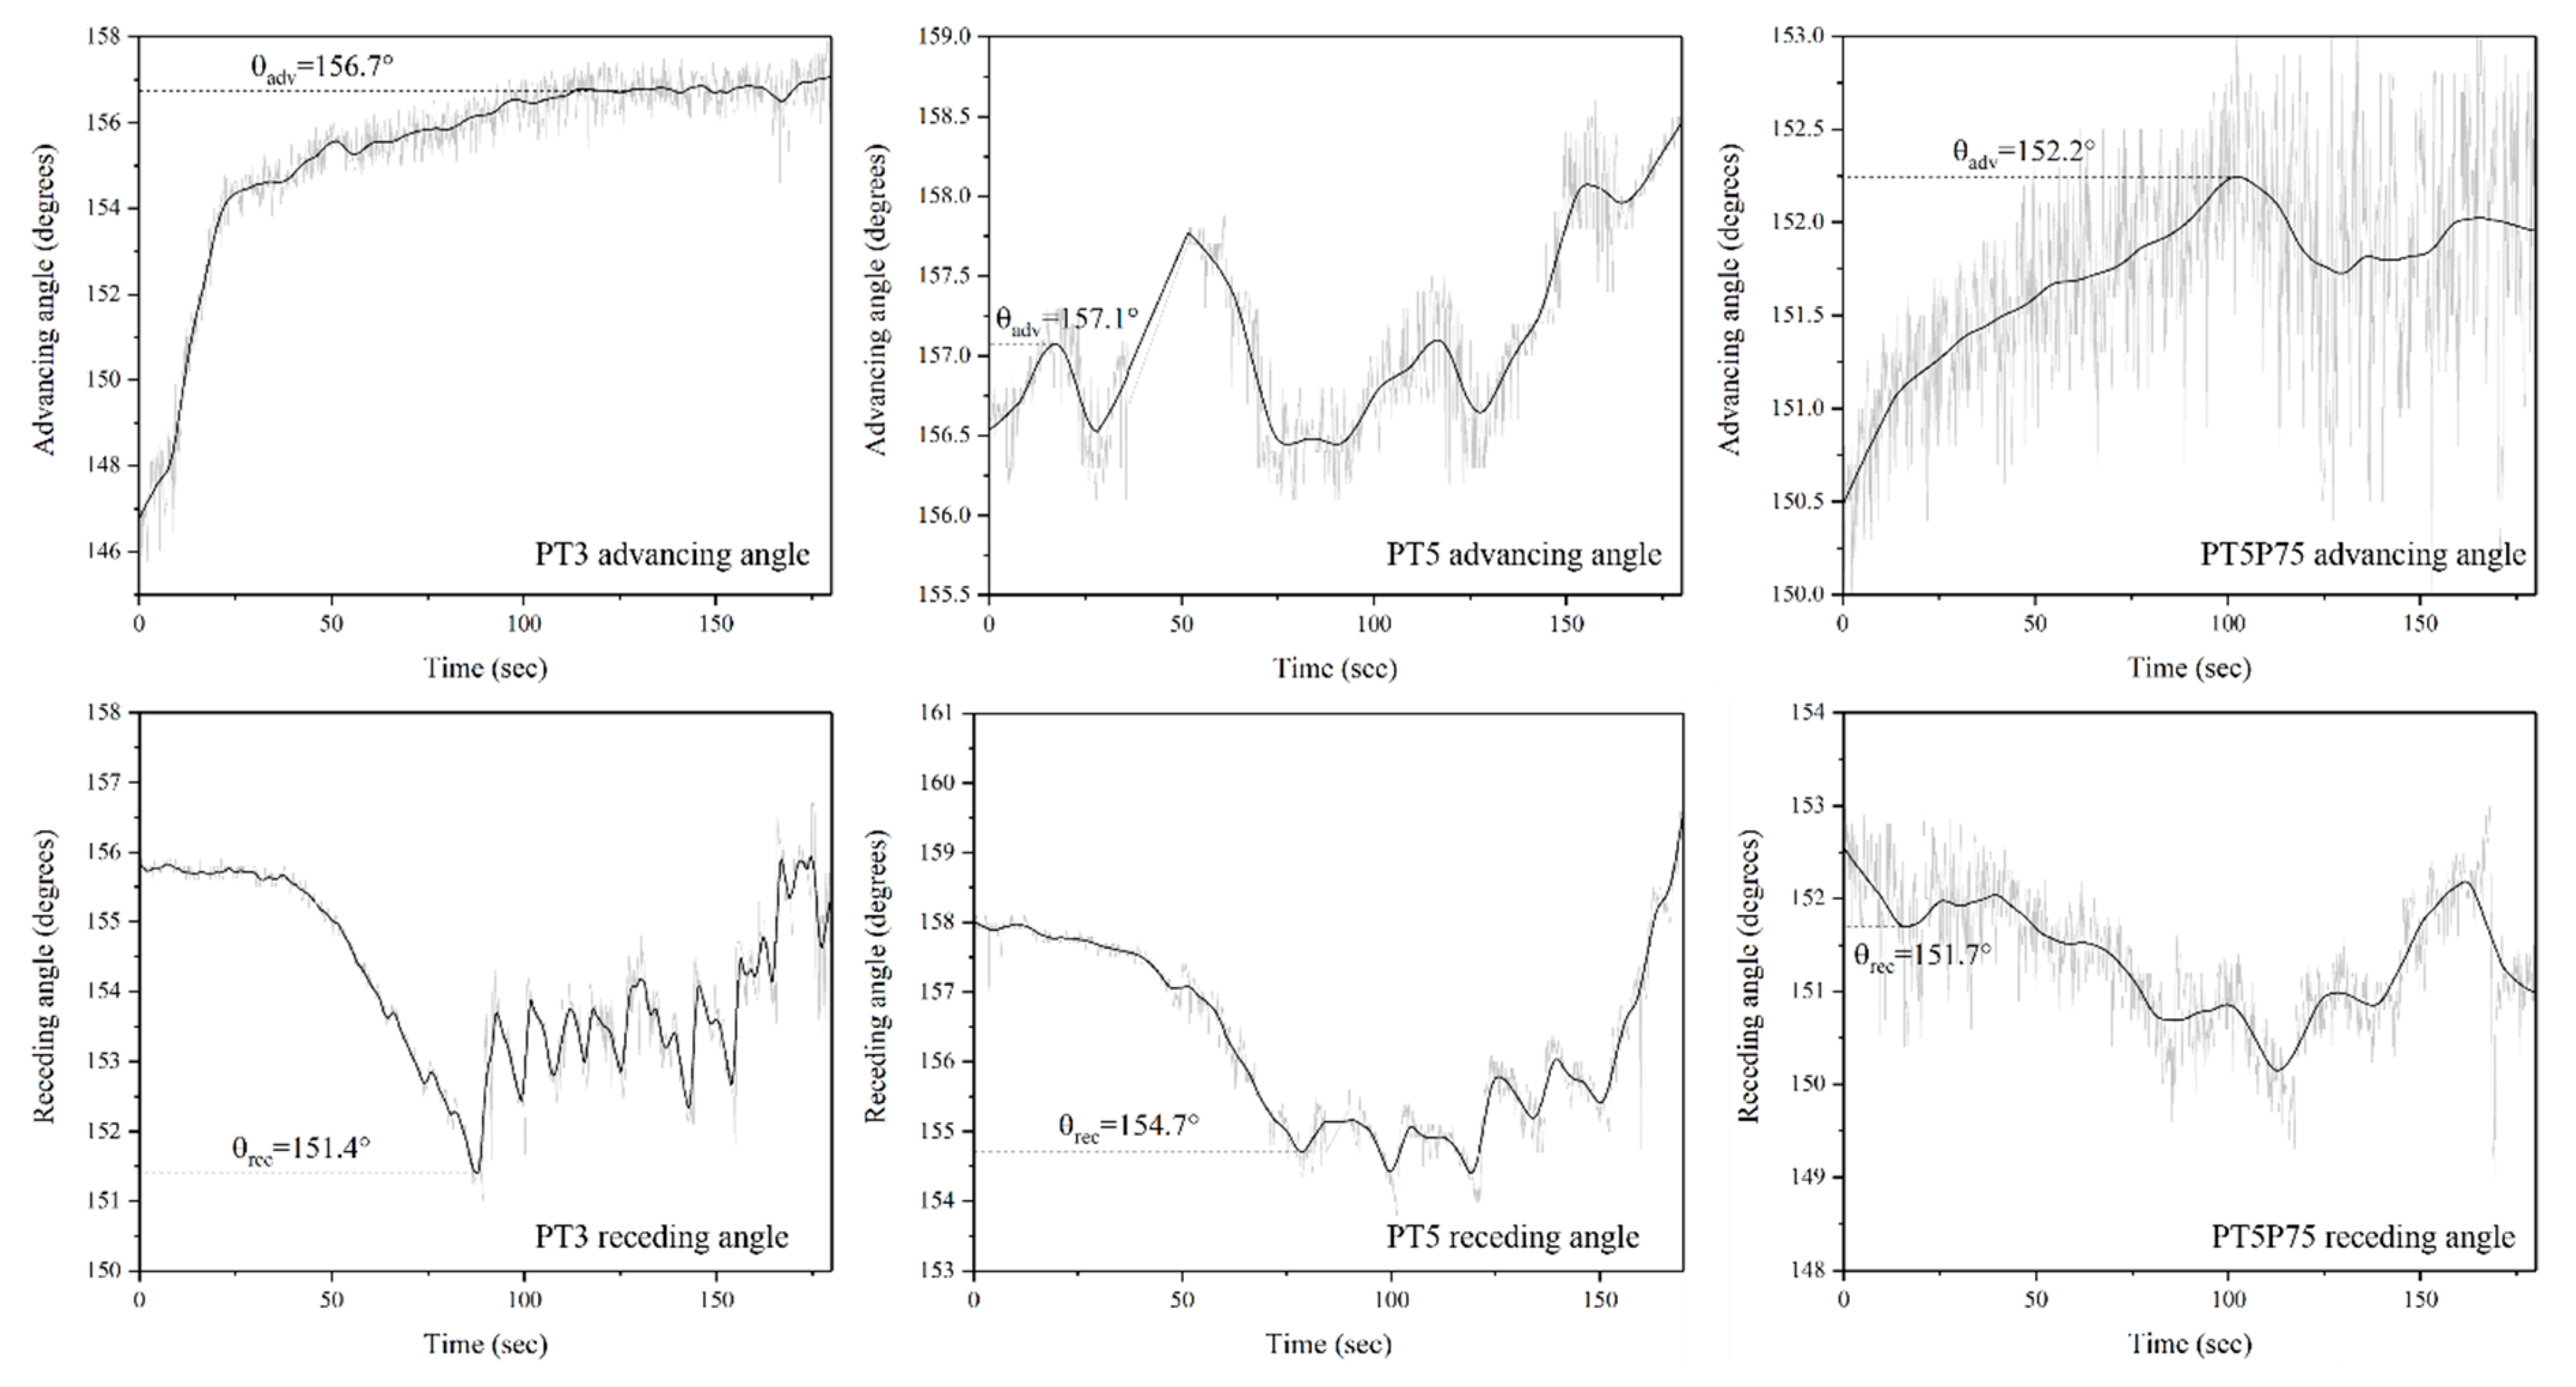
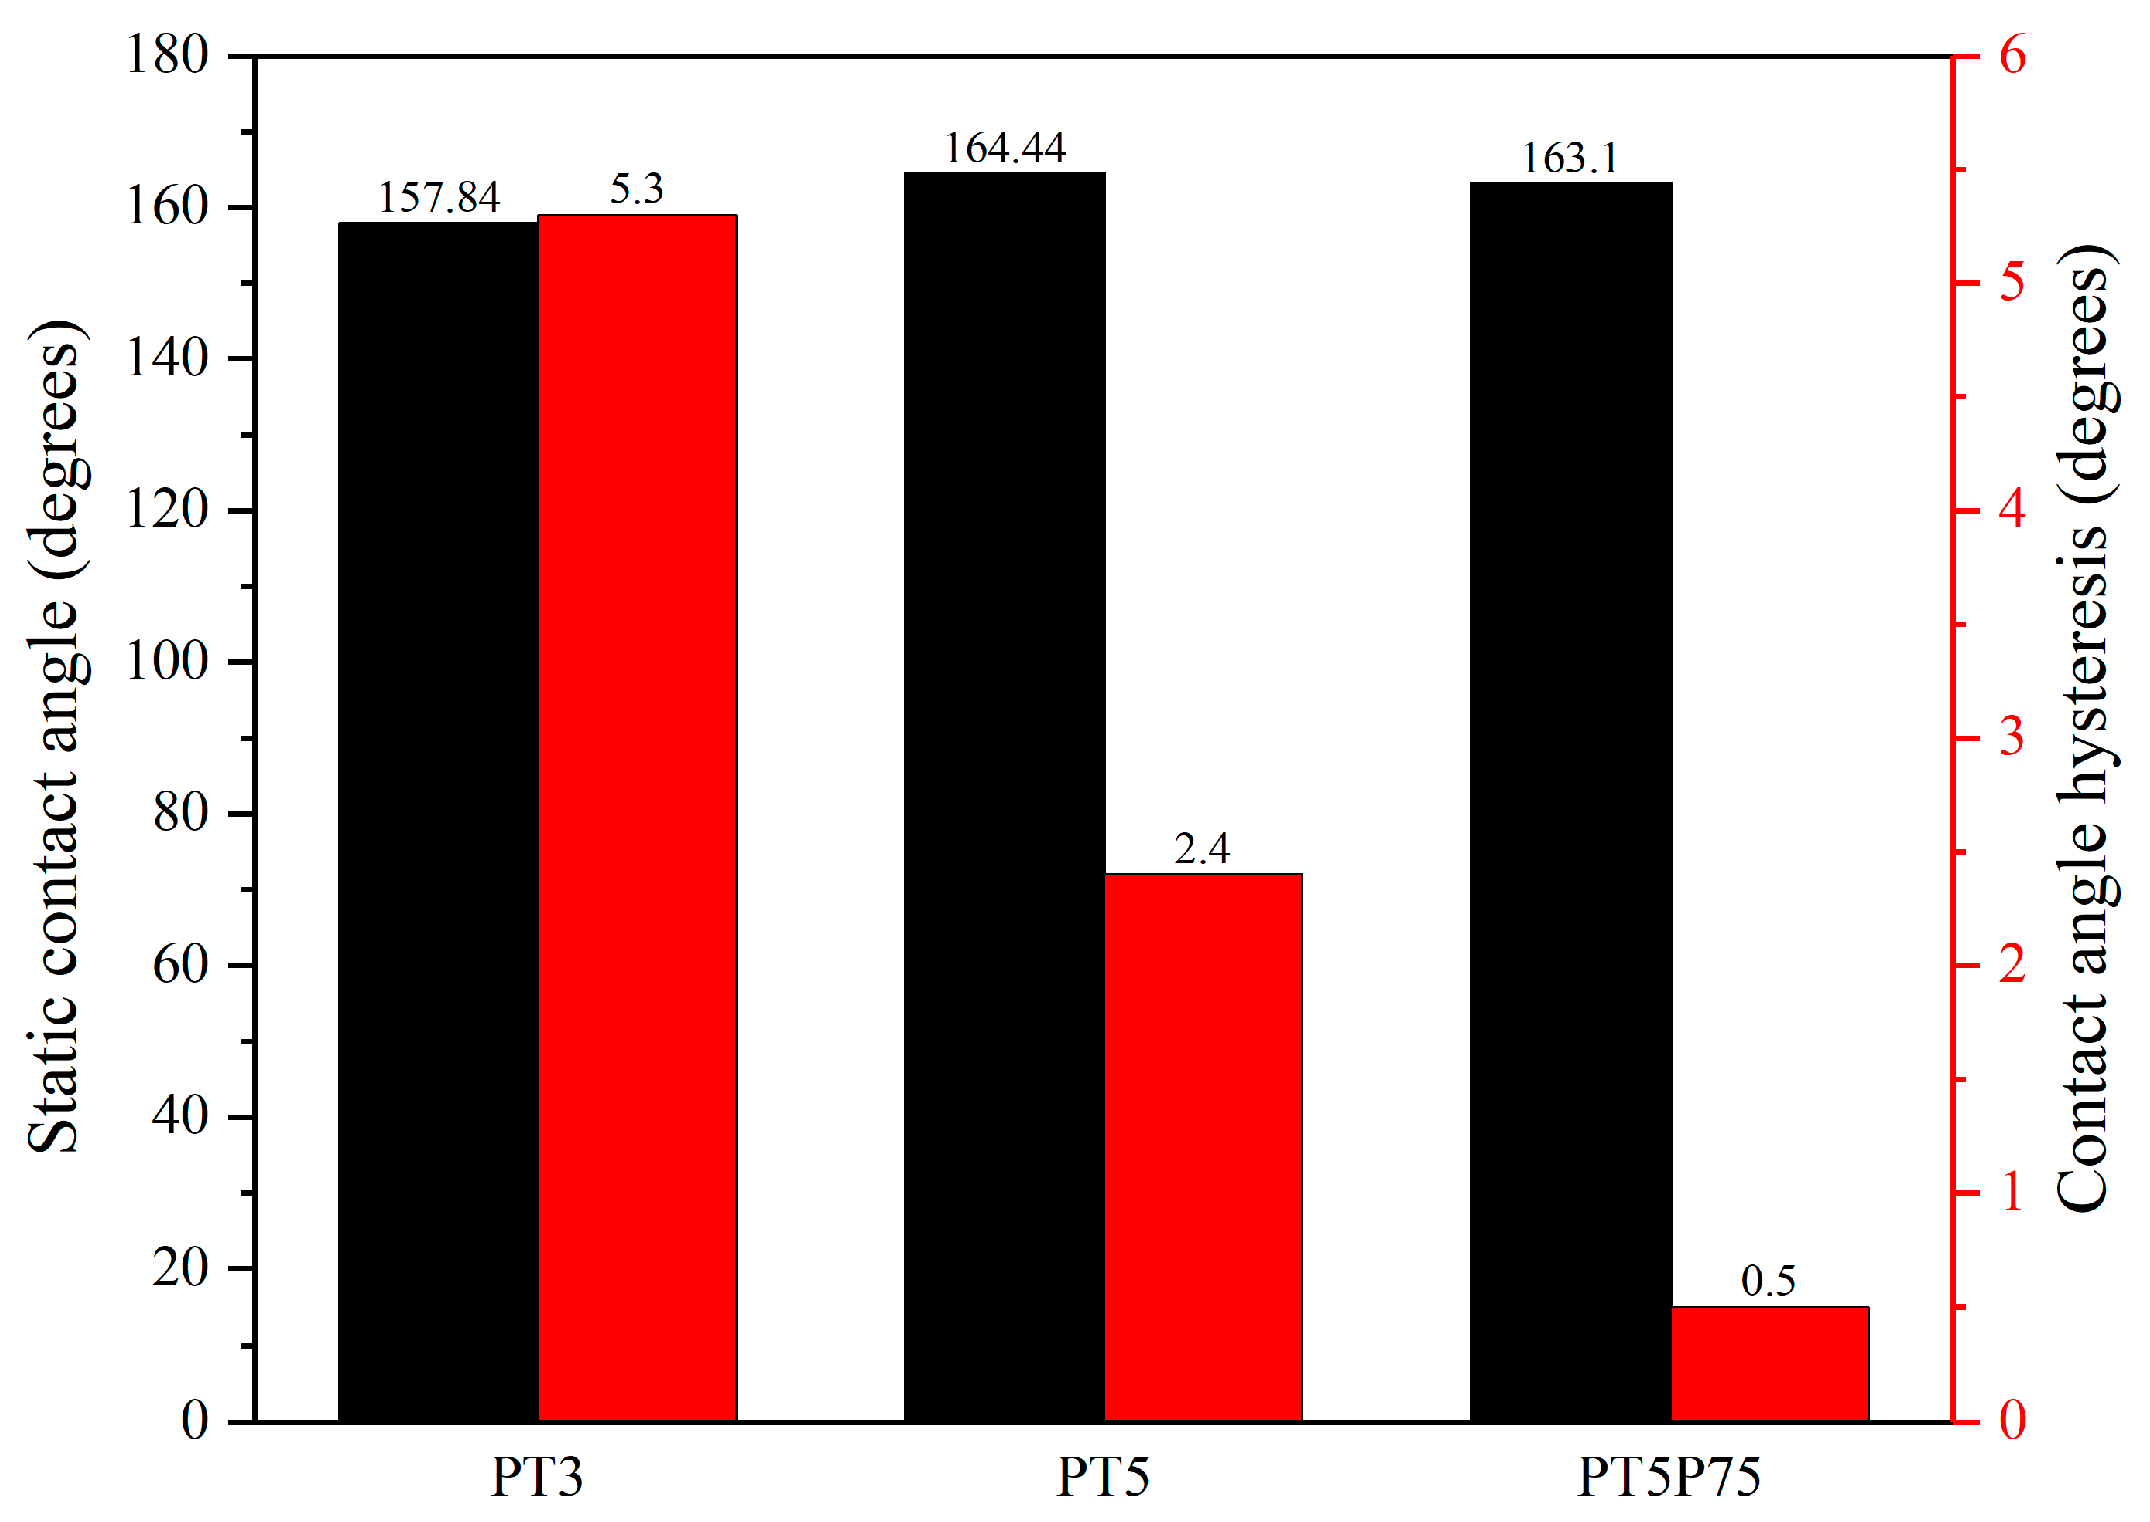
3.4. Wetting Behavior
4. Conclusions
Author Contributions
Funding
Conflicts of Interest
References
- Saraf, R.; Lee, H.J.; Michielsen, S.; Owens, J.; Willis, C.; Stone, C.; Wilusz, E. Comparison of three methods for generating superhydrophobic, superoleophobic nylon nonwoven surfaces. J. Mater. Sci. 2011, 46, 5751–5760. [Google Scholar] [CrossRef]
- Ma, M.; Hill, R.M. Superhydrophobic surfaces. Curr. Opin. Colloid Interface Sci. 2006, 11, 193–202. [Google Scholar] [CrossRef]
- Guo, Z.; Liu, W.; Su, B.L. Superhydrophobic surfaces: From natural to biomimetic to functional. J. Colloid Interface Sci. 2011, 353, 335–355. [Google Scholar] [CrossRef] [PubMed]
- Johnson, R.E.; Dettre, R.H. Contact Angle Hysteresis. III. Study of an Idealized Heterogeneous Surface. J. Phys. Chem. 1964, 68, 1744–1750. [Google Scholar] [CrossRef]
- Guo, Z.; Liu, W. Biomimic from the superhydrophobic plant leaves in nature: Binary structure and unitary structure. Plant Sci. 2007, 172, 1103–1112. [Google Scholar] [CrossRef]
- Yan, Y.Y.; Gao, N.; Barthlott, W. Mimicking natural superhydrophobic surfaces and grasping the wetting process: A review on recent progress in preparing superhydrophobic surfaces. Adv. Colloid Interface Sci. 2011, 169, 80–105. [Google Scholar] [CrossRef]
- Li, X.-M.; Reinhoudt, D.; Crego-Calama, M. What do we need for a superhydrophobic surface? A review on the recent progress in the preparation of superhydrophobic surfaces. Chem. Soc. Rev. 2007, 36, 1350–1368. [Google Scholar] [CrossRef]
- Kale, K.H.; Palaskar, S. Atmospheric pressure plasma polymerization of hexamethyldisiloxane for imparting water repellency to cotton fabric. Text. Res. J. 2010, 81, 608–620. [Google Scholar] [CrossRef]
- Cheng, Y.; Zhu, T.; Li, S.; Huang, J.; Mao, J.; Yang, H.; Gao, S.; Chen, Z.; Lai, Y. A novel strategy for fabricating robust superhydrophobic fabrics by environmentally-friendly enzyme etching. Chem. Eng. J. 2019, 355, 290–298. [Google Scholar] [CrossRef]
- Favia, P.; D’Agostino, R. Plasma treatments and plasma deposition of polymers for biomedical applications. Surf. Coat. Technol. 1998, 98, 1102–1106. [Google Scholar] [CrossRef]
- Ellinas, K.; Kefallinou, D.; Stamatakis, K.; Gogolides, E.; Tserepi, A. Is There a Threshold in the Antibacterial Action of Superhydrophobic Surfaces? ACS Appl. Mater. Interfaces 2017, 9, 39781–39789. [Google Scholar] [CrossRef] [PubMed]
- Yao, X.; Song, Y.; Jiang, L. Applications of bio-inspired special wettable surfaces. Adv. Mater. 2011, 23, 719–734. [Google Scholar] [CrossRef]
- Farzaneh, M. Atmospheric icing of power networks. In Atmospheric Icing of Power Networks; Springer: Berlin, Germany, 2008; pp. 1–381. ISBN 978-1-40-208530-7. [Google Scholar]
- Alizadeh, A.; Yamada, M.; Li, R.; Shang, W.; Otta, S.; Zhong, S.; Ge, L.; Dhinojwala, A.; Conway, K.R.; Bahadur, V.; et al. Dynamics of ice nucleation on water repellent surfaces. Langmuir 2012, 28, 3180–3186. [Google Scholar] [CrossRef] [PubMed]
- Farzaneh, M. Ice accretions on high–voltage conductors and insulators and related phenomena. Philos. Trans. R. Soc. Lond. A Math. Phys. Eng. Sci. 2000, 358, 2971–3005. [Google Scholar] [CrossRef]
- Farzaneh, M.; Sarkar, D.K. Nanostructured Superhydrophobic Coatings. J. CPRI 2008, 4, 135–147. [Google Scholar]
- Marmur, A. Wetting on hydrophobic rough surfaces: To be heterogeneous or not to be? Langmuir 2003, 19, 8343–8348. [Google Scholar] [CrossRef]
- Li, S.; Page, K.; Sathasivam, S.; Heale, F.; He, G.; Lu, Y.; Lai, Y.; Chen, G.; Carmalt, C.J.; Parkin, I.P. Efficiently texturing hierarchical superhydrophobic fluoride-free translucent films by AACVD with excellent durability and self-cleaning ability. J. Mater. Chem. A 2018, 6, 17633–17641. [Google Scholar] [CrossRef]
- Genzer, J.; Efimenko, K. Recent developments in superhydrophobic surfaces and their relevance to marine fouling: A review. Biofouling 2006, 22, 339–360. [Google Scholar] [CrossRef]
- Ge, M.; Cao, C.; Huang, J.; Zhang, X.; Tang, Y.; Zhou, X.; Zhang, K.; Chen, Z.; Lai, Y. Rational design of materials interface at nanoscale towards intelligent oil-water separation. Nanoscale Horizons 2018, 3, 235–260. [Google Scholar] [CrossRef]
- Liu, H.; Wang, Y.; Huang, J.; Chen, Z.; Chen, G.; Lai, Y. Bioinspired Surfaces with Superamphiphobic Properties: Concepts, Synthesis, and Applications. Adv. Funct. Mater. 2018, 28, 1707415. [Google Scholar] [CrossRef]
- Wang, S.; Feng, L.; Jiang, L. One-step solution-immersion process for the fabrication of stable bionic superhydrophobic surfaces. Adv. Mater. 2006, 18, 767–770. [Google Scholar] [CrossRef]
- Hermelin, E.; Petitjean, J.; Lacroix, J.C.; Chane-Ching, K.I.; Tanguy, J.; Lacaze, P.C. Ultrafast electrosynthesis of high hydrophobic polypyrrole coatings on a zinc electrode: Applications to the protection against corrosion. Chem. Mater. 2008, 20, 4447–4456. [Google Scholar] [CrossRef]
- Zhang, F.; Zhao, L.; Chen, H.; Xu, S.; Evans, D.G.; Duan, X. Corrosion resistance of superhydrophobic layered double hydroxide films on aluminum. Angew. Chem. Int. Ed. 2008, 47, 2466–2469. [Google Scholar] [CrossRef] [PubMed]
- Jafari, R.; Asadollahi, S.; Farzaneh, M. Applications of plasma technology in development of superhydrophobic surfaces. Plasma Chem. Plasma Process. 2013, 33, 177–200. [Google Scholar] [CrossRef]
- Martinu, L.; Poitras, D. Plasma deposition of optical films and coatings: A review. Vac. Sci. Technol. A 2000, 18, 2619–2645. [Google Scholar] [CrossRef]
- Gogolides, E.; Constantoudis, V.; Kokkoris, G.; Kontziampasis, D.; Tsougeni, K.; Boulousis, G.; Vlachopoulou, M.; Tserepi, A. Controlling roughness: From etching to nanotexturing and plasma-directed organization on organic and inorganic materials. J. Phys. D Appl. Phys. 2011, 44, 174021. [Google Scholar] [CrossRef]
- Saccaro, S.; Fonseca, R.; Veillon, D.M.; Cotelingam, J.; Nordberg, M.L.; Bredeson, C.; Glass, J.; Munker, R. Primary plasma cell leukemia: Report of 17 new cases treated with autologous or allogeneic stem-cell transplantation and review of the literature. Am. J. Hematol. 2005, 78, 288–294. [Google Scholar] [CrossRef] [Green Version]
- Lloyd, G.; Friedman, G.; Jafri, S.; Schultz, G.; Fridman, A.; Harding, K. Gas plasma: Medical uses and developments in wound care. Plasma Process. Polym. 2010, 7, 194–211. [Google Scholar] [CrossRef]
- Kong, M.G.; Kroesen, G.; Morfill, G.; Nosenko, T.; Shimizu, T.; Van Dijk, J.; Zimmermann, J.L. Plasma medicine: An introductory review. New J. Phys. 2009, 11, 115012. [Google Scholar] [CrossRef]
- Hertwig, C.; Reineke, K.; Ehlbeck, J.; Knorr, D.; Schlüter, O. Decontamination of whole black pepper using different cold atmospheric pressure plasma applications. Food Control 2015, 55, 221–229. [Google Scholar] [CrossRef]
- Pasquali, F.; Stratakos, A.C.; Koidis, A.; Berardinelli, A.; Cevoli, C.; Ragni, L.; Mancusi, R.; Manfreda, G.; Trevisani, M. Atmospheric cold plasma process for vegetable leaf decontamination: A feasibility study on radicchio (red chicory, Cichorium intybus L.). Food Control 2016, 60, 552–559. [Google Scholar] [CrossRef]
- Merche, D.; Vandencasteele, N.; Reniers, F. Atmospheric plasmas for thin film deposition: A critical review. Thin Solid Films 2012, 520, 4219–4236. [Google Scholar] [CrossRef]
- Siliprandi, R.A.; Zanini, S.; Grimoldi, E.; Fumagalli, F.S.; Barni, R.; Riccardi, C. Atmospheric pressure plasma discharge for polysiloxane thin films deposition and comparison with low pressure process. Plasma Chem. Plasma Process. 2011, 31, 353–372. [Google Scholar] [CrossRef]
- Foroughi Mobarakeh, L.; Jafari, R.; Farzaneh, M. Superhydrophobic Surface Elaboration Using Plasma Polymerization of Hexamethyldisiloxane (HMDSO). Adv. Mater. Res. 2011, 409, 783–787. [Google Scholar] [CrossRef]
- Lommatzsch, U.; Ihde, J. Plasma polymerization of HMDSO with an atmospheric pressure plasma jet for corrosion protection of aluminum and low-adhesion surfaces. Plasma Process. Polym. 2009, 6, 642–648. [Google Scholar] [CrossRef]
- Gogolides, E.; Ellinas, K.; Tserepi, A. Hierarchical micro and nano structured, hydrophilic, superhydrophobic and superoleophobic surfaces incorporated in microfluidics, microarrays and lab on chip microsystems. Microelectron. Eng. 2015, 132, 135–155. [Google Scholar] [CrossRef]
- Asadollahi, S.; Farzaneh, M.; Stafford, L. Highly porous micro-roughened structures developed on aluminum surface using the jet of rotating arc discharges at atmospheric pressure. J. Appl. Phys. 2018, 123, 073302. [Google Scholar] [CrossRef]
- Kietzig, A.M. Comments on “an essay on contact angle measurements”—An illustration of the respective influence of droplet deposition and measurement parameters. Plasma Process. Polym. 2011, 8, 1003–1009. [Google Scholar] [CrossRef]
- Müller, M.; Oehr, C. Comments on “an essay on contact angle measurements” by Strobel and Lyons. Plasma Process. Polym. 2011, 8, 19–24. [Google Scholar] [CrossRef]
- Levasseur, O.; Stafford, L.; Gherardi, N.; Naudé, N.; Beche, E.; Esvan, J.; Blanchet, P.; Riedl, B.; Sarkissian, A. Role of substrate outgassing on the formation dynamics of either hydrophilic or hydrophobic wood surfaces in atmospheric-pressure, organosilicon plasmas. Surf. Coat. Technol. 2013, 234, 42–47. [Google Scholar] [CrossRef] [Green Version]
- Pulpytel, J.; Kumar, V.; Peng, P.; Micheli, V.; Laidani, N.; Arefi-Khonsari, F. Deposition of organosilicon coatings by a non-equilibrium atmospheric pressure plasma jet: Design, analysis and macroscopic scaling law of the process. Plasma Process. Polym. 2011, 8, 664–675. [Google Scholar] [CrossRef]
- Gunde, M.K. Vibrational modes in amorphous silicon dioxide. Phys. B Condens. Matter 2000, 292, 286–295. [Google Scholar] [CrossRef]
- Kirk, C.T. Quantitative analysis of the effect of disorder-induced mode coupling on infrared absorption in silica. Phys. Rev. B 1988, 38, 1255. [Google Scholar] [CrossRef]
- Petersen, J.; Bardon, J.; Dinia, A.; Ruch, D.; Gherardi, N. Organosilicon Coatings Deposited in Atmospheric Pressure Townsend Discharge for Gas Barrier Purpose: Effect of Substrate Temperature on Structure and Properties. ACS Appl. Mater. Interfaces 2012, 4, 5872–5882. [Google Scholar] [CrossRef] [PubMed]
- Launer, P.J. Infrared Analysis of Organosilicon Compounds: Spectra-Structure Correlations; Burnt Hills: New York, NY, USA, 1987. [Google Scholar]
- Barthlott, W.; Neinhuis, C. Purity of the sacred lotus, or escape from contamination in biological surfaces. Planta 1997, 202, 1–8. [Google Scholar] [CrossRef]
- Kilicaslan, A.; Levasseur, O.; Roy-Garofano, V.; Profili, J.; Moisan, M.; Cote, C.; Sarkissian, A.; Stafford, L. Optical emission spectroscopy of microwave-plasmas at atmospheric pressure applied to the growth of organosilicon and organotitanium nanopowders. J. Appl. Phys. 2014, 115, 113301. [Google Scholar] [CrossRef]
- Ricci, M.; Dorier, J.L.; Hollenstein, C.; Fayet, P. Influence of argon and nitrogen admixture in HMDSO/O2 plasmas onto powder formation. Plasma Process. Polym. 2011, 8, 108–117. [Google Scholar] [CrossRef]
- Park, E.S.; Ro, H.W.; Nguyen, C.V.; Jaffe, R.L.; Yoon, D.Y. Infrared Spectroscopy Study of Microstructures of Poly (silsesquioxane)s. Chem. Mater. 2008, 20, 1548–1554. [Google Scholar] [CrossRef]
- Morent, R.; De Geyter, N.; Van Vlierberghe, S.; Dubruel, P.; Leys, C.; Gengembre, L.; Schacht, E.; Payen, E. Deposition of HMDSO-based coatings on PET substrates using an atmospheric pressure dielectric barrier discharge. Prog. Org. Coat. 2009, 64, 304–310. [Google Scholar] [CrossRef]
- Coates, J. Interpretation of Infrared Spectra, A Practical Approach. In Encyclopedia of Analytical Chemistry; John Wiley & Sons, Ltd.: Hoboken, NJ, USA, 2000; pp. 10815–10837. ISBN 978-0-47-002731-8. [Google Scholar]
- Gurav, A.B.; Latthe, S.S.; Kappenstein, C.; Mukherjee, S.K.; Rao, A.V.; Vhatkar, R.S. Porous water repellent silica coatings on glass by sol-gel method. J. Porous Mater. 2011, 18, 361–367. [Google Scholar] [CrossRef]
- Zhu, Q.; Chu, Y.; Wang, Z.; Chen, N.; Lin, L.; Liu, F.; Pan, Q. Robust superhydrophobic polyurethane sponge as a highly reusable oil-absorption material. J. Mater. Chem. A 2013, 1, 5386–5393. [Google Scholar] [CrossRef]
- Laroche, G.; Fitremann, J.; Gherardi, N. FTIR-ATR spectroscopy in thin film studies: The importance of sampling depth and deposition substrate. Appl. Surf. Sci. 2013, 273, 632–637. [Google Scholar] [CrossRef]
- Raynaud, P.; Despax, B.; Segui, Y.; Caquineau, H. FTIR plasma phase analysis of hexamethyldisiloxane discharge in microwave multipolar plasma at different electrical powers. Plasma Process. Polym. 2005, 2, 45–52. [Google Scholar] [CrossRef]
- Maurau, R.; Boscher, N.D.; Guillot, J.; Choquet, P. Nitrogen introduction in pp-HMDSO thin films deposited by atmospheric pressure dielectric barrier discharge: An XPS study. Plasma Process. Polym. 2012, 9, 316–323. [Google Scholar] [CrossRef]
- O’Hare, L.A.; Hynes, A.; Alexander, M.R. A methodology for curve-fitting of the XPS Si 2p core level from thin siloxane coatings. Surf. Interface Anal. 2007, 39, 926–936. [Google Scholar] [CrossRef]
- O’Hare, L.A.; Parbhoo, B.; Leadley, S.R. Development of a methodology for XPS curve-fitting of the Si 2p core level of siloxane materials. Surf. Interface Anal. 2004, 36, 1427–1434. [Google Scholar] [CrossRef]
- Strobel, M.; Lyons, C.S. An essay on contact angle measurements. Plasma Process. Polym. 2011, 8, 8–13. [Google Scholar] [CrossRef]
- Montes Ruiz-Cabello, F.J.; Rodríguez-Valverde, M.A.; Cabrerizo-Vílchez, M.A. Additional comments on “an essay on contact angle measurements” by M. Strobel and C. S. Lyons. Plasma Process. Polym. 2011, 8, 363–366. [Google Scholar] [CrossRef]
- Di Mundo, R.; Palumbo, F. Comments regarding “an essay on contact angle measurements”. Plasma Process. Polym. 2011, 8, 14–18. [Google Scholar] [CrossRef]
- Gao, L.; McCarthy, T.J. Wetting 101°. Langmuir 2009, 25, 14105–14115. [Google Scholar] [CrossRef]
- Morra, M.; Occhiello, E.; Garbassi, F. Knowledge about polymer surfaces from contact angle measurements. Adv. Colloid Interface Sci. 1990, 32, 79–116. [Google Scholar] [CrossRef]
- Di Mundo, R.; Palumbo, F.; D’Agostino, R. Nanotexturing of polystyrene surface in fluorocarbon plasmas: From sticky to slippery superhydrophobicity. Langmuir 2008, 24, 5044–5051. [Google Scholar] [CrossRef] [PubMed]


| Sample Name | Monomer Flow Rate | Plasma Power | Plasma Duty Cycle | Jet Speed | Jet-Substrate Distance | Ionization Gas Flow Rate | Carrier Gas Flow Rate |
|---|---|---|---|---|---|---|---|
| PT3 | 3 g/h | 500 W | 50% | 1 m/min | 30 mm | 500 L/h | 400 L/h |
| PT5 | 5 g/h | 500 W | 50% | 1 m/min | 30 mm | 500 L/h | 400 L/h |
| PT5P75 | 5 g/h | 750 W | 50% | 1 m/min | 30 mm | 500 L/h | 400 L/h |
| Scan Type | Start Energy | End Energy | Step Width | dE | Dwell Time | # of Scans | Beam Power |
|---|---|---|---|---|---|---|---|
| Survey | 1300 eV | 0 eV | 1 eV | 4 eV | 100 ms | 5 | 150 W |
| High resolution | A window of ~20 eV width around the peak. | 0.1 eV | 0.3 eV | 300 ms | 10 | 300 W | |
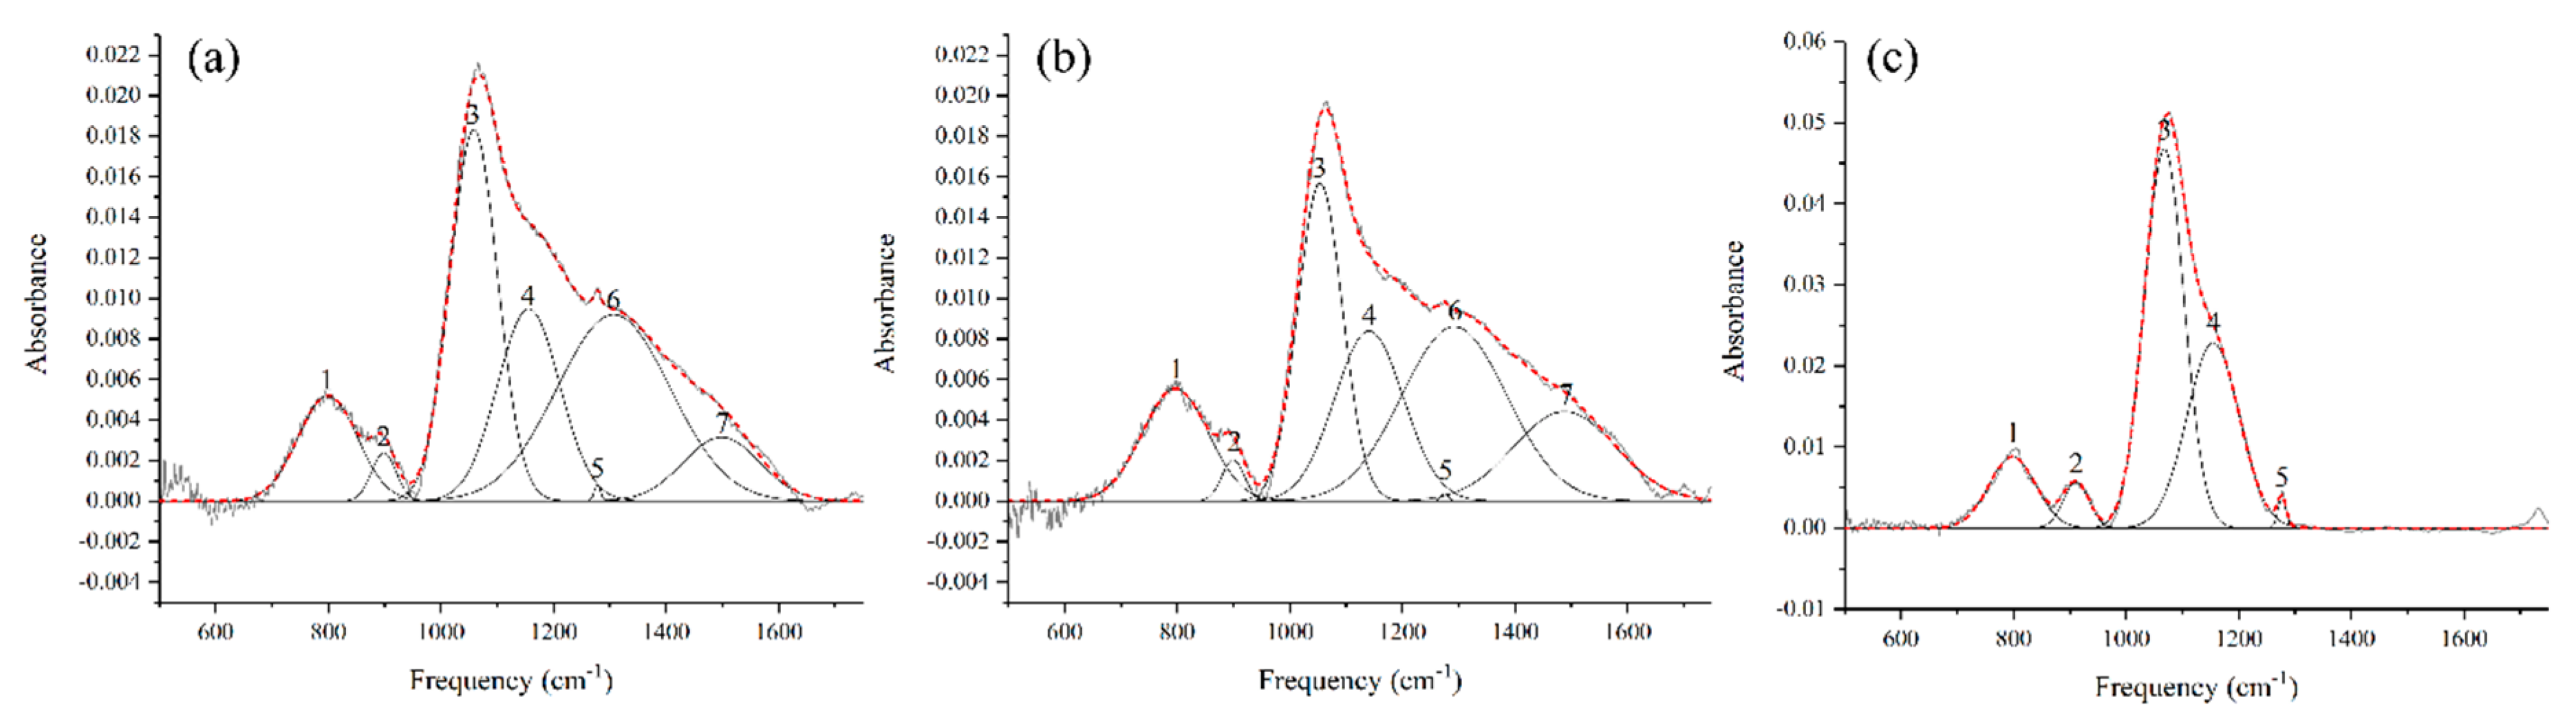
| Peak Index | Approximate Position (cm−1) | Assigned to |
|---|---|---|
| 1 | 800 | Si-C rocking vibration in Si-(CH3)n [36,49,50] |
| 2 | 900 | Si-OH bending [50] |
| 3 | 1060 | Si-O-Si asymmetric stretching (TO1) |
| 4 | 1150 | Si-O-Si asymmetric stretching (TO2) |
| 5 | 1275 | C-H symmetric deformation in Si-(CH3)n |
| 6 | 1300–1500 | |
| 7 |
| A1/A3 (Si-(CH3)n/Si-O-Si) | A4/A3 (TO2/TO1) | |
|---|---|---|
| PT3 | 0.35 | 0.67 |
| PT5 | 0.52 | 0.64 |
| PT5P75 | 0.22 | 0.81 |
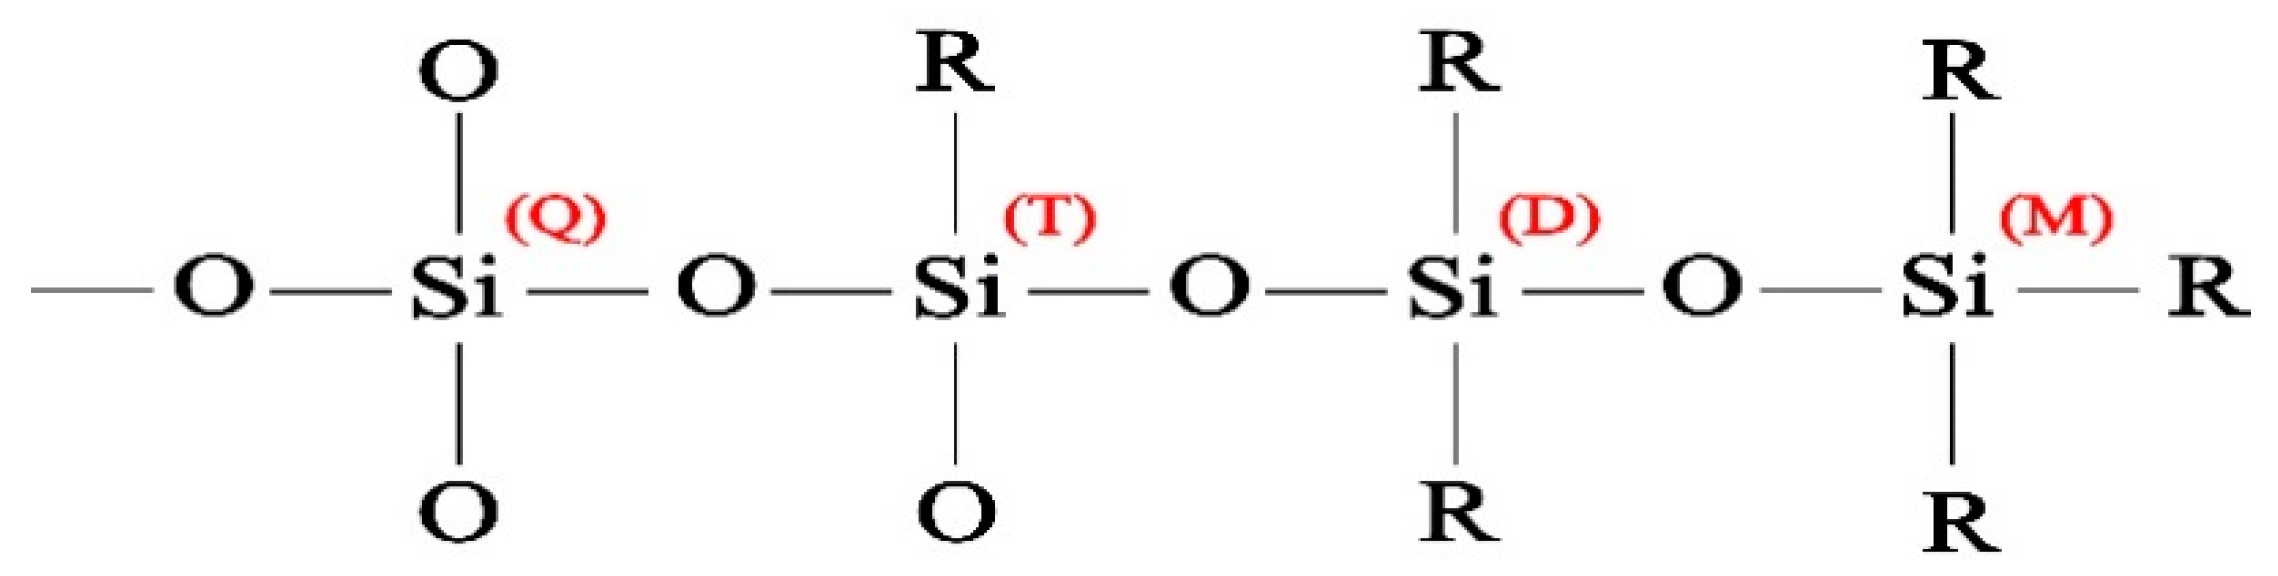
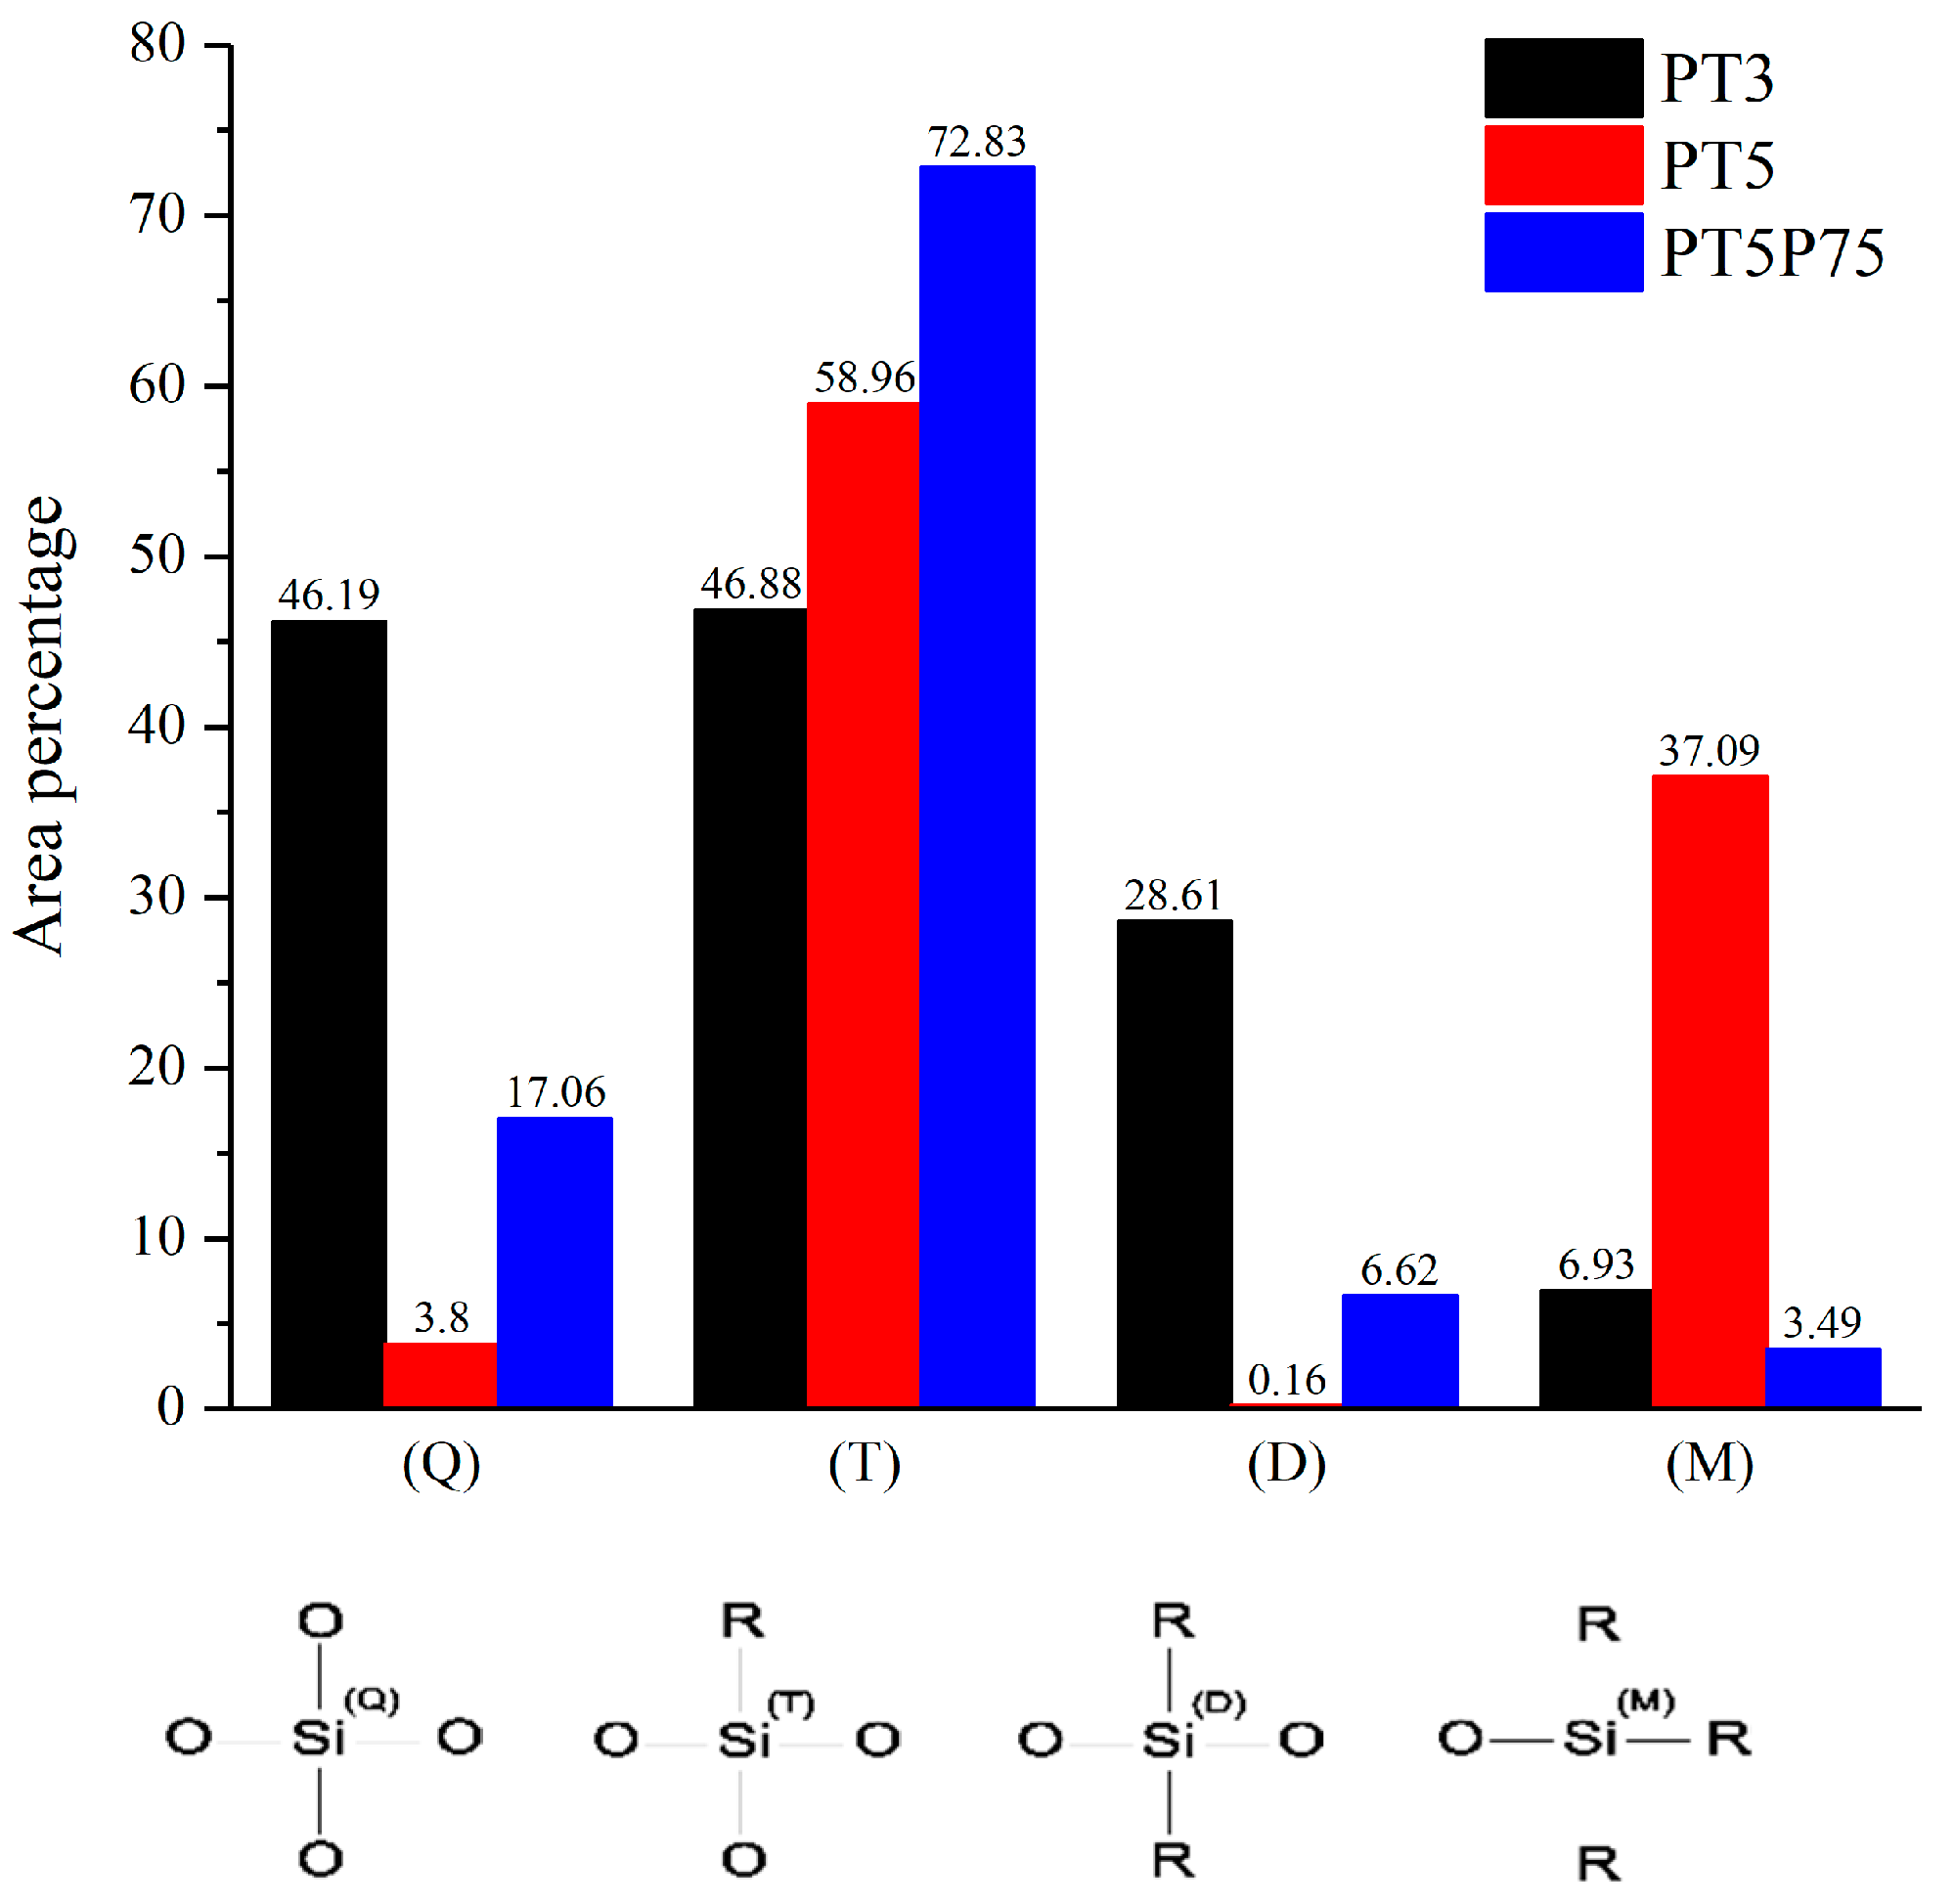
| Binding Energy | Energy Shift | Function | |
|---|---|---|---|
| Q [SiO4/2] | 103.69 eV | 0 eV | cross-linking |
| T [CH3SiO3/2] | 102.89 eV | 0.80 eV | cross-linking |
| D [(CH3)2SiO2/2] | 102.21 eV | 0.68 eV | propagation |
| M [(CH3)3SiO1/2] | 101.85 eV | 0.36 eV | termination |
© 2019 by the authors. Licensee MDPI, Basel, Switzerland. This article is an open access article distributed under the terms and conditions of the Creative Commons Attribution (CC BY) license (http://creativecommons.org/licenses/by/4.0/).
Share and Cite
Asadollahi, S.; Profili, J.; Farzaneh, M.; Stafford, L. Development of Organosilicon-Based Superhydrophobic Coatings through Atmospheric Pressure Plasma Polymerization of HMDSO in Nitrogen Plasma. Materials 2019, 12, 219. https://doi.org/10.3390/ma12020219
Asadollahi S, Profili J, Farzaneh M, Stafford L. Development of Organosilicon-Based Superhydrophobic Coatings through Atmospheric Pressure Plasma Polymerization of HMDSO in Nitrogen Plasma. Materials. 2019; 12(2):219. https://doi.org/10.3390/ma12020219
Chicago/Turabian StyleAsadollahi, Siavash, Jacopo Profili, Masoud Farzaneh, and Luc Stafford. 2019. "Development of Organosilicon-Based Superhydrophobic Coatings through Atmospheric Pressure Plasma Polymerization of HMDSO in Nitrogen Plasma" Materials 12, no. 2: 219. https://doi.org/10.3390/ma12020219