The AC Soft Magnetic Properties of FeCoNixCuAl (1.0 ≤ x ≤ 1.75) High-Entropy Alloys
by
Zhongyuan Wu
1, 
Chenxu Wang
1,
Yin Zhang
1,
Xiaomeng Feng
1,
Yong Gu
1,2, 
Zhong Li
3,
Huisheng Jiao
4,
Xiaohua Tan
1,* and
Hui Xu
1,* 1
Institute of Materials, School of Materials Science and Engineering, Shanghai University, Shanghai 200072, China
2
Qianjiang College, Hangzhou Normal University, Hangzhou 310036, China
3
College of Materials and Environmental Engineering, Institute for Advanced Magnetic Materials, Hangzhou Dianzi University, Hangzhou 310018, China
4
Tescan China, Ltd., Shanghai 201112, China
*
Authors to whom correspondence should be addressed.
Materials 2019, 12(24), 4222; https://doi.org/10.3390/ma12244222
Submission received: 20 November 2019
/
Revised: 12 December 2019
/
Accepted: 13 December 2019
/
Published: 16 December 2019
(This article belongs to the Special Issue Magnetic Materials and Applications)
Abstract
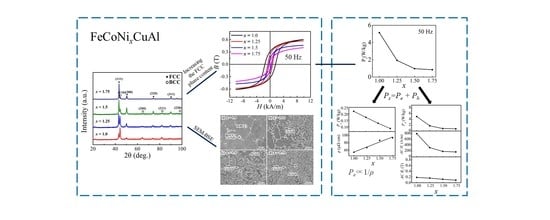
:High-entropy alloys (HEAs) with soft magnetic properties are one of the new candidate soft magnetic materials which are usually used under an alternating current (AC) magnetic field. In this work, the AC soft magnetic properties are investigated for FeCoNixCuAl (1.0 ≤ x ≤ 1.75) HEAs. The X-ray diffraction (XRD) and scanning electron microscope (SEM) show that the alloy consists of two phases, namely a face-centred cubic (FCC) phase and a body-centred cubic (BCC) phase. With increasing Ni content, the FCC phase content increased. Further research shows that the AC soft magnetic properties of these alloys are closely related to their phase constitution. Increasing the FCC phase content contributes to a decrease in the values of AC remanence (AC Br), AC coercivity (AC Hc) and AC total loss (Ps), while it is harmful to the AC maximum magnetic flux density (AC Bm). Ps can be divided into two parts: AC hysteresis loss (Ph) and eddy current loss (Pe). With increasing frequency f, the ratio of Ph/Ps decreases for all samples. When f ≤ 150 Hz, Ph/Ps > 70%, which means that Ph mainly contributes to Ps. When f ≥ 800 Hz, Ph/Ps < 40% (except for the x = 1.0 sample), which means that Pe mainly contributes to Ps. At the same frequency, the ratio of Ph/Ps decreases gradually with increasing FCC phase content. The values of Pe and Ph are mainly related to the electrical resistivity (ρ) and the AC Hc, respectively. This provides a direction to reduce Ps.
1. Introduction
Conventional alloys are usually based on a certain metallic element, adding a few other elements to improve the property or fine tune the performance according to different application requirements [1,2]. In 2004, a new class of alloys was put forward by Cantor [3] and Yeh [4], namely high-entropy alloys (HEAs). These alloys contain five or more equiatomic or near-equiatomic ratio elements, each of which has an atomic percentage between 5% and 35%. The HEAs are conducive to the formation of a solid solution phase, typically with a structure of a body-centred cubic (BCC) [5,6], a face-centred cubic (FCC) [7,8,9], a hexagonal stacked (HCP) [10,11], or a mixture of the above mentioned structures [12,13,14]. In the past decade, HEAs have drawn extensive attention because of their excellent mechanical and chemical properties, such as great thermal stability [15], good corrosion resistance [16,17], good wear resistance [18], excellent strength [19] and high hardness [20].
Some HEAs show soft magnetic properties due to their ferromagnetic elements such as Fe, Co and Ni [21,22,23,24,25]. Zuo et al. [26] showed that the CoNiMnGa HEAs had a high saturation magnetisation (Ms) of about 115.92 emu/g, and a low coercivity (Hc) of about 27.9 Oe. Liu et al. [27] found that FeCoNi1.5CuAl HEA not only had good mechanical properties (maximum compressive strength σmax = 1725 MPa), but also good direct current (DC) soft magnetic properties (Ms = 63.58 emu/g, Hc = 13.7 Oe). These studies were basically conducted under DC magnetic conditions.
Moreover, soft magnetic materials are commonly used in alternating current (AC) magnetic fields. However, limited information on AC magnetic performance is available in HEAs. Our previous work studied the AC soft magnetic properties of FeCoNi(MnSi)x HEAs and found that a suitable content of MnSi can improve the AC soft magnetic properties [28]. Duan et al. [29,30] prepared Fe-Co-Ni-Si-Al high-entropy powders by mechanical milling and studied their electromagnetic performance as wave absorbing materials under the frequency ranging from 1 GHz to 16 GHz. It is found that the electromagnetic parameters depend on the milling time and aspect ratio of powders. They also found the wave absorption properties can be improved after annealing in FeCoNiCuAl high-entropy powders [31].
In our work, we chose Fe-Co-Ni-Cu-Al HEAs to study their AC magnetic properties for two reasons. (1) Our previous work showed that FeCoNiCuAl HEA had a combination of good mechanical properties and DC magnetic properties [32]. In particular, it has larger electrical resistivity with 51.4 uΩ⋅cm than 40.8 uΩ⋅cm of non-oriented silicon electrical steel reported in reference [33], which indicates that FeCoNiCuAl HEA has potential AC applications by reducing the energy loss. (2) Recently, Liu et al. [27] found that Ni addition could have obvious effects on the DC magnetic property and mechanical property of FeCoNiCuAl alloy. Here arises the question, does Ni addition have effects on AC soft magnetic properties of Fe-Co-Ni-Cu-Al HEAs? Hence, in this paper, the effects of Ni addition on the AC soft magnetic properties and microstructure in Fe-Co-Ni-Cu-Al HEAs are investigated. The relationship between AC magnetic parameters (e.g., the eddy current loss, Pe, and AC hysteresis loss, Ph) and phase composition is also studied in FeCoNixCuAl (1.0 ≤ x ≤ 1.75) HEAs. Furthermore, the influencing factors of Pe and Ph are discussed.
2. Experimental
The alloy ingots of FeCoNixCuAl (1.0 ≤ x ≤ 1.75) HEAs were made by arc melting of high purity metals (≥99.99 wt%) with a water-cooled copper crucible, re-melted four times, in a high purity argon atmosphere. The alloys were then sucked into a water-cooled copper mould with the dimensions of 100 × 10 × 2 mm3. The composition of samples was confirmed by Electron-coupled plasma atomic emission spectrometry (ICP-AES, PERKINE 7300DV, Perkinelmer, Waltham, MA, USA).
The phases in the alloys were determined by X-ray diffraction (XRD, Rigaku Corporation, Akishima-Shi, Tokyo, Japan) analysis with Cu Kα radiation using D/max-2500 V. The diffraction angles ranged from 20 to 100° and the radiation condition was 18 kW. The microstructure of the alloys was investigated by scanning electron microscope (SEM, TESCAN S9000, Tescan, Brno, Czech Republic) and the chemical compositions of the alloys were measured by energy dispersive spectroscopy (EDS). The AC magnetic characteristic parameters were determined by an AC hysteresis curves test system (FE-2100SM, Yongyi technology co. LTD, Hunan, China) with the sample size of 50 × 9.5 × 1.8 mm3. The electrical resistivity (ρ) was measured by an ST-2258C multifunction digital four-probe tester.
3. Results
3.1. XRD
The XRD patterns of the FeCoNixCuAl (1.0 ≤ x ≤ 1.75) HEAs are shown in Figure 1. All of these HEAs contain two phases, namely FCC and BCC phase. The intensities of the strongest peaks, (111) for FCC and (110) for BCC, are denoted as I(111)F and I(110)B, respectively. Table 1 lists the values of the ratio (I(111)F/I(110)B), which is employed to estimate the content of the FCC and BCC phases. It can be seen that the ratio increases with increasing Ni content. It indicates that increasing the Ni content tends to facilitate the formation of the FCC phase in these alloys. The lattice parameters of the FCC and BCC phases were calculated, and the values are also listed in Table 1. With increasing Ni content, the lattice parameters of both phases slightly decrease. This may be due to the atomic radius of Ni (124 pm) being smaller than Fe (126 pm), Co (125 pm), Cu (128 pm) and Al (143.1 pm) [34].
The values of electron concentration (VEC), atomic size difference (ΔR), electronegativity differences (ΔX), mixing entropy (ΔS), mixed enthalpy (ΔH), and solid solution formation ability (Ω) were then calculated and are listed in Table 2. With increasing Ni content, ΔR, ΔX, ΔS, ΔH and Ω all decrease while VEC increases. It is reported that the parameters including VEC, ΔR, ΔS and ΔH are key factors to determine the phase formation. In particular, ΔR has a critical role in lattice distortion [27]. The decrease of ΔR suggests the decrease content of BCC phase [27]. Based on our XRD result and the decrease of the atomic size difference with increasing Ni addition, it may have a conclusion that the increase of Ni content tends to facilitate the formation of the FCC phase in FeCoNixCuAl (1.0 ≤ x ≤ 1.75) HEAs due to lattice distortion.
3.2. SEM Images
The SEM backscattered electron images (SEM-BSE) and the elemental mapping images of the FeCoNixCuAl (1.0 ≤ x ≤ 1.75) HEAs are shown in Figure 2, Figure 3, Figure 4 and Figure 5. All the samples show two contrasts: one is dark grey (marked as A), the other is white (marked as B). Combined with XRD result, it is found that region A is BCC phase, and region B is FCC phase. When x = 1.0, the elemental mapping images (see Figure 2b–f) show that Cu element is enriched, while Fe, Co, Al and Ni are depleted in FCC phase. In comparison to x = 1.0 alloy, the fraction of FCC phase is significantly increased in x = 1.25 alloy. The elemental mapping result shows a similar trend of distribution of Cu, Fe, Co, Al and Ni in FCC and BCC phases (see Figure 3b–f). It is worth noting that x = 1.5 alloy exhibits different SEM morphology with x = 1.0 and x = 1.25 alloys, as shown in Figure 4a. Moreover, the elemental distribution in FCC and BCC phases is also different. That is, the mapping images (Figure 4b–f) shows that Al and Ni are depleted whereas Fe and Co are enriched in FCC phase. In particular, a Cu-rich phase boundary (PB) appears between the FCC and BCC phases. This phenomenon of Cu enrichment in the PB region has also been observed in our previous studies [35]. With further increasing Ni content to x = 1.75, it consists of a large number of FCC phase and small number of BCC phase. This alloy has similar elemental distribution in FCC and BCC phases to x = 1.5 alloy. The EDS point analysis gives the chemical compositions of the alloys in different regions, and it is listed in Table 3. For comparison, the nominal compositions are also included in Table 3.
3.3. Magnetic Properties at H = 10 kA/m and f = 50 Hz
Figure 6a,b show the AC magnetisation curves and hysteresis loops of FeCoNixCuAl (1.0 ≤ x ≤ 1.75) HEAs (H = 10 kA/m and f = 50 Hz). With increasing Ni content, the magnetisation curve and the hysteresis loop change significantly. The parameters such as the AC maximum magnetic flux density (Bm), AC remanence (Br), AC coercivity (Hc) and the energy loss (Ps) of the alloy can be obtained, and the detailed values are listed in Table 4. Figure 6c shows AC Bm, AC Br, AC Hc and Ps of the alloy as a function of Ni content. For comparison, the ratio of I(111)F/I(110)B as a function of Ni content is also listed in Figure 6c. With x increasing from 1.0 to 1.75, the values of AC Bm, AC Br, AC Hc and Ps decrease from 608.3 mT to 410.6 mT, 320 mT to 98 mT, 1582 A/m to 306 A/m, and 19.79 W/kg to 1.89 W/kg, respectively. An interesting phenomenon is that the variations of AC Bm, AC Br, AC Hc and Ps are opposite to that of I(111)F/I(110)B. This means that the AC soft magnetic properties of the alloy are closely related to the phase composition. The formation of the FCC phase would be conducive to a decrease in the values of AC Br, AC Hc and Ps, while it is harmful to AC Bm. This provides a direction for improving AC magnetic properties in the future.
3.4. Magnetic Properties at AC Bm = 300 mT
Soft magnetic materials are usually used at different frequencies, and they need to reach a fixed AC Bm to provide a certain force [36,37]. Figure 7 shows AC Br, AC Hc and Ps as a function of f for the FeCoNixCuAl (1.0 ≤ x ≤ 1.75) HEAs measured at AC Bm = 300 mT. It can be seen that AC Br, AC Hc and Ps increase gradually with increasing f, and decline with increasing Ni content. When f = 950 Hz, with x increasing from 1.0 to 1.75, AC Br, AC Hc and Ps reduce by 40%, 71% and 74%, respectively. The values of AC Br, AC Hc and Ps are listed in Table 5.
4. Discussions
For practical applications of soft magnetic materials, Ps under a dynamic magnetic field is a very important parameter in evaluating the application of magnetic materials. In general, Ps can be decomposed into the sum of three loss generations, Ph, Pe and residual loss (Pr) [38]. Under our test conditions, the effect of Pr can be ignored due to the frequency being not very high [38].
Ph can be expressed as Equation (2) [39]:
where η is the material constant, Bm is the maximum magnetic flux density, and n is the exponential constant.
Pe can be expressed as Equation (3) [39]:
where d is the sample thickness, ρ is the resistivity, and β is the material shape parameter.
Combining Equations (1)–(3) to get Equation (4):
Setting , and . Then, Equation (4) can be rewritten as Equation (5):
Through Equation (5), the unary function of can be obtained. Using the measured data in Table 5, we can fit the slope a and intercept b of the function. Pe and Ph can then be calculated from a and b, and the values are listed in Table 5.
Equation (6) can be given by combination of Equations (2) and (5),
It is seen that Ph/Ps is inversely proportional to frequency. The ratio of Ph/Ps and values of ρ are also listed in Table 5.
The ratio of Ph/Ps and Pe/Ps (= 1−Ph/Ps) can be considered as the contribution of Ph and Pe to the total loss, Ps, respectively. Figure 8 shows the Ph/Ps as a function of f. With increasing f, the ratio of Ph/Ps decreases gradually. It can be seen that when f ≤ 150 Hz (left side of black dotted line), Ph/Ps is over 70% which means that Ph mainly contributes to Ps. When f ≥ 800 Hz (right side of green dotted line), Ph/Ps is less than 40% (except for the x = 1.0 sample) which means that Pe mainly contributes to Ps. Combined with XRD result, it is found that the Ph/Ps decreased with the frequency when Ni addition, x, is less than 1.5 due to an increase of FCC phase. When x = 1.5, the ratio of Ph/Ps is only 26.5% at f = 950 Hz. However, furthering increasing the fraction of FCC phase results in a minor improvement of Ph/Ps.
Figure 9a,b show Pe as a function of x for the FeCoNixCuAl (1.0 ≤ x ≤ 1.75) HEAs at 50 Hz and 950 Hz, respectively, and for comparison purposes, ρ as a function of x is shown in Figure 9c. With increasing Ni content, Pe decrease linearly, and the downward trend is inversely proportional to the ρ, which corresponds to Equation (3). It suggests that Pe can be reduced by increasing ρ for the FeCoNixCuAl (1.0 ≤ x ≤ 1.75) HEAs.
Figure 10a shows Ph as a function of x for the FeCoNixCuAl (1.0 ≤ x ≤ 1.75) HEAs at 50 Hz. When the Ni content increased from 1.0 to 1.75, Ph was reduced by about 85%. In general, the value of hysteresis loss is related to the area of the hysteresis loop [40], and Br and Hc are important parameters that determine the area of the hysteresis loop. Figure 10b,c show AC Hc and AC Br as a function of x at 50 Hz, respectively. The scales of AC Hc and AC Br are in proportion to that of Ph. It can be seen that AC Br decreases slightly with increasing Ni content. It is worth noting that the downward trend of AC Hc is basically consistent with the downward trend of Ph. This means that the decrease of Ph is closely related to AC Hc. When f = 950 Hz, a similar change law can be observed (Figure 10d–f). Therefore, Ph can be reduced by decreasing AC Hc for the FeCoNixCuAl (1.0 ≤ x ≤ 1.75) HEAs.
Liu et al. used two magnetic parameters (the saturation magnetization, Ms, and the coercivity, Hc) to study the DC magnetic properties of AlCoCuFeNix (x = 0.5, 0.8, 1.0, 1.5, 2.0, 3.0). They found that high fraction of BCC phase led to high saturation magnetization [27]. Besides Ms and Hc, we used other important soft magnetic parameters including the initial permeability (μi), the maximum permeability (μmax), the remanence (Br), and the hysteresis loss (Pu) to evaluate DC soft magnetic properties of FeCoNixCuAl (1.0 ≤ x ≤ 1.75) HEAs. It is shown in Supplementary Table S1. In comparison to Liu’s work, we have minor different values of Ms for x = 1.0 and x = 1.5 alloys due to the difference of preparation samples.
In our work, the fraction of FCC phase increases with increasing Ni addition. The result of AC magnetic property shows that the increase content of the FCC phase leads to a decrease of AC Br, AC Hc and Ps, which is beneficial to AC soft magnetic property. The parameters, Br, Hc and Ps, have close relationships to the microstructure. Our recent work showed the presence of low angle grain boundary with a misorientation angle between 2–5° could reduce dramatically the soft magnetic properties of Fe-Co-Ni-Al alloys [41]. The reason of the decrease of AC Br, AC Hc and Ps with increasing Ni content might due to a decrease of low angle grain boundary (2–5°) resulting in a release of strain concentration.
It is seen from Table 5 that the electrical resistivity, ρ, is 54.7 μΩ·cm for × = 1.00 alloy that is larger than 15 μΩ·cm of mild steel. The values of ρ for × ≥ 1.25 alloy are in the range of 67.1−93.3 μΩ·cm, which is larger than 60 μΩ·cm of silicon steel and 50 μΩ·cm of grain-oriented Si steel [42]. It indicates that the FeCoNixCuAl (1.0 ≤ x ≤ 1.75) HEAs have potential applications in motors, generators and transformers due to relative low energy loss and high electrical resistivity.
5. Conclusions
In summary, we study the AC magnetic properties and microstructure of FeCoNixCuAl (1.0 ≤ x ≤ 1.75) HEAs. The main results are as follows:
- (1)
- The XRD and SEM results show that the alloys contain two phases, namely a BCC phase and an FCC phase. It is found that increasing the Ni content tends to facilitate the formation of the FCC phase in these alloys due to lattice distortion. When x ≤ 1.25, Cu is enriched in the FCC phase and it is depleted in the BCC phase. When x ≥ 1.5, Cu is depleted in the FCC phase and Al is enriched in the BCC phase. In addition, a Cu-rich phase boundary appears between the FCC and BCC phases.
- (2)
- The formation of the FCC phase would be conducive to a decrease in the values of AC Br, AC Hc and Ps, while it is harmful to AC Bm. The decrease of AC Br, AC Hc and Ps with increasing Ni content might due to a decrease of low angle grain boundary (2–5°), resulting in a release of strain concentration. This provides a direction for improvement of the AC magnetic performance in the future.
- (3)
- With increasing f, the ratio of Ph/Ps decreases. When f ≤ 150 Hz, Ph/Ps is larger than 70%, which means that Ph mainly contributes to Ps. When f ≥ 800 Hz, Ph/Ps is less than 40% (except for the x = 1.0 sample), which means that Pe mainly contributes to Ps.
- (4)
- At the same frequency, the ratio of Ph/Ps decreases gradually with increasing FCC phase content. Pe is inversely proportional to ρ, and Ph is closely related to AC Hc. This provides a direction to reduce Ps.
- (5)
- With increasing Ni content, the value of ρ increases from 54.7 μΩ·cm to 93.3 μΩ·cm, which is larger than that of silicon steel. It indicates that the FeCoNixCuAl (1.0 ≤ x ≤ 1.75) HEAs have potential applications in motors, generators and transformers due to relative low energy loss and high electrical resistivity.
Supplementary Materials
The following are available online at https://www.mdpi.com/1996-1944/12/24/4222/s1, Table S1: Direct current (DC) soft magnetic properties of FeCoNixCuAl (1.0 ≤ x ≤ 1.75) high-entropy alloys.
Author Contributions
H.X., X.T. conceived the experiments, Z.W., X.F., Y.Z., C.W., Y.G., Z.L. and H.J. carried out the experiments, H.X., X.T. and Z.W. analyzed the results and wrote the manuscript. All authors reviewed the manuscript.
Funding
This research was funded by the National Natural Science Foundation of China (Grant No. 51971125).
Acknowledgments
The authors also thank Yang Yang from Bruker (Beijing) Scientifc Technology Co., Ltd., China for her help on SEM analysis.
Conflicts of Interest
The authors declare no conflict of interest.
References
- Sun, B.; Fazeli, F.; Scott, C.; Guo, B.; Aranas, C.; Chu, X.; Jahazi, M.; Yue, S. Microstructural characteristics and tensile behavior of medium manganese steels with different manganese additions. Mater. Sci. Eng. A 2018, 729, 496–507. [Google Scholar] [CrossRef]
- Yang, Q.; Sun, Z.; Wang, Z. Effects of Sn, Si, and Cu addition on the microstructure and properties of hypermonotectic Al92Bi8 alloy. Mater. Sci. Eng. A 2019, 756, 71–81. [Google Scholar] [CrossRef]
- Cantor, B.; Chang, I.T.H.; Knight, P.; Vincent, A.J.B. Microstructural development in equiatomic multicomponent alloys. Mater. Sci. Eng. A 2004, 375–377, 213–218. [Google Scholar] [CrossRef]
- Yeh, J.-W.; Chen, S.-K.; Lin, S.-J.; Gan, J.-Y.; Chin, T.-S.; Shun, T.-T.; Tsau, C.-H.; Chang, S.-Y. Nanostructured high-entropy alloys with multiple principal elements novel alloy design concepts and outcomes. Adv. Eng. Mater. 2004, 6, 299–303. [Google Scholar] [CrossRef]
- Feuerbacher, M.; Lienig, T.; Thomas, C. A single-phase bcc high-entropy alloy in the refractory Zr-Nb-Ti-V-Hf system. Scripta Mater. 2018, 152, 40–43. [Google Scholar] [CrossRef] [Green Version]
- Yang, T.; Zhao, Y.L.; Tong, Y.; Jiao, Z.B.; Wei, J.; Cai, J.X.; Han, X.D.; Chen, D.; Hu, A.; Kai, J.J.; et al. Multicomponent intermetallic nanoparticles and superb mechanical behaviors of complex alloys. Science 2018, 362, 933–937. [Google Scholar] [CrossRef] [PubMed] [Green Version]
- Luo, H.; Li, Z.; Lu, W.; Ponge, D.; Raabe, D. Hydrogen embrittlement of an interstitial equimolar high-entropy alloy. Corros. Sci. 2018, 136, 403–408. [Google Scholar] [CrossRef]
- Basu, S.; Li, Z.; Pradeep, K.G.; Raabe, D. Strain Rate Sensitivity of a TRIP-Assisted Dual-Phase High-Entropy Alloy. Front. Mater. 2018, 5, 1–10. [Google Scholar] [CrossRef]
- Gu, J.; Song, M. Annealing-induced abnormal hardening in a cold rolled CrMnFeCoNi high entropy alloy. Scripta Mater. 2019, 162, 345–349. [Google Scholar] [CrossRef]
- Zhao, Y.J.; Qiao, J.W.; Ma, S.G.; Gao, M.C.; Yang, H.J.; Chen, M.W.; Zhang, Y. A hexagonal close-packed high-entropy alloy: The effect of entropy. Mater. Des. 2016, 96, 10–15. [Google Scholar] [CrossRef]
- Gao, M.C.; Zhang, B.; Guo, S.M.; Qiao, J.W.; Hawk, J.A. High-Entropy Alloys in Hexagonal Close-Packed Structure. Metall. Mater. Trans. A 2016, 47, 3322–3332. [Google Scholar] [CrossRef]
- Rao, J.C.; Ocelík, V.; Vainchtein, D.; Tang, Z.; Liaw, P.K.; De Hosson, J.T.M. The fcc-bcc crystallographic orientation relationship in AlxCoCrFeNi high-entropy alloys. Mater. Lett. 2016, 176, 29–32. [Google Scholar] [CrossRef] [Green Version]
- Nagase, T.; Takeuchi, A.; Amiya, K.; Egami, T. Solid state amorphization of metastable Al0.5TiZrPdCuNi high entropy alloy investigated by high voltage electron microscopy. Mater. Chem. Phys. 2018, 210, 291–300. [Google Scholar]
- Huang, H.; Wu, Y.; He, J.; Wang, H.; Liu, X.; An, K.; Wu, W.; Lu, Z. Phase-Transformation Ductilization of Brittle High-Entropy Alloys via Metastability Engineering. Adv. Mater. 2017, 29, 1–7. [Google Scholar] [CrossRef] [PubMed]
- Shivam, V.; Basu, J.; Shadangi, Y.; Singh, M.K.; Mukhopadhyay, N.K. Mechano-chemical synthesis, thermal stability and phase evolution in AlCoCrFeNiMn high entropy alloy. J. Alloys Compd. 2018, 757, 87–97. [Google Scholar] [CrossRef]
- Chen, L.; Zhou, Z.; Tan, Z.; He, D.; Bobzin, K.; Zhao, L.; Öte, M.; Königstein, T. High temperature oxidation behavior of Al0.6CrFeCoNi and Al0.6CrFeCoNiSi0.3 high entropy alloys. J. Alloys Compd. 2018, 764, 845–852. [Google Scholar] [CrossRef]
- Shi, Y.; Collins, L.; Feng, R.; Zhang, C.; Balke, N.; Liaw, P.K.; Yang, B. Homogenization of AlxCoCrFeNi high-entropy alloys with improved corrosion resistance. Corros. Sci. 2018, 133, 120–131. [Google Scholar] [CrossRef]
- Joseph, J.; Haghdadi, N.; Shamlaye, K.; Hodgson, P.; Barnett, M.; Fabijanic, D. The sliding wear behaviour of CoCrFeMnNi and AlxCoCrFeNi high entropy alloys at elevated temperatures. Wear 2019, 428–429, 32–44. [Google Scholar] [CrossRef]
- Amar, A.; Li, J.; Xiang, S.; Liu, X.; Zhou, Y.; Le, G.; Wang, X.; Qu, F.; Ma, S.; Dong, W.; et al. Additive manufacturing of high-strength CrMnFeCoNi-based High Entropy Alloys with TiC addition. Intermetallics 2019, 109, 162–166. [Google Scholar] [CrossRef]
- Chen, Y.; Zhu, S.; Wang, X.; Yang, B.; Ren, Z.; Han, G.; Wen, S. The strength-ductility balance of Al0.4CoCu0.6NiTix (x ≤ 1.0) and Al0.4CoCu0.6NiSi0.2Tix (x ≤ 0.5) high entropy alloys by regulating the proportion of Ti and improving the cooling rate. Vacuum 2018, 155, 270–279. [Google Scholar] [CrossRef]
- Gao, M.C.; Miracle, D.B.; Maurice, D.; Yan, X.; Zhang, Y.; Hawk, J.A. High-entropy functional materials. J. Mater. Res. 2018, 33, 3138–3155. [Google Scholar] [CrossRef] [Green Version]
- Li, P.; Wang, A.; Liu, C.T. A ductile high entropy alloy with attractive magnetic properties. J. Alloys Compd. 2017, 694, 55–60. [Google Scholar] [CrossRef]
- Zhu, X.; Zhou, X.; Yu, S.; Wei, C.; Xu, J.; Wang, Y. Effects of annealing on the microstructure and magnetic property of the mechanically alloyed FeSiBAlNiM (M = Co, Cu, Ag) amorphous high entropy alloys. J. Magn. Magn. Mater. 2017, 430, 59–64. [Google Scholar] [CrossRef]
- Alijani, F.; Reihanian, M.; Gheisari, K. Study on phase formation in magnetic FeCoNiMnV high entropy alloy produced by mechanical alloying. J. Alloys Compd. 2019, 773, 623–630. [Google Scholar] [CrossRef]
- Jung, C.; Kang, K.; Marshal, A.; Pradeep, K.G.; Seol, J.-B.; Lee, H.M.; Choi, P.-P. Effects of phase composition and elemental partitioning on soft magnetic properties of AlFeCoCrMn high entropy alloys. Acta Mater. 2019, 171, 31–39. [Google Scholar] [CrossRef]
- Zuo, T.; Zhang, M.; Liaw, P.K.; Zhang, Y. Novel high entropy alloys of FexCo1-xNiMnGa with excellent soft magnetic properties. Intermetallics 2018, 100, 1–8. [Google Scholar] [CrossRef]
- Liu, C.; Peng, W.; Jiang, C.S.; Guo, H.; Tao, J.; Deng, X.; Chen, Z. Composition and phase structure dependence of mechanical and magnetic properties for AlCoCuFeNix high entropy alloys. J. Mater. Sci. Technol. 2019, 35, 1175–1183. [Google Scholar] [CrossRef]
- Li, Z.; Gu, Y.; Pan, M.; Wang, C.; Wu, Z.; Hou, X.; Tan, X.; Xu, H. Tailoring AC magnetic properties of FeCoNi(MnSi)x (0 ≤ x ≤ 0.4) high-entropy alloys by the addition of Mn and Si elements. J. Alloys Compd. 2019, 792, 215–221. [Google Scholar] [CrossRef]
- Zhang, B.; Duan, Y.; Cui, Y.; Ma, G.; Wang, T.; Dong, X. Improving electromagnetic properties of FeCoNiSi0.4Al0.4 high entropy alloy powders via their tunable aspect ratio and elemental uniformity. Mater. Des. 2018, 149, 173–183. [Google Scholar] [CrossRef]
- Zhang, B.; Duan, Y.; Wen, X.; Ma, G.; Wang, T.; Dong, X.; Zhang, H.; Jia, N.; Zeng, Y. FeCoNiSixAl0.4 high entropy alloy powders with dual-phase microstructure: Improving microwave absorbing properties via controlling phase transition. J. Alloys Compd. 2019, 790, 179–188. [Google Scholar] [CrossRef]
- Duan, Y.; Cui, Y.; Zhang, B.; Ma, G.; Tongmin, W. A novel microwave absorber of FeCoNiCuAl high-entropy alloy powders: Adjusting electromagnetic performance by ball milling time and annealing. J. Alloys Compd. 2019, 773, 194–201. [Google Scholar] [CrossRef]
- Zhong, L. Magnetic Properties and Microstructure of FeCoNiMx (M = AlCu, AlMn, AlSi and MnSi) High-Entropy Alloys; Shanghai University: Shanghai, China, 2019. [Google Scholar]
- Koželj, P.; Vrtnik, S.; Jelen, A.; Krnel, M.; Gačnik, D.; Dražić, G.; Meden, A.; Wencka, M.; Jezeršek, D.; Leskovec, J.; et al. Discovery of a FeCoNiPdCu High-Entropy Alloy with Excellent Magnetic Softness. Adv. Eng. Mater. 2019, 21, 1801055. [Google Scholar] [CrossRef]
- Dean, J.A. Lange’s Chemistry Handbook Version 15th; Advanced Manufacturing Processes: New York, NY, USA, 2003. [Google Scholar]
- Li, Z.; Gu, Y.; Wang, C.; Pan, M.; Zhang, H.; Wu, Z.; Hou, X.; Tan, X.; Xu, H. Microstructure and magnetic properties of the FeCoNi(CuAl)0.8Ga0.06 high-entropy alloy during the phase transition. J. Alloys Compd. 2019, 779, 293–300. [Google Scholar] [CrossRef]
- Chang, L.; Xie, L.; Liu, M.; Li, Q.; Dong, Y.-Q.; Chang, C.-T.; Wang, X.-M.; Inoue, A. Novel Fe-based nanocrystalline powder cores with excellent magnetic properties produced using gas-atomized powder. J. Magn. Magn. Mater. 2018, 452, 442–446. [Google Scholar] [CrossRef]
- Li, Z.-C.; Dong, Y.-Q.; Pauly, S.; Chang, C.-T.; Wei, R.; Li, F.-S.; Wang, X.-M. Enhanced soft magnetic properties of Fe-based amorphous powder cores by longitude magnetic field annealing. J. Alloys Compd. 2017, 706, 1–6. [Google Scholar] [CrossRef]
- Jo Sunday, K.; Hanejko, F.G.; Taheri, M.L. Magnetic and microstructural properties of Fe3O4-coated Fe powder soft magnetic composites. J. Magn. Magn. Mater. 2017, 423, 164–170. [Google Scholar] [CrossRef]
- Zhong, W. Ferromagnetics (2); Science Press: Beijing, China, 2017. [Google Scholar]
- Starodubtsev, Y.N.; Kataev, V.A.; Bessonova, K.O.; Tsepelev, V.S. Hysteresis losses in nanocrystalline alloys with magnetic-field-induced anisotropy. J. Magn. Magn. Mater. 2019, 479, 19–26. [Google Scholar] [CrossRef]
- Deng, Q.; Tang, Y.; Tan, Y.; Tan, X.; Yang, Y.; Xu, H. Effect of grain boundary character distribution on soft magnetic property of face-centered cubic FeCoNiAl0.2 medium-entropy alloy. Mater. Charact. 2019. [Google Scholar] [CrossRef]
- Coey, J.M.D. Magnetism and Magnetic Materials; Cambridge University Press: England, UK; Peking Univeristy Press: Beijing, China, 2014. [Google Scholar]
Figure 1.
X-ray diffraction (XRD) patterns of the FeCoNixCuAl (1.0 ≤ x ≤ 1.75) high-entropy alloys (HEAs).
Figure 1.
X-ray diffraction (XRD) patterns of the FeCoNixCuAl (1.0 ≤ x ≤ 1.75) high-entropy alloys (HEAs).

Figure 2.
(a) SEM-BSE image of FeCoNi1.0CuAl high-entropy alloys, and SEM-energy dispersive spectroscopy (EDS) elemental mapping images for (b) Fe Kα; (c) Co Kα; (d) Cu Kα; (e) Al K; (f) Ni Kα from the same region as (a).
Figure 2.
(a) SEM-BSE image of FeCoNi1.0CuAl high-entropy alloys, and SEM-energy dispersive spectroscopy (EDS) elemental mapping images for (b) Fe Kα; (c) Co Kα; (d) Cu Kα; (e) Al K; (f) Ni Kα from the same region as (a).

Figure 3.
(a) SEM-BSE image of FeCoNi1.25CuAl high-entropy alloys, and SEM-EDS elemental mapping images for (b) Fe Kα; (c) Co Kα; (d) Cu Kα; (e) Al K; (f) Ni Kα from the same region as (a).
Figure 3.
(a) SEM-BSE image of FeCoNi1.25CuAl high-entropy alloys, and SEM-EDS elemental mapping images for (b) Fe Kα; (c) Co Kα; (d) Cu Kα; (e) Al K; (f) Ni Kα from the same region as (a).

Figure 4.
(a) SEM-BSE image of FeCoNi1.5CuAl high-entropy alloys, and SEM-EDS elemental mapping images for (b) Fe Kα; (c) Co Kα; (d) Cu Kα; (e) Al K; (f) Ni Kα from the same region as (a).
Figure 4.
(a) SEM-BSE image of FeCoNi1.5CuAl high-entropy alloys, and SEM-EDS elemental mapping images for (b) Fe Kα; (c) Co Kα; (d) Cu Kα; (e) Al K; (f) Ni Kα from the same region as (a).

Figure 5.
(a) SEM-BSE image of FeCoNi1.75CuAl high-entropy alloys, and SEM-EDS elemental mapping images for (b) Fe Kα; (c) Co Kα; (d) Cu Kα; (e) Al K; (f) Ni Kα from the same region as (a).
Figure 5.
(a) SEM-BSE image of FeCoNi1.75CuAl high-entropy alloys, and SEM-EDS elemental mapping images for (b) Fe Kα; (c) Co Kα; (d) Cu Kα; (e) Al K; (f) Ni Kα from the same region as (a).

Figure 6.
(a) The AC magnetization curve; (b) The AC hysteresis loops; (c) The soft magnetic parameters and I(111)F/I(110)B as a function of x for the FeCoNixCuAl (1.0 ≤ x ≤ 1.75) HEAs measured at H = 10 kA/m and f = 50 Hz.
Figure 6.
(a) The AC magnetization curve; (b) The AC hysteresis loops; (c) The soft magnetic parameters and I(111)F/I(110)B as a function of x for the FeCoNixCuAl (1.0 ≤ x ≤ 1.75) HEAs measured at H = 10 kA/m and f = 50 Hz.

Figure 7.
AC soft magnetic parameters as a function of f for the FeCoNixCuAl (1.0 ≤ x ≤ 1.75) HEAs measured at AC Bm = 300 mT (a) AC Br; (b) AC Hc; (c) Ps.
Figure 7.
AC soft magnetic parameters as a function of f for the FeCoNixCuAl (1.0 ≤ x ≤ 1.75) HEAs measured at AC Bm = 300 mT (a) AC Br; (b) AC Hc; (c) Ps.

Figure 8.
AC hysteresis loss (Ph)/Ps as a function of f for the FeCoNixCuAl (1.0 ≤ x ≤ 1.75) HEAs.

Figure 9.
(a) Eddy current loss (Pe) at 50 Hz; (b) Pe at 950 Hz; (c) the ρ as a function of x for the FeCoNixCuAl (1.0 ≤ x ≤ 1.75) HEAs.
Figure 9.
(a) Eddy current loss (Pe) at 50 Hz; (b) Pe at 950 Hz; (c) the ρ as a function of x for the FeCoNixCuAl (1.0 ≤ x ≤ 1.75) HEAs.

Figure 10.
(a) Ph at 50 Hz; (b) AC Hc at 50 Hz; (c) AC Br at 50 Hz (d) Ph at 950 Hz (e) AC Hc at 950 Hz (f) AC Br at 950 Hz as a function of x for the FeCoNixCuAl (1.0 ≤ x ≤ 1.75) HEAs.
Figure 10.
(a) Ph at 50 Hz; (b) AC Hc at 50 Hz; (c) AC Br at 50 Hz (d) Ph at 950 Hz (e) AC Hc at 950 Hz (f) AC Br at 950 Hz as a function of x for the FeCoNixCuAl (1.0 ≤ x ≤ 1.75) HEAs.


Table 1.
The values of I(111)F/I(110)B and lattice parameters of the FeCoNixCuAl (1.0 ≤ x ≤ 1.75) HEAs.
Table 1.
The values of I(111)F/I(110)B and lattice parameters of the FeCoNixCuAl (1.0 ≤ x ≤ 1.75) HEAs.
| x | I(111)F/I(110)B | A ± 0.0002 (nm) | |
|---|---|---|---|
| FCC | BCC | ||
| 1.0 | 0.447 | 0.3618 | 0.2877 |
| 1.25 | 1.374 | 0.3614 | 0.2876 |
| 1.5 | 4.016 | 0.3610 | 0.2872 |
| 1.75 | 11.364 | 0.3608 | - |
Table 2.
Parameters of values of electron concentration (VEC), atomic size difference (ΔR), electronegativity differences (ΔX), mixing entropy (ΔS), mixed enthalpy (ΔH) and solid solution formation ability (Ω) for the FeCoNixCuAl (1.0 ≤ x ≤ 1.75) HEAs.
Table 2.
Parameters of values of electron concentration (VEC), atomic size difference (ΔR), electronegativity differences (ΔX), mixing entropy (ΔS), mixed enthalpy (ΔH) and solid solution formation ability (Ω) for the FeCoNixCuAl (1.0 ≤ x ≤ 1.75) HEAs.
| x | VEC | ΔR | ΔX | ΔS (J/K·mol) | ΔH (kJ/mol) | Ω (kJ/mol) |
|---|---|---|---|---|---|---|
| 1.0 | 8.20 | 5.404 | 0.1115 | 1.609R | −5.28 | 3.8477 |
| 1.25 | 8.29 | 5.341 | 0.1102 | 1.605R | −5.51 | 3.6980 |
| 1.5 | 8.36 | 5.278 | 0.1090 | 1.594R | −5.69 | 3.5831 |
| 1.75 | 8.43 | 5.216 | 0.1077 | 1.579R | −5.81 | 3.4932 |
Table 3.
The chemical compositions (at.%) of the FeCoNixCuAl (1.0 ≤ x ≤ 1.75) HEAs by EDS point analysis.
Table 3.
The chemical compositions (at.%) of the FeCoNixCuAl (1.0 ≤ x ≤ 1.75) HEAs by EDS point analysis.
| x | Regions | Fe | Co | Ni | Cu | Al |
|---|---|---|---|---|---|---|
| 1.0 | Nominal | 20.00 | 20.00 | 20.00 | 20.00 | 20.00 |
| A | 19.74 | 20.00 | 20.06 | 18.98 | 21.23 | |
| B | 15.54 | 15.12 | 17.27 | 37.01 | 15.07 | |
| 1.25 | Nominal | 19.05 | 19.05 | 23.80 | 19.05 | 19.05 |
| A | 21.31 | 21.69 | 23.92 | 12.34 | 20.74 | |
| B | 15.77 | 15.05 | 21.61 | 32.39 | 15.18 | |
| 1.5 | Nominal | 18.18 | 18.18 | 27.28 | 18.18 | 18.18 |
| A | 13.56 | 15.50 | 28.33 | 18.56 | 24.05 | |
| B | 21.93 | 22.20 | 26.96 | 13.01 | 15.90 | |
| PB | 13.21 | 13.69 | 24.21 | 32.72 | 16.17 | |
| 1.75 | Nominal | 17.39 | 17.39 | 30.44 | 17.39 | 17.39 |
| A | 12.37 | 13.68 | 31.71 | 17.75 | 24.49 | |
| B | 20.93 | 20.58 | 30.04 | 13.4 | 15.07 | |
| PB | 13.13 | 13.52 | 29.95 | 28.10 | 15.29 |
Table 4.
AC maximum magnetic flux density (Bm), AC remanence (Br), AC coercivity (Hc) and energy loss (Ps) of the FeCoNixCuAl (1.0 ≤ x ≤ 1.75) HEAs measured at H = 10 kA/m and f = 50 Hz.
Table 4.
AC maximum magnetic flux density (Bm), AC remanence (Br), AC coercivity (Hc) and energy loss (Ps) of the FeCoNixCuAl (1.0 ≤ x ≤ 1.75) HEAs measured at H = 10 kA/m and f = 50 Hz.
| x | AC Bm (mT) | AC Br (mT) | AC Hc (A/m) | Ps (W/kg) |
|---|---|---|---|---|
| 1.0 | 608.3 | 320.0 | 1582.0 | 19.79 |
| 1.25 | 577.3 | 244.9 | 705.3 | 8.02 |
| 1.5 | 468.2 | 148.2 | 424.7 | 3.24 |
| 1.75 | 410.6 | 98.2 | 306.3 | 1.89 |
Table 5.
AC magnetic parameters measured at AC Bm = 0.3 T at different f and electrical resistivity of the FeCoNixCuAl (1.0 ≤ x ≤ 1.75) HEAs.
Table 5.
AC magnetic parameters measured at AC Bm = 0.3 T at different f and electrical resistivity of the FeCoNixCuAl (1.0 ≤ x ≤ 1.75) HEAs.
| x | F (Hz) | Ps (W/kg) | Ph (W/kg) | Pe (W/kg) | Ph/Ps (%) | AC Hc (A/m) | AC Br (mT) | Ρ (μΩ·cm) |
|---|---|---|---|---|---|---|---|---|
| 1.0 | 50 | 5.13 | 4.91 | 0.22 | 95.7 | 806.7 | 184.4 | 54.7 |
| 1.25 | 1.93 | 1.76 | 0.17 | 91.2 | 322.2 | 159.8 | 67.1 | |
| 1.5 | 0.97 | 0.85 | 0.12 | 87.6 | 190.5 | 119.9 | 86.7 | |
| 1.75 | 0.85 | 0.77 | 0.08 | 90.6 | 172.7 | 90.1 | 93.3 | |
| 1.0 | 100 | 10.78 | 9.91 | 0.87 | 91.9 | 850.2 | 187.4 | 54.7 |
| 1.25 | 4.25 | 3.56 | 0.69 | 83.8 | 353.3 | 165.5 | 67.1 | |
| 1.5 | 2.21 | 1.71 | 0.50 | 77.4 | 214.7 | 126.7 | 86.7 | |
| 1.75 | 1.86 | 1.52 | 0.34 | 81.7 | 189.0 | 94.0 | 93.3 | |
| 1.0 | 150 | 16.91 | 14.94 | 1.97 | 88.4 | 891.9 | 189.9 | 54.7 |
| 1.25 | 6.94 | 5.39 | 1.55 | 77.7 | 381.6 | 170.5 | 67.1 | |
| 1.5 | 3.68 | 2.56 | 1.12 | 69.5 | 235.4 | 131.8 | 86.7 | |
| 1.75 | 3.02 | 2.26 | 0.76 | 74.9 | 203.5 | 97.4 | 93.3 | |
| 1.0 | 250 | 30.71 | 25.25 | 5.46 | 82.2 | 966.5 | 194.6 | 54.7 |
| 1.25 | 13.49 | 9.19 | 4.30 | 68.1 | 434.3 | 179.1 | 67.1 | |
| 1.5 | 7.40 | 4.28 | 3.12 | 57.9 | 273.1 | 140.9 | 86.7 | |
| 1.75 | 5.92 | 3.82 | 2.10 | 64.5 | 231.5 | 103.4 | 93.3 | |
| 1.0 | 350 | 46.49 | 35.78 | 10.71 | 77.0 | 1039 | 198.9 | 54.7 |
| 1.25 | 21.40 | 12.97 | 8.43 | 60.6 | 481.5 | 185.9 | 67.1 | |
| 1.5 | 12.11 | 5.99 | 6.12 | 49.5 | 308.7 | 148.5 | 86.7 | |
| 1.75 | 9.63 | 5.52 | 4.11 | 57.3 | 258.6 | 109.6 | 93.3 | |
| 1.0 | 450 | 64.18 | 46.48 | 17.70 | 72.4 | 1106 | 202.8 | 54.7 |
| 1.25 | 30.89 | 16.96 | 13.93 | 54.9 | 531.3 | 192.4 | 67.1 | |
| 1.5 | 18.05 | 7.94 | 10.11 | 44.0 | 345.7 | 155.9 | 86.7 | |
| 1.75 | 13.67 | 6.87 | 6.80 | 50.3 | 281.2 | 112.6 | 93.3 | |
| 1.0 | 550 | 82.32 | 55.88 | 26.44 | 67.9 | 1147 | 205.0 | 54.7 |
| 1.25 | 41.35 | 20.55 | 20.80 | 49.7 | 569.1 | 197.6 | 67.1 | |
| 1.5 | 24.63 | 9.52 | 15.11 | 38.7 | 372.2 | 161.1 | 86.7 | |
| 1.75 | 18.55 | 8.39 | 10.16 | 45.2 | 305.0 | 116.8 | 93.3 | |
| 1.0 | 650 | 103.00 | 66.08 | 36.92 | 64.2 | 1202 | 208.6 | 54.7 |
| 1.25 | 52.79 | 23.73 | 29.06 | 45.0 | 607.5 | 201.5 | 67.1 | |
| 1.5 | 32.10 | 11.00 | 21.10 | 34.3 | 402.8 | 165.9 | 86.7 | |
| 1.75 | 23.87 | 9.68 | 14.19 | 40.6 | 330.8 | 119.5 | 93.3 | |
| 1.0 | 750 | 124.30 | 75.14 | 49.16 | 60.5 | 1249 | 210.7 | 54.7 |
| 1.25 | 66.04 | 27.35 | 38.69 | 41.4 | 650.9 | 207.3 | 67.1 | |
| 1.5 | 40.93 | 12.84 | 28.09 | 31.4 | 436.4 | 170.8 | 86.7 | |
| 1.75 | 29.61 | 10.72 | 18.89 | 36.2 | 350.7 | 122.8 | 93.3 | |
| 1.0 | 850 | 147.50 | 84.36 | 63.14 | 57.2 | 1296 | 213.1 | 54.7 |
| 1.25 | 80.00 | 30.31 | 49.69 | 37.9 | 690.5 | 209.9 | 67.1 | |
| 1.5 | 50.54 | 14.46 | 36.08 | 28.6 | 470.4 | 175.9 | 86.7 | |
| 1.75 | 37.63 | 13.37 | 24.26 | 35.5 | 375.0 | 127.5 | 93.3 | |
| 1.0 | 950 | 172.20 | 93.33 | 78.87 | 54.2 | 1346 | 214.8 | 54.7 |
| 1.25 | 95.37 | 33.30 | 62.07 | 34.9 | 729.4 | 214.2 | 67.1 | |
| 1.5 | 61.25 | 16.18 | 45.07 | 26.4 | 501.5 | 179.8 | 86.7 | |
| 1.75 | 45.13 | 14.83 | 30.30 | 32.9 | 395.5 | 129.0 | 93.3 |
© 2019 by the authors. Licensee MDPI, Basel, Switzerland. This article is an open access article distributed under the terms and conditions of the Creative Commons Attribution (CC BY) license (http://creativecommons.org/licenses/by/4.0/).
Share and Cite
MDPI and ACS Style
Wu, Z.; Wang, C.; Zhang, Y.; Feng, X.; Gu, Y.; Li, Z.; Jiao, H.; Tan, X.; Xu, H. The AC Soft Magnetic Properties of FeCoNixCuAl (1.0 ≤ x ≤ 1.75) High-Entropy Alloys. Materials 2019, 12, 4222. https://doi.org/10.3390/ma12244222
AMA Style
Wu Z, Wang C, Zhang Y, Feng X, Gu Y, Li Z, Jiao H, Tan X, Xu H. The AC Soft Magnetic Properties of FeCoNixCuAl (1.0 ≤ x ≤ 1.75) High-Entropy Alloys. Materials. 2019; 12(24):4222. https://doi.org/10.3390/ma12244222
Chicago/Turabian StyleWu, Zhongyuan, Chenxu Wang, Yin Zhang, Xiaomeng Feng, Yong Gu, Zhong Li, Huisheng Jiao, Xiaohua Tan, and Hui Xu. 2019. "The AC Soft Magnetic Properties of FeCoNixCuAl (1.0 ≤ x ≤ 1.75) High-Entropy Alloys" Materials 12, no. 24: 4222. https://doi.org/10.3390/ma12244222
Note that from the first issue of 2016, this journal uses article numbers instead of page numbers. See further details here.