Probabilistic Prediction of Strength and Fracture Toughness Scatters for Ceramics Using Normal Distribution

Key Laboratory of Road Construction Technology and Equipment, MOE, Chang’an University, Xi’an 710064, China
*
Author to whom correspondence should be addressed.
Materials 2019, 12(5), 727; https://doi.org/10.3390/ma12050727
Submission received: 8 February 2019
/
Revised: 21 February 2019
/
Accepted: 25 February 2019
/
Published: 2 March 2019
Abstract
:Tensile strength ft and fracture toughness KIC of ceramic are not deterministic properties or fixed values, but fluctuate within certain ranges. A nonlinear elastic fracture mechanics model was developed in this study and combined with the common normal distribution to predict ceramic’s ft and KIC with consideration of their scatters in a statistical sense. In the model, the relative characteristic crack size a*ch/G (characteristic crack size a*ch, average grain size G) was determined based on the fracture measurements on five types of ceramics with different G from 2 to 20 μm in the reference (Usami S, et al., Eng. Fract Mech. 1986, 23, 745). The combined application of the model and normal distribution has two functions: (i) probabilistic ft and KIC can be derived from seemingly randomly varied fracture tests on small ceramic specimens containing different initial defects/cracks, and (ii) with ft or KIC values (corresponding mean and standard deviation), fracture strength of heterogeneous samples with and without cracks can be predicted by considering scatter described by specified reliability. For the fine ceramics, the predicted results containing the mean and the upper and lower bounds with 96% reliability gained with the model, match very well with the experimental results (a, σN).

1. Introduction
One of the biggest challenges in material sensitive design is to accurately and reliably predict the fundamental mechanical properties of materials. However, the physical properties such as tensile strength ft and fracture toughness KIC are not fixed or deterministic, and fluctuate in certain range, which has been well recognized recently [1,2,3].
The inevitable variation in mechanical property of materials is mainly due to the heterogeneity of microstructure, defects like pores and the activation of various fracture mechanisms during the crack-microstructure interactions [4]. For polycrystalline brittle materials such as fine-grained ceramics [5,6,7] and coarse-grained rocks [8,9,10], the average grain size G has a profound influence on material properties including ft and KIC. For composites and 3D-printed scaffolds [11], their unit cells have a similar role as that of G.
Nonlinear elastic fracture of those solids initiated from shallow defects comparable to their grain sizes can bring out significant information on the inherent relationship between microstructure and material properties. Besides separate influence on ft and KIC, the effect of G on the combined parameter 0.25*(KIC/ft)2, commonly known as characteristic crack size a*ch indicating the transition from ft-controlled to KIC-controlled fracture of brittle solid [12,13], is becoming increasingly important. Taylor has done numerous studies on characteristic length lch, proportional to a*ch, and proposed the world-renowned theory of critical distance (TCD) [14,15,16,17,18,19]. It has been found that the lch varies from 1 to 10 times of grain size G depending on the materials. Generally speaking, lch = (3–4)G can be adopted for various fine-grained ceramics. More recently, we reanalysed the fracture measurements data on four fine-grained ceramics with G from 2 to 20 μm and on two coarse-grained rocks with G = 2.5 and 10 mm, and also found a semi-quantitative relation of a*ch ≥ 3G [7,10].Therefore, an explicit relationship between a*ch and G is an urgency need not only for the fundamental knowledge of microstructure-driven material research, but also for the safe design application.
For fracture data analysis methods, the common practice is that fracture strength is first obtained from experiment and then fitted by various fracture models, and the scatters are usually indicated by the maximum and minimum values but rarely described with a specified reliability [20,21,22,23,24,25,26]. The problem is that the models cannot describe the scatter of physical properties or fracture strength with specified reliability. In addition, many parameters in the models are fitting parameters which carry little physical significance.
In this study, five groups of fracture measurements on ceramics specimens with G from 2 to 20 μm and containing different initial defects from 100 nm to 800 μm [27,28] were reanalyzed to determine the relative characteristic crack size C = a*ch/G. Based on this, a non- linear elastic fracture mechanics (non-LEFM) analytical model is proposed to predict ft and KIC of ceramics as function of grain size G from common fracture measurements, and to predict fracture strength of specimens with and without small defects if ft or KIC are available. Instead of curve fitting, the common normal distribution was used to analyse the fracture behaviour of ceramics to consider the scatters of physical and mechanical properties.
2. Determination of the Relative Characteristic Crack Size in Non-LEFM Model
Based on our previous work [7], fracture strength of ceramic specimens containing small flaws/cracks can be assessed by the following formula,
where the combined parameter C⋅G = a*ch = 0.25(KIC/ft)2 is a material constant defined by the intersection of two fracture criteria KIC and ft, and σN is the engineering stress without consideration of the influence of initial crack size a.
Although Weibull distribution has been widely used to determine the fracture behavior of materials, its role has usually been confined to fit experimental data rather than providing predictive insight into material properties (e.g., ft and KIC) and their experimental scatters [4]. In our previous study [7,10], another common statistical analysis method of normal distribution has been used to analyze experimental data of ceramic fracture after roughly assessing the relative characteristic crack size C (= a*ch/G) at intervals of 0.25. In this study, we accurately determine the C value by continuously changing its value instead of interval.
The average grain size G is the microstructure characteristic of a polycrystalline material which can be statistically measured separately.If the C is a fixed value, Equation (1a) can be linearized by considering σN and 1/[1 + a/(C⋅G)]0.5 as ordinate and abscissa respectively, then it can be used in conjunction with the common normal distribution to make probabilistic analysis on ft with 96% reliability. That is, if an experimental data (σN, a) is measured, the ft from Equation (1a) becomes a single parameter after giving C a fixed value. Having numerous pairs of values of original crack a and engineering stress σN obtained from specimens with different α ratio (= a/W, W is the beam/specimen height), the data points (σN, 1/[1 + a/(C⋅G)]0.5) obtained can be plotted with these quantities considered as ordinate and abscissa respectively. Using Equation (1a), a group of ft values can be easily statistically analysed by normal distribution mehthodology.
Similarly, the following equation can be obtained by substituing the relation C⋅G = 0.25(KIC/ft)2 into Equation (1a), which is used to calculate KIC value from fracture measurement (σN, a). Similarly, Equation (1b) combined with normal distribution can be used to do statistical analyses of KIC values from experimental measurements data if the C is a fixed value.
Therefore, a determined value of C urgently needs to be included in the two formulas of Equation (1). For this reason, the ralative characteristic crack sizeC (= a*ch/G) independent of grain size G is assessed based on the experimental data (σN, a) on five ceramics with different G from 2 to 20 μm. In total, 14 experimental data points (σN, a) of the Sialon with average grain size G = 2 μm, 29 points of the SiC with G = 3 μm, 25 points of Si3N4 with G = 3 μm, 16 points of Si3N4 with G = 4 μm, and 42 points of Al2O3 with G = 20 μm, were digitized from the reference [28].
Based on the fracture measurements (σN, a) of the five ceramics considered in this study, each group of ft values from Equation (1a) and KIC values from Equation (1b) was analyzed using two ways respectively to ensure reliability of analyzed results.
Figure 1 illustrates the evolution of standard deviation σf of tensile strength ft from Equation (1) as the relative characteristic crack size C (= a*ch/G) varies continuously. C0 is defined as the critical value of C signifying the σf transitioned from decrease to increase. That is the C0 value is determined by the condition that the σf value is minimum. When the relative characteristic crack size C gradually deviates from the C0 value, σf increases accordingly. According to the analyzed results of the five ceramics with different G from 2 to 20 μm, it can be found that C0 value is not dependent on grain size and fluctuates in a range from 2.8 to 4.7.
The largest number of experimental data points selected in this analysis is 42 from Al2O3 fracture, and the minimum number is mere 14 from Sialon. Considering the effect of the fewer number of data points (14 to 42 points) in each group of fracture measurements, we take the average of C0 values (i.e., 3.380 in this analysis) obtained from the fracture measurements of the five ceramics as the determined value of C, which at least should be one of the accepted and reasonable ways.
For the analysis of ft distribution in Figure 1, ft is derived from fracture measurement data (σN, a) through Equation (1a), in which σN and 1/[1 + a/(C⋅G)]0.5 follow a linear relation and ft in MPa is the slope of the straigth line through the origin. For each data point (σN, a), the angle between the abscissa and the straight line through the origin and the considered point approaches 90° because the tangent of angle indicating ft value is usually around several hundred. Therefore, any tiny error in the degitization of data point (a, σN) can result in significant fluctuation in the corresponding ft value.
For this reason, we tried another statistic method to determine the C value based on the same five groups of ceramic fracture measurements. Figure 2 illustrates the evolution of the sum of distances of all the experimental points to the mean line indicating the average of ft values from Equation (1a) as C varies continuously. C0 value is determined by the condition that the sum of distances by normal to the mean line is minimum. It is evident that the sum of the distances gradually increases when the C deviates from C0. It can also be found that C0 value is not dependent on the grain size G and flucturates in a range from 2.6 to 4.3. Again, we took the average of C0 values obtained from the five different ceramics fracture as the determined C value, i.e., 3.1788 in this analysis.
Figure 3 illustrates the evolution of standard deviation σk of KIC from Equation (1b) determined by normal distribution as the relative characteristic crack size C (= a*ch/G) varies continuously for the five ceramics, and the C0 value is determined by the condition the σk is minimum. The same as above, C0 value is not dependent on the grain size G and flucturates in narrower range from 2.7 to 4.1 in comparison to the results of ft distribution. The average of C0 values obtained from the five different ceramics fracture is 3.1426 in this analysis.
Figure 4 illustrates the evolution of the range of (KIC)max–(KIC)min from Equation (1b) as the relative characteristic crack size C (= a*ch/G) varies continuously for the five ceramics, and the C0 value is determined by the condition the range is minimum. Again, the C0 value is not dependent on the grain size G and flucturates in narrower range from 2.6 to 4.0 in comparison to the results of ft distribution. The average of C0 values obtained from the five different ceramics fracture is 3.1288 in this analysis.
According to the above analyses based on the fracture measurements of the five ceramic with largely different G, the relative charateristic crack C (= a*ch/G) value is indeed not dependent on the grain size G, and is eaual to 3.380 and 3.1788 obtained from ft distribution, and 3.1426 and 3.1288 from KIC distribution. It should be noted that the characteristic crack size a*ch = C⋅G is a specified crack indicating the transition from ft-controlled fracture to KIC-controlled fracture. Furthermore, the dominant non-LEFM mechanism of brittle materials such as ceramic should have relation to the defects in solids, which may be linked to microstructure characteristic G. If one quantitatively links the specified crack length a*ch to the material microstructure characteristic G, from the perspectives of mathematics and physics the relation of a*ch = π⋅G between the two should be a good choice under condition of C ≈ 3.1–3.4 from the above ft and KIC distribution analyses. In addtion, the C values from KIC distribution is more stable than those from ft distribution, which will be proved in the following section. For simplicity and consistency between ft distribution and KIC distribution, C0 = a*ch/G = π is selected in this study.
3. Probabilistic Strength and Fracture Toughness Analyses
Following the determination of the relative characteristic crack size C = π based on the fracture behaviour of five ceramics with G from 2 to 20 μm, Equation (1) can now be rewritten as follows.
The dimensionless η(a, G) and equivalent length Le (a, G) in Equation (2) are wholly determined for a specified sample. For any group of ceramic specimens, the seemingly randomly varied fracture measurements data (σN, a) can be used to obtain a group of ft value using Equation (2a) and KIC values using Equation (2b) which can be easily analysed by normal distribution to get corresponding mean and standard deviation. With the mean μf and standard deviation σf of ft distribution, Equation (2a) can be rewritten to include the mean and upper and lower bounds with 96% reliability indicating ft scatter during fracture behaviour.
Similarly, Equation (2b) can be rewritten as follows.
The problem of the most existing probabilistic models is that they do not consider the scatters of ft, KIC and fracture strengthσN prior to experimental measurements [4]. After determinations of the corresponding mean and standard deviation, three σN–η(a, G) linear relations from ft distribution and three σN–Le(a, G) straight lines based on KIC distribution, can be plotted together including the mean line and upper and lower bounds indicating both ft and KIC scatters.
In Figure 5, Figure 6, Figure 7, Figure 8 and Figure 9, we take the five ceramic-fracture cases as examples to illustrate the combined application of the non-LEFM model Equation (3) and the normal distribution, and to check the validity and reliability of the C = π. For each group of ceramic fracture, ft normal distribution illustrated in Figure 5a–Figure 9a and KIC normal distribution in Figure 5b–Figure 9b are evaluated from the same experimental measurements (σN, a). Then the three predicted linear relations from Equation (3a) using μf and σf of ft distribution are shown in Figure 5c–Figure 9c, and the three predicted straight lines from Equation (3b) with the μk and μk ± 2σk from KIC distribution are illustrated in Figure 5d–Figure 9d.
Obviously, both ft and KIC with 96% reliability can be successfully deduced from the seemingly randomly varied experimental data points (σN, a). It can also be seen that the middle straight lines indicating the mean values of ft or KIC are almost the same as the corresponding fitted curves respectively. As we all know, the commonly used curve fitting methodology cannot describe the experimental scatter of fracture behaviour, but the proposed model can provide more scientific descriptions. This adds a significant understanding for the fracture of ceramic with and without small defects. Similarly, the scatters of fracture strength σN due to the stochastic characteristic of microstructure and the activation of various fracture mechanisms during the crack-microstructure interaction cannot be identified by the common curve fitting methodology.
Because the μf and σf values are constants, the corresponding slopes of the three straight lines of σN–η(a, G) relation indicating mean and upper and lower bounds are kept as constants as η(a, G) increases in Figure 5c–Figure 9c, leading to more σN scatter, which matches very well the experimental results reported in the literature [27,28]. This indicates that a specimen with higher η(a, G) value will have larger fluctuation of σN during fracture. That is larger specimen has larger σN scatter which is absolutely reasonable in physics concept. Here, it should be noted that the percentage of σN variation keeps constant in theory for various specimens with different η(a0, G) as the mean and standard deviation are constant. The same conclusions can also be observed from the corresponding results obtained from KIC distribution in Figure 5d–Figure 9d.
It should be noted that the two linear relations of σN–η(a, G) and σN–Le (a, G) pass through their respective origins, which are fixed points from perspectives of mathematics and physics. During the process of application, this is very useful to helping determine the slopes of the linear relations, which indicate the ft or KIC values. In addition, it can be seen that KIC normal distribution is better than the ft normal distribution from the histograms for Sialon, SiC and Al2O3 cases, and KIC and ft normal distribution are similar for the other two cases. Thus, it is reasonable that the determination of C value (=π) in Section 2 thought more of the KIC analyses.
4. Probabilistic Prediction of Ceramic Facture
By employing the two concepts of dimensionless η(a, G) and equivalent length Le (a, G), the nonlinear relation in Equation (1) for assessing the fracture strength of ceramic specimen is linearized in relation as listed in Equation (2). The non-LEFM model combined with the common normal distribution can easily deduce ceramic’s ft and KIC with a specified reliability from the seemingly randomly varied fracture measurements (σN, a) as shown in Equation (3).
In fact, the linearized non-LEFM model with a specified reliability or Equation (3) can be conveniently transformed to an application model in nor-linear relation of σN–a for finally predicting the fracture strength σN. If corresponding mean and standard deviation of material strength ft or fracture toughness KIC are available, the fracture strength of notched specimens with and without small defects can be easily predicted with a specified reliability through Equation (3). Using the values of ft property obtained and shown in Figure 5a–Figure 9a, here we take Equation (3a) as an example to show how to apply the model in nonlinear relation for predicting σN with a specified reliability.
The three predicted σN–a curves with mean and upper and lower bounds are shown in Figure 10 together with the experimental data points. For comparison, the fitted curves for the nonlinear relationship of σN–a using Equation (3a) are also added to the figure. A direct comparison between the experimental results and the predicted curves shows that the non-LEFM model or Equation (3a) can reliably predict the fracture of notch ceramics as the predicted curves with 96% reliability cover all the data points. In addition, the middle curve indicating the mean of ft value is more appropriate than the best fitted curve in each case. More importantly, those σN variations are inevitable for ceramic fracture. The proposed model can describe the σN scatter with a specified reliability, which is beyond the job of common curve fitting.
5. Discussion
In most of the existing probabilistic models, the fracture measurements data (a,σN) is usually first obtained from experiment and then fitted by linearized formula to get ft and KIC values. The problem of the most existing models is that they do not allow the scatters of ft and KIC data to be predicted before the experimental testing. As we all known, it is easy to establish a normal distribution for a group of data (e.g., ft or KIC values) with a specified reliability if a group of samples without defects or cracks are tested. But such a practical application soon becomes impractical for a wide crack range from the ft-controlled fracture over non-LEFM to finally the KIC-controlled fracture. The non-LEFM model in Equation (3) removes the need of curve fitting for fracture measurements data, and considers the scatters of mechanical properties ft and KIC through the upper and lower bounds with 96% reliability.
In the model, the microstructure characteristic G of ceramic is explicitly linked to both ft and KIC. In the present study, the five ceramics, Sialon, SiC, Si3N4 with G = 3 μm, Si3N4 with G = 4 μm and Al2O3, were considered, and they have hugely different grain size G ranged from 2 to 20 μm. Since a*ch = 0.25(KIC/ft)2, they also have different characteristic crack size a*ch values due to obvious difference in material properties ft and KIC. Most recently, we studied the relative characteristic crack size C = a*ch/G at an interval of 0.25 from 2 to 4.5, and found C ≥ 3.0 [7,10]. Following the conclusion, the present study further found the C = π (or a*ch = π⋅G) is appropriate to consider the effect of microstructure characteristic G on the a*ch value indicating the transition from ft-controlled fracture to KIC-controlled fracture.
Equation (3) can be easily used in either linear relations [σN–η(a, G), σN–Le (a, G)] or nonlinear relations (σN–a) as required. It should be noted that the predicted results (e.g., ft, KIC and σN) with 96% reliability do not change with the different forms of non-LEFM model, which makes the combined use of the proposed model and normal distribution more meaningful and easier in practical applications and data analysis. Furthermore, the σN–η(a, G) and σN–L(a, G) linear relations through the respective origins make the non-LEFM model easier to determine ft and KIC values as the origin is absolutely fixed.
Substituting Equation (1a) into Equation (1b), the mechanical properties ft and KIC can be linked together through the average grain size G and the relative characteristic crack size C = π as shown in Equation (4). In another word, the microstructure characteristic G has direct influence on ft and KIC of ceramic.
To have a better understanding, the σN–η(a, G) linear relations in Figure 5c–Figure 9c were plotted together to show the influnce of microstructure characteristic G on ft value. To make it clearer, three different ceramics with different G are shown in Figure 11a, and two types of Si3N4 ceramic with slightly different G are illustrated in Figure 11b in which only mean lines are given because the experimental points get close each other due to that the two materials are Si3N4 and have similar G values. Obviously, both ft and KIC have been explicitly linked together through the average grain size, in which the fracture toughness KIC is determined from Equation (4) based on the ft value and G value. Grain size G has significant influence on ft and KIC, and can explicitly link the two properties.
In this study, five groups of fracture data on ceramics with average grain size G from 2 to 20 μm have been analyzed. Using the fracture data, it has been proven the proposed non-LEFM model and normal distribution can be combined used to (i) deduce both ft and KIC with a specified reliability from the seeming randomly varied fracture measurement and (ii) probabilistic predict σN of ceramic specimens with and without defects if ft or KIC values (corresponding mean and standard deviation) are available. The predictions including mean and upper and lower bounds can be either linear relation as shown in Figure 5, Figure 6, Figure 7, Figure 8 and Figure 9, or nonlinear relation in Figure 10 as required.
6. Conclusions
A non-LEFM model for ceramic fracture is proposed and combined with normal distribution, which is applicable to predictions of ft, KIC and σN with consideration of their scatters. The relative characteristic crack size C (= a*ch/G) indicating the transition from ft- to KIC- controlled fracture was determined based on the five groups of fracture data on ceramics with different G from 2 to 20 μm reported in the literature and the dominant fracture mechanism of brittle materials. The main conclusions are as follows:
- (1)
- The proposed non-LEFM model combined with normal distribution can be conveniently used either in linear relation to deduce ceramic’s ft and KIC with a specified reliability from seemingly randomly varied fracture data (σN, a) shown in Equation (2), or in nonlinear relation to predict fracture strength σN including upper and lower bounds if ft and KIC ranges are available shown in Equation (2).
- (2)
- From perspectives of mathematics and physics, the relative characteristic crack size C = a*ch/G = π independent of the grain size G is determined based on the fracture measurements.
- (3)
- Basic mechanical properties of ceramic, ft and KIC, have been linked to the microstructure characteristic G and the relative characteristic crack size C = π shown in Equation (2), and ft and KIC are explicitly linked together through the G and C = π in Equation (4).
- (4)
- The upper and lower bounds with 96% reliability for predicting ft, KIC and σN scatters in the present study can provide effective insight to design application, which is beyond the job of the commonly used curve fitting.
Although the quantification is specific to fine-grained ceramics, the proposed non-LEFM model and normal distribution analysed approach can also be applied to other polycrystalline solids such as rock.
Author Contributions
Conceptualization, C.Z.; Methodology, C.Z.; Software, C.Z. and S.Y.; Validation, C.Z. and S.Y.; Formal Analysis, C.Z. and S.Y.; Investigation, C.Z. and S.Y.; Resources, C.Z.; Data Curation, C.Z. and S.Y.; Writing-Original Draft Preparation, C.Z.; Writing-Review & Editing, C.Z.; Visualization, C.Z.; Supervision, C.Z.; Project Administration, C.Z.; Funding Acquisition, C.Z.
Funding
This work was supported by the National Natural Science Foundation of China (No. 11672048 and 51405029), Shaanxi Province (No. 2017KJXX-11 and 2016JQ5020), and Chang’an University (No. 310825153510).
Conflicts of Interest
The authors declare no conflict of interest.
References
- Rios, J.D.; Cifuentes, H.; Yu, R.C.; Ruiz, G. Probabilistic flexural fatigue in plain and fiber-reinforced concrete. Materials 2017, 10, 767. [Google Scholar] [CrossRef] [PubMed]
- Lu, C.S.; Danzer, R.; Fischer, F.D. Fracture statistics of brittle materials: Weibull or normal distribution. Phys. Rev. E 2002, 65, 1–4. [Google Scholar] [CrossRef] [PubMed]
- Study on Statistical Characteristic of Strength of Steel Plate Used for Penstocks of Hydropower Stations. Available online: https://www.ndt.net/article/wcndt00/papers/idn444/idn444.htm (accessed on 7 February 2019).
- Li, Y.; Zhou, M. Prediction of fracture toughness scatter of composite materials. Comp. Mater. Sci. 2016, 116, 44–51. [Google Scholar] [CrossRef]
- Singh, R.N.; Routbort, J.L. Fracture and cracking healing in (U, Pu) C. J. Am. Ceram. Soc. 1979, 62, 128–133. [Google Scholar] [CrossRef]
- Chantikul, P.; Bennison, S.J.; Lawn, B.R. Role of grain size in the strength and R-curve properties of alumina. J. Am. Ceram. Soc. 1990, 73, 2419–2427. [Google Scholar] [CrossRef]
- Zhang, C.G.; Hu, X.; Sercombe, T.; Li, Q.B.; Wu, Z.M.; Lu, P.M. Prediction of ceramic fracture with normal distribution pertinent to grain size. Acta Mater. 2018, 145, 41–48. [Google Scholar] [CrossRef]
- Zhang, Z.X. An empirical relation between mode I fracture toughness and the tensile strength of rock. Int. J. Rock Mech. Min. Sci. 2002, 39, 401–406. [Google Scholar] [CrossRef]
- Zhang, Z.X.; Kou, S.Q.; Lindqvist, P.A.; Yu, Y. The relationship between the fracture toughness and tensile strength of rock. In Strength Theories: Applications, Development & Prospects for 21st Century; Science Press: Beijing, China; New York, NY, USA, 1998; pp. 215–219. [Google Scholar]
- Zhang, C.G.; Hu, X.; Wu, Z.M.; Li, Q.B. Influence of grain size on granite strength and toughness with reliability specified by normal distribution. Theor. Appl. Fract. Mech. 2018, 96, 534–544. [Google Scholar] [CrossRef]
- Liu, Y.J.; Li, S.J.; Wang, H.L.; Hou, W.T.; Hao, Y.L.; Yang, R.; Sercombe, T.B.; Zhang, L.C. Microstructure, defects and mechanical behaviour of beta-type titanium porous structures manufactured by electron beam melting and selective laser melting. Acta Mater. 2016, 113, 56–67. [Google Scholar] [CrossRef]
- Hillerborg, A.; Modeer, M.; Petersson, P.E. Analysis of crack formation and crack growth in concrete by means of fracture mechanics and finite elements. Cem. Concr. Res. 1976, 6, 773–782. [Google Scholar] [CrossRef]
- Hillerborg, A. Analysis of one single crack. In Fracture Mechanics of Concrete; Wittmann, F.H., Ed.; Elsevier Science Publishers: Amsterdam, The Netherlands, 1983; pp. 223–249. [Google Scholar]
- Taylor, D. Special issue on critical distance theories of fracture. Eng. Fract. Mech. 2008, 75, 1695. [Google Scholar] [CrossRef]
- Taylor, D.; Cornetti, P.; Pugno, N. The fracture mechanics of finite crack extension. Eng. Fract. Mech. 2005, 72, 1021–1038. [Google Scholar] [CrossRef]
- Taylor, D. The theory of critical distances. Eng. Fract. Mech. 2008, 75, 1696–1705. [Google Scholar] [CrossRef]
- Taylor, D. The Theory of Critical Distances: A New Perspective in Fracture Mechanics, 1st ed.; Oxford: London, UK, 2007. [Google Scholar]
- Taylor, D. The thoery of critical distances: A link to micromechanism. Theor. Appl. Fract. Mech. 2017, 90, 228–233. [Google Scholar] [CrossRef]
- Taylor, D. Predicting the fracture strength of ceramic materials using the theory of critical distance. Eng. Fract. Mech. 2004, 71, 2407–2416. [Google Scholar] [CrossRef]
- Reimanis, I.E.; Suematsu, H.; Petrovic, J.J.; Mitchell, T.E. Mechanical properties of single-crystal α-Si3N4. J. Am. Ceram. Soc. 1996, 79, 2065–2073. [Google Scholar] [CrossRef]
- Krishnamurthy, S.; Reimanis, I.E.; Berger, J.; Drexler, E. Fracture toughness measurement of chromium nitride films on brass. J. Am. Ceram. Soc. 2004, 87, 1306–1313. [Google Scholar] [CrossRef]
- Chen, C.R.; Pascual, J.; Fischer, F.D.; Kolednik, O.; Danzer, R. Prediction of the fracture toughness of a ceramic multilayer composite –Modelling and experiments. Acta Mater. 2007, 55, 409–421. [Google Scholar] [CrossRef]
- Kueck, A.M.; Ramasse, Q.M.; De Jonghe, L.C.; Ritchie, R.O. Atomic-scale imaging and the effect of yttrium on the fracture toughness of silicon carbide ceramics. Acta Mater. 2010, 58, 2999–30005. [Google Scholar] [CrossRef]
- Borrero-Lopez, O.; Hoffman, M.; Bendavid, A.; Martin, P.J. The use of the scratch test to measure the fracture strength of brittle thin films. Thin Solid Films 2010, 518, 4911–4917. [Google Scholar] [CrossRef]
- Gao, X.F.; Koval, G.; Chazallon, C. A size and boundary effects model for quasi-brittle fracture. Materials 2016, 9, 1030. [Google Scholar] [CrossRef] [PubMed]
- Liu, Y.; Ramirez, C.; Zhang, L.; Wu, W.W.; Padture, N.P. In situ direct observation of toughening in isotropic nanocomposites of alumina ceramic and multiwall carbon nanotubes. Acta Mater. 2017, 127, 203–210. [Google Scholar] [CrossRef]
- Kimoto, H.; Usami, S.; Miyata, H. Relationship between strength and flaw size in glass and polycrystalline ceramics. Jpn. Soc. Mech. Eng. 1985, 51, 2482–2488. [Google Scholar] [CrossRef]
- Usami, S.; Kimoto, H.; Takahashi, I.; Shida, S. Strength of ceramic materials containing small flaws. Eng. Fract. Mech. 1986, 23, 745–761. [Google Scholar] [CrossRef]
Figure 1.
(a) Schematic diagram showing variation of ft distribution or standard deviation σf with C (= a*ch/G), and σf as a function of C determined by normal distribution for: (b) Sialon, (c) SiC, (d) Si3N4 with G = 3 μm, (e) Si3N4 with G = 4 μm, (f) Al2O3.
Figure 1.
(a) Schematic diagram showing variation of ft distribution or standard deviation σf with C (= a*ch/G), and σf as a function of C determined by normal distribution for: (b) Sialon, (c) SiC, (d) Si3N4 with G = 3 μm, (e) Si3N4 with G = 4 μm, (f) Al2O3.

Figure 2.
(a) Schematic diagram showing the vertical distance of experimental data to the straight line indicating the mean of ft values for a selected C, and the sum of the distances of all points to the straight line as a function of C for: (b) Sialon, (c) SiC, (d) Si3N4 with G = 3 μm, (e) Si3N4 with G = 4 μm, (f) Al2O3.

Figure 3.
(a) Schematic diagram showing variation of KIC distribution or standard deviation σk with C (= a*ch/G), and σk as a function of C determined by normal distribution for: (b) Sialon, (c) SiC, (d) Si3N4 with G = 3 μm, (e) Si3N4 with G = 4 μm, (f) Al2O3.
Figure 3.
(a) Schematic diagram showing variation of KIC distribution or standard deviation σk with C (= a*ch/G), and σk as a function of C determined by normal distribution for: (b) Sialon, (c) SiC, (d) Si3N4 with G = 3 μm, (e) Si3N4 with G = 4 μm, (f) Al2O3.

Figure 4.
(a) Schematic diagram showing variation of the range of (KIC)max–(KIC)min with C (=a*ch/G) for: (b) Sialon, (c) SiC, (d) Si3N4 with G = 3 μm, (e) Si3N4 with G = 4 μm, (f) Al2O3.
Figure 4.
(a) Schematic diagram showing variation of the range of (KIC)max–(KIC)min with C (=a*ch/G) for: (b) Sialon, (c) SiC, (d) Si3N4 with G = 3 μm, (e) Si3N4 with G = 4 μm, (f) Al2O3.

Figure 5.
(a) ft normal distribution and (b) KIC normal distribution evaluated from the same fracture measurements (σN, a) of Sialon. Three predicted straight lines indicating the mean and upper and lower bounds (c) from Equation (3a) and (d) from Equation (3b) using the analysed results listed in (a) and (b) respectively together with the experimental data points.

Figure 6.
(a) ft normal distribution and (b) KIC normal distribution evaluated from the same fracture measurements (σN, a) of SiC. Three predicted straight lines indicating the mean and upper and lower bounds (c) from Equation (3a) and (d) from Equation (3b) using the analysed results listed in (a) and (b) respectively together with the experimental data points.

Figure 7.
(a) ft normal distribution and (b) KIC normal distribution evaluated from the same fracture measurements (σN, a) of Si3N4 with G = 3 μm. Three predicted straight lines indicating the mean and upper and lower bounds (c) from Equation (3a) and (d) from Equation (3b) using the analysed results listed in (a) and (b) respectively together with the experimental data points.
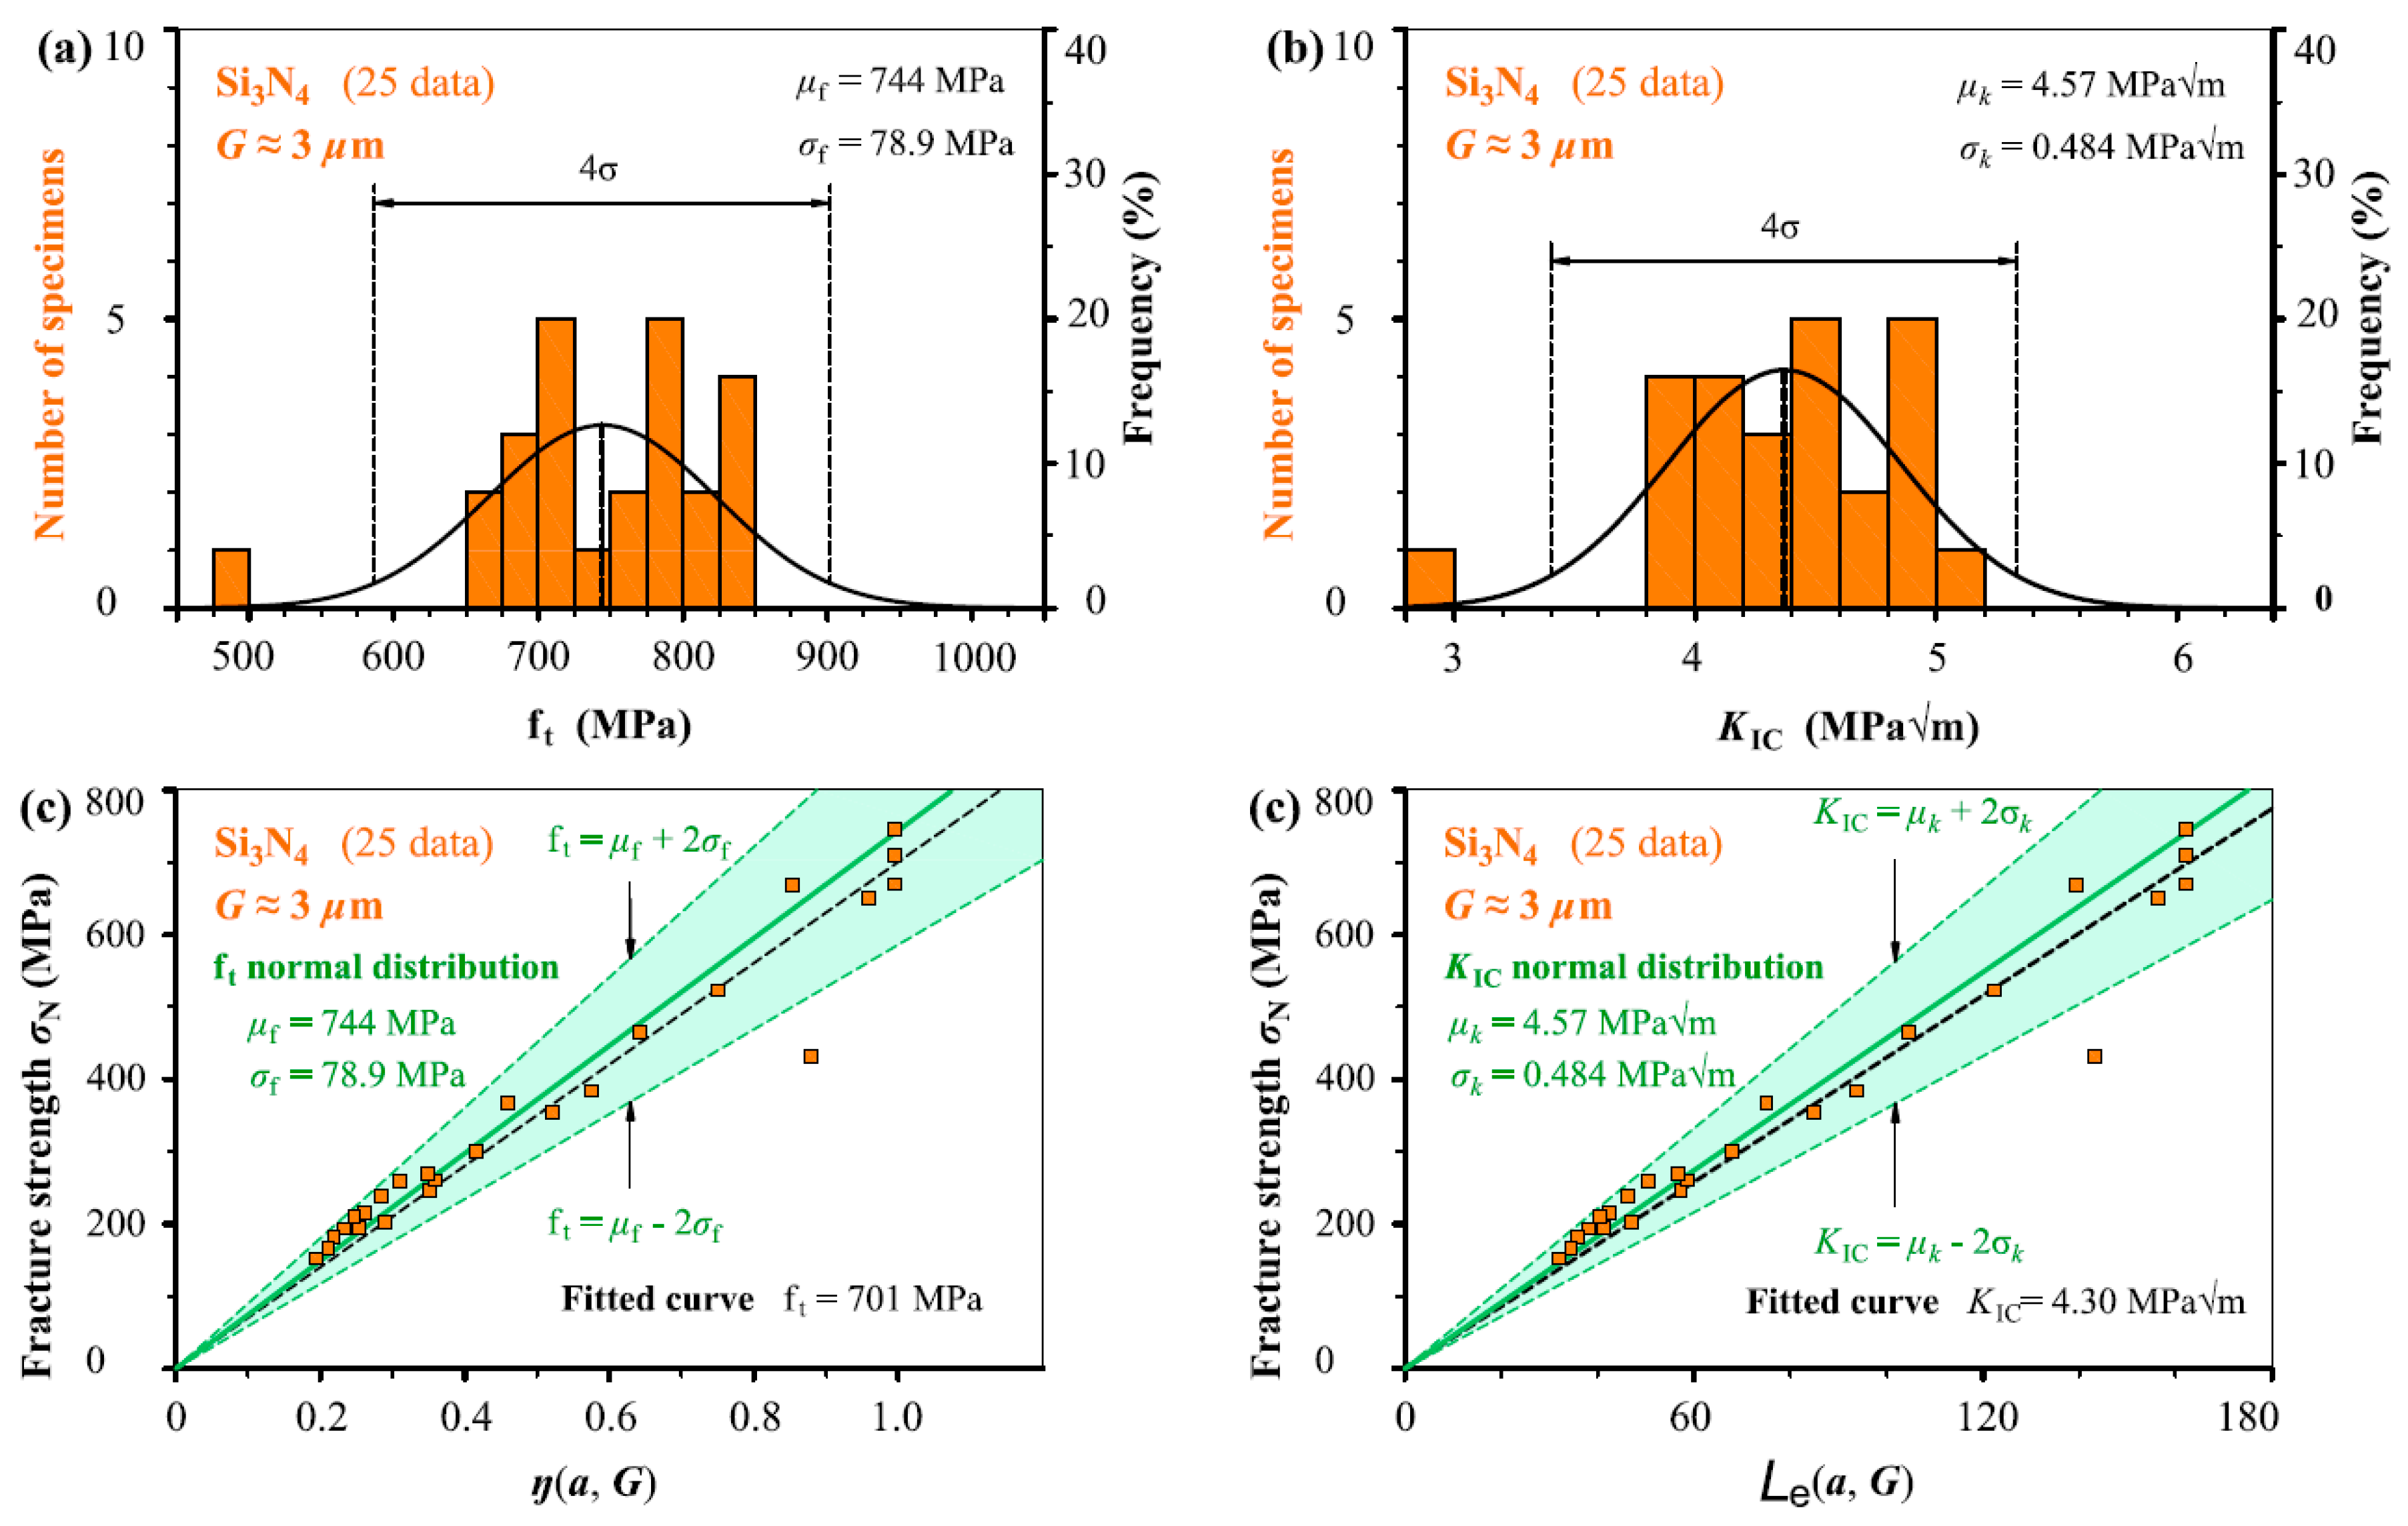
Figure 8.
(a) ft normal distribution and (b) KIC normal distribution evaluated from the same fracture measurements (σN, a) of Si3N4 with G = 4 μm. Three predicted straight lines indicating the mean and upper and lower bounds (c) from Equation (3a) and (d) from Equation (3b) using the analysed results listed in (a) and (b) respectively together with the experimental data points.

Figure 9.
(a) ft normal distribution and (b) KIC normal distribution evaluated from the same fracture measurements (σN, a) of Al2O3. Three predicted straight lines indicating the mean and upper and lower bounds (c) from Equation (3a) and (d) from Equation (3b) using the analysed results listed in (a) and (b) respectively together with the experimental data points.

Figure 10.
Fracture predictions using Equation (3a) with the μf and σf values from ft normal distribution, including mean and upper and lower bounds with 96% reliability together with the experimental data points (σN, a) and fitted curve for: (a) Sialon, (b) SiC, (c) Si3N4 with G = 3 μm, (d) Si3N4 with G = 4 μm, and (e) Al2O3.

Figure 11.
Comparison of different ceramic fracture indicating the G influnce on ft and KIC: (a) Sialon, SiC and Al2O3, (b) Si3N4 with G = 3 μm and G = 4 μm.
Figure 11.
Comparison of different ceramic fracture indicating the G influnce on ft and KIC: (a) Sialon, SiC and Al2O3, (b) Si3N4 with G = 3 μm and G = 4 μm.

© 2019 by the authors. Licensee MDPI, Basel, Switzerland. This article is an open access article distributed under the terms and conditions of the Creative Commons Attribution (CC BY) license (http://creativecommons.org/licenses/by/4.0/).
Share and Cite
MDPI and ACS Style
Zhang, C.; Yang, S. Probabilistic Prediction of Strength and Fracture Toughness Scatters for Ceramics Using Normal Distribution. Materials 2019, 12, 727. https://doi.org/10.3390/ma12050727
AMA Style
Zhang C, Yang S. Probabilistic Prediction of Strength and Fracture Toughness Scatters for Ceramics Using Normal Distribution. Materials. 2019; 12(5):727. https://doi.org/10.3390/ma12050727
Chicago/Turabian StyleZhang, Chunguo, and Shuangge Yang. 2019. "Probabilistic Prediction of Strength and Fracture Toughness Scatters for Ceramics Using Normal Distribution" Materials 12, no. 5: 727. https://doi.org/10.3390/ma12050727
Note that from the first issue of 2016, this journal uses article numbers instead of page numbers. See further details here.