Article

Optimization of Process Parameters for Anti-Glare Spray Coating by Pressure-Feed Type Automatic Air Spray Gun Using Response Surface Methodology

1
Graduate School of Mechanical and Energy Engineering, Kun Shan University, 71070 Tainan, Taiwan
2
Department of Materials Engineering, Kun Shan University, 71070 Tainan, Taiwan
3
Department of Mechanical and Energy Engineering, Kun Shan University, 71070 Tainan, Taiwan
*
Authors to whom correspondence should be addressed.
Materials 2019, 12(5), 751; https://doi.org/10.3390/ma12050751
Submission received: 31 January 2019 / Revised: 26 February 2019 / Accepted: 27 February 2019 / Published: 5 March 2019
(This article belongs to the Special Issue Selected Papers from IEEE ICICE 2018)

Abstract

:
The process of preparing anti-glare thin films by spray-coating silica sol-gel to soda-lime glass was exclusively and statistically studied in this paper. The effects of sol-gel deliver pressure, air transport pressure, and spray gun displacement speed on the gloss, haze, arithmetic mean surface roughness, and total transmittance light were analyzed. The experimental results indicate that the factors of sol-gel deliver pressure, air transport pressure, and displacement speed exhibit a significant effect on the haze, gloss, and Ra. In contrast, the variation of total transmittance light with these three factors are insignificant. Because the anti-glare property is predominantly determined by low gloss and high haze, we therefore aim to minimize gloss and maximize haze to achieve high anti-glare. Central composite design and response surface methodology are employed to analyze the main and interaction effects of the three factors through quadratic polynomial equations, which are confirmed by the analysis of variance and R2. The response surface methodology predict the lowest gloss and highest haze are 9.2 GU and 57.0%, corresponding to the sol-gel deliver pressure, air-transport pressure, and displacement speed of 250 kPa, 560 kPa, and 140 mm/s, and 340 kPa, 620 kPa, and 20 mm/s, respectively. Comparing the predicted optimal data with the real experimental results validates the applicability of the mathematical model. This study provides an important basis for the subsequent production of anti-glare glass with different specifications to satisfy the market demand.

1. Introduction

Mobile phones have become a necessity for life and attracted more and more attention. In terms of increasing portability, the mobile phones are requested to be lighter, thinner, and better texture. In addition, the requirement of mobile phones for entertainment is increasing day by day. Consequentially, the demand for visual and operational convenience is also relatively increasing, which in turn drives the smartphone technology to be constantly updated and makes the application field more extensive. Anti-glare treatment could reduce the high light intensity and glare caused by excessive concentration of light, thereby improving the user’s comfort for a cover lens. The mechanism of anti-glare is depicted in Figure 1.
At present, surface roughening is the predominant route to prepare anti-glare thin films, and the related methods involve particle blast [1], solution etching [2,3,4], solution spin/dip coating [5,6,7], solution spraying [8,9,10,11,12,13], and imprint [14,15,16,17,18,19,20]. In general, sand, fine metal, and ceramic particles are used to blast the substrate to roughen the surface and create a granulation-like depression. Chen [1] applied glass beads to blast acrylic materials to obtain round holes and atomized surfaces. Anti-glare glass can also be prepared by etching the substrates using chemical solution, such as hydrofluoric acid [2,3,4]. However, this method is not environmentally friendly and is hazardous for health. Haga et al. [5] disclosed an anti-glare film having fine irregularities with an averaged surface roughness of 0.05 to 0.5 μm by spin coating or dip coating using a resin solution containing specific additive particles. Liu et al. [6] fabricated light-scattering particles (LSPs), which were mainly constituted by polystyrene microbeads with amino groups and aliphatic chains, in order to evaluate the effects of the surface functional groups and the nature of the resins on the haze of anti-glare (AG) films. They suggested that the outer haze was mainly affected by the interaction between LSPs and the resins. Cho [7] demonstrated the antireflection coating of SiO2 nanospheres for cover glass by using a spin-coating method. However, this process suffered from an uneven coating of particles and lowered the transmittance of the substrate. Schmidt [8] et al. used a hydrolysis-condensation method and raw materials of tetraethoxysilane (TEOS) and methyl triethoxysilane (MTES) to prepare a sol-gel solution, which was then added with water-soluble tin oxide and sprayed onto a glass substrate. The materials were cured at 500 °C to roughen the surface to form an anti-glare glass. Aegerter et al. [9,10] sprayed (3-Glycidyloxypropyl) trimethoxysilane (GPTMS) or 3-(Mercaptopropyl) trimethoxysilane (MPTMS) sol-gel solution with an additive of indium tin oxide to plastic substrates of polymethyl methacrylate and polycarbonate to form an anti-glare and anti-static plastic substrate after curing at 130 °C under irradiation of ultra-violet. However, the substrate’s surface was too rough owing to the presence of metallic compounds. Yeh [11] sprayed a resin-based sol-gel solution on a pre-treated hard coating PMMA sheet to form an anti-glare layer. Additionally, Tri Rakhmawati [12] sprayed spherical silica powder onto a glass substrate to act as a light scattering layer. However, this powder tended to aggregate with each other due to high surface energy, causing poor dispersion efficiency. Ma et al. [13] modified the surface of silica nano-particles with cationic surfactant cetyltrimethylammonium bromide (CTAB) to improve surface aggregation phenomenon. Whitesides et al. [14,15] proposed a micro-contact transfer film process using the self-assembly monolayer to transfer the pattern onto the mold to the substrate.
Chou et al. [16] proposed nanoimprint lithography by using the method of changing temperature and pressure to develop “hot embossing”. However, the hot-pressed nano-transfer process possessed a great disadvantage that the mold had a thermal expansion problem in the state of high temperature and high pressure, which caused a dimensional error in subsequent pattern transfer. The thermal deformation of the structure was more serious under a higher pressure. Later, Bailey et al. [17] improved the procedures of hot pressing to retard thermal deformation, but it was not appropriate for a large area.
Although coating techniques and sol-gel synthesis have advanced considerably [18,19], there are still some technical challenges in the uniformity of nanoparticle distribution on substrates. It has been over 30 years since the introduction of a spray-coating process with the sol-gel particles; however, until now, the optimization conditions of these processes to produce anti-glare thin films are still far from clear because they are affected by many variables and their interactions [20]. Therefore, appropriate instruments and their optimization are essential to improve the performance of the spraying system with silica sol-gel solution without additives. Hence, this study will adopt central composite design and response surface methodology (RSM) to explore the regulation of anti-glare sol-gel spray parameters and their optimization. An empirical regression equation is also obtained to describe the quantitative effects of the operating parameters on the anti-glare.

2. Materials and Methods

2.1. Materials

High purity tetraethoxysilane (TEOS) and methyltrimethoxysilane (MTMS) were purchased from Evonik (Evonik, Hanau-Wolfgang, Germany). Nitric acid (EP) was purchased from Union Chemical Works (Union Chemical Works Ltd., Hsin-Chu, Taiwan). Methanol were all of 99.9% purity and obtained from Shiny Chemical Industry Co. (Kaohsiung, Taiwan). Purified Water (>18 MΩcm) was used in this study.

2.2. Fabrication of Anti-Glare Sol-Gel

The anti-glare sol-gel formulation was as described by Huang et al. [21] and modified as follows: the desired amounts of TEOS, MTMS, methanol, purified water and nitric acid were added into a 1 L glass container and then magnetically agitated for 24 h at 25 °C. Then, the sol-gel solution was aged at 4 °C for 4 days. The molar ratio of TEOS: MTMS: methanol: HNO3: H2O was 1: 0.39: 8.39: 0.02: 5.17.

2.3. Preparation of Anti-Glare Film Layer

The glass substrates with diameter of 100 × 100 mm and thickness of 3 mm were ultrasonically cleaned at 50 °C for 30 min and then baked at 80 °C for 1 h. The prepared silica sol-gel samples were deposited onto the cleaned substrates through an automated spray coating system, which was schematically shown in Figure 2. The operating variables of sol-gel deliver pressure, air transport pressure, and the spray gun displacement speed were investigated during the sol-gel deposition under one-pass spray operation conditions. The obtained silica anti-glare film/glass samples were heated at 180 °C for 1 h. In this work, the Auto-spray gun (S-710AD) was purchased from Guan Piin Painting Technology Co., Ltd. (Taiwan). This equipment provides the regulation of sol-gel deliver pressure, air transport pressure, and spray gun displacement speed to spray sol-gel materials on the substrates. Although the distance between the spray gun and substrates can be adjusted, however, for the simplicity of operation, this distance was kept constant in this study. The environmental temperature and humidity were well controlled at 25 °C and 40%, respectively.

2.4. Characterization

The morphologies of the anti-glare thin films were observed using the digit microscope (UPG670, UPMOST technology corp., Taipei, Taiwan). The surface anti-glare property (gloss and haze) of the thin films was measured by the BYK micro-TRI-gloss device (BYK Additives and Instruments Company, Bavarian, Germany), and WGT-S haze meter (Lab-think Instruments Company, Jinan, China). The total transmittance light (TTL) was measured using the HMT MFS-630 angle-adjustable optical measurement analyzer (Hong-Ming Technology Company, New Taipei, Taiwan). Finally, the arithmetical mean deviation of the surface roughness profile (Ra) was measured using the Surface Roughness Tester (TR-200, SAIBORUIXIN, Beijing, China).

2.5. Statistical Response Surface Methodology Analysis and Experimental Design

A classical approach for optimization is to be carried out by changing one variable at a time on an experimental response while keeping other variables unchanged, i.e., one-variable-at-a-time. However, this procedure requires a lot of experimental work. The most serious disadvantage is that it cannot clarify the interactive effect among the independent variables. On the contrary, experimental design is a strategy to conduct the experiments that can change multiple variables at a time and can significantly reduce the test numbers and study time. The experimental design of a simplex with a center point is often used for a linear model [22], while this model cannot present curvature. Three-level factorial, central composite, Box–Behnken, and Doehlert designs can be included in the second or third order models [22,23,24]. The Box–Behnken design includes the midpoint of the edge of the variable space of at least three factors. A central composite design (CCD) is composed of a factor or partial factor design that includes a center point and is augmented with a set of star points that can be used to estimate the bend. The CCD has been considered as one of the most commonly used experimental designs for response surface methodology [22,23,24,25,26,27].
The RSM comprises mathematical and statistical techniques to establish an empirical polynomial equation to correlate the relationship between independent and dependent variables. Following the RSM procedure, the main and interactive effects of the independent variables on the response can be determined according to the coefficients of the corresponding terms in the polynomials. In general, the objective of the RSM is to optimize the process variables to maximize the performance of a system. Bezerra et al. [23] mentioned that the predominant steps for optimization by RSM consist of (1) selection of independent variables, (2) selection of the experimental design method and execution of the experiment, (3) mathematical-statistical processing of experimental data based on polynomial equations, (4) evaluation of the model’s fitness, (5) exploration of the procedure and possibility of optimization, and (6) achievement of the optimum values of the factors. A complete second order polynomial for 3 independent variables is shown in Equation (1):
Y = a 0 + a 1 X 1 + a 2 X 2 + a 3 X 3 + a 12 X 1 X 2 + a 13 X 1 X 3 + a 23 X 2 X 3 + a 11 X 1 2 + a 22 X 2 2 + a 33 X 3 2 ,
where Y represents the dependent variable; X1, X2 and X3 represent the independent variables; a0 represents the regression coefficient at the center point; a1, a2 and a3 represent the linear coefficients; a12, a13 and a23 represent the second order interaction coefficients; and a11, a22 and a33 represent the quadratic coefficients. The verified polynomial equation can then be transferred to three-dimensional response surface plots, which may be in favor of indicating the approaching direction of the variables toward the optimal condition. The regression analysis of the relevant experimental data and response plotting were performed using the “Statistica” (StaSoft Inc., Oklahoma, USA) and “Design-Expert 7.0” (STAT-EASE Inc., Minneapolis, USA) statistical suite software. The coefficients of the polynomial equation can be estimated by regressing the experimental data for a specific model after justification by ANOVA. A higher F-value illustrates that more of the variance is likely to be defined by the model and a small one indicates that the variance is mainly attributed to noise. The p-value of the ANOVA being less than 0.05 is the basic criterion for judging the significance of the corresponding term in the polynomial equation. The R2 value can be used to determine the fitting quality of the proposed model. In addition, the adjusted and predicted R2 were also calculated to determine goodness-of-fit of the model without disturbance increased by sample size, and how well a regression model makes predictions, respectively [26,27].

3. Results and Discussion

3.1. Evaluation of the Most Substantial Factors Affecting Anti-Glare

The independent variables of sol-gel deliver pressure, air transport pressure, and spray gun displacement speed are supposed to exhibit significant influences on the property of anti-glare. Therefore, these variables were systematically studied using the traditional method by varying one factor at a time and keeping other variables unchanged. The experimental data are summarized in Table 1.
Figure 3a exhibits the effect of sol-gel deliver pressure on TTL and haze, and Figure 3b displays the trends of gloss and Ra. The TTL slowly increases from 91.2 to 92.8 % as the sol-gel pressure increases from 60 to 210 kPa; meanwhile, a sharp increase of the haze from 2.8 to 28.0% is observed. Both the TTL and haze reach the plateau values as the sol-gel deliver pressure increases to 210 kPa, and then they decrease with further increasing in sol-gel deliver pressure. In contrast, the gloss initially decreases with increasing of sol-gel pressure until 210 kPa; after that, it increases as the sol-gel deliver pressure further increases. On the other hand, the Ra value increases with increasing sol-gel pressure ranging from 60 to 600 kPa. Increasing sol-gel pressure implies the increment of the deposited thickness of the thin film, which is beneficial to reducing gloss and boost haze and TTL.
The microstructure of anti-glare film is characterized by digital microscope and is shown in Figure 4. It can be seen from the micrograph of 185 times magnification (90° and 25°) that increasing sol-gel pressure results in a coarser surface and larger particle size of the anti-glare thin film, which in turn enhances its scattering effect. In addition, based on the previous research, the deposited sol-gel particles can form a low-refractive SiO2 thin film layer, improving the transmittance when the film thickness increases [21].
However, excess sol-gel pressure may cause the film thickness exceeding the optimum one and generate a thick, smooth, and transparent structure, hindering the anti-glare efficiency. Furthermore, the thin film layers may grow too thick and cause the formation of cracking (Figure 4e,j); as a result, the gloss value will increase, and both the haze and transmittance lower accordingly. Figure 5a,b show the effects of air transport pressure on gloss, haze, TTL, and Ra with the sol-gel deliver pressure and displacement speed are kept at 120 kPa and 300 mm/s, respectively. The results indicate that increasing air transport pressure causes decrement of gloss and Ra, and increment of haze and TTL. The microstructure of the anti-glare film is studied by digital microscope and is shown in Figure 6. Increasing the air transport pressure can produce smaller particles to construct the anti-glare films due to the intensification of atomization.
These tiny particles are favorable of generating anti-glare property and reducing surface roughness. Figure 7a,b demonstrate the effect of the spray gun displacement speed on gloss, haze, TTL, and Ra while the sol-gel and air transport pressures are kept at 120 kPa and 300 kPa, respectively. The experimental results exhibit that increasing spray gun displacement speed results in a significant increment of gloss and decrease of haze, while the Ra and TTL lower insignificantly with the increase of displacement speed within 170 and 500 mm/s.
Figure 8 explores the microstructures of the anti-glare thin films varied with the displacement speeds. It can be seen from the micrograph of 185 times magnification (90° and 25°) that many voids occur and the particle distribution is bumpy. Therefore, the development of anti-glare property with increasing of displacement speed is irrelevant.
Accordingly, the aforementioned single-variable study clearly confirms that these three operating parameters will exert a significant effect on the anti-glare property of the thin film. Therefore, a statistically experimental design based on the CCD and RSM will be conducted to find out the optimum operating condition for maximizing anti-glare.

3.2. Statistical Analysis

Although all the responses of gloss, haze, TTL, and Ra are present in Section 3.1; however, at present, gloss and haze are the predominantly evaluated items for anti-glare in industry. Hence, we attempt to optimize the response gloss (Y1) and haze (Y2) of the anti-glare thin films from the independent variables of the sol-gel deliver pressure (X1), air transport pressure (X2), and spray gun displacement speed (X3).
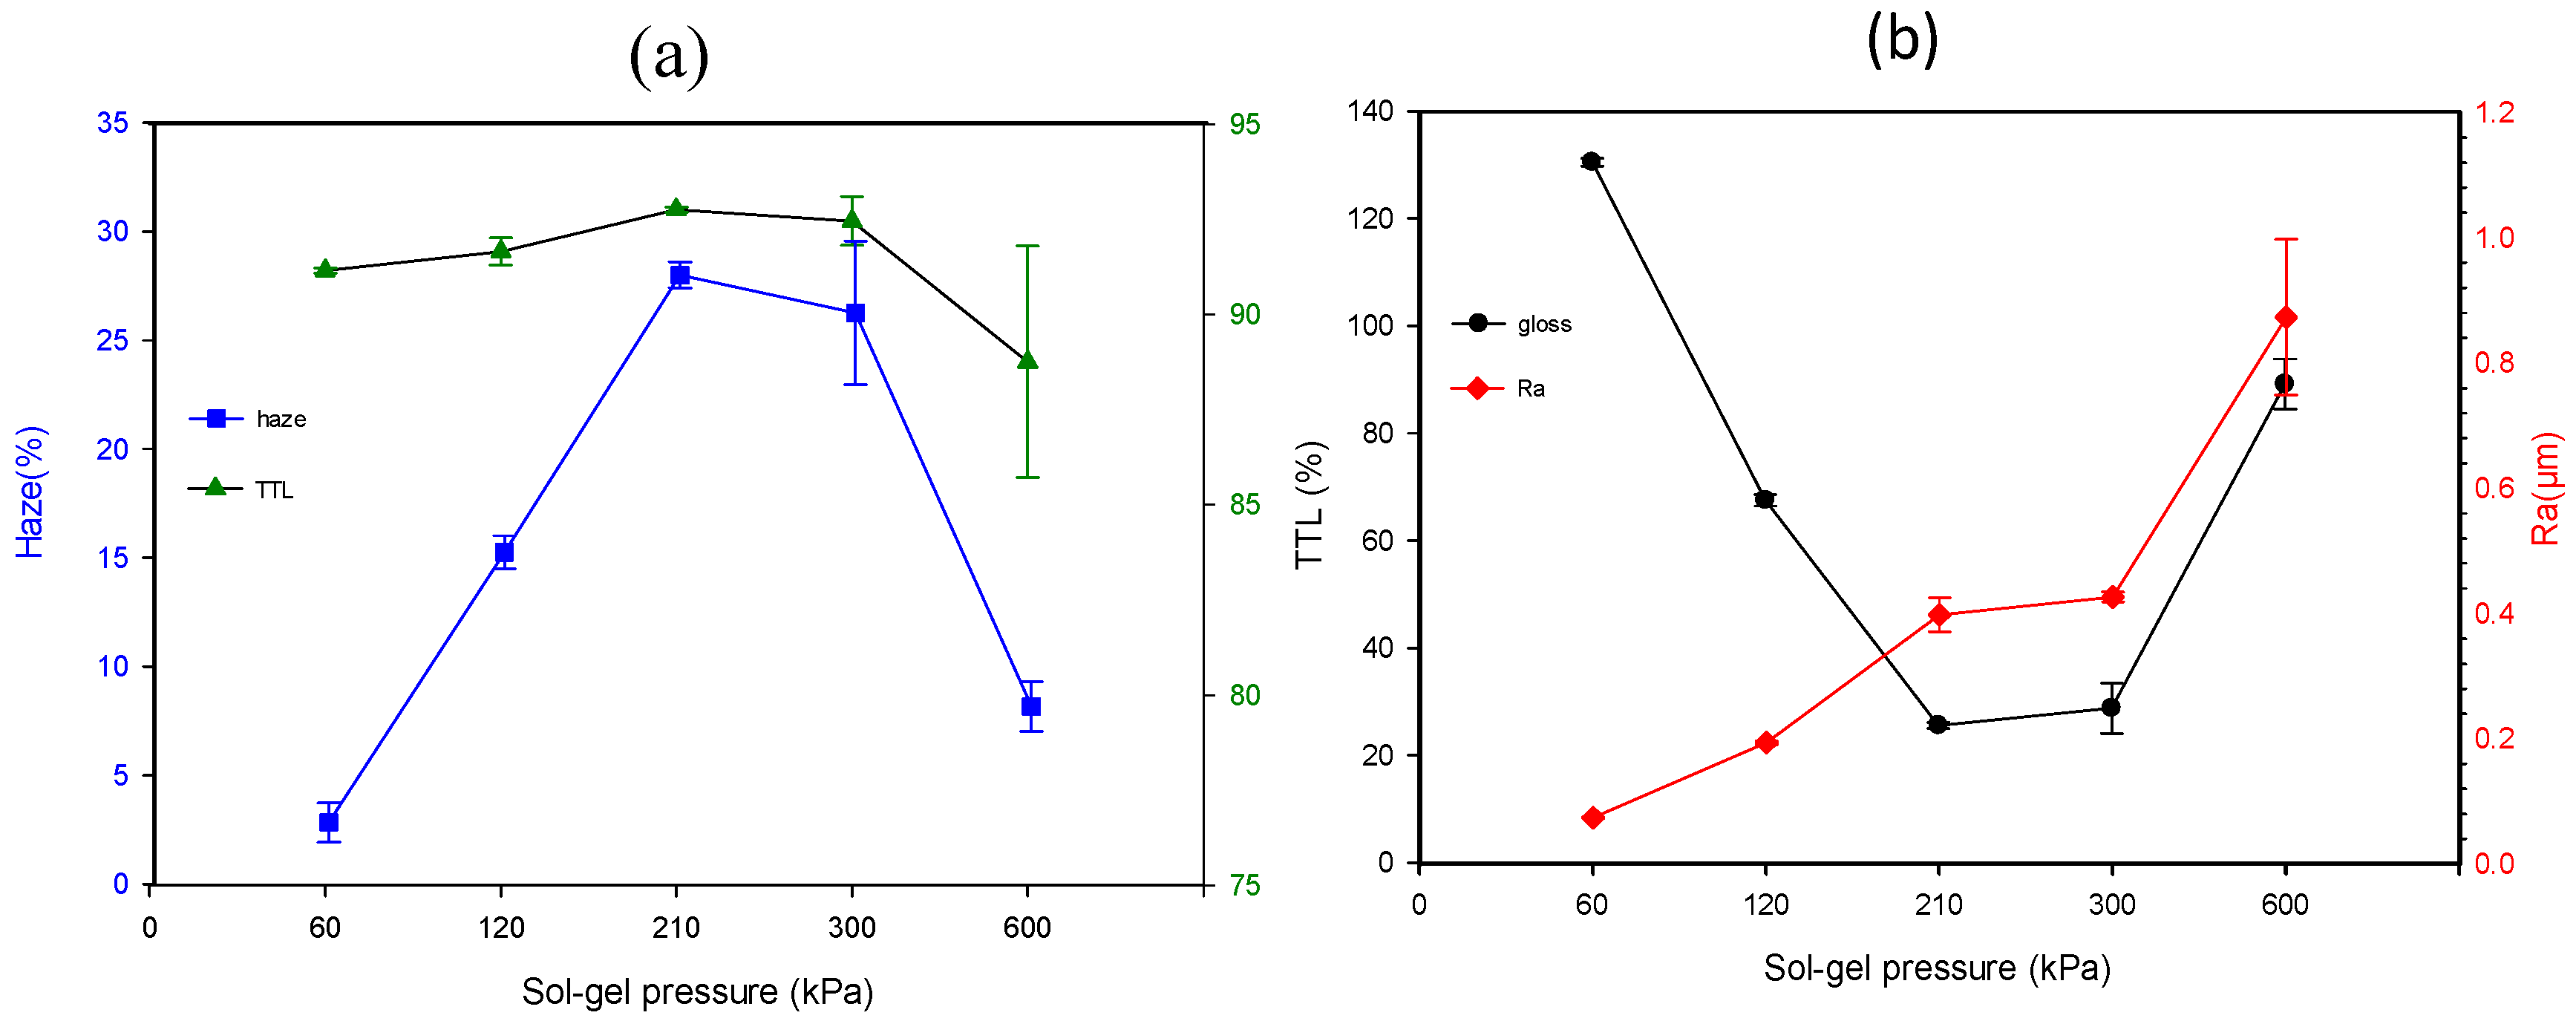
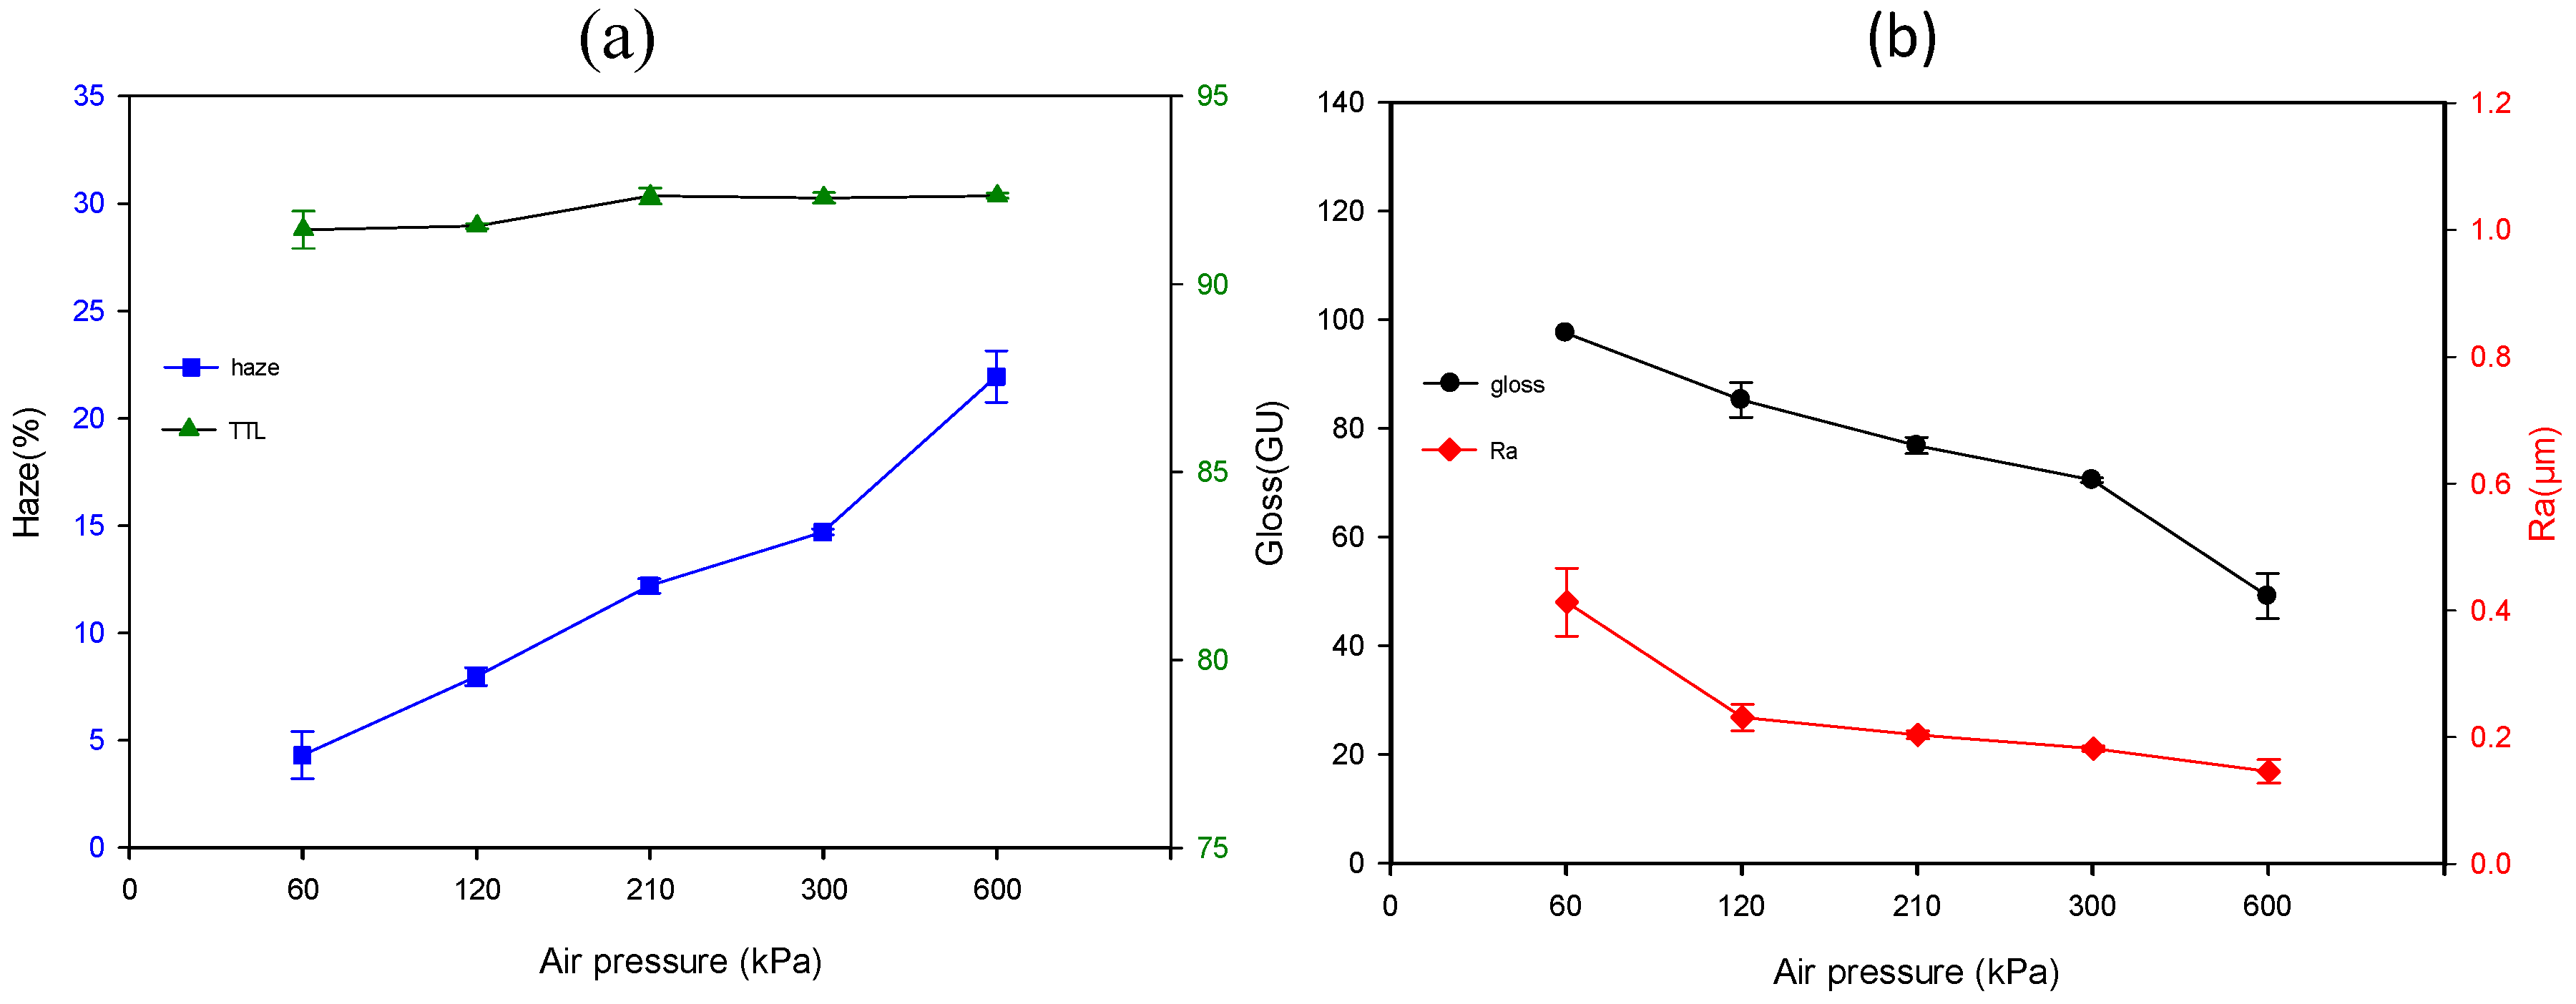
Due to the occurrence of critical values of gloss and haze with the factor of sol-gel deliver pressure as shown in Figure 3, a two-level experimental design is not suitable in this system. Hence, a CCD is applied to collect the experimental data in terms of the possible application of a quadratic or a cubic model in this work. Each factor is examined at five levels, coded −1.68, −1, 0, 1 and 1.68. The experimental domains and the levels of the variables investigated are shown in Table 2. The coded values are obtained according to equation (2), where χ i , χ i , and Δ χ i represent coded value, real value, and step change of the independent variable i , respectively:
χ i = ( χ i χ 0 ) Δ χ i
According to the three-factor CCD, a 16-treatment combination with two repetitive runs at the central point for estimation of the pure error are employed. Table 3 summarizes the experimental results of this CCD. Following the multi-regression technique, ANOVA, and other statistical tests, the proper mathematical mode can be established to disclose the interaction effects between the operation factors, and predict the optimum responses and their corresponding independent variables.

3.2.1. Results of Gloss (Y1) Analysis

The sequential model sum of squares (SMSS) and degree of freedom of the linear, quadratic, 2FI (2-factor interaction), and cubic models are shown in Table 4. The linear model includes SMSS from sol-gel deliver pressure (X1), air transport pressure (X2), and displacement speed (X3). The 2FI model is made up of the X1X2, X1X3, and X2X3, while the items of X12, X22, and X32 constitute the quadratic model. The statistical results of Table 4 indicate that incorporating the cubic term cause the model to be aliased. Hence, the full second-order polynomial is established to regress the experimental data. In general, the lower the gloss, the better the anti-glare. Hence, we aim to obtain the experimental conditions of X1, X2, and X3 to reveal minimal gloss value. If the coefficient of an item in the polynomial equation is negative, it means a positive contribution to the anti-glare property. Following the regression techniques, the regression model is expressed in Equation (3). The ANOVA of Equation (3) is summarized in Table 5. The F-value of the model reaches 33.8 with a p-value of 0.0002, indicating the significance of this regressed model. To check the validity of the regression model, the F-value of the lack of fit is calculated as 52.5 with a p-value larger than 0.05, indicating that the lack of fit is insignificant relative to pure error. The R2 is calculated as 0.98, and very close to 1 to justify the adequacy of the regressed model and indicates the experimental data are reasonably consistent with the regressed results. In addition, the predicted R2 of 0.84 is in reasonable agreement with the adjusted R2 of 0.95. These results also support the adequacy of the regression model. Table 5 also presents the estimates of coefficients of the polynomial equation, standard errors, and 95% confidence interval (CI) of low and high values.
Y1 = 25.611 + 9.075X1 − 12.497X2 + 6.648X3 − 7.913X1X2 + 2.213X1X3 + 1.688 X2X3 + 8.338X12 + 7.913X22 + 1.602X32.
The ANOVA exhibits that the three linear terms of X1, X2, and X3 display significant impact on the gloss because their p-values are all less than 0.05, among which the most significant factor is air transport pressure (X2) owing to the highest F-value and the lowest p-value.
This is because the atomized particles become smaller and scatter more light to reduce the gloss as the air transport pressure increases. In addition, the regression model also implies that decreasing sol-gel deliver pressure (X1) and displacement speed (X3) can reduce gloss and improve anti-glare property. Reducing sol-gel deliver pressure leads to a small quantity of sol-gel particles being deposited, so that the displacement speed should be slowed down to increase the coverage and uniform distribution of the atomized particles.
In the quadratic terms, X12 and X22 also reach significant level (p-value < 0.05). With regard to the cross-terms, only the interaction effect of X1X2 reaches a significant level, which implies that the sol-gel deliver pressure (X1) and air transport pressure (X2) will affect each other and reduce the gloss value. On the contrary, the remaining cross-terms of X1X3 and X2X3 are both below the significant level. The significance of X1X2 can be realized as follows: if the quantity of the sol-gel deliver pressure is large and the air transport is insufficient, then the sol-gel particles cannot be effectively atomized, causing the formation of a thick transparent film. On the other hand, when the sol-gel deliver pressure is small and the air transport pressure is large, finer atomized particles can be expected, but they cannot effectively cover and uniformly distribute on the glass substrate. According to the ANOVA, the p-values of the X1X3, X2X3, and X32 are larger than 0.1, indicating the insignificance of these terms. Therefore, these terms can be omitted from Equation (3), and the regression equation can be simplified to Equation (4):
Y1 = 28.131 + 9.075X1 − 12.497X2 + 6.648X3 − 7.913X1X2 + 7.663X12 + 7.239X22.
This second order regression equation is used to quantitatively describe the relationship between the gloss value and spray-operating parameters. The response surface and contour maps are depicted in Figure 9. According to Equation (4), the optimal (X1, X2, X3) and gloss value are predicted as (250 kPa, 560 kPa, 140 mm/s) and 9.2 GU, respectively. Furthermore, Figure 9 intuitively shows the effect of sol-gel deliver pressure, air transport pressure, and spray gun displacement speed on the gloss of the thin films.
To verify the adequacy of the mathematical model, the experimental runs at the optimal point were carried out. The averaged response gloss value is 9.3 GU, with a negligible error of 1.1% when compared with the predicted one as shown in Table 6.

3.2.2. Results of Haze (Y2) Analysis

In general, a higher haze implies a better anti-glare peculiarity. Therefore, if the coefficient of each independent variable of the regressive model is positive, it means that it can positively contribute to anti-glare effect. The analysis of SMSS for haze is listed in Table 7. The quadratic model is suggested to be adopted to regress the experimental data because the cubic terms cause the model to be aliased. Following the regression procedure, the regression equation for haze is expressed as Equation (5) using the coded values. Table 8 summarizes the results of ANOVA of the regressed model for haze:
Y2 = 31.436 − 2.736X1 + 5.993X2 − 5.069X3 + 2.775X1X2 − 1.175X1X3 − 1.275X2X3 − 2.443X12 − 3.857X22 − 0.675X32.
The F-value of the model is 17.8 with a corresponding p-value of 0.0011, indicating the significance of this model. The R2, R2adj, and R2pred are 0.964, 0.910, and 0.721. The predicted R2 is in reasonable agreement with the adjusted R2. These results also support the adequacy of the model. In addition, the F-value of the lack of fit is 17.666 (p > 0.05), which indicates that it is not significant and shows the adequacy of the model. From Table 8, the multiple regression and the analysis of ANOVA, it can be seen that the sol-gel deliver pressure (X1), air transport pressure (X2) and displacement speed (X3) all reach significant level (p-value < 0.05) in the linear terms, among which the most significant variable is air transport pressure (X2).
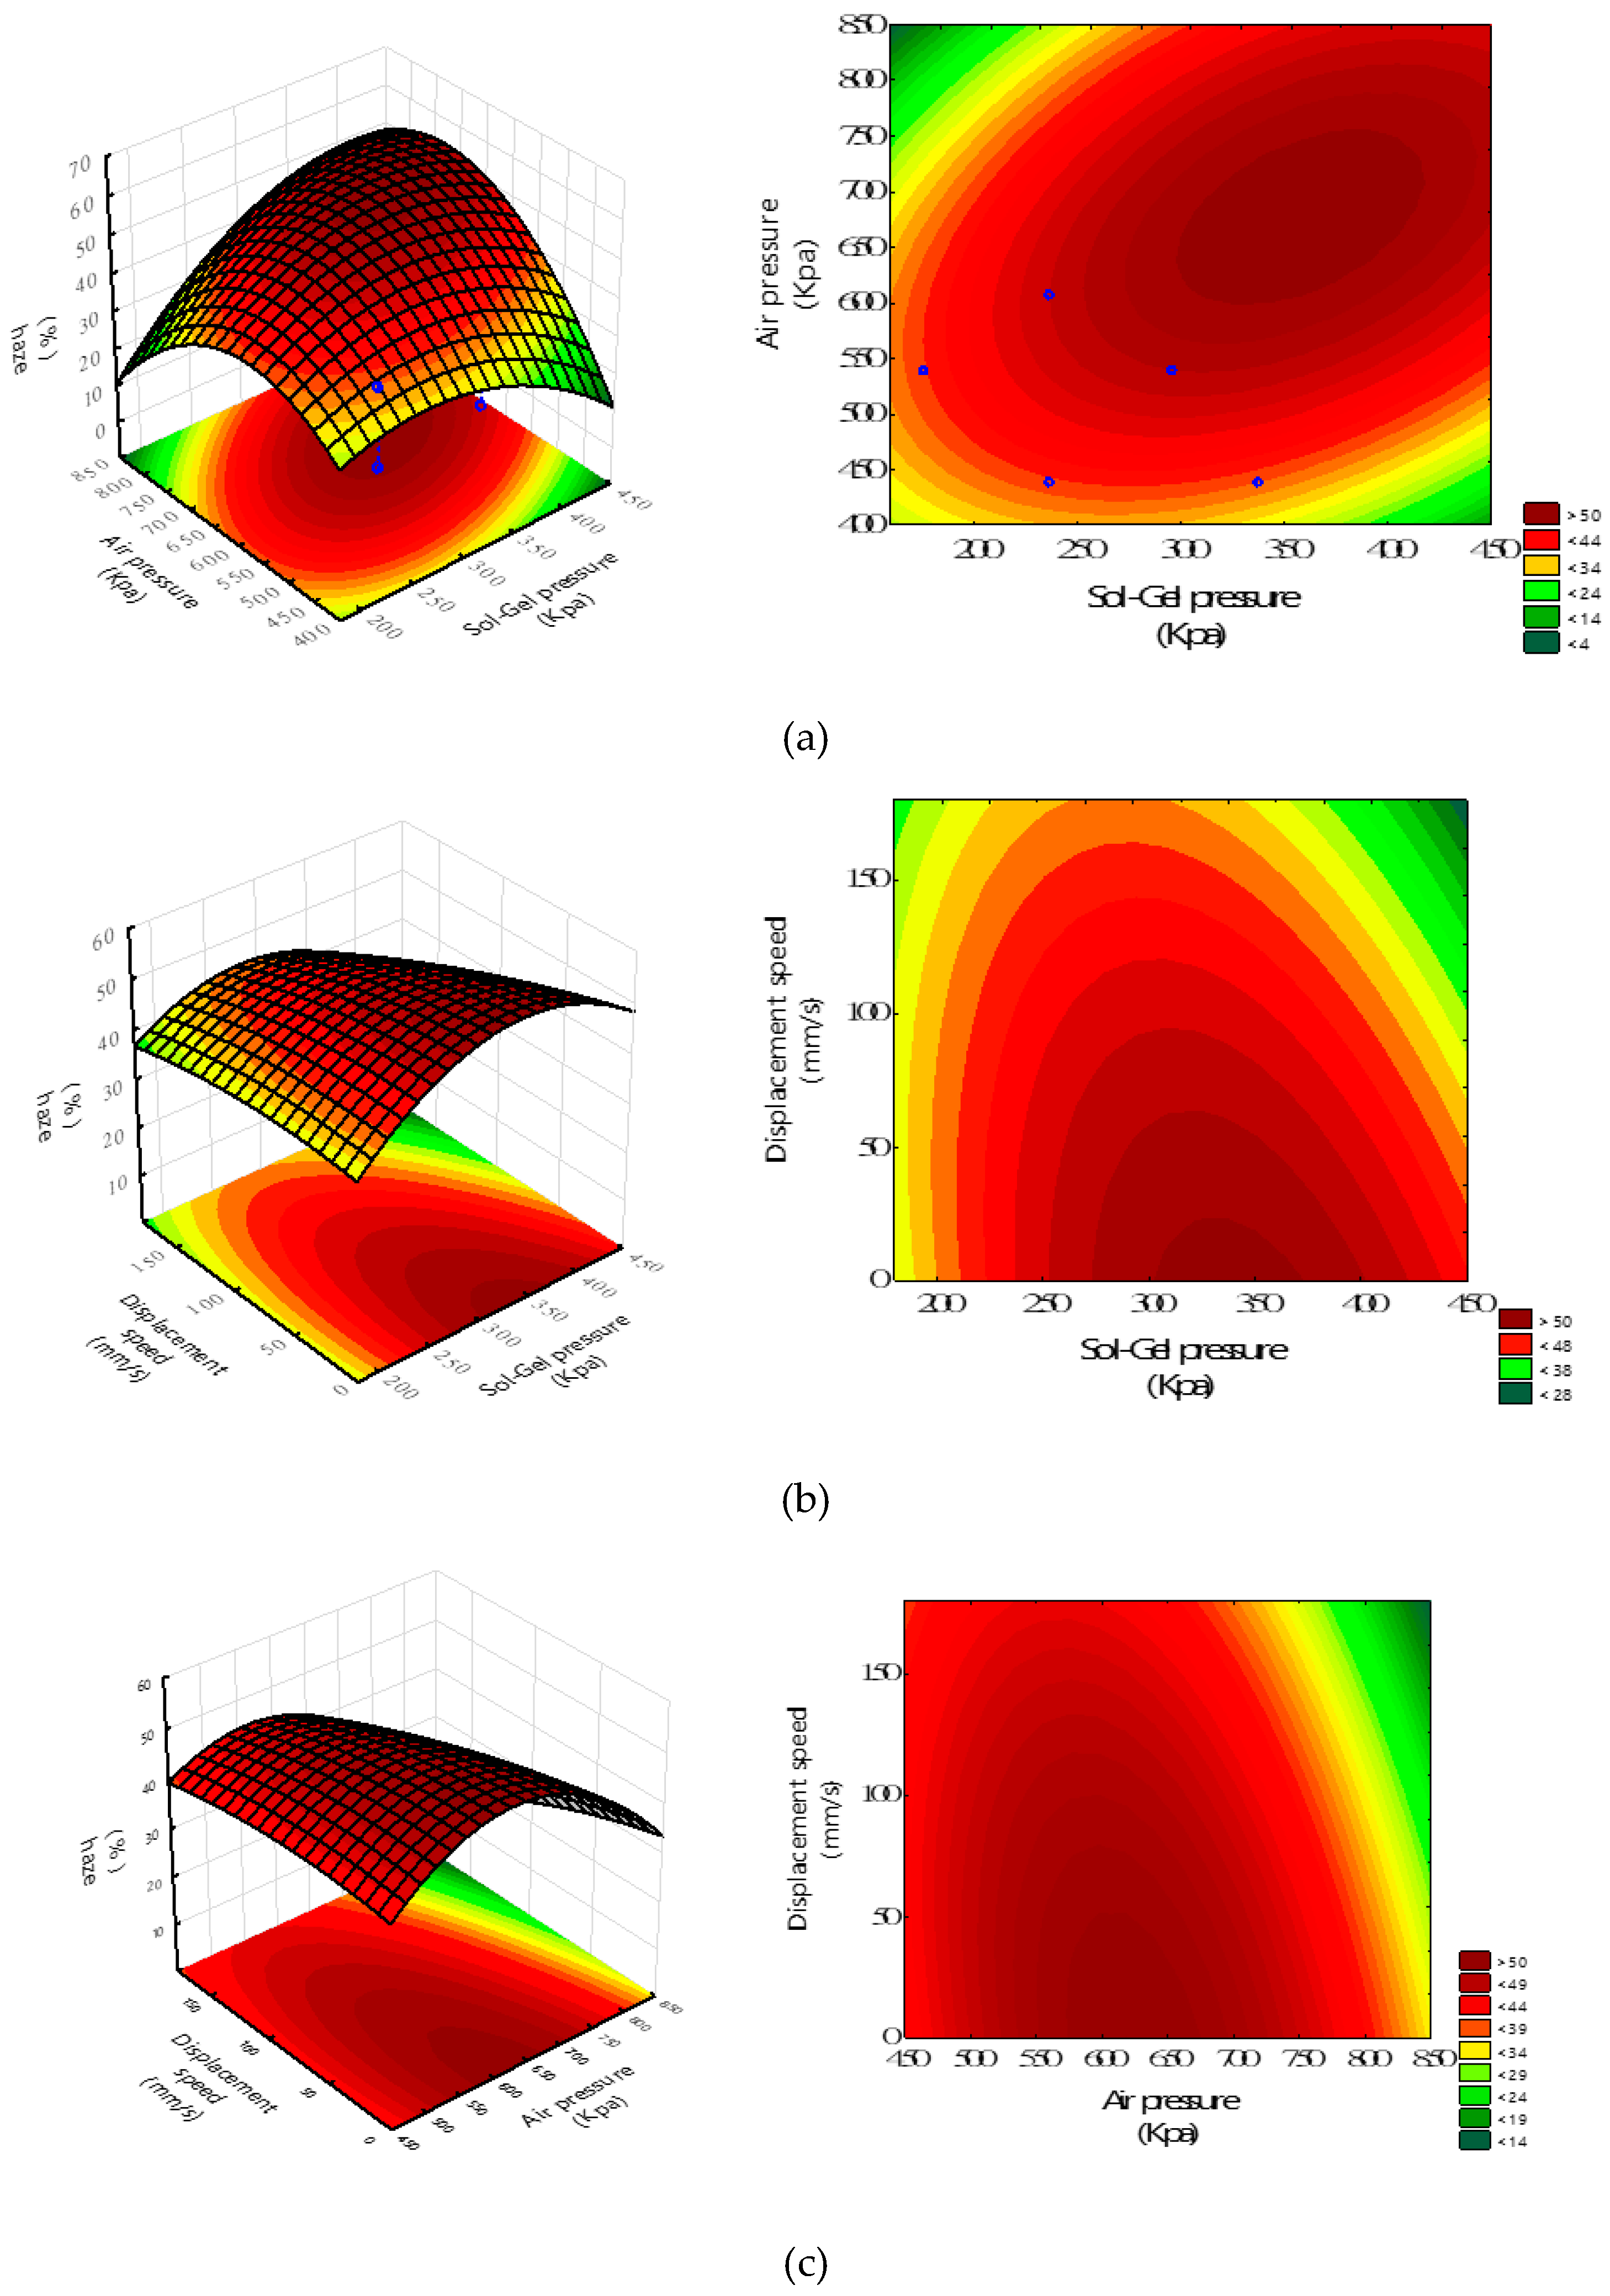
The model also reflects that a slight increase in X2 and a slight decrease in X3 can produce a more remarkable increment in haze than that by a slight reduce in X1 starting from the center point (0,0,0). Under a slow displacement speed, appropriate sol-gel deliver pressure and air transport pressure can effectively atomize the sol-gel particles, and then enhance the surface coverage and uniform distribution of atomized particles on the substrate surface. For the quadratic terms, X1 and X2 also reached a significant level, which means that these two variables have quadratic effects on haze. Because the coefficients of X12 and X22 are negative, the extreme values of the haze with X1 and X2 are supposed to occur. With regard to the cross-terms, only the interaction effect between X1 and X2 reaches a significant level and exhibits a positive coefficient in the regression model for haze, which implies that the X1X2 cross-term will affect each other and increase the haze value. The remaining cross-terms of X1X3 and X2X3 are both below the significant level. Accordingly, the terms of X1X3, X2X3, and X32 can be omitted from Equation (5) and the regression equation can be simplified to Equation (6).
The response surface and contour maps are depicted in Figure 10. Intuitively, Figure 10 shows the effect of sol-gel deliver pressure, air transport pressure, and spray gun displacement speed on the hazes of the anti-glare glass samples. According to Figure 10, the optimal haze is found as 57.0% with X1, X2, X3 of 340 kPa, 620 kPa, the predicted ability of the mathematical model, we have conducted the experiments and 20 mm/s, respectively, by following the optimized procedure. To examine around the optimal point of X1, X2, X3 of 340 kPa, 620 kPa, and 20 mm/s, respectively, the averaged response haze value is 57.7%, which is very close to the theoretically predicted one of 57.0%, with an error of 1.2%. This result confirms the adequacy of the mathematical model. The experimental results are shown in Table 6.
Y2 = 30.374 − 2.736X1 + 5.993X2 − 5.069X3 + 2.775X1X2 − 2.159X12 − 3.573X22.

4. Conclusions

Following the central composite design and response surface methodology technique, we have successfully reduced gloss by 63.7% and increased haze by 106.1% when compared with the traditionally one-factor-at-a-time method, thus greatly improving the anti-glare performance of the spray-coated thin films in this work. The factors of sol-gel deliver (X1) and air transport (X2) pressure, and displacement speed of spray gun (X3) are proved to significantly affect the formation of anti-glare thin films. Increasing sol-gel delivery and air transport pressures, and reducing the displacement speed, are favorable for reducing the gloss and increasing the haze and transmittance, and then enhancing the anti-glare property. The obtained quadratic polynomial equations can reasonably explain the relationships between the dependent variables (gloss and haze) and the independent variables (X1, X2, and X3). The ANOVA analysis indicates that both the gloss and haze are significantly affected by the factors of X1, X2, X3, X1X2, X12, and X22. The main effects of X1 and X2 on anti-glare property are superior to that of X3. The RSM reveals that the optimal points (X1, X2, X3) are around (250 kPa, 560 kPa, 140 mm/s) and (340 kPa, 620 kPa, 20 mm/s) to give the lowest gloss 9.2 GU and the highest haze 57.0%, respectively. These theoretically predicted results are also verified by the real experimental data, confirming the adequacy of the mathematical models.

Author Contributions

Y.-H.H. proposed the research topic, Y.-H.H. and L.-C.C. conceived and designed the experiments. Y.-H.H. performed the experimental work and statistical analysis, and wrote the original draft. L.-C.C. supervised the project, edited the manuscript, and contributed largely to the interpretation of the results. H.-M.C. supervised the research and provided direction.

Funding

This research received no external funding.

Acknowledgments

All sources of funding of the study should be disclosed. Please clearly indicate grants that you have received in support of your research work. Clearly state if you received funds for covering the costs to publish in open access.

Conflicts of Interest

The authors declare no conflict of interest.

References

  1. Chen, C.H. Sand Blasting Microstructure Application in the Light Guide Plate. Master’s Thesis, National Chiao Tung University, Hsinchu, Taiwan, 2007. [Google Scholar]
  2. Glass Materials from Abrisa Technologies. Soda-Lime-Anti-Glare Reducing Etched Glass. Available online: http://datasheets.globalspec.com/ds/1945/AbrisaTechnologies/52E6A8C0-E687-4353-8EE4-74CFA76AA368 (accessed on 5 December 2017).
  3. Wang, J.H. Study on Fabrication of Anti-Glare Glass Using the Chemical Etching Technique. Master’s Thesis, National Chung Hsing University, Taichung, Taiwan, 2014. [Google Scholar]
  4. Chen, H.; Chen, L.; Gong, H.; Hong, L.; Li, C.C. Anti-Glare Substrates with a Uniform Textured Surface and Low Sparkle and Methods of Making the Same. WO Patent 2016069113A1, 5 June 2016. [Google Scholar]
  5. Haga, Y.; Matsumura, S.; Watanabe, H.; Nagahama, T. Anti-Glare Film and Display Device. U.S. Patent 8304055B2, 6 November 2012. [Google Scholar]
  6. Liu, B.T.; Teng, Y.T.; Lee, R.H.; Liaw, W.C.; Hsieh, C.H. Strength of the interactions between light-scattering particles and resins affects the haze of anti-glare films. Colloids Surf. A Physicochem. Eng. Aspects 2011, 389, 138–143. [Google Scholar] [CrossRef]
  7. Cho, J.L. Fabrication of omnidirectional anti-reflection coating with optimal spin-coating of silicon dioxide nanoparticle. Master’s Thesis, Yuan Ze University, Taoyuan City, Taiwan, 2015. [Google Scholar]
  8. Schelle, C.; Menning, M.; Krug, H.; Jonschker, G.; Schmidt, H. One step antiglare sol–gel coating for screens by sol–gel techniques. J. Non-Cryst. Solids 1997, 218, 163–168. [Google Scholar] [CrossRef]
  9. Al-Dahoudi, N.; Bisht, H.; Gobbert, C.; Krajewski, T.; Aegerter, M.A. Transparent conducting, anti-static and anti-static–anti-glare coatings on plastic substrates. Thin Solid Films 2001, 392, 299–304. [Google Scholar] [CrossRef]
  10. Aegerter, M.A.; Al-Dahoudi, N. Wet-Chemical Processing of Transparent and Antiglare Conducting ITO Coating on Plastic Substrates. J. Sol-Gel Sci. Technol. 2003, 27, 81–89. [Google Scholar] [CrossRef]
  11. Yeh, C.C. Anti-glare Properties of Hard Coating Film. Master’s Thesis, National Kaohsiung University, Kaohsiung, Taiwan, 2013. [Google Scholar]
  12. Rakhmawati, S.T.T. Dispersion of Colloidal Silica and Its Application to form a Light-Scattering Layer on Glass Substrates. Master’s Thesis, National Taiwan University of Science and Technology, Taipei, Taiwan, 2012. [Google Scholar]
  13. Ma, X.K.; Lee, N.H.; Oh, H.J.; Kim, J.W.; Rhee, C.K.; Park, K.S.; Kim, S.J. Surface Modification and Characterization of Highly Dispersed Silica Nanoparticles by a Cationic Surfactant. Colloids Surf. A Physicochem. Eng. Aspects 2010, 358, 172–176. [Google Scholar] [CrossRef]
  14. Xia, Y.; Zhao, X.M.; Whitesides, G.M. Pattern Transfer: Self assembled monolayers as ultrathin resists. Microelectron. Eng. 1996, 32, 255–268. [Google Scholar] [CrossRef]
  15. Xia, Y.; Whitesides, G.M. Soft Lithography. Angew. Chem. Int. 1998, 37, 550–575. [Google Scholar] [CrossRef]
  16. Chou, S.Y.; Krauss, P.R.; Renstrom, P.J. Imprint of Sub-25 nm Vias and Trenches in Polymers. Appl. Phys. Lett. 1995, 67, 3114–3116. [Google Scholar] [CrossRef]
  17. Bailey, T.C.; Colburn, M.E.; Choi, B.J.; Grot, A.; Ekerdt, J.G.; Sreenivasan, S.V.; Willson, C.G. Step and Flash Imprint Lithography: A Low-Pressure, Room Temperature Nanoimprint Patterning Process, in Alternative Lithography. In Unleashing the Potentials of Nanotechnology; Sotomayor Torres, C., Ed.; Elsevier: Austin, TX, USA, 2002. [Google Scholar]
  18. Brinker, C.J.; Scherer, G.W. Sol-Gel Science: The Physics and Chemistry of Sol-Gel Processing; Academic Press: London, UK, 1990. [Google Scholar]
  19. Klein, L.C. Sol-Gel Optics: Processing and Applications; Kluwer: Boston, MA, USA, 1994. [Google Scholar]
  20. Lugscheider, E.; Barimani, C.; Eckert, P.; Eritt, U. Modeling of the APS plasma spray process. Comput. Mater. Sci. 1996, 7, 109–114. [Google Scholar] [CrossRef]
  21. Huang, Y.H.; Chou, H.M.; Chen, L.C. Influence of alcoholic solvents on the anti-glare property of silica sol-gel thin films. In Proceedings of the International Conference on Innovation, Communication and Engineering, Hangzhou, China, 9–14 November 2018. [Google Scholar]
  22. Guttman, I.; Wilks, S.S.; Hunter, J.S. Introductory Engineering Statistics, 3rd ed.; John Wiley & Sons: Hoboken, NJ, USA, 1982. [Google Scholar]
  23. Bezerra, M.A.; Santelli, R.E.; Olivira, E.P.; Villar, L.S.; Escaleira, L.A. Response Surface Methodology (RSM) as a Tool for Optimization in Analytical Chemistry. Talanta 2008, 76, 965–977. [Google Scholar] [CrossRef] [PubMed]
  24. Montgomery, D.C. Design and Analysis of Experiments; Wiley: New York, NY, USA, 2006. [Google Scholar]
  25. Hernandez-Vazquez, J.M.; Garitaonandia, I.; Fernandes, M.H.; Muñoa, J.; de Lacalle, L.N.L. A Consistent Procedure Using Response Surface Methodology to Identify Stiffness Properties of Connections in Machine Tools. Materials 2018, 11, 1220. [Google Scholar] [CrossRef] [PubMed]
  26. Hsu, S.T.; Chen, L.C.; Lee, C.C.; Pan, T.C.; You, B.X.; Yan, Q.F. Preparation of methacrylic acid-modified rice husk improved by an experimental design and application for paraquat adsorption. J. Hazard. Mater. 2009, 171, 465–470. [Google Scholar] [CrossRef] [PubMed]
  27. Khan, M.J.H.; Hussian, M.A.; Mujtaba, I.M. Polypropylene Production Optimization in Fluidized Bed Catalytic Reactor (FBCR): Statistical Modeling and Pilot Scale Experimental Validation. Materials 2014, 7, 2440–2458. [Google Scholar] [CrossRef] [PubMed]
Figure 1. Schematic diagram of light path for normal and anti-glare glass.
Materials 12 00751 g001
Figure 2. Schematic diagram of the anti-glare thin film production by the auto-spray system.
Materials 12 00751 g002
Figure 3. The influence of sol-gel deliver pressure on (a) TTL and haze (b) gloss and Ra with air transport pressure and displacement speed of 300 kPa and 300 mm/s, respectively.
Materials 12 00751 g003
Figure 4. The digital microscope pictures of microstructure morphology of anti-glare samples by different sol-gel deliver pressure: (a) 60 kPa (90°); (b) 120 kPa (90°); (c) 210 kPa (90°); (d) 300 kPa (90°); (e) 600 kPa (90°); (f) 60 kPa (25°); (g) 120 kPa (25°); (h) 210 kPa (25°); (i) 300 kPa (25°); and (j) 600 kPa (25°) with air transport pressure and displacement speed of 300 kPa and 300 mm/s, respectively.
Materials 12 00751 g004
Figure 5. The influence of air transport pressure on (a) haze and TTL and (b) gloss and Ra with the sol-gel deliver pressure and displacement speed of 120 kPa and 300 mm/s, respectively.
Materials 12 00751 g005
Figure 6. The digital microscope pictures of microstructure morphology of anti-glare samples by different air transport pressure (a) 60 kPa (90°); (b) 120 kPa (90°); (c) 210 kPa (90°); (d) 300 kPa (90°); (e) 600 kPa (90°); (f) 60 kPa (25°); (g) 120 kPa (25°); (h) 210 kPa (25°); (i) 300 kPa (25°); and (j) 600 kPa (25°) with the sol-gel deliver pressure and displacement speed of 120 kPa and 300 mm/s, respectively.
Materials 12 00751 g006
Figure 7. The influences of spray displacement speed on (a) haze and TTL, and (b) gloss and Ra with the sol-gel deliver and air transport pressures of 120 kPa and 300 kPa, respectively.
Materials 12 00751 g007
Figure 8. The digital microscope pictures of microstructure morphology of anti-glare sample by different the spray gun displacement speed (a) 170 mm/s (90°); (b) 235 mm/s (90°); (c) 300 mm/s (90°); (d) 400 mm/s (90°); (e) 500 mm/s (90°); (f) 170 mm/s (25°); (g) 235 mm/s (25°); (h) 300 mm/s (25°); (i) 400 mm/s (25°); and (j) 500 mm/s (25°) with the sol-gel deliver and air transport pressures of 120 kPa and 300 kPa, respectively.
Materials 12 00751 g008
Figure 9. The response surface plots of gloss against the factors of (a) sol-gel deliver pressure (X1) and air transport pressure (X2) with X3 of 140 mm/s; (b) displacement speed (X3) and sol-gel deliver pressure (X1) with X2 of 560 kPa; and (c) displacement speed (X3) and air transport pressure (X2) with X1 of 250 kPa.
Materials 12 00751 g009aMaterials 12 00751 g009b
Figure 10. The response surface plots of haze against the factors of (a) sol-gel deliver pressure (X1) and air transport pressure (X2) with X3 of 20 mm/s; (b) displacement speed (X3) and sol-gel deliver pressure (X1) with X2 of 620 kPa; and (c) displacement speed (X3) and air transport pressure (X2) with X1 of 340 kPa.
Materials 12 00751 g010
Table 1. Effects of the sol-gel deliver pressure on the gloss, haze, Ra, and TTL of the anti-glare thin films with air transport pressure and displacement speed of 300 kPa and 300 mm/s, respectively.
No.Sol-Gel Pressure (kPa)Air Pressure (kPa)Displacement Speed (mm/s)Gloss (GU)Haze (%)Ra (μm)TTL (%)
160300300130.52.80.07491.2
212030030067.615.30.19491.7
321030030025.628.00.39892.8
430030030028.826.30.42792.5
560030030089.28.20.87388.8
Table 2. Experimental domains and coded levels of the independent variables.
Independent VariableSymbolCode Level
−1.68−10+1+1.68
sol-gel deliver pressure (kPa)X1135.2176236296336.8
air transport pressure (kPa)(kPa)X2272340440540608
displacement speed (mm/s)(mm/s)X3196230280330364
Table 3. Experimental results of the central composite design.
No.Sol-Gel Pressure (kPa)Air Pressure (kPa)Displacement Speed (mm/s)Gloss (GU)Haze (%)
117634023032.827.3
217634033042.022.3
317654023023.535.6
417654033031.028.6
529634023070.215.1
629634033079.88.5
729654023020.837.6
829654033045.622.8
9135.244028038.626.4
10336.844028060.521.9
1123627228068.211.1
1223660828028.529.2
1323644019618.739.8
1423644036442.318.5
15(C)23644028025.131.0
16(C)23644028026.032..0
Table 4. Sequential model sum of squares for gloss.
SourcesSum of SquaresDegree of FreedomMean SquareF-Valuep-Value
Mean vs total26,699.6126,699.6
Linear vs Mean3861312879.310.002
2FI vs Linear562.8043187.61.540.270
Quadratic vs 2FI989.6783329.918.530.002
Cubic vs Quadratic105.134426.331.230.031 (aliased)
Residual1.6832820.84
total32,219.9162013.7
Table 5. Results of the regression model and ANOVA for gloss.
ParameterParameter EstimateStandard Error95% CI Low95% CI High
Intercept25.6112.97518.33232.890
X19.0751.1426.28111.868
X2−12.4971.142−15.291−9.703
X36.6481.1423.8549.442
X1X2−7.9131.492−11.563−4.262
X1X32.2131.492−1.4385.863
X2X31.6881.492−1.9635.338
X128.3381.3864.94611.730
X227.9131.3864.52111.305
X321.6021.386−1.7904.994
ParameterSum of Squares (SS)Degree of Freedom (df)Mean Square (MS)F Ratio (F-Value)Probability (p-Value)
Model5413.4829601.49833.7870.0002 *
X11124.63411124.63463.1710.0002 *
X22132.79612132.796119.800<0.0001 *
X3603.5711603.57133.9030.0011 *
X1X2500.8611500.86128.1340.0018 *
X1X339.1613139.1612.2000.1886
X2X322.7813122.7811.2800.3011
X12644.0051644.00536.1740.0010 *
X22580.1321580.13232.5860.0013 *
X3223.7883123.7881.3360.2917
Lack of fit106.413521.28352.4520.10443
Pure error0.40510.405
Total SS5520.30015
R2 = 0.981, R2adj = 0.952, R2pred = 0.843, Adeq Precision = 18.3.
Table 6. The measured optimal condition of lowest gloss and highest haze, and the predicted ones from Equations (3) and (5), respectively.
ItemsX1 (kPa)X2 (Kpa)X3 (mm/s)Experimental ValuePredicted ValueError %
Gloss (GU)250560140Averaged9.21.1
9.19.3
9.5
9.3
Haze (%)34062020Averaged57.01.2
57.957.7
57.7
57.6
Table 7. Sequential model sum of squares for haze.
SourcesSum of SquaresDegree of FreedomMean SquareF-Valuep-Value
Mean vs total10,388.7110,388.7
Linear vs Mean943.63314.512.870.005
2FI vs Linear85.7328.61.240.359
Quadratic vs 2FI162.9354.37.300.019
Cubic vs Quadratic42.7410.71.100.080 (aliased)
Residual1.9220.96
total11,625.516726.6
Table 8. Results of the regression model and ANOVA for haze.
ParameterParameter EstimateStandard Error95% CI Low95% CI High
Intercept31.4361.92326.73036.141
X1−2.7360.738−4.542-0.930
X25.9930.7384.1877.799
X3−5.0690.738−6.875−3.263
X1X22.7750.9640.4155.135
X1X3−1.1750.964−3.5351.185
X2X3−1.2750.964−3.6351.085
X12−2.4430.896−4.636−0.250
X22−3.8570.896−6.050−1.665
X32−0.6750.896−2.8681.517
ParameterSum of Squares (SS)Degree of Freedom (df)Mean Square (MS)F Ratio (F-Value)Probability (p-Value)
Model1192.1249132.45817.8030.0011
X1102.2471102.24713.7430.0100
X2490.4391490.43965.9190.0002
X3350.8651350.86547.1590.0005
X1X261.605161.6058.2800.0281
X1X311.045111.0451.4850.2688
X2X313.005113.0051.7480.2343
X1255.299155.2997.4320.0344
X22137.8451137.84518.5270.0051
X324.22614.2260.5610.4796
Lack of fit44.14058.82817.6560.1787
Pure error0.50010.500
Total SS1236.76415
R2 = 0.964, R2adj = 0.910, R2pred = 0.721, Adeq Precision = 13.9.

