Analytical Modeling of In-Process Temperature in Powder Bed Additive Manufacturing Considering Laser Power Absorption, Latent Heat, Scanning Strategy, and Powder Packing


Abstract
:1. Introduction
2. Methodology
3. Results and Discussion
4. Conclusions
Author Contributions
Funding
Acknowledgments
Conflicts of Interest
Nomenclature
| MPBAM | metal powder bed additive manufacturing |
| PBF | powder bed fusion |
| SLM | selective laser melting |
| SLS | selective laser sintering |
| DMD | direct metal deposition |
| FEM | finite element method |
| IR | infrared |
| internal energy | |
| enthalpy | |
| density | |
| effective density | |
| thermal conductivity | |
| effective thermal conductivity | |
| specific heat | |
| thermal diffusivity | |
| a volumetric heat source | |
| amount of heat | |
| latent heat | |
| laser power | |
| absorption | |
| laser heat source moving velocity | |
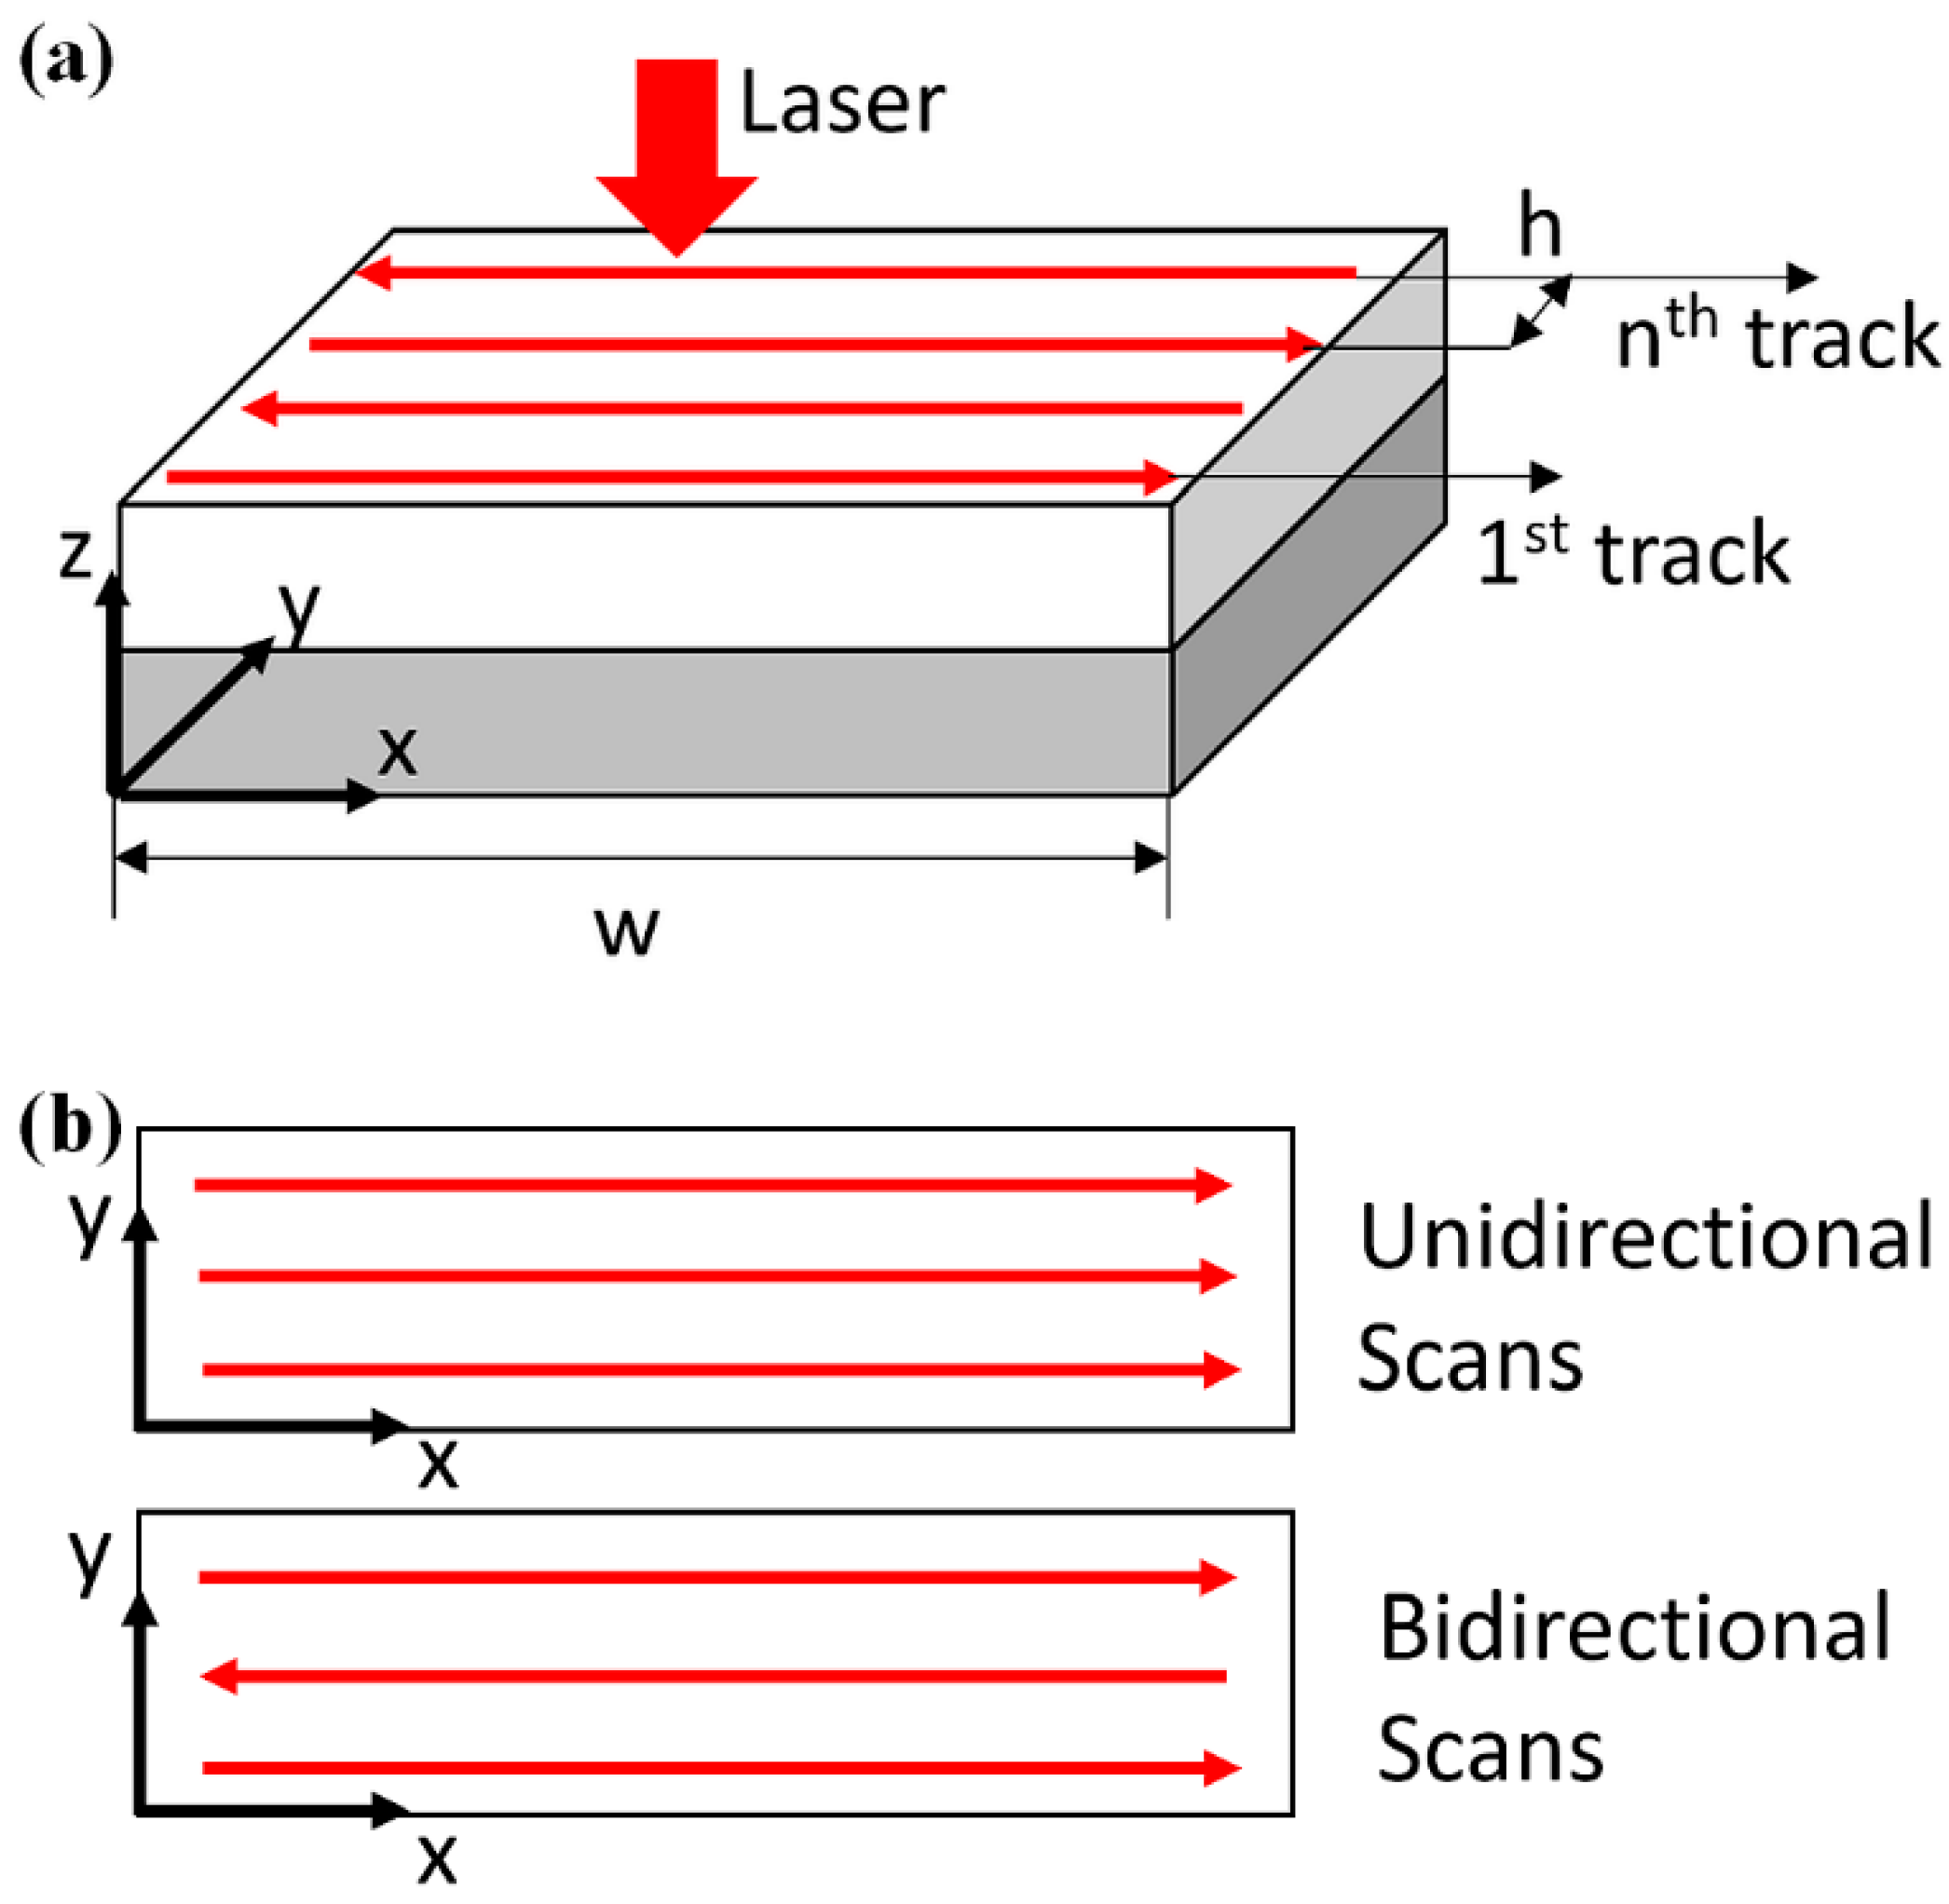
| hatch space | |
| track length | |
| coordinate | |
| temperature, room temperature, material melting temperature | |
| temperature change due to the consideration of latent heat | |
| temperature change due to the moving laser heat source | |
| time | |
| time related integration variable | |
| powder packing related coefficients | |
| molten pool length, depth, width, volume |
Appendix A

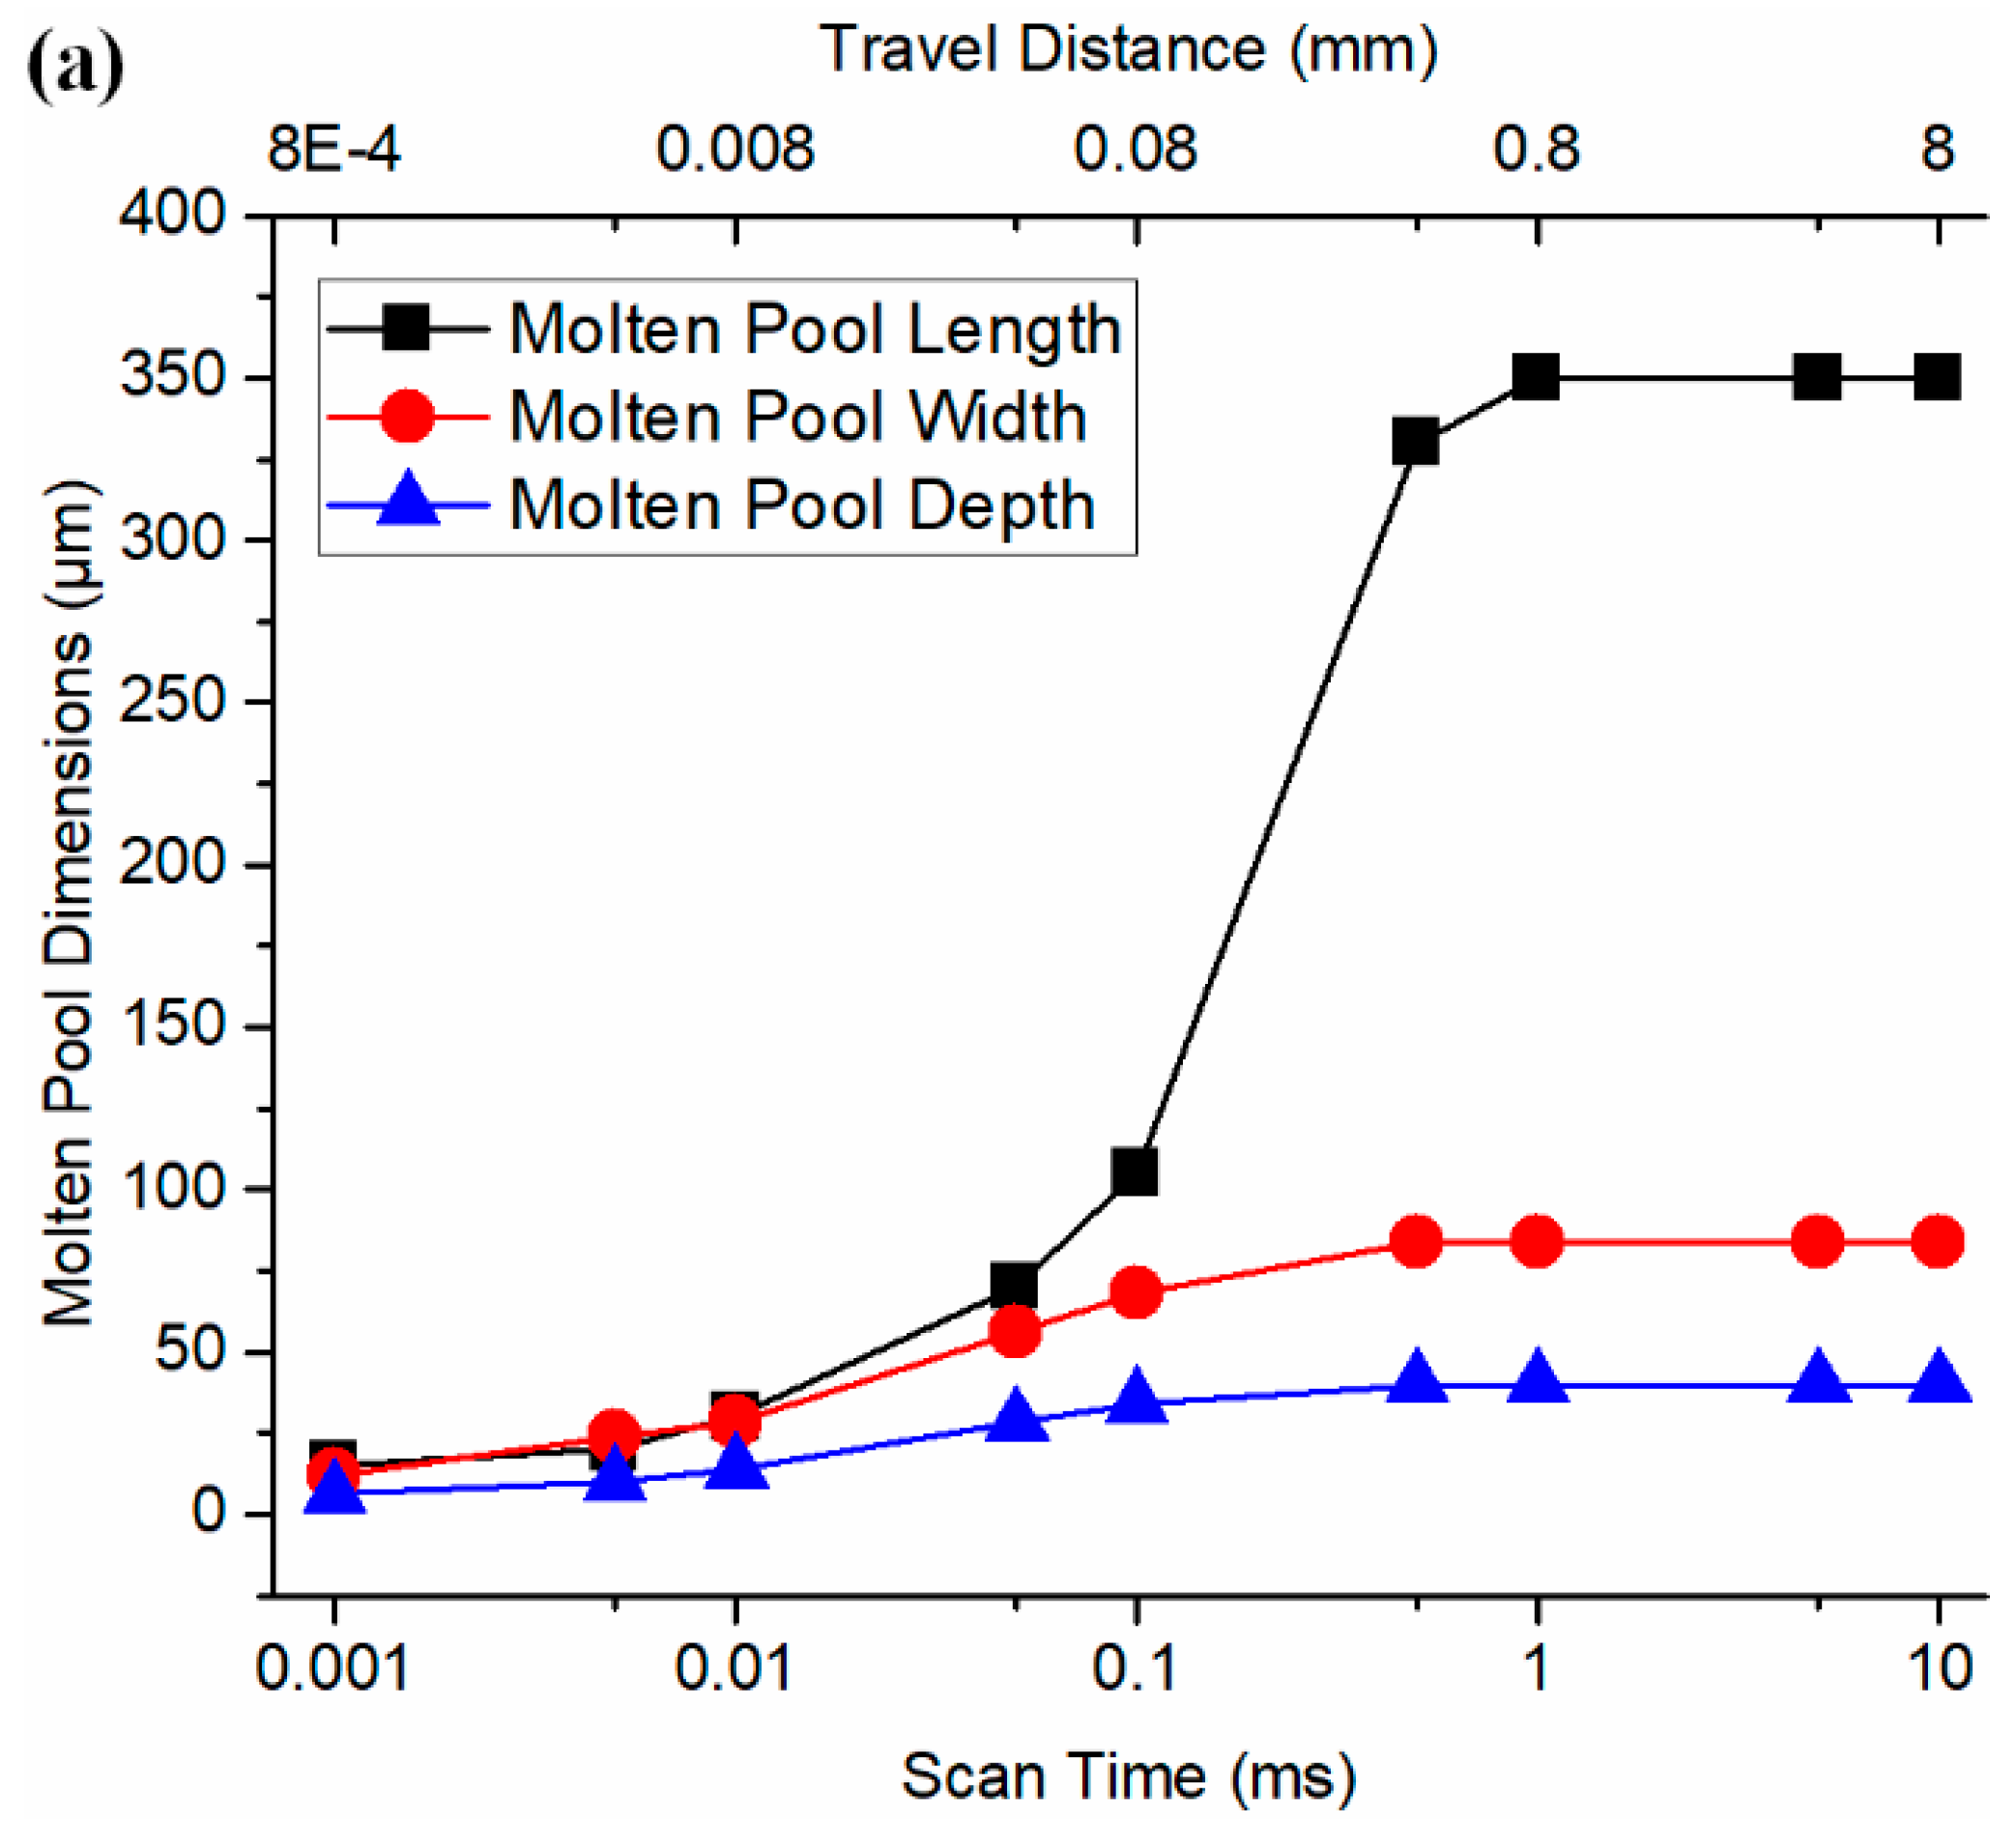
| Scan Time (ms) | Melt Length (μm) | Melt Width (μm) | Melt Depth (μm) | Melt Volume |
|---|---|---|---|---|
| 0.001 | 15 | 12 | 6 | 565 |
| 0.005 | 20 | 24 | 10 | 2513 |
| 0.01 | 30 | 28 | 14 | 6158 |
| 0.05 | 70 | 56 | 28 | 57,470 |
| 0.1 | 105 | 68 | 34 | 127,109 |
| 0.5 | 330 | 84 | 40 | 580,566 |
| 1 | 350 | 84 | 40 | 615,752 |
| 5 | 350 | 84 | 40 | 615,752 |
| 10 | 350 | 84 | 40 | 615,752 |
| 50 | 350 | 84 | 40 | 615,752 |
| 100 | 350 | 84 | 40 | 615,752 |
| 500 | 350 | 84 | 40 | 615,752 |
| 1000 | 350 | 84 | 40 | 615,752 |
References
- Gu, D.D.; Meiners, W.; Wissenbach, K.; Poprawe, R. Laser additive manufacturing of metallic components: materials, processes and mechanisms. Int. Mater. Rev. 2012, 57, 133–164. [Google Scholar] [CrossRef]
- Gong, H.; Rafi, K.; Gu, H.; Starr, T.; Stucker, B. Analysis of defect generation in Ti–6Al–4V parts made using powder bed fusion additive manufacturing processes. Addit. Manuf. 2014, 1, 87–98. [Google Scholar] [CrossRef]
- Shiomi, M.; Osakada, K.; Nakamura, K.; Yamashita, T.; Abe, F. Residual stress within metallic model made by selective laser melting process. CIRP Annals 2004, 53, 195–198. [Google Scholar] [CrossRef]
- Heigel, J.C.; Michaleris, P.; Palmer, T.A. In situ monitoring and characterization of distortion during laser cladding of Inconel® 625. J. Mater. Process. Technol. 2015, 220, 135–145. [Google Scholar] [CrossRef]
- Buchbinder, D.; Meiners, W.; Pirch, N.; Wissenbach, K.; Schrage, J. Investigation on reducing distortion by preheating during manufacture of aluminum components using selective laser melting. J. Laser Appl. 2014, 26, 012004. [Google Scholar] [CrossRef]
- Wauthle, R.; Vrancken, B.; Beynaerts, B.; Jorissen, K.; Schrooten, J.; Kruth, J.P.; Van Humbeeck, J. Effects of build orientation and heat treatment on the microstructure and mechanical properties of selective laser melted Ti6Al4V lattice structures. Addit. Manuf. 2015, 5, 77–84. [Google Scholar] [CrossRef]
- Yang, Y.; Chen, Y.; Zhang, J.; Gu, X.; Qin, P.; Dai, N.; Li, X.; Kruth, J.P.; Zhang, L.C. Improved corrosion behavior of ultrafine-grained eutectic Al-12Si alloy produced by selective laser melting. Mater. Des. 2018, 146, 239–248. [Google Scholar] [CrossRef]
- Van Hooreweder, B.; Kruth, J.P. Advanced fatigue analysis of metal lattice structures produced by Selective Laser Melting. CIRP Ann. 2017, 66, 221–224. [Google Scholar] [CrossRef]
- Ning, J.; Liang, S. Predictive Modeling of Machining Temperatures with Force–Temperature Correlation Using Cutting Mechanics and Constitutive Relation. Materials 2019, 12, 284. [Google Scholar] [CrossRef] [PubMed]
- Ning, J.; Liang, S. Prediction of Temperature Distribution in Orthogonal Machining Based on the Mechanics of the Cutting Process Using a Constitutive Model. J. Manuf. Mater. Process. 2018, 2, 37. [Google Scholar] [CrossRef]
- Craeghs, T.; Clijsters, S.; Yasa, E.; Bechmann, F.; Berumen, S.; Kruth, J.P. Determination of geometrical factors in Layerwise Laser Melting using optical process monitoring. Opt. Laser Eng. 2011, 49, 1440–1446. [Google Scholar] [CrossRef]
- Clijsters, S.; Craeghs, T.; Buls, S.; Kempen, K.; Kruth, J.P. In situ quality control of the selective laser melting process using a high-speed, real-time melt pool monitoring system. Int. J. Adv. Manuf. Technol. 2014, 75, 1089–1101. [Google Scholar] [CrossRef]
- Denlinger, E.R.; Jagdale, V.; Srinivasan, G.V.; El-Wardany, T.; Michaleris, P. Thermal modeling of Inconel 718 processed with powder bed fusion and experimental validation using in situ measurements. Addit. Manuf. 2016, 11, 7–15. [Google Scholar] [CrossRef]
- Heigel, J.C.; Gouge, M.F.; Michaleris, P.; Palmer, T.A. Selection of powder or wire feedstock material for the laser cladding of Inconel® 625. J. Mater. Process. Technol. 2016, 231, 357–365. [Google Scholar] [CrossRef]
- Everton, S.K.; Hirsch, M.; Stravroulakis, P.; Leach, R.K.; Clare, A.T. Review of in-situ process monitoring and in-situ metrology for metal additive manufacturing. Mater. Des. 2016, 95, 431–445. [Google Scholar] [CrossRef]
- Tapia, G.; Elwany, A. A review on process monitoring and control in metal-based additive manufacturing. J. Manuf. Sci. Eng. 2014, 136, 060801. [Google Scholar] [CrossRef]
- Wang, Y.; Kamath, C.; Voisin, T.; Li, Z. A processing diagram for high-density Ti-6Al-4V by selective laser melting. Rapid Prototyp. J. 2018, 24, 1469–1478. [Google Scholar] [CrossRef]
- Criales, L.E.; Arısoy, Y.M.; Lane, B.; Moylan, S.; Donmez, A.; Özel, T. Laser powder bed fusion of nickel alloy 625: experimental investigations of effects of process parameters on melt pool size and shape with spatter analysis. Int. J. Mach. Tool. Manuf. 2017, 121, 22–36. [Google Scholar] [CrossRef]
- Roberts, I.A.; Wang, C.J.; Esterlein, R.; Stanford, M.; Mynors, D.J. A three-dimensional finite element analysis of the temperature field during laser melting of metal powders in additive layer manufacturing. Int. J. Mach. Tools Manuf. 2009, 49, 916–923. [Google Scholar] [CrossRef]
- Hussein, A.; Hao, L.; Yan, C.; Everson, R. Finite element simulation of the temperature and stress fields in single layers built without-support in selective laser melting. Mater. Des. 2013, 52, 638–647. [Google Scholar] [CrossRef]
- Patil, R.B.; Yadava, V. Finite element analysis of temperature distribution in single metallic powder layer during metal laser sintering. Int. J. Mach. Tools Manuf. 2007, 47, 1069–1080. [Google Scholar] [CrossRef]
- Fu, C.H.; Guo, Y.B. Three-dimensional temperature gradient mechanism in selective laser melting of Ti-6Al-4V. J. Manuf. Sci. Eng. 2014, 136, 061004. [Google Scholar] [CrossRef]
- Loh, L.E.; Chua, C.K.; Yeong, W.Y.; Song, J.; Mapar, M.; Sing, S.L.; Liu, Z.-H.; Zhang, D.Q. Numerical investigation and an effective modelling on the Selective Laser Melting (SLM) process with aluminium alloy 6061. Int. J. Heat Mass Trans. 2015, 80, 288–300. [Google Scholar] [CrossRef]
- Li, Y.; Gu, D. Thermal behavior during selective laser melting of commercially pure titanium powder: Numerical simulation and experimental study. Addit. Manuf. 2014, 1, 99–109. [Google Scholar] [CrossRef]
- Antony, K.; Arivazhagan, N.; Senthilkumaran, K. Numerical and experimental investigations on laser melting of stainless steel 316L metal powders. J. Manuf. Process. 2014, 16, 345–355. [Google Scholar] [CrossRef]
- Andreotta, R.; Ladani, L.; Brindley, W. Finite element simulation of laser additive melting and solidification of Inconel 718 with experimentally tested thermal properties. Finite Elem. Anal. Des. 2017, 135, 36–43. [Google Scholar] [CrossRef]
- Criales, L.E.; Arısoy, Y.M.; Özel, T. Sensitivity analysis of material and process parameters in finite element modeling of selective laser melting of Inconel 625. Int. J. Adv. Manuf. Technol. 2016, 86, 2653–2666. [Google Scholar] [CrossRef]
- Papadakis, L.; Loizou, A.; Risse, J.; Bremen, S.; Schrage, J. A computational reduction model for appraising structural effects in selective laser melting manufacturing: a methodical model reduction proposed for time-efficient finite element analysis of larger components in Selective Laser Melting. Virtual Phys. Prototyp. 2014, 9, 17–25. [Google Scholar] [CrossRef]
- Xia, M.; Gu, D.; Yu, G.; Dai, D.; Chen, H.; Shi, Q. Porosity evolution and its thermodynamic mechanism of randomly packed powder-bed during selective laser melting of Inconel 718 alloy. Int. J. Mach. Tools Manuf. 2017, 116, 96–106. [Google Scholar] [CrossRef]
- Xiang, Y.; Zhang, S.; Wei, Z.; Li, J.; Wei, P.; Chen, Z.; Yang, L.; Jiang, L. Forming and defect analysis for single track scanning in selective laser melting of Ti6Al4V. Appl. Phys. A 2018, 124, 685. [Google Scholar] [CrossRef]
- Wei, P.; Wei, Z.; Chen, Z.; He, Y.; Du, J. Thermal behavior in single track during selective laser melting of AlSi10Mg powder. Appl. Phys. A 2017, 123, 604. [Google Scholar] [CrossRef]
- Qi, H.; Mazumder, J.; Ki, H. Numerical simulation of heat transfer and fluid flow in coaxial laser cladding process for direct metal deposition. J. Appl. Phys. 2006, 100, 024903. [Google Scholar] [CrossRef] [Green Version]
- Kolossov, S.; Boillat, E.; Glardon, R.; Fischer, P.; Locher, M. 3D FE simulation for temperature evolution in the selective laser sintering process. Int. J. Mach. Tools Manuf. 2004, 44, 117–123. [Google Scholar] [CrossRef]
- Wang, Z.; Denlinger, E.; Michaleris, P.; Stoica, A.D.; Ma, D.; Beese, A.M. Residual stress mapping in Inconel 625 fabricated through additive manufacturing: Method for neutron diffraction measurements to validate thermomechanical model predictions. Mater. Des. 2017, 113, 169–177. [Google Scholar] [CrossRef]
- Afazov, S.; Denmark, W.A.; Toralles, B.L.; Holloway, A.; Yaghi, A. Distortion prediction and compensation in selective laser melting. Addit. Manuf. 2017, 17, 15–22. [Google Scholar] [CrossRef]
- Cao, J.; Gharghouri, M.A.; Nash, P. Finite-element analysis and experimental validation of thermal residual stress and distortion in electron beam additive manufactured Ti-6Al-4V build plates. J. Mater. Process. Technol. 2016, 237, 409–419. [Google Scholar] [CrossRef]
- Bikas, H.; Stavropoulos, P.; Chryssolouris, G. Additive manufacturing methods and modelling approaches: a critical review. Int. J. Adv. Manuf. Technol. 2016, 83, 389–405. [Google Scholar] [CrossRef]
- Schoinochoritis, B.; Chantzis, D.; Salonitis, K. Simulation of metallic powder bed additive manufacturing processes with the finite element method: A critical review. Proc. Inst. Mech. Eng. Part B J. Eng. Manuf. 2017, 231, 96–117. [Google Scholar] [CrossRef]
- Pinkerton, A.J. Advances in the modeling of laser direct metal deposition. J. Laser Appl. 2015, 27, S15001. [Google Scholar] [CrossRef] [Green Version]
- Ning, J.; Nguyen, V.; Liang, S.Y. Analytical modeling of machining forces of ultra-fine-grained titanium. Int. J. Adv. Manuf. Technol. 2018, 1–10. [Google Scholar] [CrossRef]
- Ning, J.; Nguyen, V.; Huang, Y.; Hartwig, K.T.; Liang, S.Y. Inverse determination of Johnson–Cook model constants of ultra-fine-grained titanium based on chip formation model and iterative gradient search. Int. J. Adv. Manuf. Technol. 2018, 99, 1131–1140. [Google Scholar] [CrossRef]
- Peyre, P.; Aubry, P.; Fabbro, R.; Neveu, R.; Longuet, A. Analytical and numerical modelling of the direct metal deposition laser process. J. Phys. D Appl. Phys. 2008, 41, 025403. [Google Scholar] [CrossRef]
- Yang, Y.; Knol, M.F.; van Keulen, F.; Ayas, C. A semi-analytical thermal modelling approach for selective laser melting. Addit. Manuf. 2018, 21, 284–297. [Google Scholar] [CrossRef]
- Van Elsen, M.; Baelmans, M.; Mercelis, P.; Kruth, J.P. Solutions for modelling moving heat sources in a semi-infinite medium and applications to laser material processing. Int. J. Heat Mass Transf. 2007, 50, 4872–4882. [Google Scholar] [CrossRef]
- Carslaw, H.; Jaeger, J. Conduction of Heat in Solids; Oxford Science Publication: Oxford, UK, 1990. [Google Scholar]
- De La Batut, B.; Fergani, O.; Brotan, V.; Bambach, M.; El Mansouri, M. Analytical and numerical temperature prediction in direct metal deposition of Ti6Al4V. J. Manuf. Mater. Process. 2017, 1, 3. [Google Scholar] [CrossRef]
- Rosenthal, D. The theory of moving sources of heat and its application of metal treatments. Trans. ASME 1946, 68, 849–866. [Google Scholar]
- Pinkerton, A.J.; Li, L. The significance of deposition point standoff variations in multiple-layer coaxial laser cladding (coaxial cladding standoff effects). Int. J. Mach. Tools Manuf. 2004, 44, 573–584. [Google Scholar] [CrossRef]
- Tan, H.; Chen, J.; Zhang, F.; Lin, X.; Huang, W. Process analysis for laser solid forming of thin-wall structure. Int. J. Mach. Tools Manuf. 2010, 50, 1–8. [Google Scholar] [CrossRef]
- Saif, M.T.A.; Hui, C.Y.; Zehnder, A.T. Interface shear stresses induced by non-uniform heating of a film on a substrate. Thin Solid Films 1993, 224, 159–167. [Google Scholar] [CrossRef]
- Moulik, P.N.; Yang, H.T.Y.; Chandrasekar, S. Simulation of thermal stresses due to grinding. Int. J. Mech. Sci. 2001, 43, 831–851. [Google Scholar] [CrossRef]
- Boley, C.D.; Khairallah, S.A.; Rubenchik, A.M. Calculation of laser absorption by metal powders in additive manufacturing. Appl. Opt. 2015, 54, 2477–2482. [Google Scholar] [CrossRef]
- Li, Y.; Gu, D. Parametric analysis of thermal behavior during selective laser melting additive manufacturing of aluminum alloy powder. Mater. Des. 2014, 63, 856–867. [Google Scholar] [CrossRef]
- Ning, J.; Liang, S.Y. Model-driven determination of Johnson-Cook material constants using temperature and force measurements. Int. J. Adv. Manuf. Technol. 2018, 97, 1053–1060. [Google Scholar] [CrossRef]
- Dai, K.; Shaw, L. Finite element analysis of the effect of volume shrinkage during laser densification. Acta Mater. 2005, 53, 4743–4754. [Google Scholar] [CrossRef]
- Denlinger, E.R.; Heigel, J.C.; Michaleris, P.; Palmer, T.A. Effect of inter-layer dwell time on distortion and residual stress in additive manufacturing of titanium and nickel alloys. J. Mater. Process. Technol. 2015, 215, 123–131. [Google Scholar] [CrossRef]
- Fergani, O.; Berto, F.; Welo, T.; Liang, S.Y. Analytical modelling of residual stress in additive manufacturing. Fatigue Fract. Eng. Mater. Struct. 2017, 40, 971–978. [Google Scholar] [CrossRef]


| Test | Laser Powder P (W) | Scanning Velocity V (mm/s) | Hatch Space h (mm) |
|---|---|---|---|
| 1 | 169 | 875 | 0.1 |
| 2 | 195 | 875 | 0.1 |
| 3 | 182 | 800 | 0.1 |
| 4 | 195 | 725 | 0.1 |
| 5 | 169 | 725 | 0.1 |
| 6 | 195 | 800 | 0.1 |
| Density ρ (kg/m3) | Thermal Conductivity k (W/m–°C) | Specific Heat Cp (J/kg–°C) | Solidus Temperature Ts (°C) | Liquidus Temperature TL (°C) | Latent Heat Hf (J/kg) | Absorption η (%) |
|---|---|---|---|---|---|---|
| 8840 | 9.8 | 410 | 1290 | 1350 | 227,000 | 40 |
| Absorption | Molten Pool Length (μm) | Molten Pool Depth (μm) | Molten Pool Depth Error | Computation Time |
|---|---|---|---|---|
| 20 | 180 | 29 | 29.27 | 26.11 |
| 25 | 225 | 32 | 21.95 | 24.46 |
| 30 | 270 | 35 | 14.63 | 23.06 |
| 35 | 310 | 38 | 7.32 | 22.95 |
| 40 | 355 | 41 | 0.00 | 23.04 |
| 45 | 395 | 44 | 7.32 | 23.23 |
| 50 | 440 | 46 | 12.20 | 22.95 |
| 55 | 480 | 48 | 17.07 | 23.10 |
| 60 | 525 | 51 | 24.39 | 23.20 |
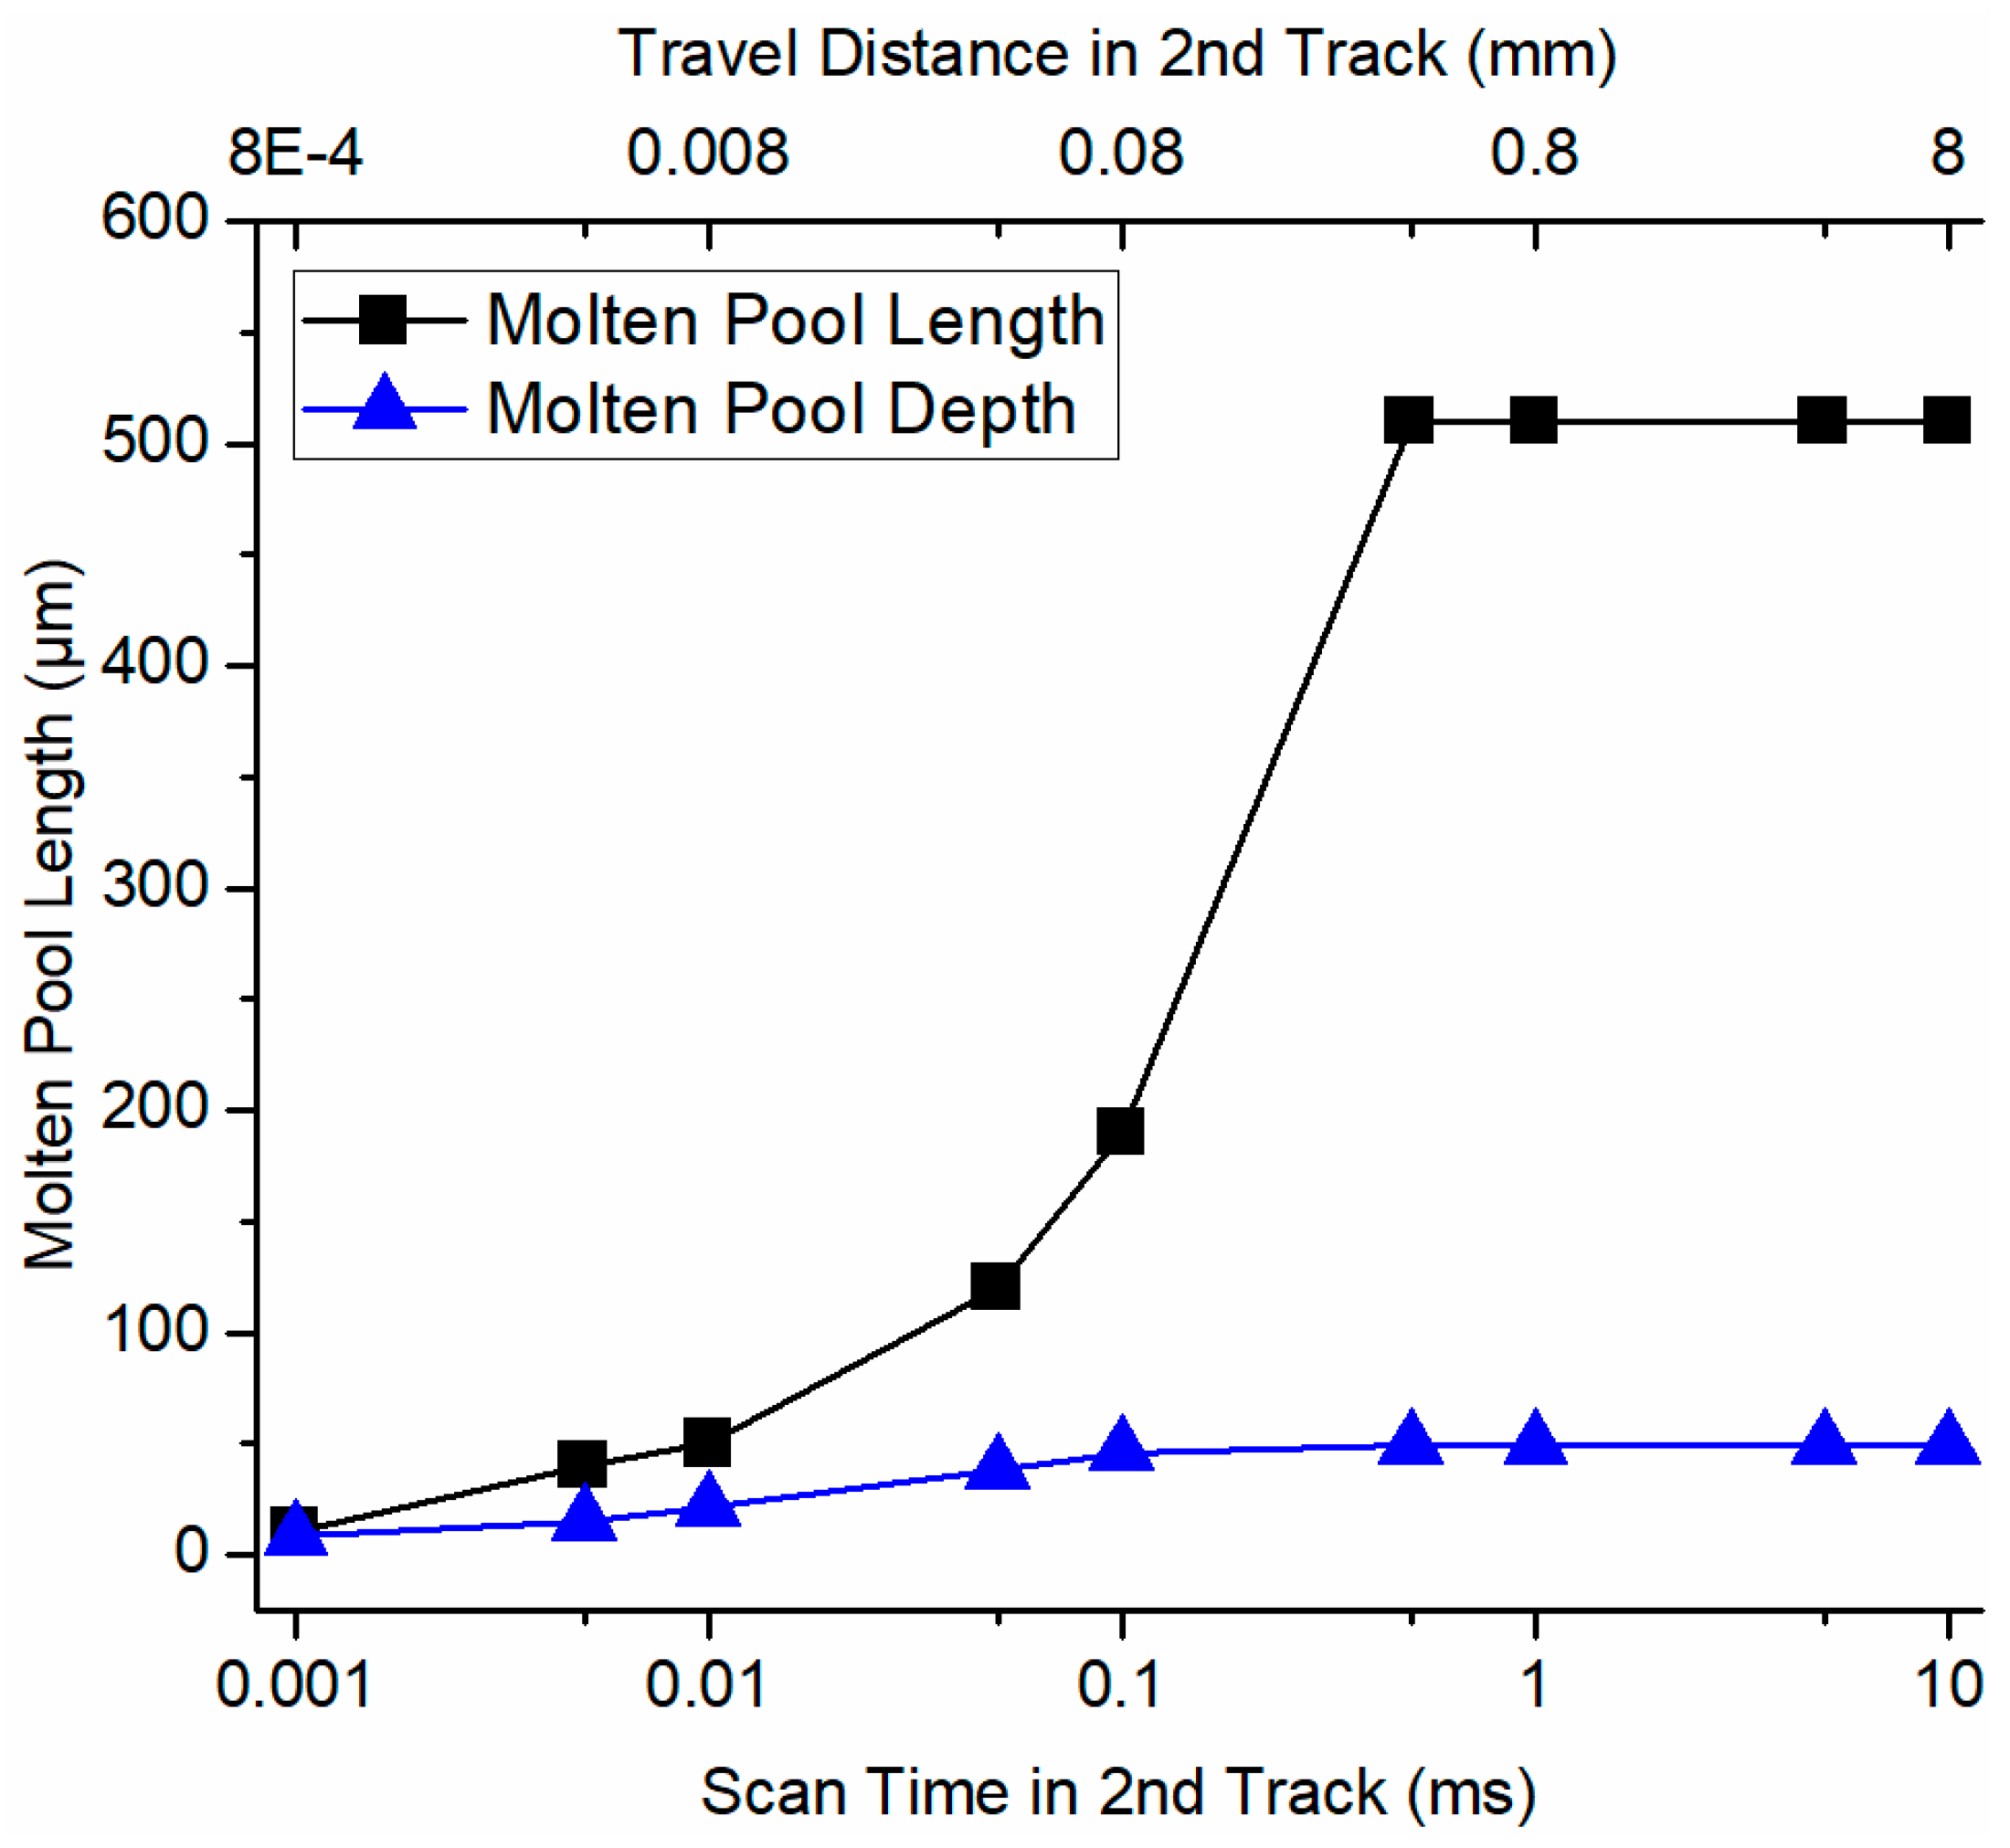
| Single-Track Test | (μm) | (μm) | Bidirectional Test | (μm) | (μm) | ||
|---|---|---|---|---|---|---|---|
| 1 | 310 | 36 | 19.60 | 1 | 450 | 44 | 87.78 |
| 2 | 360 | 39 | 18.90 | 2 | 510 | 47 | 88.18 |
| 3 | 330 | 39 | 19.72 | 3 | 480 | 48 | 91.38 |
| 4 | 360 | 43 | 19.73 | 4 | 510 | 52 | 89.68 |
| 5 | 310 | 40 | 19.64 | 5 | 450 | 48 | 85.91 |
| 6 | 360 | 41 | 19.04 | 6 | 510 | 49 | 86.12 |
© 2019 by the authors. Licensee MDPI, Basel, Switzerland. This article is an open access article distributed under the terms and conditions of the Creative Commons Attribution (CC BY) license (http://creativecommons.org/licenses/by/4.0/).
Share and Cite
Ning, J.; Sievers, D.E.; Garmestani, H.; Liang, S.Y. Analytical Modeling of In-Process Temperature in Powder Bed Additive Manufacturing Considering Laser Power Absorption, Latent Heat, Scanning Strategy, and Powder Packing. Materials 2019, 12, 808. https://doi.org/10.3390/ma12050808
Ning J, Sievers DE, Garmestani H, Liang SY. Analytical Modeling of In-Process Temperature in Powder Bed Additive Manufacturing Considering Laser Power Absorption, Latent Heat, Scanning Strategy, and Powder Packing. Materials. 2019; 12(5):808. https://doi.org/10.3390/ma12050808
Chicago/Turabian StyleNing, Jinqiang, Daniel E. Sievers, Hamid Garmestani, and Steven Y. Liang. 2019. "Analytical Modeling of In-Process Temperature in Powder Bed Additive Manufacturing Considering Laser Power Absorption, Latent Heat, Scanning Strategy, and Powder Packing" Materials 12, no. 5: 808. https://doi.org/10.3390/ma12050808