Effect of Temperature, Pressure, and Chemical Composition on the Electrical Conductivity of Schist: Implications for Electrical Structures under the Tibetan Plateau


Abstract
:1. Introduction
2. Experimental Methods
2.1. Sample Collection and Analysis
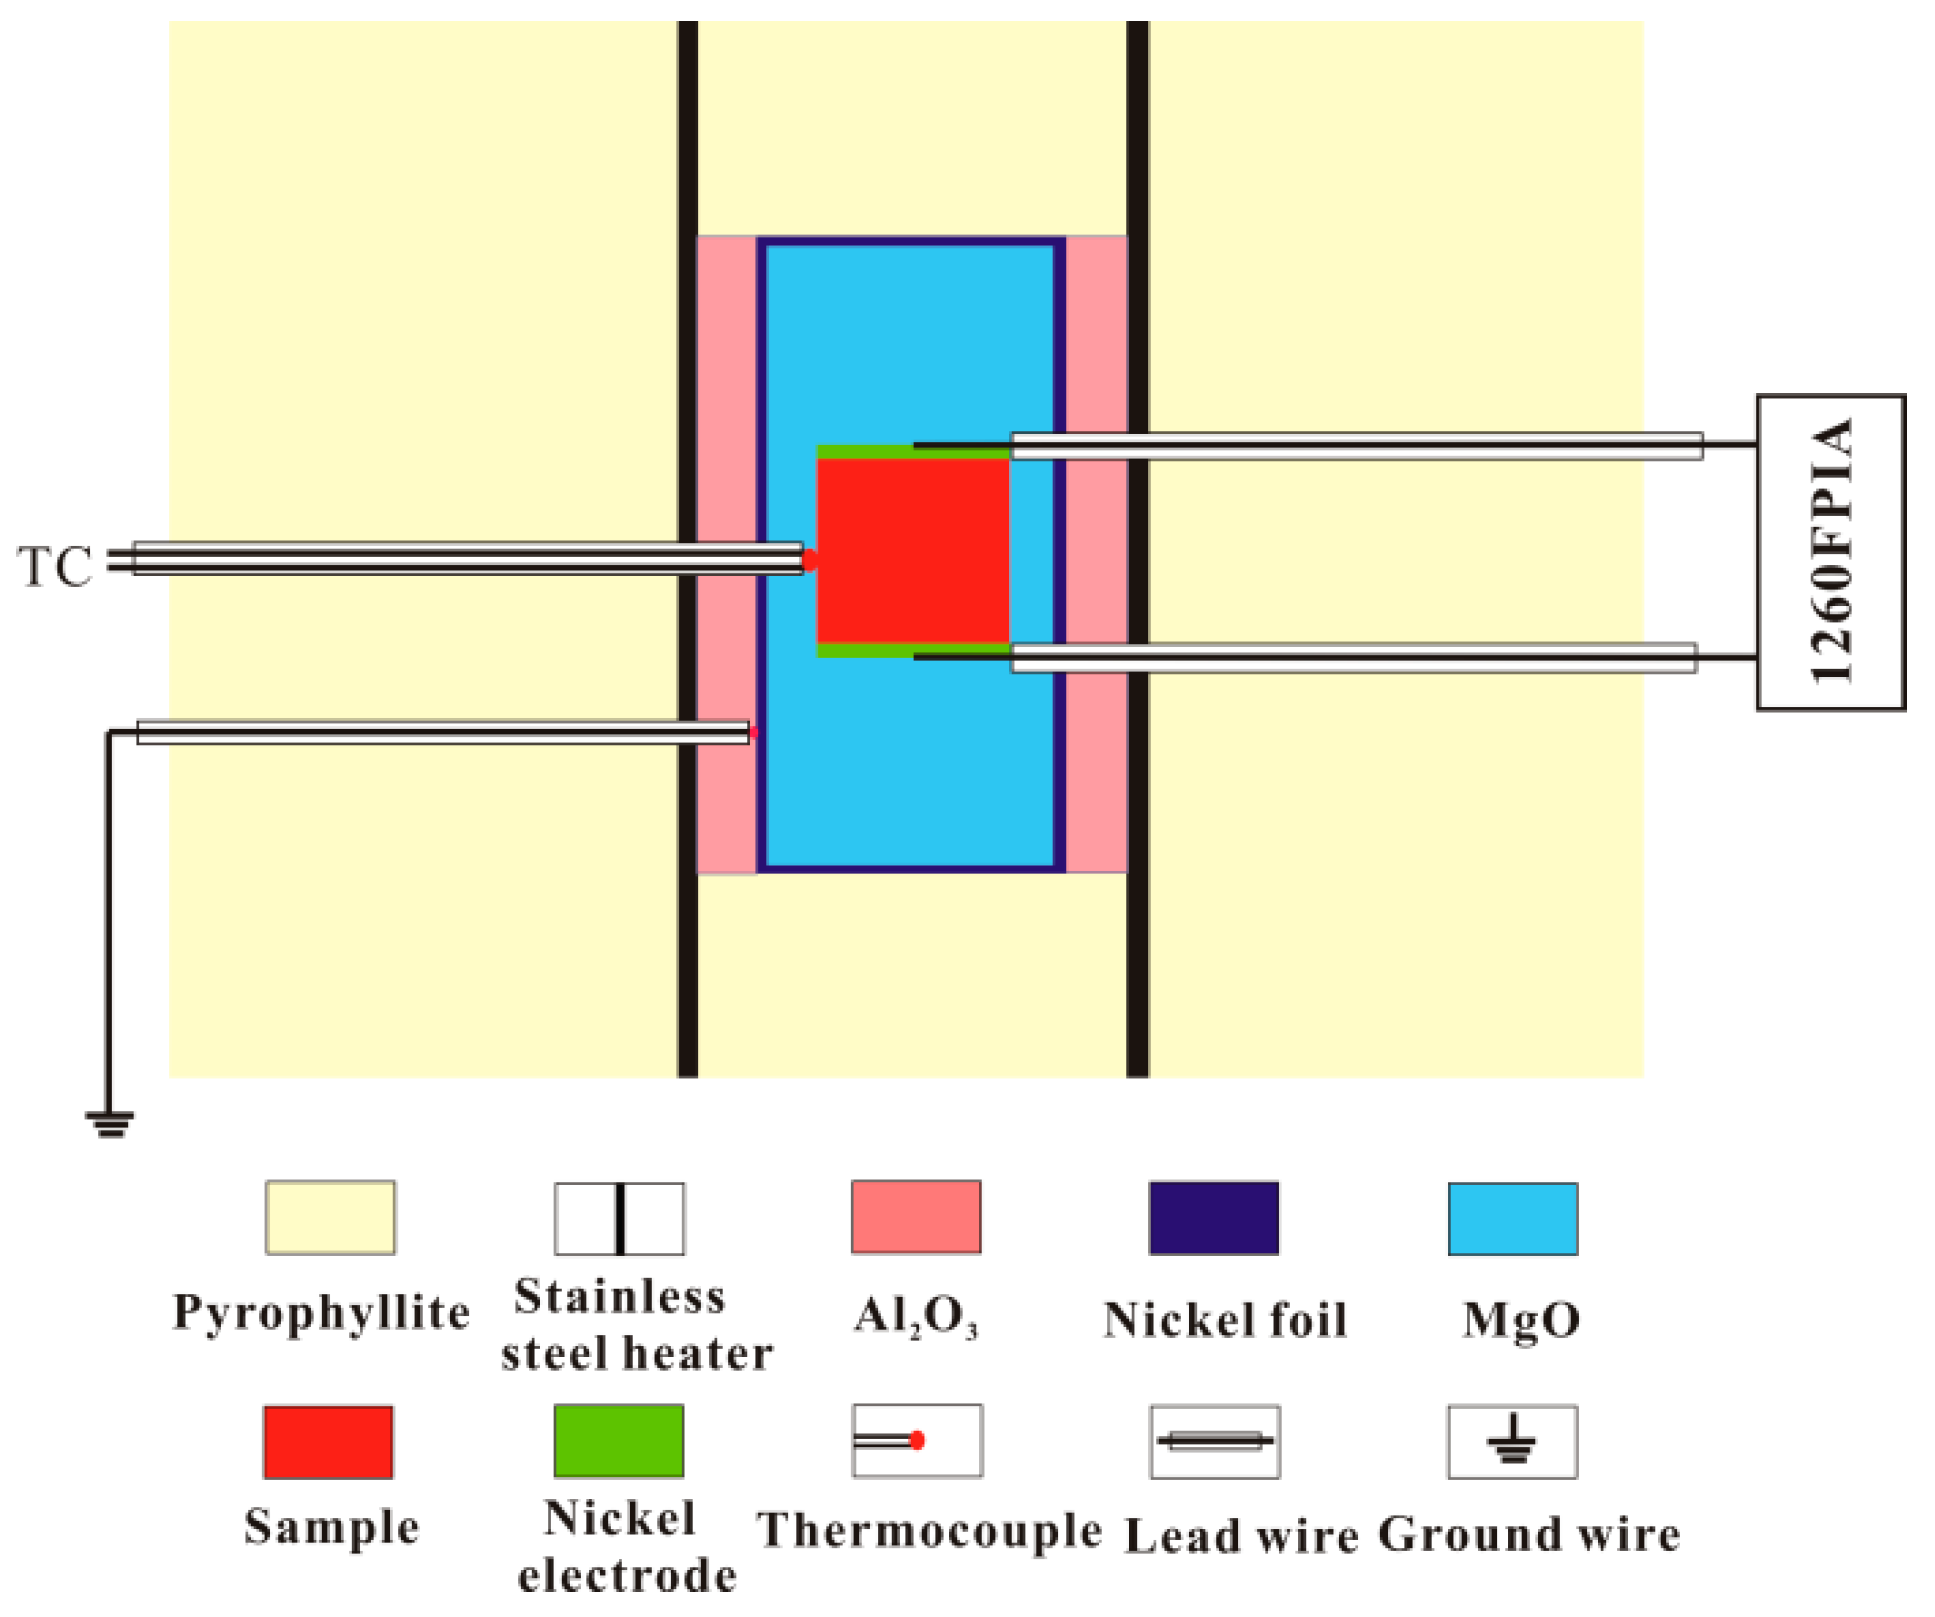
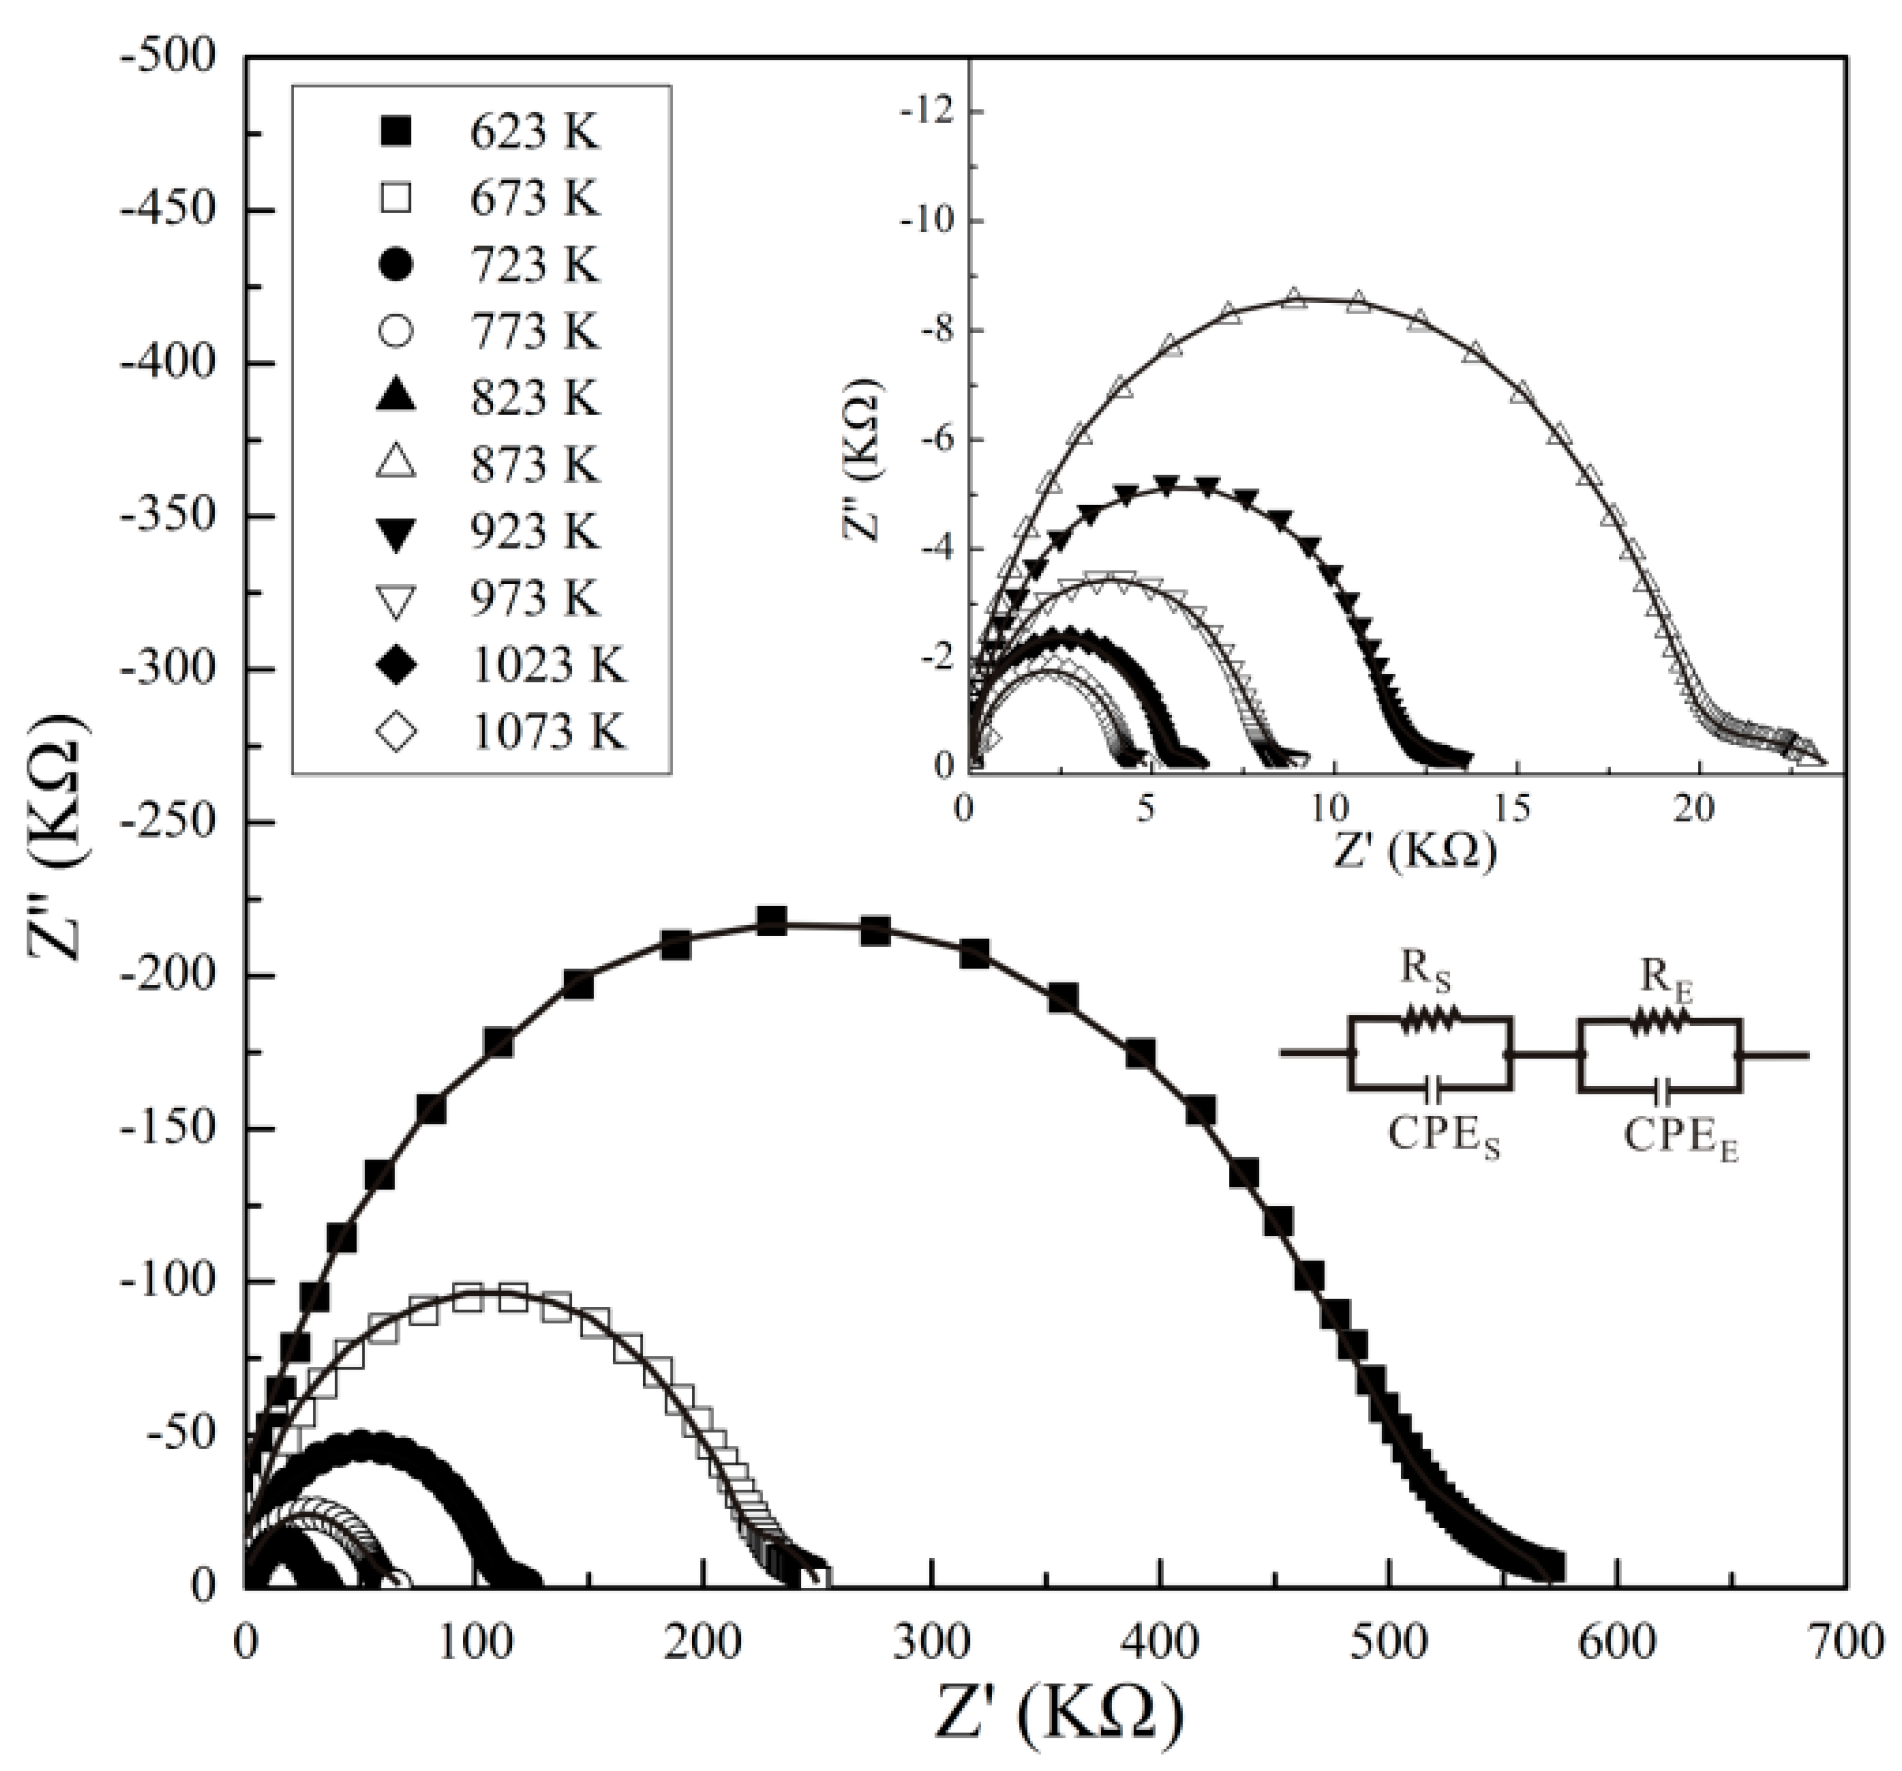
2.2. Impedance Measurements
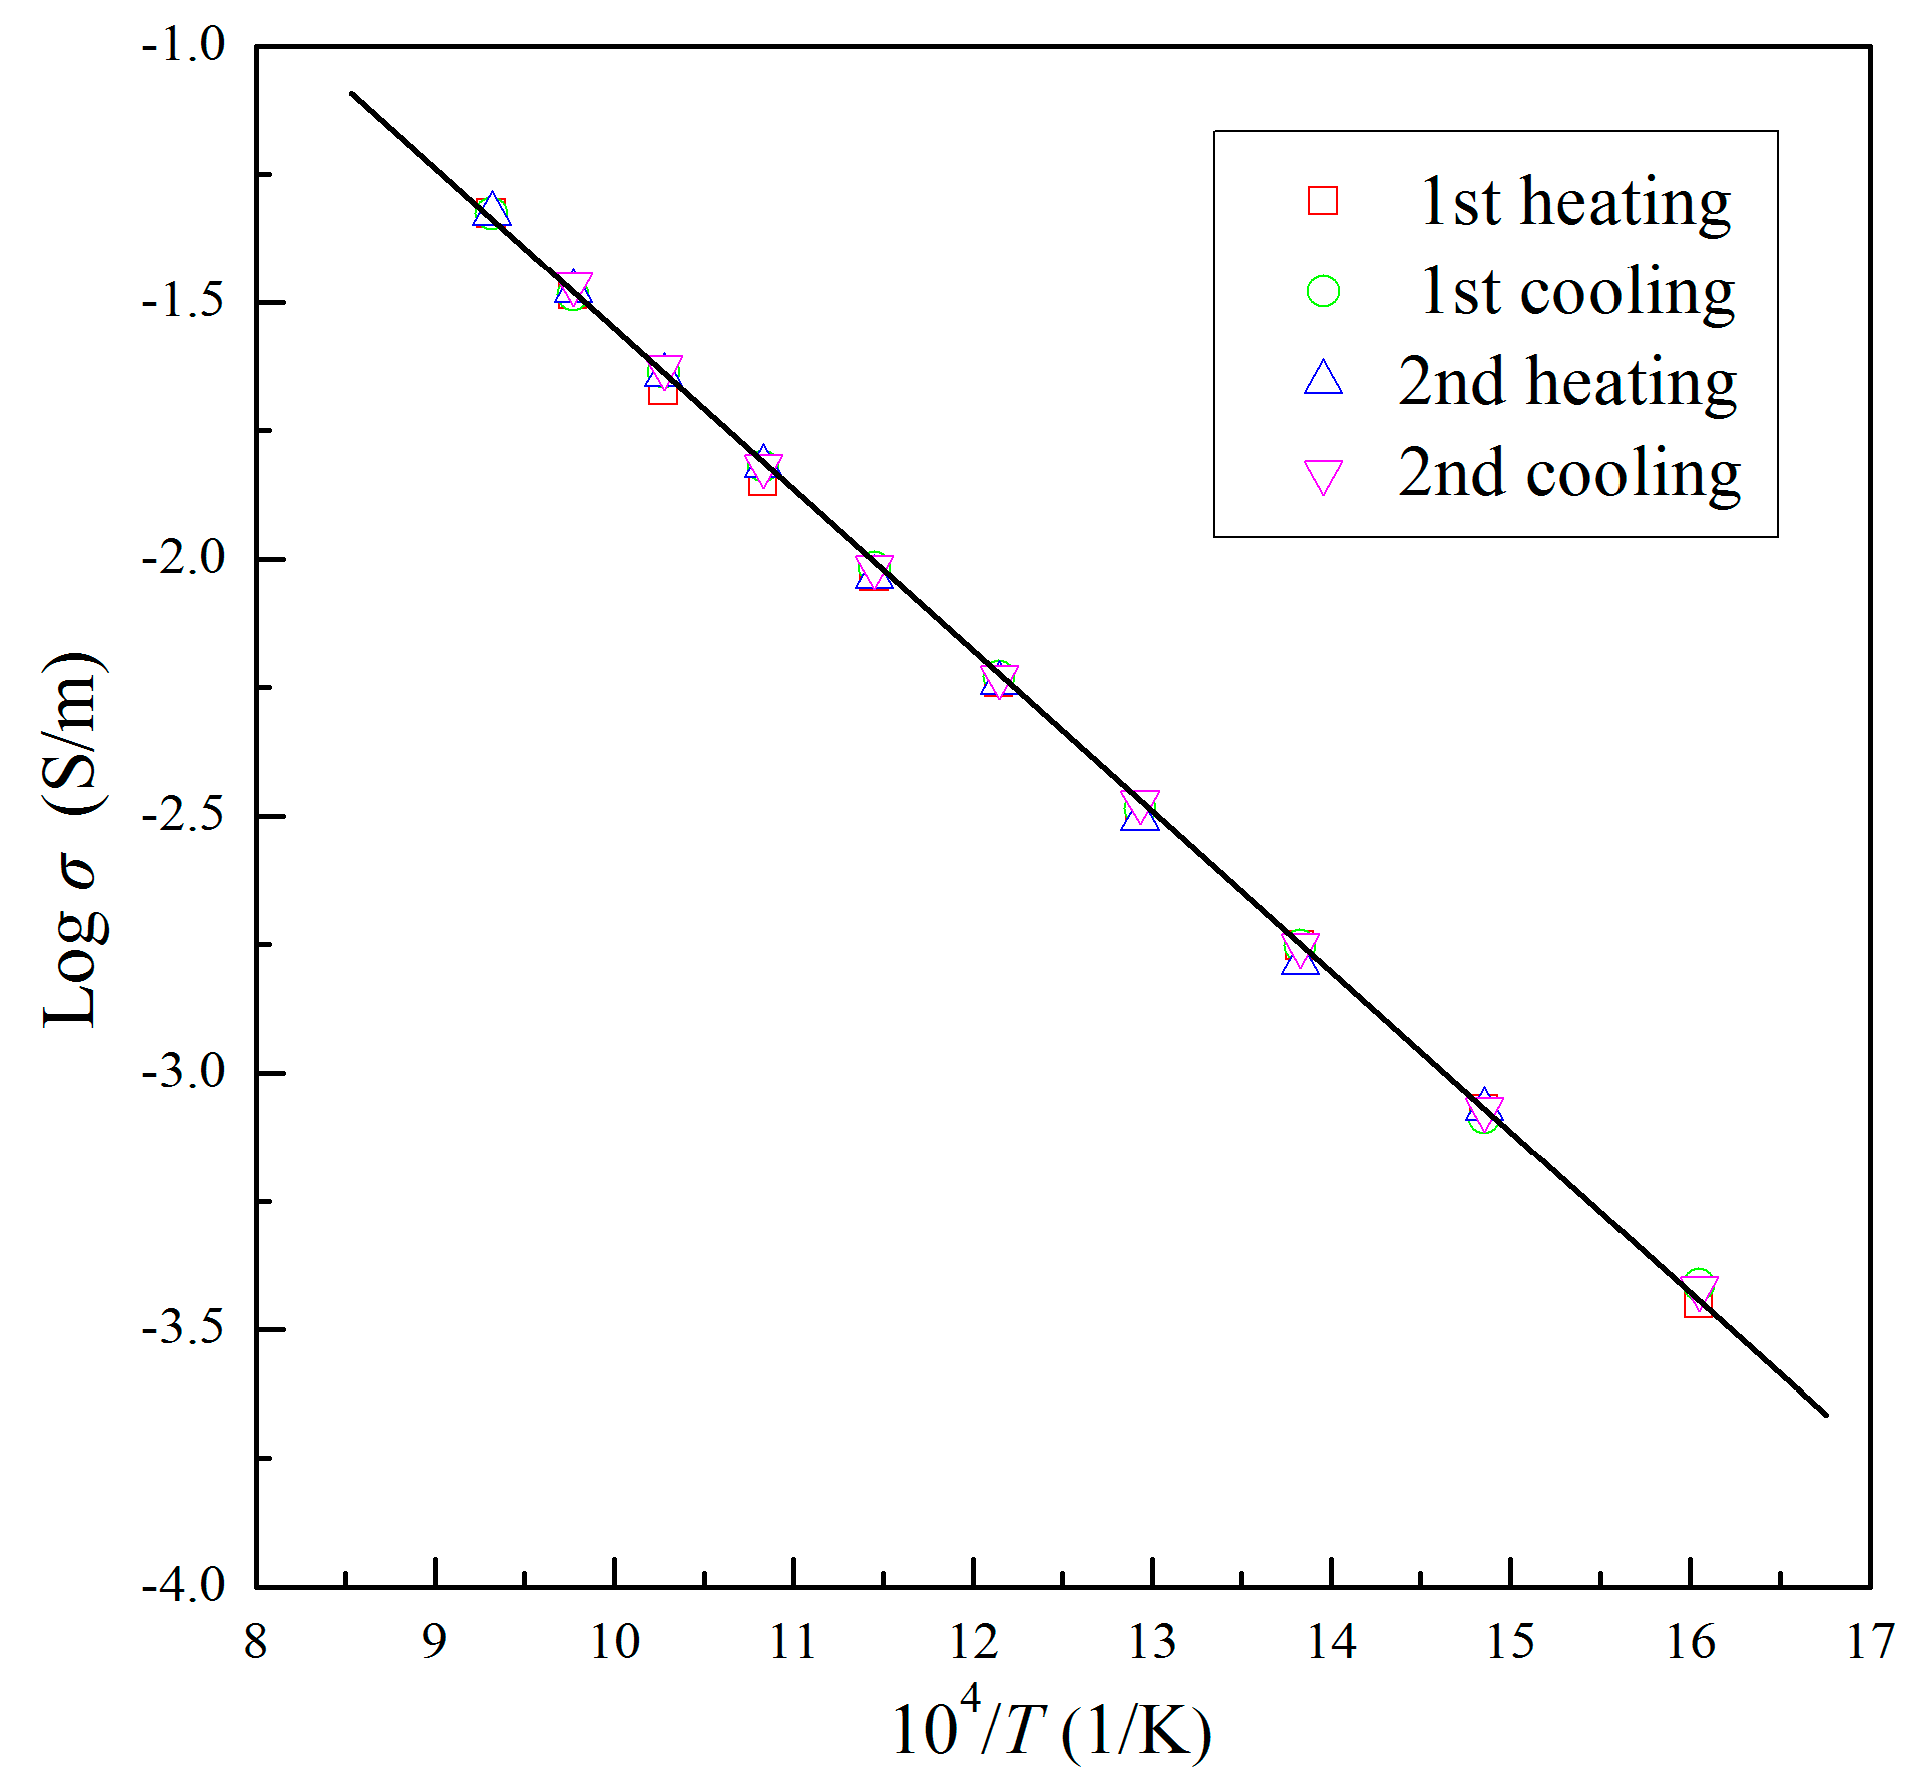
3. Results
4. Discussion
4.1. Comparison with Previous Studies
4.2. Conduction Mechanism
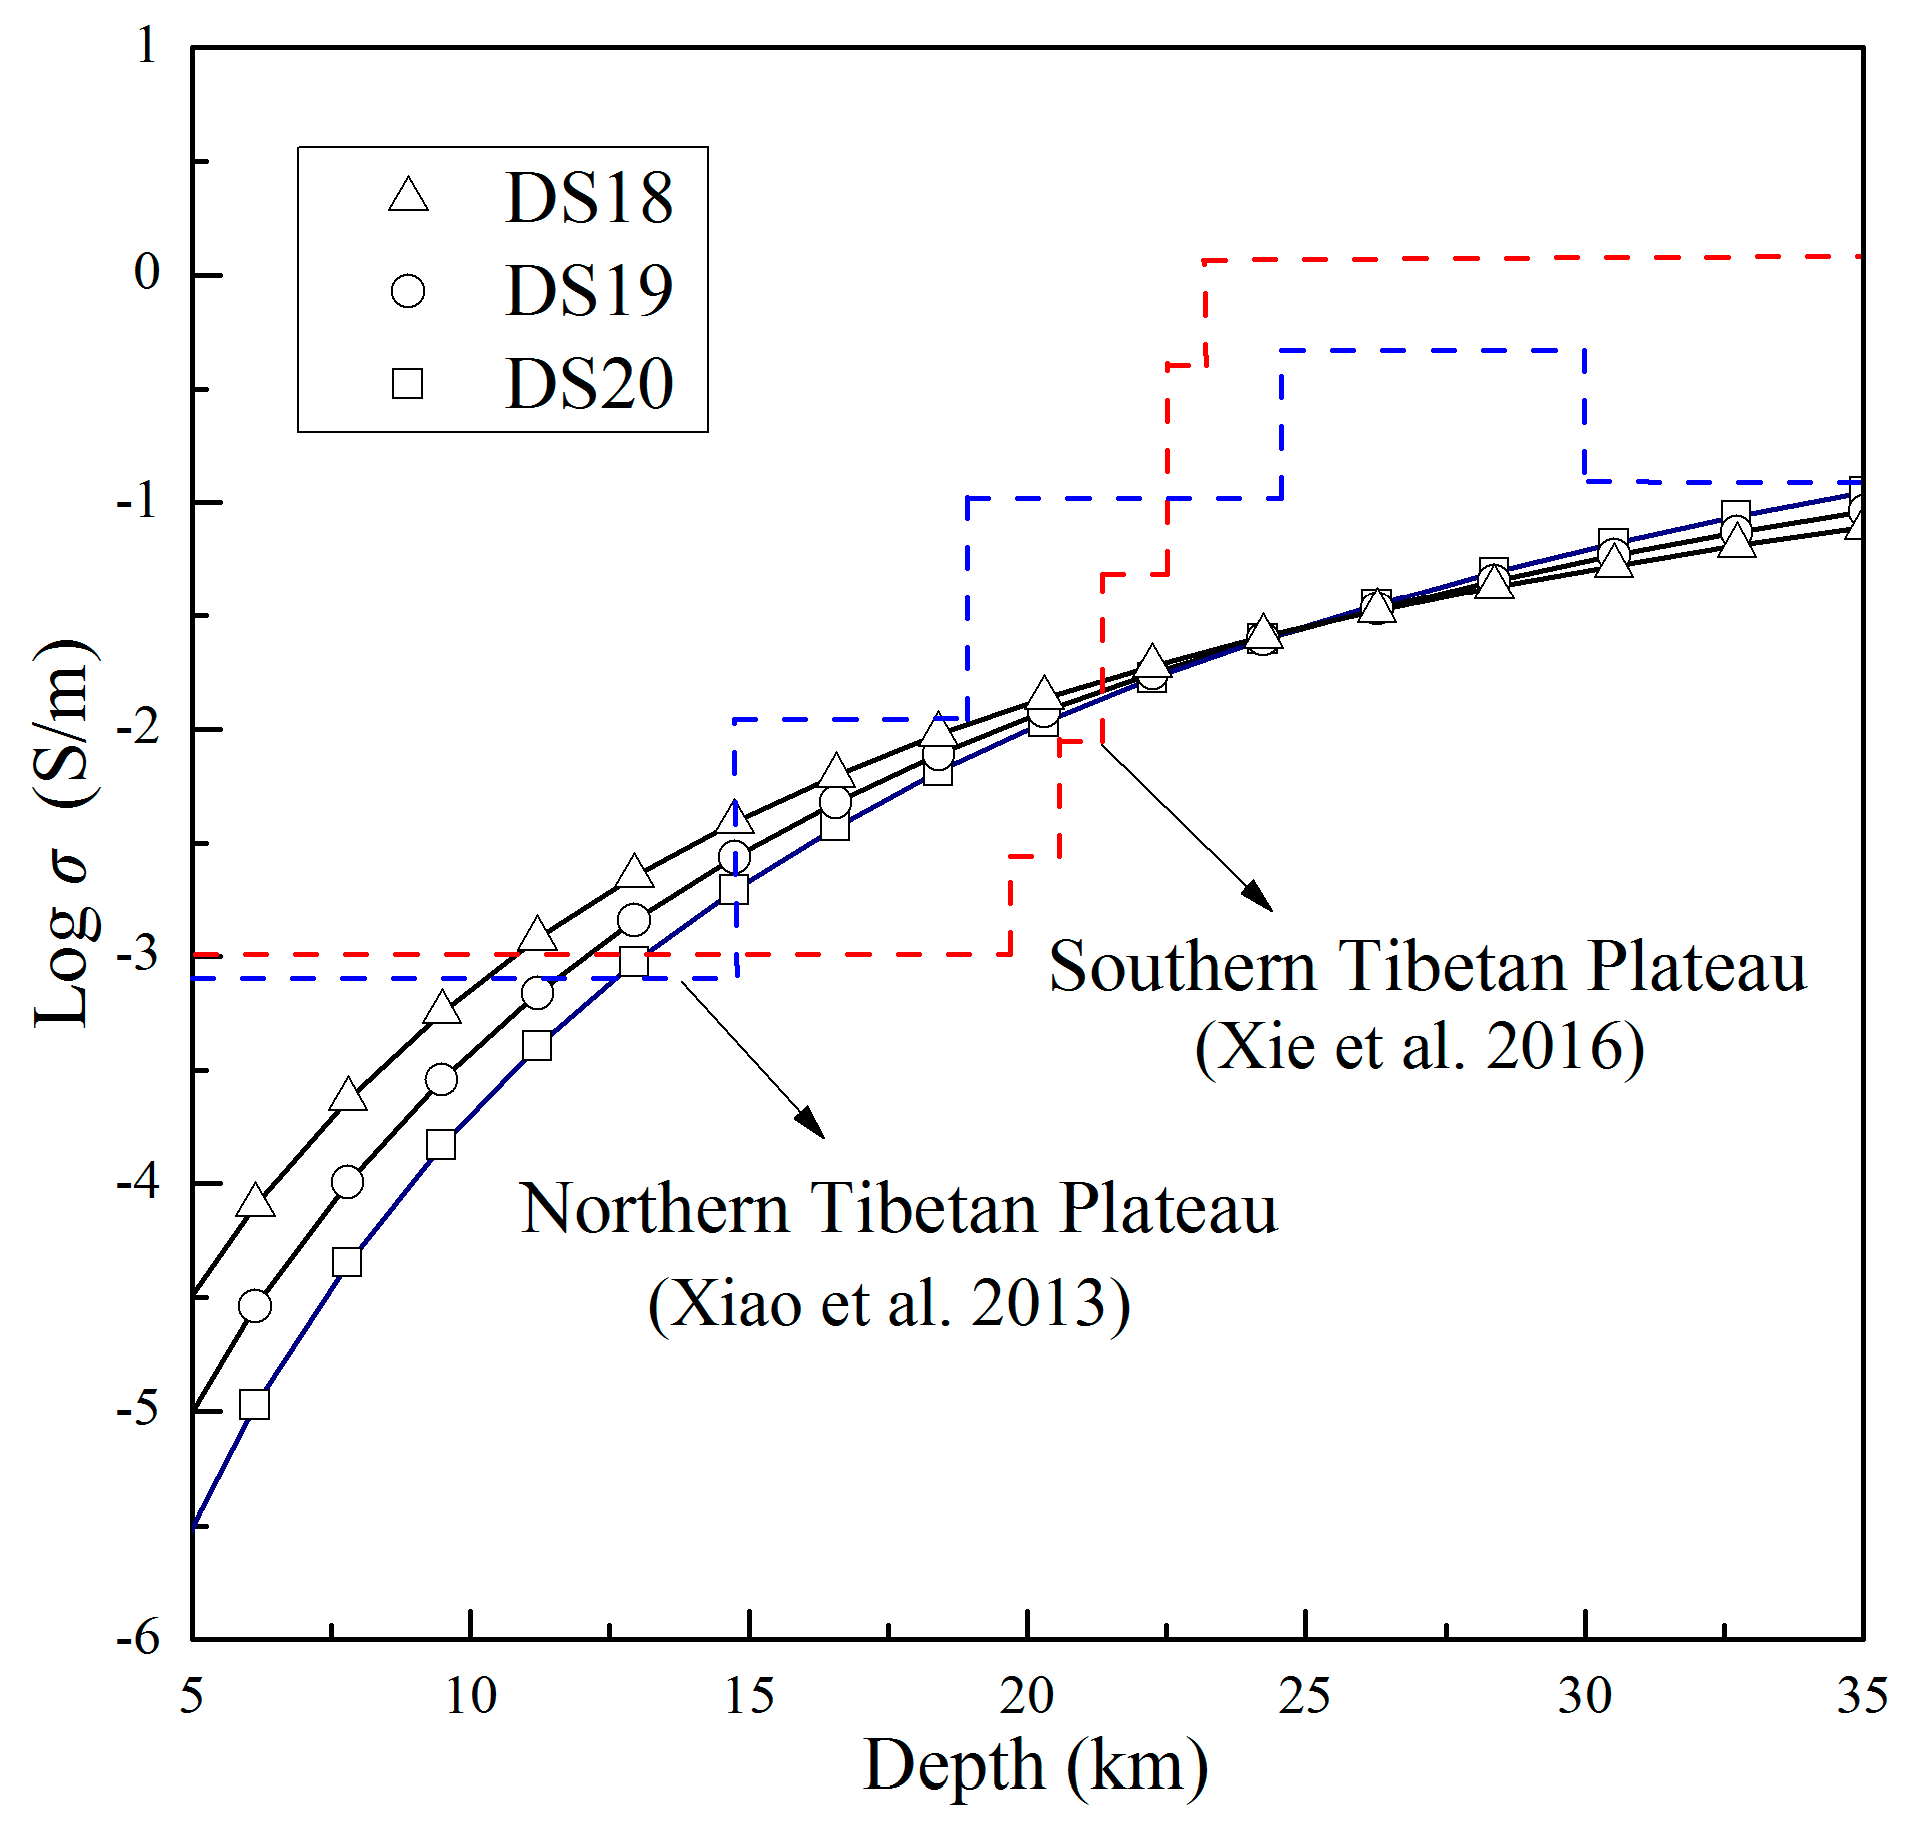
5. Geophysical Implications
6. Conclusions
Author Contributions
Funding
Acknowledgments
Conflicts of Interest
References
- Dai, L.D.; Karato, S.I. Influence of FeO and H on the electrical conductivity of olive. Phys. Earth Planet. Inter. 2014, 237, 73–79. [Google Scholar] [CrossRef]
- Dai, L.D.; Hu, H.Y.; Li, H.P.; Jiang, J.J.; Hui, K.S. Influence of temperature, pressure, and chemical composition on the electrical conductivity of granite. Am. Mineral. 2014, 99, 1420–1428. [Google Scholar] [CrossRef]
- Hu, H.Y.; Dai, L.D.; Li, H.P.; Hui, K.S.; Sun, W.Q. Influence of dehydration on the electrical conductivity of epidote and implications for high conductivity anomalies in subduction zones. J. Geophys. Res. Solid Earth 2017, 122, 2751–2762. [Google Scholar] [CrossRef]
- Huang, X.G.; Xu, Y.S.; Karato, S.I. Water content in the transition zone from electrical conductivity of wadsleyite and ringwoodite. Nature 2005, 434, 746–749. [Google Scholar] [CrossRef] [PubMed]
- Saltas, V.; Chatzistamou, V.; Pentari, D.; Paris, E.; Triantis, D.; Fitilis, I.; Vallianatos, F. Complex electrical conductivity measurements of a KTB amphibolite sample at elevated temperatures. Mater. Chem. Phys. 2013, 139, 169–175. [Google Scholar] [CrossRef]
- Saltas, V.; Fitilis, I.; Vallianatos, F. A combined complex electrical impedance and acoustic emission study in limestone samples under uniaxial loading. Tectonophysics 2014, 637, 198–206. [Google Scholar] [CrossRef]
- Saltas, V.; Vallianatos, F.; Soupios, P.; Makris, J.P.; Triantis, D. Dielectric and conductivity measurements as proxy method to monitor contamination in sandstone. J. Hazard. Mater. 2007, 142, 520–525. [Google Scholar] [CrossRef]
- Wang, D.J.; Li, H.P.; Matsuzaki, T.; Yoshino, T. Anisotropy of synthetic quartz electrical conductivity at high pressure and temperature. J. Geophys. Res.: Solid Earth 2010, 115, B09211. [Google Scholar] [CrossRef]
- Li, Y.; Yang, X.Z.; Yu, J.H.; Cai, Y.F. Unusually high electrical conductivity of phlogopite: the possible role of fluorine and geophysical implications. Contrib. Mineral. Petrol. 2016, 171, 1–11. [Google Scholar] [CrossRef]
- Li, Y.; Jiang, H.T.; Yang, X.Z. Fluorine follows water: Effect on electrical conductivity of silicate minerals by experimental constraints from phlogopite. Geochim. Cosmochim. Ac. 2017, 217, 16–27. [Google Scholar] [CrossRef]
- Liu, H.Y.; Zhu, Q.; Yang, X.Z. Electrical conductivity of fluorite and fluorine conduction. Minerals 2019, 9, 72. [Google Scholar] [CrossRef]
- Yan, D.P.; Zhou, M.F.; Robinson, P.T.; Grujic, D.; Malpas, J.; Kennedy, A. Constraining the mid-crustal channel flow beneath the Tibetan Plateau: Data from the Nielaxiongbo gneiss dome, SE Tibet. Int. Geol. Rev. 2012, 54, 615–632. [Google Scholar] [CrossRef]
- He, D.F.; Dong, Y.P.; Liu, X.M.; Yang, Z.; Sun, S.S.; Cheng, B. Tectono-thermal events in East Kunlun, Northern Tibetan Plateau: Evidence from zircon U–Pb geochronology. Gondwana Res. 2016, 30, 179–190. [Google Scholar] [CrossRef]
- Liu, C.F.; Wu, C.; Zhou, Z.G.; Yan, Z.; Jiang, T.; Song, Z.J. U–Pb detrital zircon geochronology from the basement of the Central Qilian Terrane: Implications for tectonic evolution of northeastern Tibetan Plateau. Int. J. Earth Sci. 2018, 107, 673–686. [Google Scholar] [CrossRef]
- Fuji-ta, K.; Katsura, T.; Tainosho, Y. Electrical conductivity measurement of granulite under mid- to lower crustal pressure-temperature conditions. Geophys. J. Int. 2004, 157, 79–86. [Google Scholar] [CrossRef] [Green Version]
- Fuji-ta, K.; Katsura, T.; Matsuzaki, T.; Ichiki, M.; Kobayashi, T. Electrical conductivity measurements of gneiss under mid- to lower crustal P–T conditions. Tectonophysics 2007, 434, 93–101. [Google Scholar] [CrossRef]
- Dai, L.D.; Hu, H.Y.; Li, H.P.; Wu, L.; Hui, K.S.; Jiang, J.J. Influence of temperature, pressure, and oxygen fugacity on the electrical conductivity of dry eclogite, and geophysical implications. Geochem. Geophys. Geosyst. 2016, 17, 2394–2407. [Google Scholar] [CrossRef]
- Dai, L.D.; Sun, W.Q.; Li, H.P.; Hu, H.Y.; Wu, L.; Jiang, J.J. Effect of chemical composition on the electrical conductivity of gneiss at high temperatures and pressures. Solid Earth 2018, 9, 233–245. [Google Scholar] [CrossRef] [Green Version]
- Roberts, J.J.; Tyburczy, J.A. Frequency dependent electrical properties of polycrystalline olivine compacts. J. Geophys. Res. Solid Earth 1991, 96, 16205–16222. [Google Scholar] [CrossRef]
- Hu, H.Y.; Dai, L.D.; Li, H.P.; Sun, W.Q.; Li, B.S. Effect of dehydrogenation on the electrical conductivity of Fe-bearing amphibole: Implications for high conductivity anomalies in subduction zones and continental crust. Earth Planet. Sci. Lett. 2018, 498, 27–37. [Google Scholar] [CrossRef]
- Xu, Y.S.; Shankland, T.J.; Duba, A.G. Pressure effect on electrical conductivity of mantle olivine. Phys. Earth Planet. Inter. 2000, 118, 149–161. [Google Scholar] [CrossRef]
- Hu, H.Y.; Li, H.P.; Dai, L.D.; Shan, S.M.; Zhu, C.M. Electrical conductivity of albite at high temperatures and high pressures. Am. Mineral. 2011, 96, 1821–1827. [Google Scholar] [CrossRef]
- Hu, H.Y.; Li, H.P.; Dai, L.D.; Shan, S.M.; Zhu, C.M. Electrical conductivity of alkali feldspar solid solutions at high temperatures and high pressures. Phys. Chem. Minerals 2013, 40, 51–62. [Google Scholar] [CrossRef]
- Zhu, M.X.; Xie, H.S.; Guo, J.; Zhang, Y.M.; Xu, Z.M. Electrical conductivity measurement of serpentine at high temperature and pressure. Chinese Sci. Bull. 1999, 44, 1903–1907. [Google Scholar] [CrossRef]
- Guo, X.Z.; Yoshino, T.; Katayama, I. Electrical conductivity anisotropy of deformed talc rocks and serpentinites at 3 GPa. Phys. Earth Planet. Inter. 2011, 188, 60–81. [Google Scholar] [CrossRef]
- Wang, D.J.; Guo, X.Y.; Yu, Y.J.; Karato, S.I. Electrical conductivity of amphibole-bearing rocks: Influence of dehydration. Contrib. Mineral. Petrol. 2012, 164, 17–25. [Google Scholar] [CrossRef]
- Wang, D.J.; Liu, X.W.; Liu, T.; Shen, K.W.; Welch, D.O.; Li, B.S. Constraints from the dehydration of antigorite on high conductivity anomalies in subduction zones. Sci. Rep. 2017, 7, 16893. [Google Scholar] [CrossRef]
- Manthilake, G.; Bolfan-Casanova, N.; Novella, D.; Mookherjee, M.; Andrault, D. Dehydration of chlorite explains anomalously high electrical conductivity in the mantle wedges. Sci. Adv. 2016, 2, e1501631. [Google Scholar] [CrossRef] [Green Version]
- Sun, W.Q.; Dai, L.D.; Li, H.P.; Hu, H.Y.; Wu, L.; Jiang, J.J. Electrical conductivity of mudstone (before and after dehydration at high P-T) and a test of high conductivity layers in the crust. Am. Mineral. 2017, 102, 2450–2456. [Google Scholar] [CrossRef]
- Sun, W.Q.; Dai, L.D.; Li, H.P.; Hu, H.Y.; Jiang, J.J.; Hui, K.S. Effect of dehydration on the electrical conductivity of phyllite at high temperatures and pressures. Miner. Petrol. 2017, 111, 853–863. [Google Scholar] [CrossRef]
- Zhuang, Y.X. The pressure-temperature-space-time (PTSt) evolution of metamorphism and development mechanism of the thermal-structural-gneiss domes in the Chinese Altaids. Acta Geol. Sin. 1994, 68, 35–47. [Google Scholar]
- Li, P.F.; Sun, M.; Rosenbaum, G.; Cai, K.; Yu, K.C. Structural evolution of the Irtysh Shear Zone (northwestern China) and implications for the amalgamation of arc systems in the Central Asian Orogenic Belt. J. Struct. Geol. 2015, 80, 142–156. [Google Scholar] [CrossRef] [Green Version]
- Dong, Y.S.; Li, C.; Chen, H.; Chen, W.; Zhang, Y. Study on geochronology and its geological significance of the Demala Group complex in Chayu area, Southeast Tibetan Plateau. Acta Petrol. Sin. 2011, 27, 1198–1208. [Google Scholar]
- Yin, A.; Harrison, T.M. Geologic evolution of the Himalayan–Tibetan orogen. Annu. Rev. Earth Pl. Sc. 2000, 28, 211–280. [Google Scholar] [CrossRef]
- Hu, X.; Garzanti, E.; Moore, T.; Raffi, I. Direct stratigraphic dating of India–Asia collision onset at the Selandian (middle Paleocene, 59 +/− 1 Ma). Geology 2015, 43, 859–862. [Google Scholar] [CrossRef]
- Xie, C.L.; Jin, S.; Wei, W.B.; Ye, G.F.; Jing, J.E.; Zhang, L.T. Crustal electrical structures and deep processes of the eastern Lhasa terrane in the south Tibetan plateau as revealed by magnetotelluric data. Tectonophysics 2016, 675, 168–180. [Google Scholar] [CrossRef]
- Wei, W.B.; Jin, S.; Ye, G.F.; Deng, M.; Jing, J.E.; Unsworth, M. Conductivity structure and rheological property of lithosphere in southern Tibet inferred from super-broadband magnetotelluric sounding. Sci. China Earth Sci. 2009, 53, 189–202. [Google Scholar] [CrossRef]
- Le Pape, F.; Jones, A.G.; Vozar, J.; Wei, W. Penetration of crustal melt beyond the Kunlun Fault into northern Tibet. Nat. Geosci. 2012, 5, 330–335. [Google Scholar] [CrossRef]
- Newell, D.L.; Jessup, M.J.; Cottle, J.M.; Hilton, D.R.; Sharp, Z.D.; Fischer, T.P. Aqueous and isotope geochemistry of mineral springs along the southern margin of the Tibetan plateau: Implications for fluid sources and regional degassing of CO2. Geochem. Geophys. Geosyst. 2008, 9, Q08014. [Google Scholar] [CrossRef]
- Wang, F.; Liu, F.L.; Liu, P.H.; Shi, J.R.; Cai, J. Petrology, geochemistry, and metamorphic evolution of metasedimentary rocks in the Diancang Shan–Ailao Shan metamorphic complex, Southeastern Tibetan Plateau. J. Asian Earth Sci. 2016, 124, 68–93. [Google Scholar] [CrossRef]
- Xiao, Q.B.; Zhang, J.; Zhao, G.Z.; Wang, J.J. Electrical resistivity structures northeast of the Eastern Kunlun Fault in the Northeastern Tibet: Tectonic implications. Tectonophysics 2013, 601, 125–138. [Google Scholar] [CrossRef]
- Gaillard, F.; Malki, M.; Iacono-Marziano, G.; Pichavant, M.; Scaillet, B. Carbonatite melts and electrical conductivity in the asthenosphere. Science 2008, 322, 1363–1365. [Google Scholar] [CrossRef] [PubMed]
- Padilha, A.L.; Vitorello, I.; Antunes, C.E.; Padua, M.B. Imaging three-dimensional crustal conductivity structures reflecting continental flood basalt effects hidden beneath thick intracratonic sedimentary basin. J. Geophys. Res. Solid Earth 2015, 120, 4702–4719. [Google Scholar] [CrossRef] [Green Version]
- Chen, J.Y.; Yang, X.S.; Chen, J.Y. Experimental studies on the relationship between carbonaceous structure and electrical conductivity of the Longmenshan fault zone. Chinese J. Geophys. 2017, 60, 3475–3492. [Google Scholar]
- Li, P.; Guo, X.Z.; Chen, S.B.; Wang, C.; Yang, J.L.; Zhou, X.F. Electrical conductivity of the plagioclase–NaCl–water system and its implication for the high conductivity anomalies in the mid-lower crust of Tibet Plateau. Contrib. Mineral. Petrol. 2018, 173, 16. [Google Scholar] [CrossRef]
- Selway, K.; Yi, J.; Karato, S.I. Water content of the Tanzanian lithosphere from magnetotelluric data: Implications for cratonic growth and stability. Earth Planet. Sci. Lett. 2014, 388, 175–186. [Google Scholar] [CrossRef]
- Hu, S.B.; He, L.J.; Wang, J.Y. Heat flow in the continental area of China: A new data set. Earth Planet. Sci. Lett. 2000, 179, 407–419. [Google Scholar] [CrossRef]
- Wang, C.Y.; Chen, W.P.; Wang, L.P. Temperature beneath Tibet. Earth Planet. Sci. Lett. 2013, 375, 326–337. [Google Scholar] [CrossRef]
- Zhang, C.; Jiang, G.Z.; Shi, Y.Z.; Wang, Z.T.; Wang, Y.; Li, S.T. Terrestrial heat flow and crustal thermal structure of the Gonghe-Guide area, northeastern Qinghai-Tibetan plateau. Geothermics 2018, 72, 182–192. [Google Scholar] [CrossRef]
- Unsworth, M.J.; Jones, A.G.; Wei, W.; Marquis, G.; Gokarn, S.G.; Spratt, J.E. Crustal rheology of the Himalaya and southern Tibet inferred from magnetotelluric data. Nature 2005, 438, 78–81. [Google Scholar] [CrossRef]


| Sample No. | Mineralogical Assemblage (in Volume Percent, Grain Size) |
|---|---|
| DS18 | Pl (35%, 20 × 10 ‒ 80 × 60 μm2) + Qz (55%, 20 × 20 ‒ 80 × 80 μm2) + Bi (10%, 10 × 5 ‒ 100 × 20 μm2) |
| DS19 | Pl (40%, 20 × 10 ‒ 110 × 80 μm2) + Qz (50%, 20 × 20 ‒ 100 × 100 μm2) + Bi (5%, 10 × 5 ‒ 120 × 20 μm2) |
| DS20 | Pl (50%, 20 × 10 ‒ 60 × 40 μm2) + Qz (30%, 10 × 10 ‒ 60 × 60 μm2) + Bi (20%, 10 × 5 ‒ 50 × 10 μm2) |
| Oxides (wt.%) | DS18 | DS19 | DS20 |
|---|---|---|---|
| SiO2 | 60.53 | 64.79 | 47.99 |
| Al2O3 | 17.44 | 15.62 | 13.50 |
| MgO | 3.76 | 3.18 | 4.50 |
| CaO | 2.62 | 3.25 | 13.35 |
| Na2O | 2.94 | 3.00 | 3.76 |
| K2O | 2.84 | 2.17 | 0.18 |
| Fe2O3 | 7.25 | 5.89 | 10.36 |
| TiO2 | 0.77 | 0.84 | 2.10 |
| Cr2O3 | 0.02 | 0.02 | 0.02 |
| MnO | 0.09 | 0.11 | 0.19 |
| BaO | 0.04 | 0.03 | 0.02 |
| SrO | 0.04 | 0.04 | 0.03 |
| P2O5 | 0.17 | 0.23 | 0.26 |
| SO3 | <0.01 | <0.01 | <0.01 |
| L.O.I | 1.60 | 1.15 | 4.21 |
| Total | 100.11 | 100.33 | 100.47 |
| T (K) | σ (×10−3 S/m) | |||
|---|---|---|---|---|
| 1st Heating | 1st Cooling | 2nd Heating | 2nd Cooling | |
| 623 | 0.35 | 0.38 | / | 0.38 |
| 673 | 0.85 | 0.82 | 0.85 | 0.85 |
| 723 | 1.77 | 1.77 | 1.63 | 1.77 |
| 773 | 3.26 | 3.26 | 3.12 | 3.37 |
| 823 | 5.74 | 5.89 | 5.74 | 5.89 |
| 873 | 9.23 | 9.65 | 9.23 | 9.65 |
| 923 | 14.15 | 15.16 | 15.16 | 15.16 |
| 973 | 21.22 | 23.07 | 22.82 | 23.58 |
| 1023 | 32.65 | 32.65 | 33.16 | 34.23 |
| 1073 | 47.16 | / | 47.16 | / |
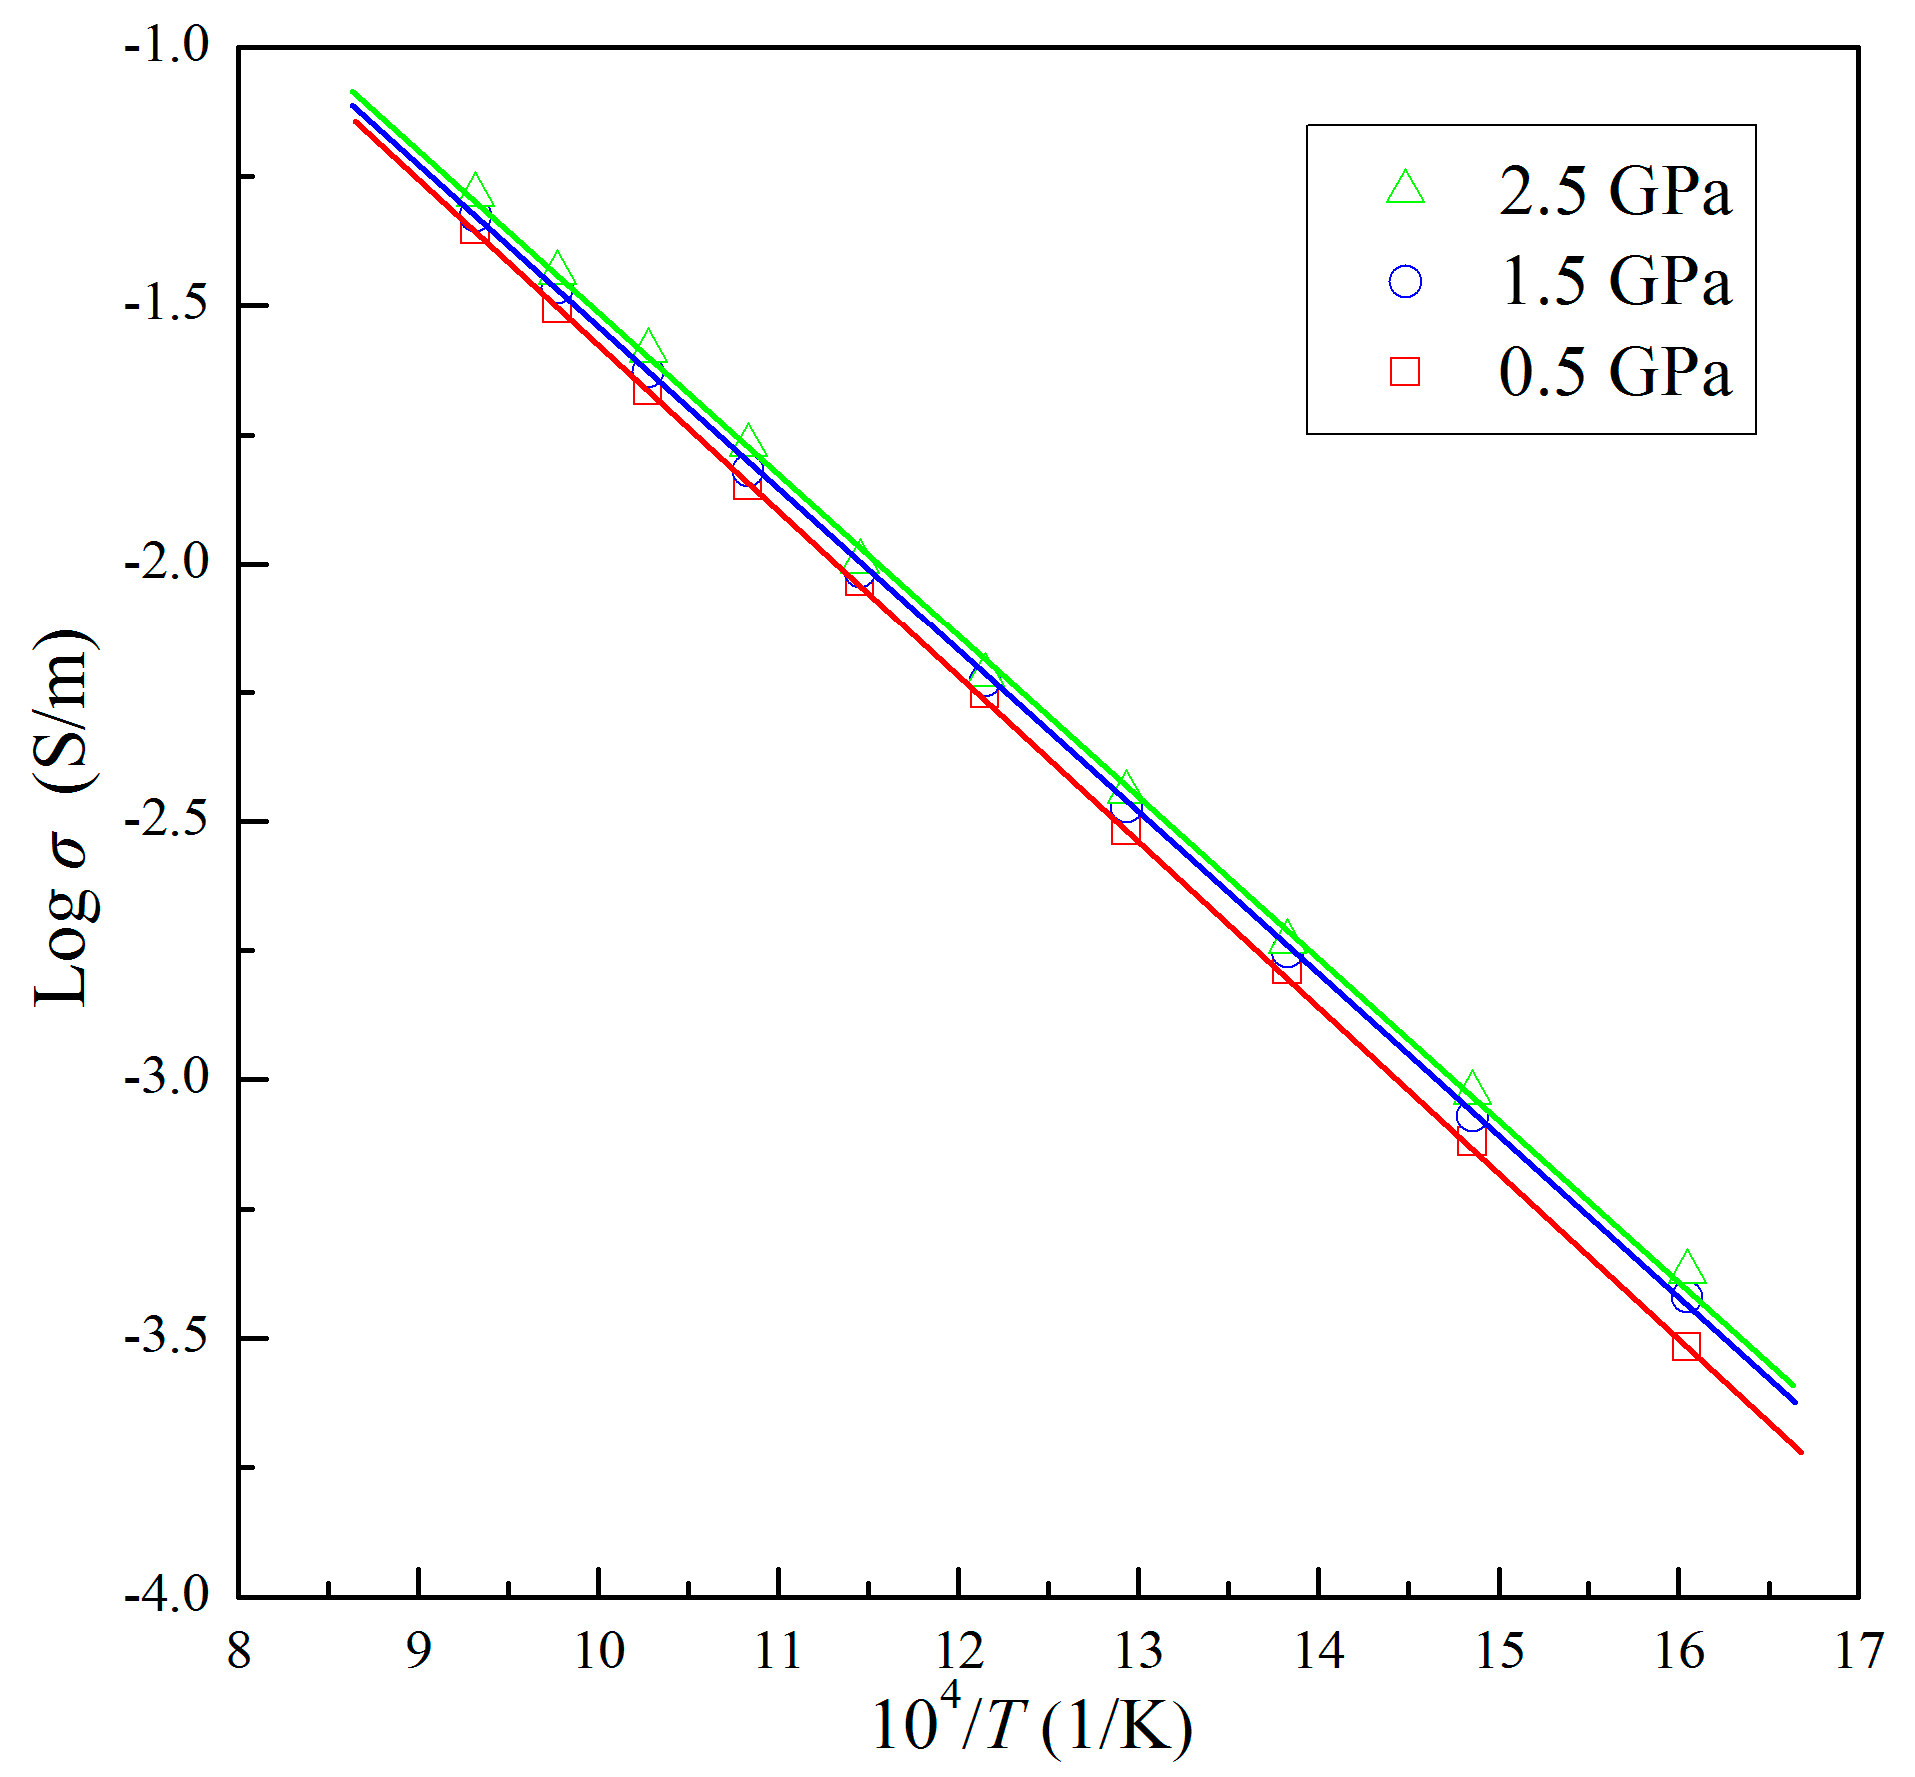
| T (K) | σ (×10−3 S/m) | ||
|---|---|---|---|
| 0. 5 GPa | 1.5 GPa | 2.5 GPa | |
| 623 | 0.30 | 0.38 | 0.42 |
| 673 | 0.76 | 0.85 | 0.94 |
| 723 | 1.63 | 1.77 | 1.85 |
| 773 | 3.03 | 3.37 | 3.60 |
| 823 | 5.58 | 5.89 | 6.06 |
| 873 | 9.23 | 9.65 | 10.11 |
| 923 | 14.15 | 15.16 | 16.98 |
| 973 | 21.65 | 23.58 | 25.88 |
| 1023 | 31.21 | 34.23 | 36.59 |
| 1073 | 44.21 | 47.16 | 51.76 |
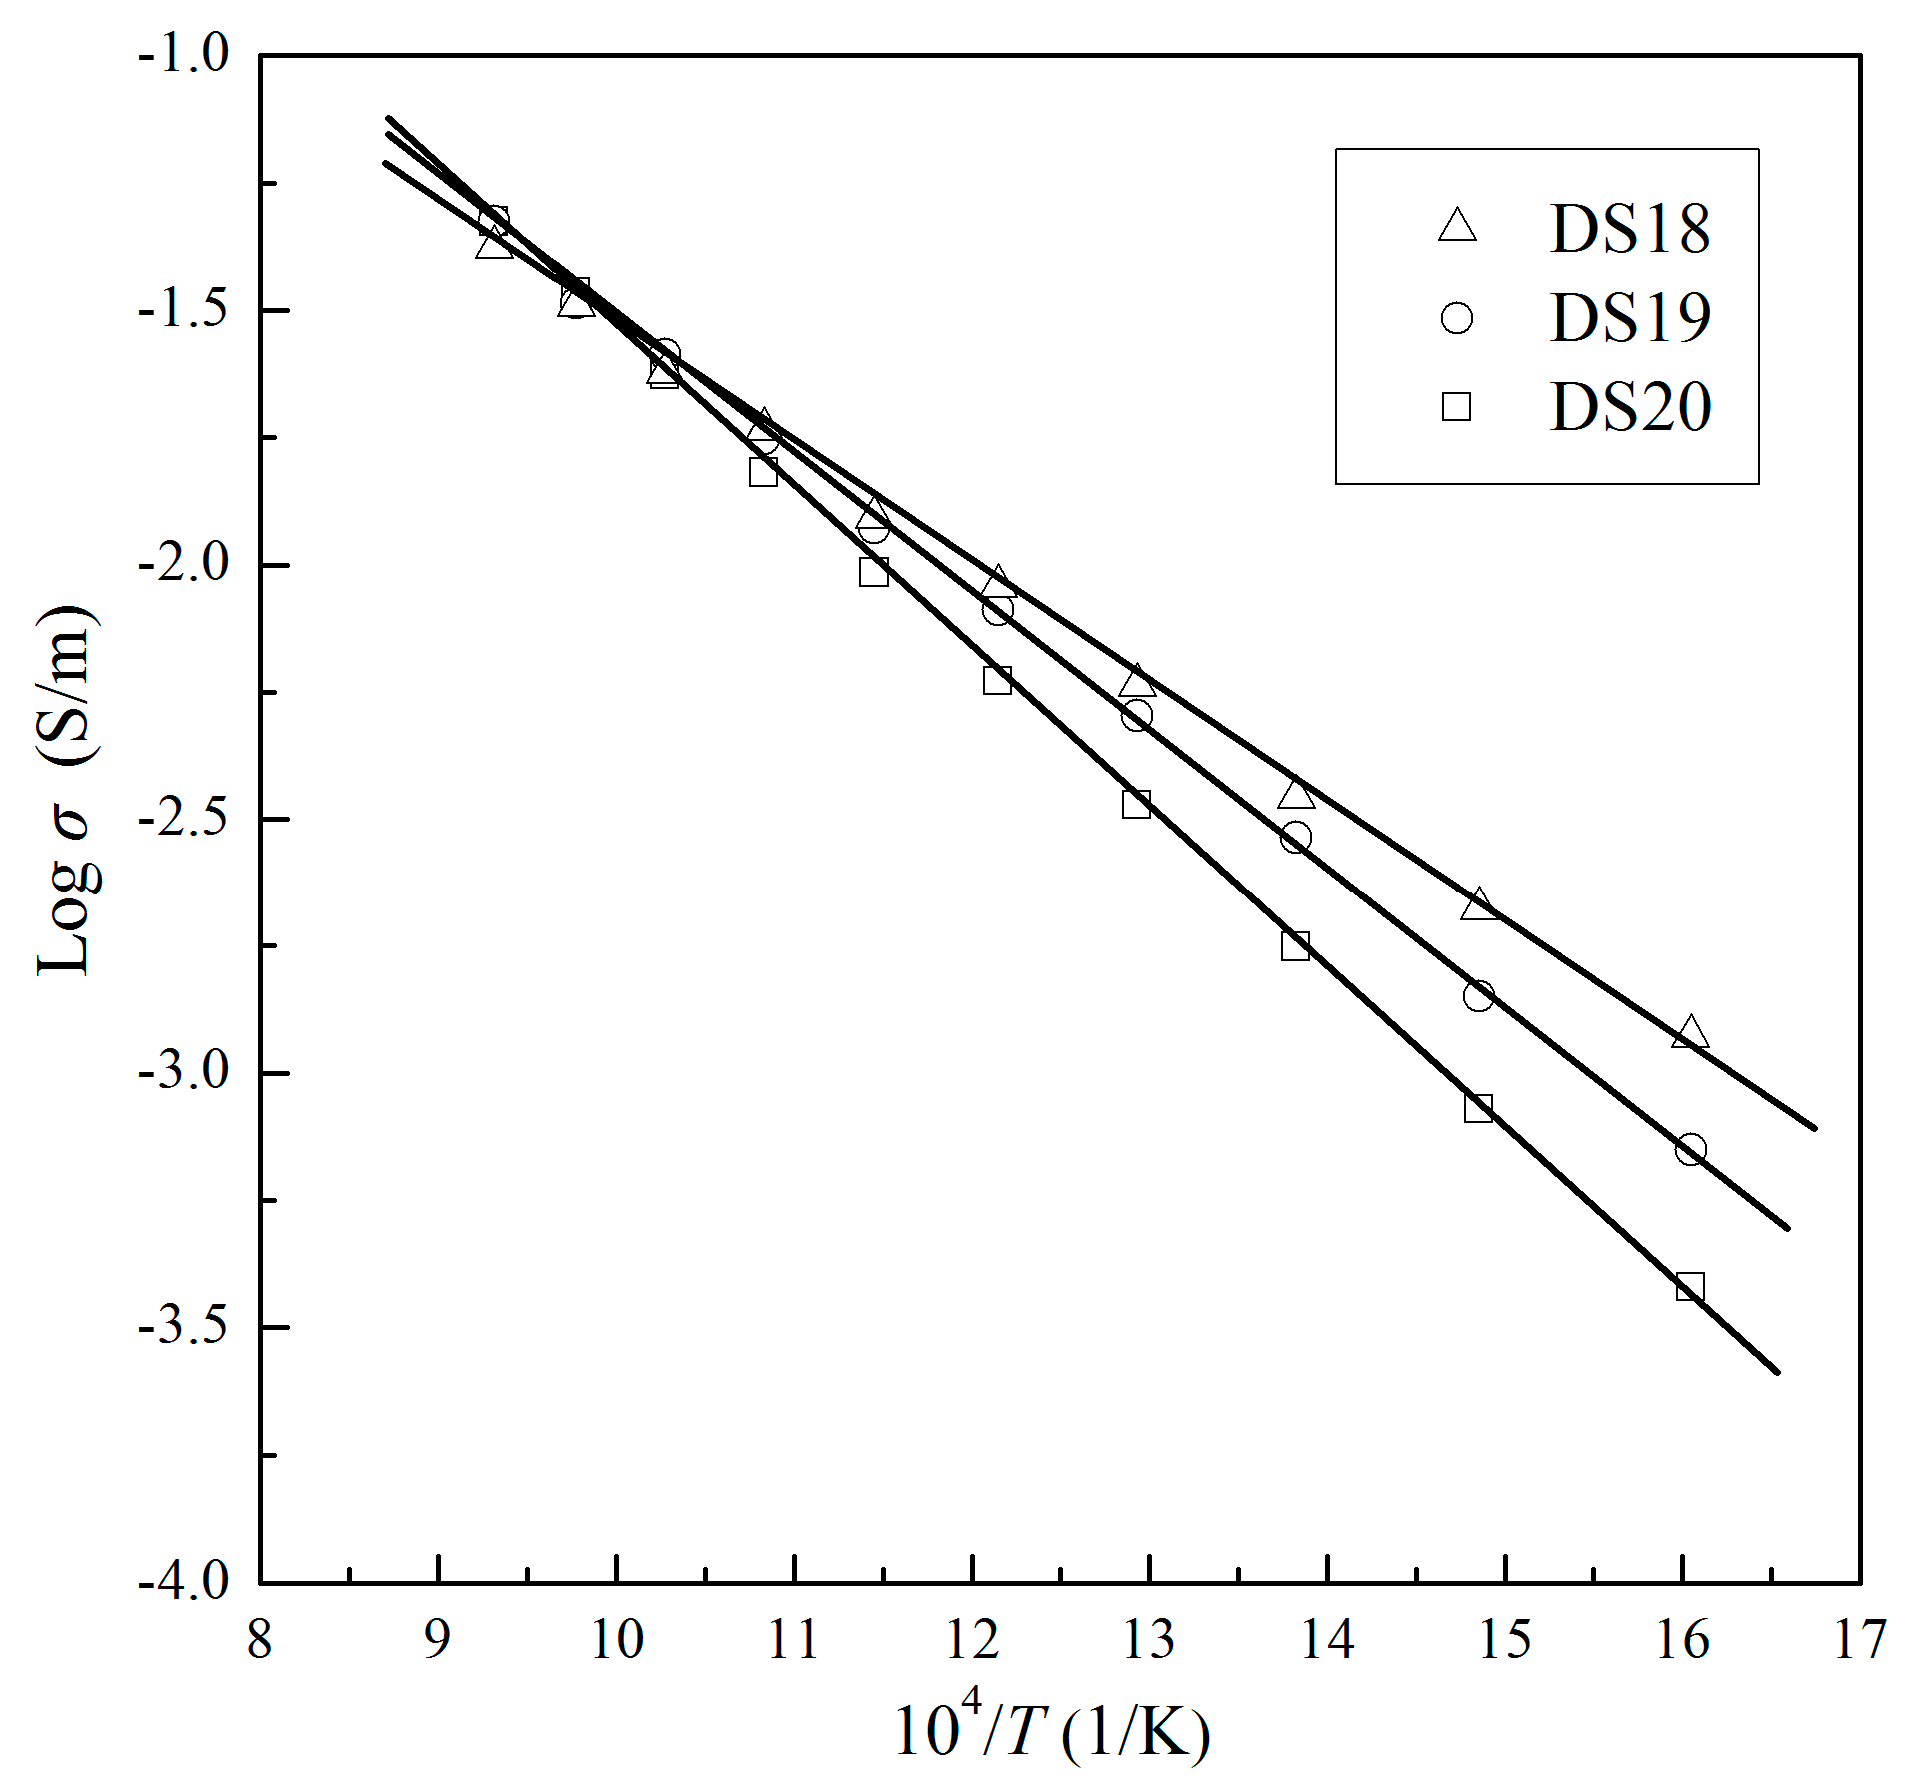
| T (K) | σ (×10−3 S/m) | ||
|---|---|---|---|
| DS18 | DS19 | DS20 | |
| 623 | 1.18 | 0.71 | 0.38 |
| 673 | 2.11 | 1.41 | 0.85 |
| 723 | 3.49 | 2.91 | 1.77 |
| 773 | 5.79 | 5.05 | 3.37 |
| 823 | 9.07 | 8.16 | 5.89 |
| 873 | 12.40 | 11.79 | 9.65 |
| 923 | 18.47 | 17.68 | 15.16 |
| 973 | 23.83 | 25.88 | 23.58 |
| 1023 | 32.34 | 32.65 | 34.23 |
| 1073 | 42.10 | 47.16 | 47.16 |
| Sample No. | P (GPa) | T (K) | Log σ0 (S/m) | ΔH (kJ/mol) | R2 |
|---|---|---|---|---|---|
| DS18 | 1.5 | 623–1073 | 0.77 ± 0.03 | 44.16 ± 0.95 | 99.91 |
| DS19 | 1.5 | 623–1073 | 1.17 ± 0.03 | 51.84 ± 0.94 | 99.92 |
| DS20 | 0.5 | 623–1073 | 1.62 ± 0.01 | 61.44 ± 0.86 | 99.99 |
| 1.5 | 623–1073 | 1.58 ± 0.02 | 59.52 ± 0.90 | 99.97 | |
| 2.5 | 623–1073 | 1.63 ± 0.04 | 59.52 ± 0.96 | 99.90 |
© 2019 by the authors. Licensee MDPI, Basel, Switzerland. This article is an open access article distributed under the terms and conditions of the Creative Commons Attribution (CC BY) license (http://creativecommons.org/licenses/by/4.0/).
Share and Cite
Sun, W.; Dai, L.; Li, H.; Hu, H.; Liu, C.; Wang, M. Effect of Temperature, Pressure, and Chemical Composition on the Electrical Conductivity of Schist: Implications for Electrical Structures under the Tibetan Plateau. Materials 2019, 12, 961. https://doi.org/10.3390/ma12060961
Sun W, Dai L, Li H, Hu H, Liu C, Wang M. Effect of Temperature, Pressure, and Chemical Composition on the Electrical Conductivity of Schist: Implications for Electrical Structures under the Tibetan Plateau. Materials. 2019; 12(6):961. https://doi.org/10.3390/ma12060961
Chicago/Turabian StyleSun, Wenqing, Lidong Dai, Heping Li, Haiying Hu, Changcai Liu, and Mengqi Wang. 2019. "Effect of Temperature, Pressure, and Chemical Composition on the Electrical Conductivity of Schist: Implications for Electrical Structures under the Tibetan Plateau" Materials 12, no. 6: 961. https://doi.org/10.3390/ma12060961