A Multiscale Model of Oxidation Kinetics for Cu-Based Oxygen Carrier in Chemical Looping with Oxygen Uncoupling


1
Key Laboratory for Thermal Science and Power Engineering of Ministry of Education, Department of Energy and Power Engineering, Tsinghua University, Beijing 100084, China
2
Tsinghua University-University of Waterloo Joint Research Center for Micro/Nano Energy & Environment Technology, Tsinghua University, Beijing 100084, China
*
Author to whom correspondence should be addressed.
Materials 2019, 12(7), 1170; https://doi.org/10.3390/ma12071170
Submission received: 23 January 2019
/
Revised: 28 March 2019
/
Accepted: 8 April 2019
/
Published: 10 April 2019
(This article belongs to the Special Issue Micro/Nano Materials for Clean Energy and Environment)
Abstract
:Copper oxide is one of the promising oxygen carrier materials in chemical looping with oxygen uncoupling (CLOU) technology, cycling between Cu2O and CuO. In this study, a multiscale model was developed to describe the oxidation kinetics of the Cu-based oxygen carrier particle with oxygen, including surface, grain, and particle scale. It was considered that the solid product grows with the morphology of disperse islands on the grain surface, and O2 contacts with two different kinds of grain surfaces in the grain scale model, that is, Cu2O surface (solid reactant surface) and CuO surface (solid product surface). The two-stage behavior of the oxidation reaction of the Cu-based oxygen carrier was predicted successfully using the developed model, and the model results showed good agreement with experimental data in the literature. The effects of oxygen partial pressure, temperature, and particle structure on the oxidation performance were analyzed. The modeling results indicated that the transition of the conversion curve occurs when product islands cover most part of the grain surface. The oxygen partial pressure and particle structure have an obvious influence on the duration time of the fast reaction stage. Furthermore, the influence of the external mass transfer and the change of effectiveness factor during the oxidation reaction process were discussed to investigate the controlling step of the reaction. It was concluded that the external mass transfer step hardly affects the reaction performance under the particle sizes normally used in CLOU. The value of the effectiveness factor increases as the reaction goes by, which means the chemical reaction resistance at grain scale increases resulting from the growing number of product islands on the grain surface.
1. Introduction
Chemical looping combustion (CLC) is a new combustion technology [1,2], where oxygen carriers are used to transport oxygen from the air reactor to the fuel reactor through the redox cycle. Compared with traditional CO2 capture technologies, such as pre-combustion capture [3], post-combustion capture [4], and oxy-fuel combustion [5], CLC technology has obvious advantages in reducing the energy consumption of CO2 capture. The chemical looping with oxygen uncoupling (CLOU) concept [6] is based on CLC technology, where the oxygen carriers have oxygen release capacity. Solid fuel can react directly with oxygen released from oxygen carriers in the fuel reactor to improve combustion efficiency. The research results of Mattisson et al. [6] show that when petroleum coke is used as fuel, the conversion of the CLOU process is 50 times higher than that of traditional CLC process. Subsequently, many researchers further explored the oxygen carriers suitable for CLOU technology [7,8,9,10,11,12,13,14,15,16].
The Cu-based oxygen carrier was reported to have a strong oxygen release capacity and fast reaction rate in other research [9,10,11,12,13,14,15,16], and the corresponding redox pair was CuO/Cu2O. Both the oxidation and reduction of Cu-based oxygen carriers are gas-solid reactions. There are a large number of studies on the oxidation or reduction kinetics of Cu-based oxygen carriers. de Diego [11], Goldstein [12], and Gayn [13] used pure CuO as oxygen carriers to conduct the kinetic tests. In addition, researchers [14,15,16] used inert carrier materials and preparation methods to prepare Cu-based oxygen carriers with improved cyclic stability. It was widely found in the experimental results that there is a transition of the kinetics from the initial fast stage to the second slower stage in the conversion curve of the Cu2O oxidation reaction [11,13,14,15,16].
To explain the kinetic behavior of the gas-solid reaction kinetics of the oxygen carrier, many kinds of models were developed. In the research of Clayton et al. [16], two apparent models, pore-blocking model and Avrami-Erofeev model, were used for the oxidation reaction of Cu2O in the lower temperature range (below 700 °C) and higher temperature range (above 800 °C), respectively. García-Labiano et al. [17] and Maya et al. [18] used the grain model to predict the reaction behavior of oxygen carriers. The grain model assumes the particle to be a spherical porous solid particle that consists of numerous small grains within, and each of these grains is described using the unreacted shrinking core model. In addition, Dennis et al. [19] and Liu et al. [20] utilized the pore model to explain the kinetic performance of gas-solid reaction. Nevertheless, the models mentioned above were all focused on the particle scale step, including the external and internal mass transfer, while these models did not consider the microscopic reaction steps taking place on the grain surface and the growth of the solid product, which play an important role in the gas-solid reaction process [21]. Therefore, these models cannot explain the transition phenomenon from the initial fast stage to the second slower stage in the conversion curve from the view of the microscopic reaction process.
In the review paper of Gattinoni et al. [22], recent surface science, spectroscopy, and atomic computation work performed to understand the copper oxidation from the microscopic point of view was summarized and discussed. A good amount of computational work has been performed on the formation of copper oxides, providing important information on surface reaction process. However, few experimental studies are available to either confirm or disprove some computational results obtained at the atomic scale, and the nucleation details of the oxide islands are still unknown. Also, Zhang et al. [23] and Yu et al. [24] applied density functional theory to investigate the oxygen adsorption and dissociation process on the Cu2O surfaces. The calculated results showed that the presence of oxygen vacancy on the surface exhibited a strong chemical reactivity towards the dissociation of O2. Recently, it was found that the solid product showed dispersed and three-dimensional morphology on the solid reactant surface [25,26,27,28]. In addition, a rate equation theory for Fe oxidation was developed to describe the nucleation and growth process of the solid product [25]. However, the above research at microscopic scale did not consider the steps involved at the particle scale, such as particle structure change, external mass transfer, and internal mass transfer, thus could not explain the phenomenon at the macroscopic scale and the controlling mechanism of the reaction.
The gas-solid reaction of the Cu-based oxygen carrier with oxygen is a multiscale behavior. It is necessary to study the reaction process from multiscale points of view. In this study, a multiscale model, including surface, grain, and particle scale, was established to describe the oxidation reaction of Cu-based oxygen carrier, and the developed model was validated with experimental data in the literature. Then, the model was used to analyze the effects of oxygen partial pressure, temperature, and particle structure on the oxidation reaction behaviors. Further, the controlling step of the oxidation reaction of the Cu-based oxygen carrier particle was discussed.
2. Mathematical Model
In this study, a multiscale model was developed to describe the oxidation reaction of the Cu-based oxygen carrier. The oxidation reaction of the Cu-based oxygen carrier is
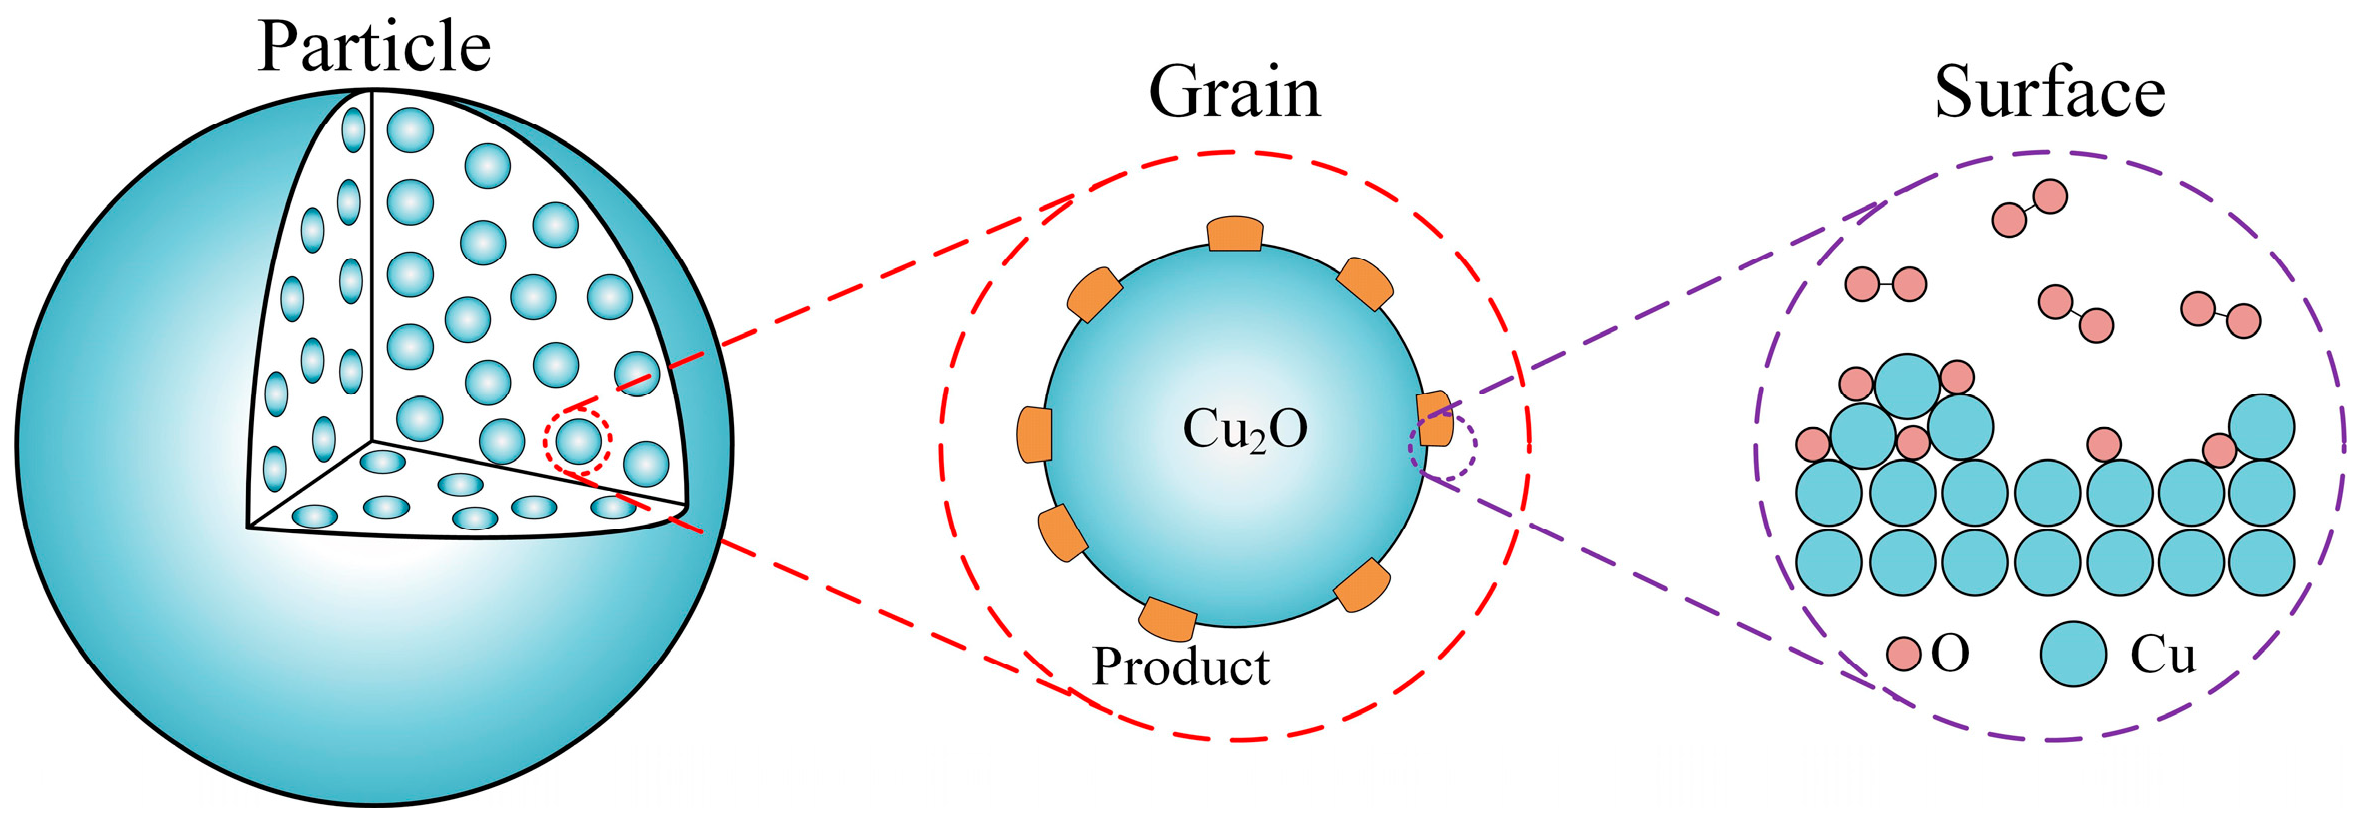
As shown in Figure 1, the oxidation process of the oxygen carrier particle was described at multiscale, that is, surface scale, grain scale, and particle scale. The oxygen carrier particle was considered as spherical porous media, which is composed of a matrix of spherical nonporous grains, and O2 could diffuse into the particle. The interaction of O2 with Cu2O occurs on the grain surface, and the solid product will grow on the grain surface, which can cover the grain surface and result in the change of grain size and an increase of gas diffusion resistance. In the thermogravimetric analysis (TGA) experiments of Clayton et al. [16], it was pointed out that the Cu-based oxygen carrier particle could be considered isothermal during the oxidation process. In addition, in the study of García-Labiano et al. [17], the coupled energy equations were considered in their grain model, and it was also concluded that the oxygen carrier particle could be considered isothermal for most of the reactions in a chemical looping combustion process. Therefore, based on the above studies, the temperature inside the oxygen carrier particle is considered isothermal in the model of this work.
2.1. Model at Surface Scale
Up to now, many theoretical and experimental studies have been reported to investigate the O2 adsorption on Cu-based metal oxide surface [22,23,24,29,30,31,32,33,34]. When the Cu2O surface is exposed to oxygen, oxygen molecules would be absorbed on the surface and generate adsorbed oxygen and oxygen ions [29,30,31,32,33,34]. On the Cu2O-O2 interface, the surface reaction involves several steps [31,32,33]: (R1) O2 gas molecules are adsorbed on the metal oxide surface and decomposed into adsorbed oxygen, O(ads); (R2) O(ads) takes electrons from the metal cations (Cu+) and forms chemically adsorbed oxygen, O−(chem); (R3) O−(chem) further reacts with electrons to form lattice oxygen, O2−(latt). During the reaction, the oxygen from the most outward lattice position would diffuse in the crystal structure to replenish oxygen vacancies. This reaction process can be described as follows.
The reaction rate of step (R1)–(R3) can be given by
where is the reaction rate constant, and the surface site densities are lumped in the reaction rate constant. are the coverage ratios of active sites, O(ads), O−(chem) on the surface, respectively, which satisfy
is the equilibrium partial pressure of O2, which is expressed as [16]
Assuming that R1 and R2 are in chemical equilibrium, and are much less than , and hardly zero. Therefore, the reaction rate of R3 could be obtained by combining Equations (2)–(5):
In the case of , there is
where is the oxygen gas concentration, is the equilibrium oxygen concentration, is the gas constant, and is the temperature.
The reaction rate constants involved in the expression of can be calculated through the atomic computation, as discussed in the review paper of Gattinoni et al. [22]. The surface scale model described above could provide the link between microscopic surface reaction and macroscopic kinetics. However, the atomic computation on the reaction rate constants is not the focus of this work. The value of k is considered as an adjustable parameter in this work.
2.2. Model at Grain Scale
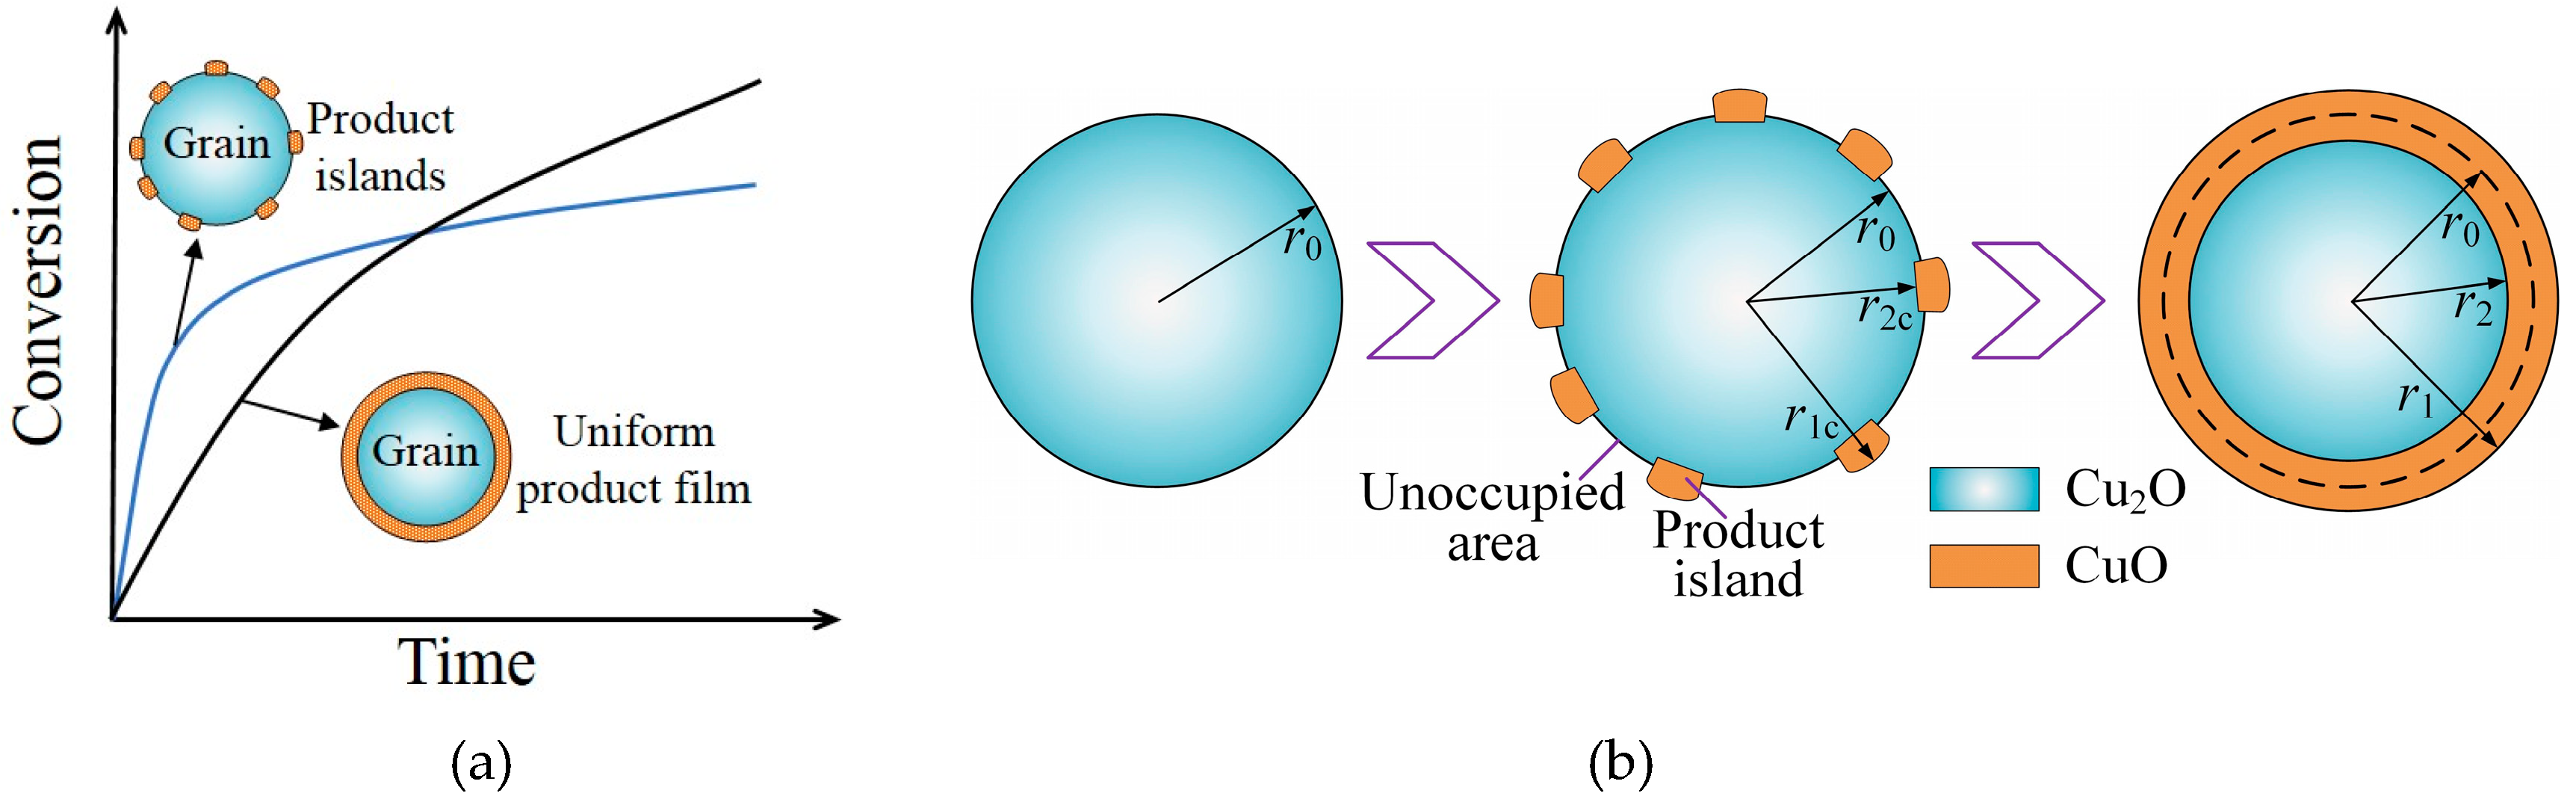
In the traditional grain models [17,18], the solid product is assumed to form and grow in a uniform layer-by-layer mode on the grain surface, and the morphology of the solid product is a nonporous film that covers the unreacted core. The theory of a critical product layer thickness [35] is now used in most grain models to explain the end of the fast reaction period. However, because of the simplified description of solid product formation and growth involved in the initial stage, the traditional grain models cannot explain the kinetics well. The typical conversion curve of oxidation of the Cu-based oxygen carrier shows the two-stage shape. The initial stage of the oxidation reaction is fast, and a high conversion of the particle will be achieved in a relatively short time. The fast stage is followed by a slower stage, where the conversion increases slowly. Because of the assumption of uniform solid product film growth, the traditional grain model cannot describe the transition behavior of the reaction kinetics, as shown in Figure 2a.
By using atomic force microscopy (AFM) and a single crystal sample, it has been proposed in several studies that during the gas-solid reaction process, the solid product grows as dispersed, three-dimensional islands rather than a uniform continuous product layer [25,26,27,28]. All islands show similar shape, which can be explained by the Wuff construction theory [36], and the size of islands increases with the oxidation reaction time [25]. Recently, a rate equation theory of metal oxidation was developed to calculate the solid product nucleation and growth rates [25]. It was proposed that the critical size of product islands is temperature-dependent [37]. Therefore, the assumption of a uniform product film on the grain surface was replaced with the product island morphology in the model, as shown in Figure 2a. As the reaction goes on, the product islands will cover the grain surface and hinder the direct contact of the solid reactant with O2, as shown in Figure 2b, which slows down the reaction rate significantly and results in the transition of the kinetics from the fast stage to the second slower stage.
It is considered that O2 contacts with two different kinds of grain surfaces in the model, that is, Cu2O surface (solid reactant surface) and CuO surface (solid product surface) [22]. In the case of O2 contacting Cu2O surface, the reaction described in Section 2.1 will take place directly on this surface, and product islands will grow on the grain surface meanwhile. The size of the new product island was considered as a critical value of and , as shown in Figure 2b, where is the critical grain radius of Cu2O/CuO interface and is the critical grain radius of CuO/O2 interface. The critical solid reactant layer thickness is described as , where is the initial grain radius. A key parameter at the grain scale in the model is the ratio of the unoccupied area on the grain surface, which is denoted as . By considering the reaction rate of solid reactant and the change rate of the unoccupied area, the expression of can be given as [38]
where is the molar volume of Cu2O (23.87 cm3/mol), is the critical solid reactant layer thickness, and is the reaction time.
In the case of O2 contacting solid product, the charged particles diffusion through the product layer will occur, which can be explained by the Wagner theory [39]. According to the Wagner theory, the diffusion flow rate of metal cations moving through the product layer should be equal to the diffusion flow rate of anions and electrons moving through the product layer to ensure charge conservation. The reaction of metal cations (Cu+) and oxygen happens on the Cu2O/CuO interface. As the reaction goes on, the size of the solid product will increase and be larger than the critical size, as shown in Figure 2b, where is the grain radius of Cu2O/CuO interface and is the grain radius of CuO/O2 interface. In addition, the number of product islands will increase and finally product islands will cover the grain surface completely. By integrating the diffusion flow rate of metal cations (Cu+) through the product layer with the change rate of grain size, the change rate of grain size can be obtained as [38]
where is the diffusivity of metal ions (Cu+) through the product layer, and is the concentration of Cu+ on the Cu2O/CuO interface, which was considered to remain unchanged during the reaction. The initial condition for Equation (10) is . The grain size, , is calculated with the following equation:
where is the stoichiometric molar volume ratio of the solid product to the solid reactant, and is the molar volume of CuO (12.52 cm3/mol).
The local conversion at each position inside the particle is calculated as
The local porosity inside the particle during the reaction is calculated as a function of the initial porosity and the local conversion:
where is the local porosity, is the initial porosity, and is the local conversion.
2.3. Model at Particle Scale
Considering the external gas diffusion, internal gas diffusion, and chemical reaction, the O2 concentration profile inside the particle can be obtained by making a mass balance for the particle:
where is the particle radius. The boundary conditions are as follows:
where is the initial particle radius, and is the concentration of O2 on the particle external surface. The external mass transfer coefficient, , is expressed as a function of Sherwood number:
where is the Sherwood number, is the Reynolds number, and is the Schmidt number. is the gas molecular diffusivity and is given using the equation developed by Fuller et al. [40]:
where is the molar mass of the molecule, is the pressure, and is the diffusion volume for the molecule.
The effective gas diffusivity inside the porous particle is expressed as
The gas diffusivity, , is calculated as a combination of the gas molecular diffusivity and Knudsen diffusivity:
The Knudsen diffusivity, , describes the collision of the gas molecules with the pore wall and is calculated as [41]
where is the universal gas constant. The overall particle conversion, , can be obtained by integrating all local conversions:
3. Results
3.1. Effects of O2 Partial Pressure
The equilibrium curve of oxygen partial pressure in the oxidation reaction can be obtained using Equation (6), as shown in Figure 3. In high-O2 environments (such as the air reactor of a CLOU system), the Cu2O tends to be oxidized by O2, generating CuO. The driving force, which is defined as the difference between the actual partial pressure of oxygen and equilibrium partial pressure of oxygen [16], will affect the oxidation reaction rate of the oxygen carrier particle with O2. When the oxygen particle is in an atmosphere of air, the driving force will decrease with an increase in the temperature.
The experimental data of the TGA in the study of Adánez-Rubio et al. [42] were used to validate the developed model in this study and analyze the effects of O2 partial pressure on the oxidation kinetics of Cu2O. In their experiment, the particles, prepared through calcination of 24 h at 1100 °C, had an average particle size of 200 μm and a porosity of 0.161, and the oxidation experiments were conducted at oxygen concentration values from 2.5 to 21 vol.% at 900 °C. The experimental data and modeling results were compared, as shown in Figure 4. It can be seen that the modeling results agree well with the experimental data and the developed multiscale model can predict the transition of the reaction kinetics from the initial fast stage to the second slower stage successfully. It is clear that the supplied oxygen partial pressure affects the particle conversion significantly. The oxidation reaction rate is fast when the oxygen partial pressure is much higher than the equilibrium oxygen partial pressure but decreases quickly with the decrease in the driving force. Whitty et al. [43] also observed this phenomenon.
The profile of the ratio of the unoccupied area on the grain surface was plotted, as shown in Figure 5. It indicates that the transition of the conversion curve in Figure 4 happens when the product islands cover the grain surface. As observed in Figure 4, the duration time of the fast reaction stage will increase with the decrease in the supplied oxygen partial pressure. The reason is that the change rate of the ratio of the unoccupied area on the grain surface decreases with the decrease in the supplied oxygen partial pressure, as described in Equation (9). In the case of 2.5–4.0 vol.% O2, no transition of the conversion curve happens until 300 s; this is because there is still a part of unoccupied Cu2O surface which can react with O2 directly. In the case of 8.0–21 vol.% O2, the transition of the conversion curve occurs before 300 s when most part of the grain surface is covered by the product islands.
3.2. Effects of Temperature
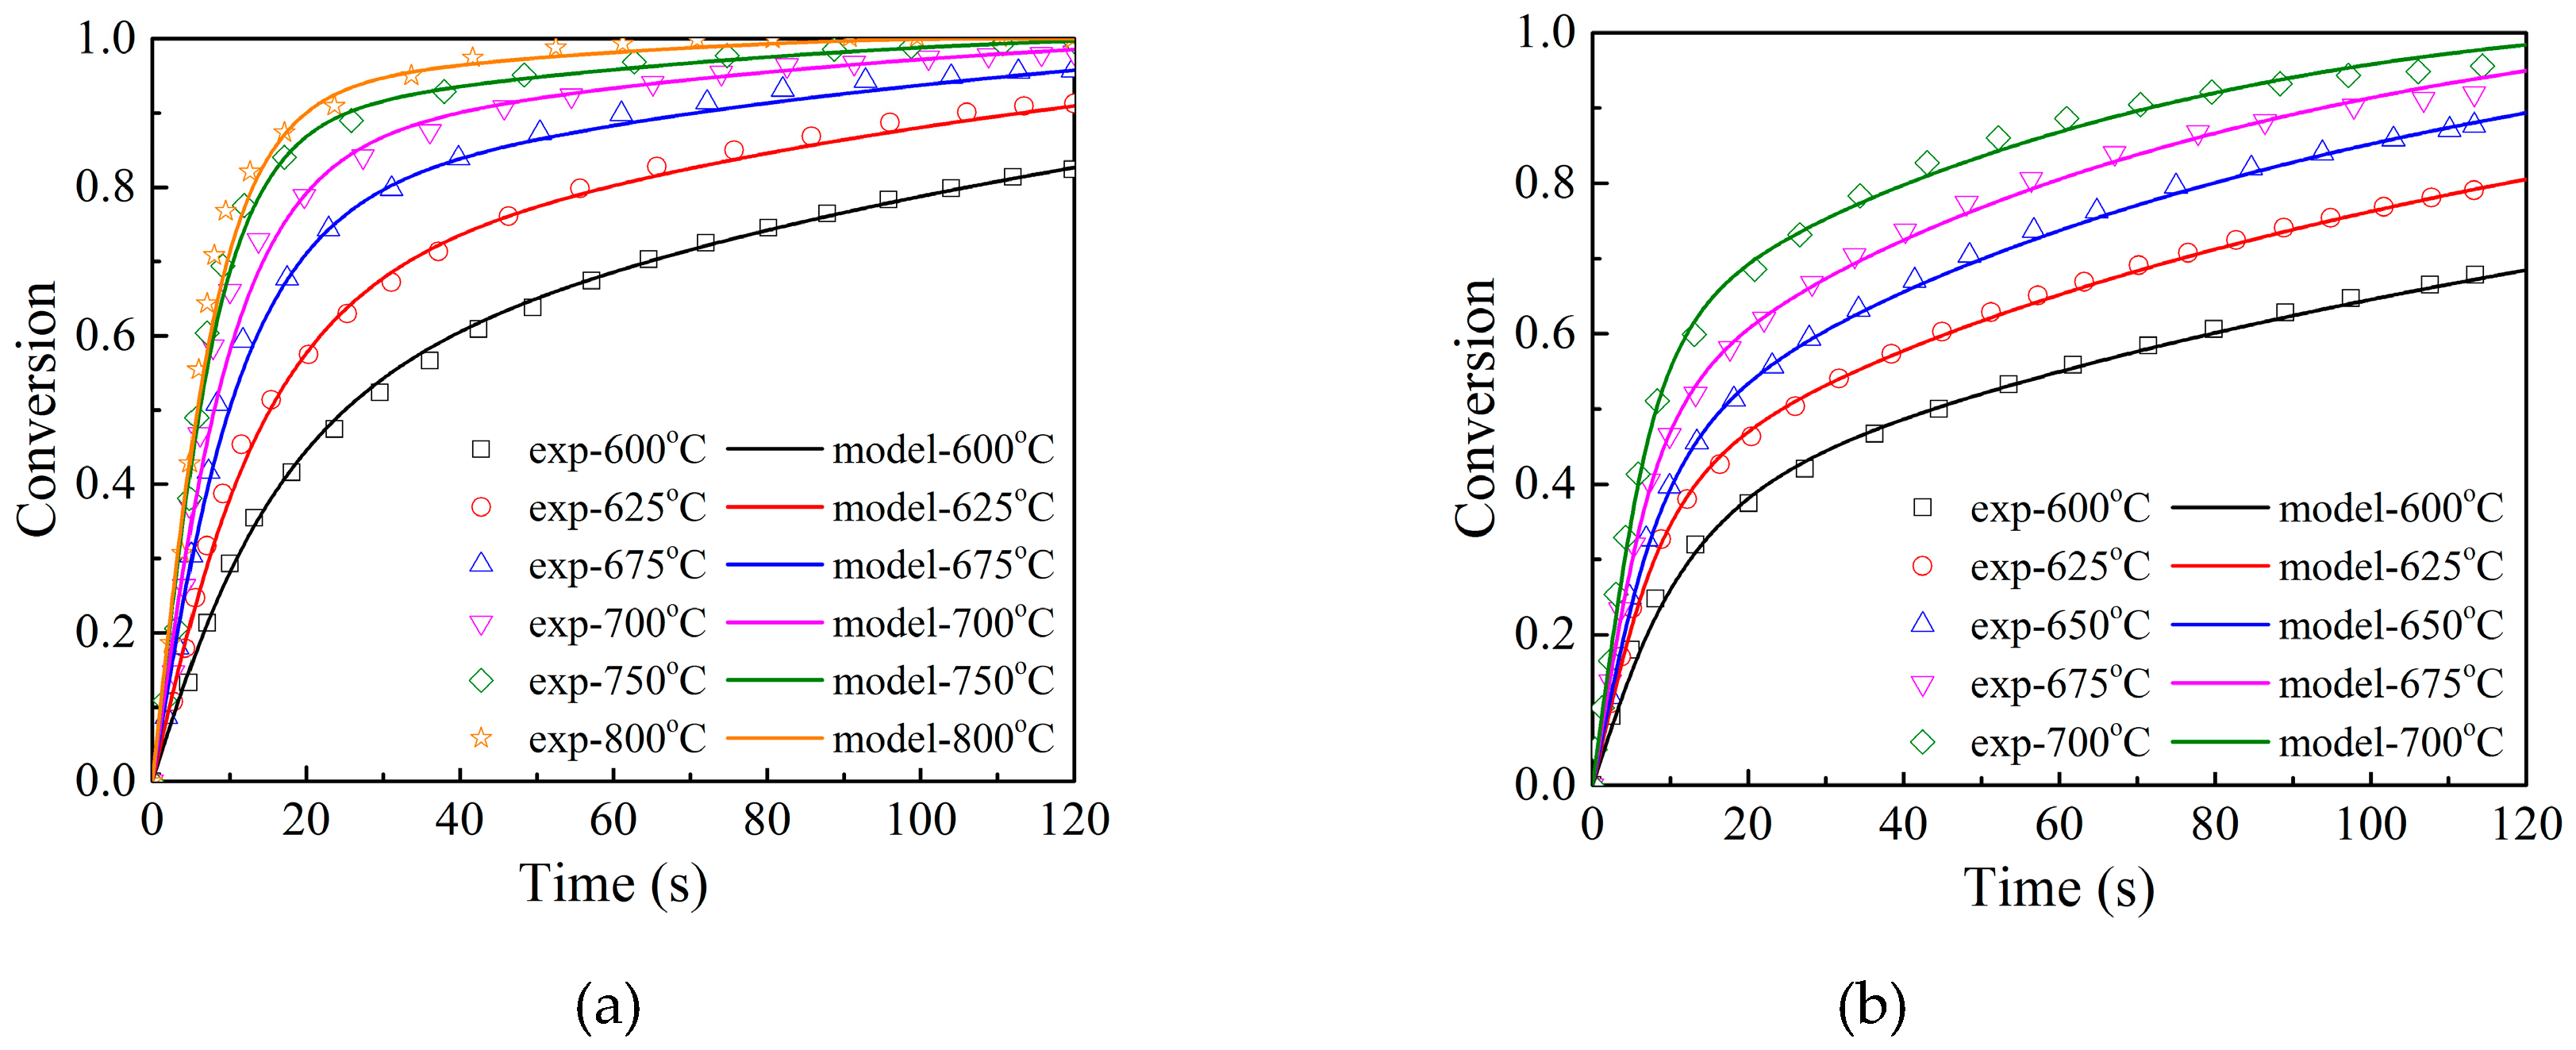
The experimental data of TGA obtained from the research of Clayton et al. [16] were used to validate the developed model and investigate the effects of temperature on the oxidation reaction behavior. In their study, two different Cu-based carriers, named as 50_TiO2 material and 45_ZrO2 material, were tested under different temperatures. The 50_TiO2 material, supported by TiO2, was prepared using the mechanical mixing method, and CuO loading capacity was 50 wt.%. The 45_ZrO2 material, supported by ZrO2/MgO, was prepared using the freeze granulation method, and CuO loading capacity was 45 wt.%. To minimize mass transfer effects, small particle size (~40 μm) and a shallow layer of particles were used.
The calculated results using the multiscale model were compared with the TGA experimental results of Clayton et al. [16], as shown in Figure 6. Figure 6a shows conversion curves of a 50_TiO2 material particle under different temperatures (600–800 °C). Figure 6b shows conversion curves of a 45_ZrO2 material particle under different temperatures (600–700 °C). It shows that the conversion curves obtained from the model calculation agree well with the experimental data. The reaction rate in the initial fast stage is higher when the temperature is higher, although the increased amplitude gradually decreases with the increase in temperature. When the reaction time reaches 120 s, the final conversion increases with the increasing temperature. Comparing the reaction rate in the second lower reaction stage in Figure 6a,b, the reaction rate of a 50_TiO2 material particle is slower than that of the 45_ZrO2 material particle.
In the model calculation, there are three adjustable parameters included in the multiscale model: chemical reaction rate constant, k; the diffusivity of metal ions through the product layer, ; critical reactant layer thickness, hc. These parameters can be written as a function of temperature:
where , , , , and are kinetic parameters, and is the temperature. The relation curves of these parameters obtained in the calculation of Figure 6 versus temperature were plotted, as shown in Figure 7. It can be seen from Equations (23)–(25) that the curves of lnk versus 1/T, lnDs versus 1/T, and hc versus T are linear, and the values of kinetic parameters can be obtained from Figure 7. The kinetic parameters were calculated and shown in Table 1.
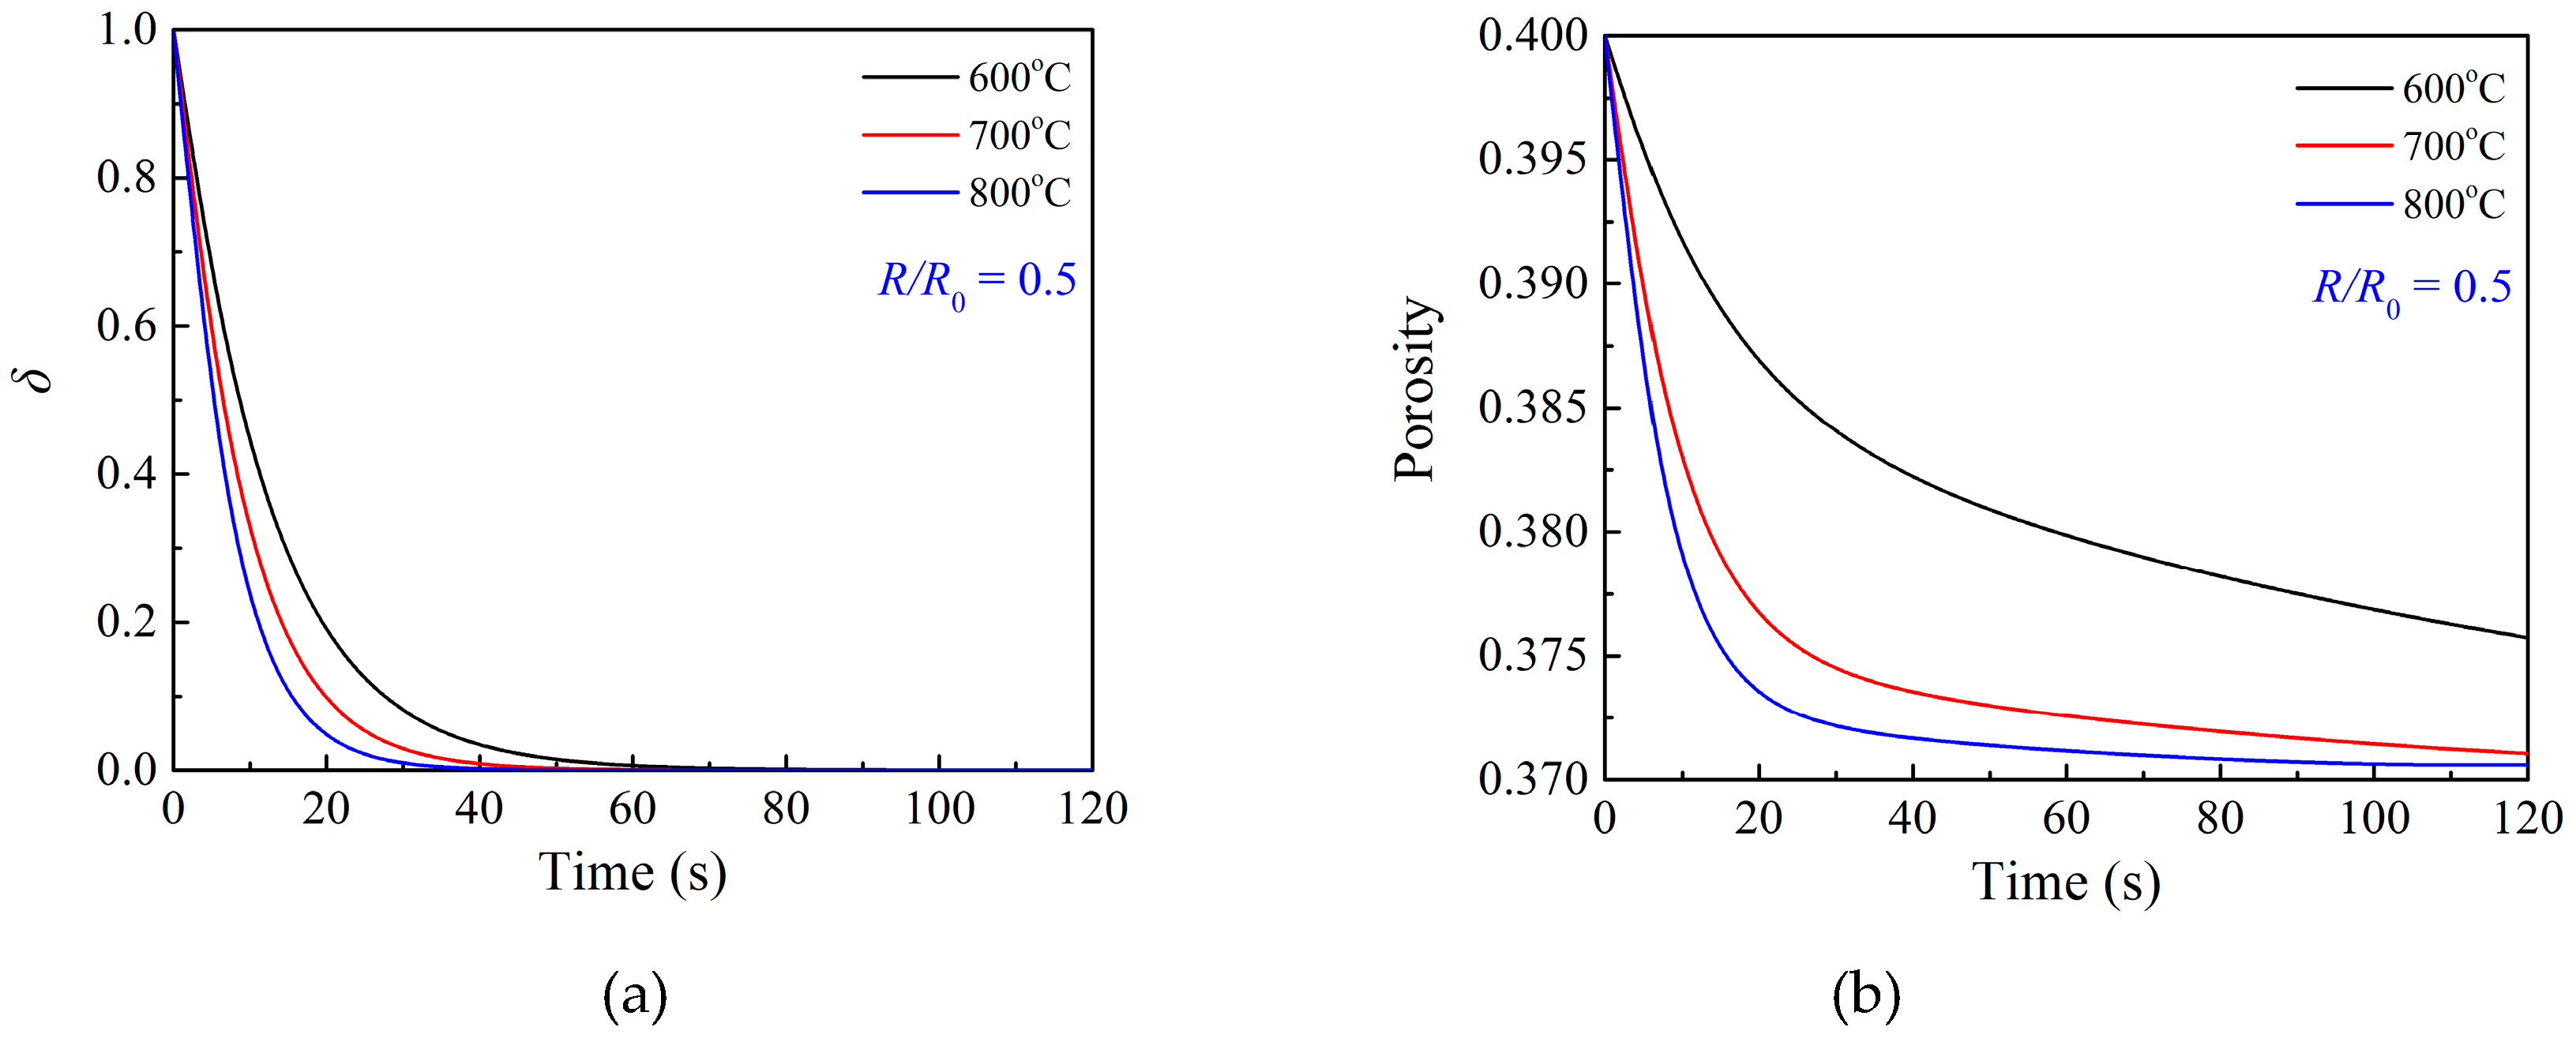
Figure 8 presents the modeling output of the profiles of the ratio of the unoccupied area on grain surface and local porosity during the 50_TiO2_MM material oxidation reaction in Figure 6a. It shows an increase of the temperature will result in a faster reduction of the ratio of the unoccupied area on grain surface because the critical solid reactant layer thickness increases with the increasing temperature [37]. Figure 8b shows the local porosity profile under different temperatures. The solid product has a larger molar volume than the solid reactant, giving rise to a progressive decrease of porosity throughout the sorbent particle. It is clear that the porosity significantly decreases in the initial fast stage, followed by a slight change in the second stage, which is attributed to the fact that product islands finally cover the grain surface, as shown in Figure 8a, and hence the product layer diffusion fully controls the reaction process.
3.3. Effects of Particle Structure
The particle structure has a significant influence on the oxidation reaction performance of an oxygen carrier with O2, including particle porosity, particle size, and grain size. The effects of these factors on oxidation performance were investigated using the model developed in this study.
The particle porosity plays an important role in the gas-solid reaction, and it is a key parameter considered in the preparation of an oxygen carrier particle. Particles with high porosity allow the reactant gas to achieve active sites easily, leading to a high reaction rate and overall conversion in specific residence time. Figure 9 presents the modeling results of the effects of porosity on the oxidation reaction. It can be seen that when the initial particle porosity is larger, the gas concentration inside the particle is higher, and the overall conversion of the corresponding particle is higher. However, as shown in Figure 9b, there is no further change in the reaction rate of the particle when the initial particle porosity is larger than 0.4, where the internal gas diffusion resistance is small enough inside the particle, as shown in Figure 9c. Moreover, the duration time of the initial fast reaction stage is influenced by the initial particle porosity, which is attributed to the effects of the particle porosity on the distribution of oxygen concentration inside the particle, as described in Equation (9).
The particle size usually affects the external and internal transfer of O2 significantly [8,44]. Figure 10 shows the modeling results of the effects of the particle size on the oxidation reaction. As can be seen, the decrease in the initial particle size will increase the reaction rate in the initial fast stage and the overall conversion of the particle. The corresponding oxygen concentration is higher with the decrease in the initial particle size. The radial distribution of oxygen concentration shows uniformity when the initial particle size is smaller than 100 μm, while there is a vast difference between the oxygen concentration at the particle center and that at the particle external surface when the initial particle size is larger than 300 μm. When the particle radius is smaller than 100 μm, a change in the particle size has no significant effect on the reaction performance, and the same conclusion was also reported in the research of García-Labiano [17]. This is because the internal gas diffusion resistance is small enough, as shown in Figure 10b, and there is a uniform reaction inside the particle, as also proposed by other researchers [45,46].
The grain size determines the reaction interface and affects the oxidation process significantly. Figure 11a illustrates the overall conversion variation with the change of grain size as oxidation reaction proceeds. As smaller grains could provide more reaction interface areas, a smaller grain size results in a higher overall conversion in the same reaction time period. As observed, the particle with 30 nm grains could achieve the overall conversion up to 1.0 at 40 s, larger than two times of that of the particle with 200 nm grains. Therefore, the small grain size is desirable for high reaction performance of the oxygen carrier. It should be noted that the smaller grain size will lead to a small pore size, which will increase the gas internal diffusion resistance, as shown in Figure 11b.
4. Discussion
4.1. External Mass Transfer
The external mass transfer was considered in the particle scale model, and it might have an influence on the oxygen concentration in the external surface of the particle. As described in Equation (17), during the three particle structure parameters, only particle size affects the external mass transfer coefficient, . Correspondingly, it is shown in Figure 10b that the particle size has an effect on the oxygen concentration in the particle external surface, while Figure 9c and Figure 11b show that the particle porosity and grain size have no effects on the oxygen concentration on the particle external surface. As observed in Figure 10b, even in the worst case simulated for the Cu2O oxidation reaction, where the particle size is up to 1 mm, the oxygen concentration on the particle external surface only decreased by 5% with respect to the ambient gas concentration.
To analyze the effects of external mass transfer on the oxidation reaction behavior, the mass transfer rate of oxygen was analyzed. The mass transfer rate of oxygen to the particle is expressed as . The reaction rate of the particle can be written as , where is a comprehensive reaction rate constant describing the physical/chemical step inside the particle, including the internal gas diffusion, surface chemical reaction, and product layer diffusion. There should be . The magnitude of external mass transfer resistance can be described as , which is equal to . Therefore, the value of was used to evaluate the importance of external mass transfer resistance during the oxidation reaction, as shown in Figure 12. It can be seen that even in the case of particle size of 1 mm, the importance of external mass transfer resistance is smaller than 0.05. Correspondingly, in the theoretical research of García-Labiano [17] and Sahir et al. [44], it was also predicted that the external mass transfer resistance hardly affected the reaction rate under the particle sizes normally used in a CLOU system, which was consistent with the calculation results in this work. In the experimental work of Chuang et al. [8], it was also proposed that the reaction of the particles (355–500 μm) was hardly controlled by external mass transfer. The external mass transfer resistance is small enough under the particle sizes investigated here, and it hardly affects the reaction performance. The oxidation behavior of the Cu2O particle is controlled by the physical/chemical step inside the particle.
4.2. Effectiveness Factor
The effectiveness factor, the ratio of the observed reaction rate to the intrinsic reaction rate, can be used to describe the relative importance of chemical reaction at grain scale versus internal gas diffusion inside the particle [47]. The chemical reaction step at grain scale includes the direct surface reaction on the unoccupied reactant surface and the indirect reaction on the solid product surface, where the reaction rate of the former step is very fast, and the reaction rate of the latter step is much slower.
The effectiveness factor, , is expressed from a Thiele modulus, :
where
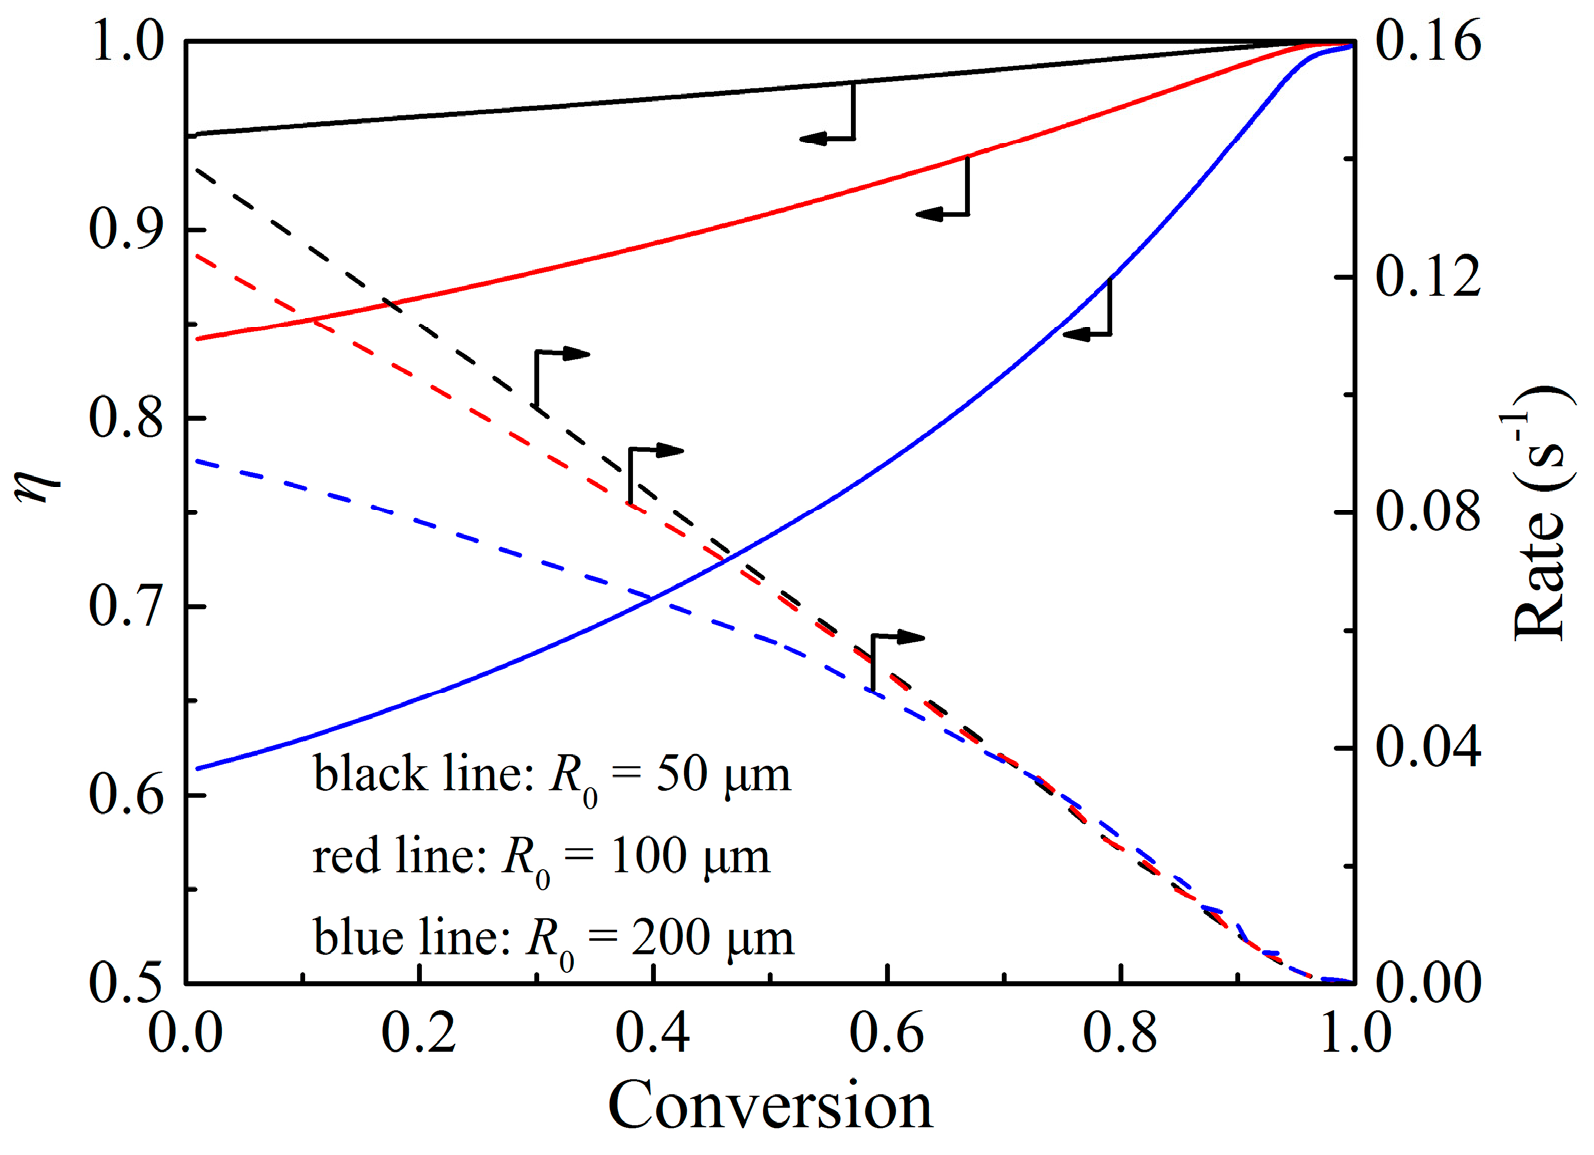
The value of the effectiveness factor changes during the reaction process. For the oxidation of the Cu2O, the stoichiometric molar volume ratio of the solid product to the solid reactant is , which is slightly larger than one. It means that there is just a slight decrease in the porosity inside the particle, as proved in Figure 8b. Therefore, the change of internal gas diffusion resistance during the reaction process is not obvious. The chemical reaction at grain scale is the main factor to affect the value of the effectiveness factor during the reaction process. Figure 13 shows the calculated results of the effectiveness factor and reaction rate against particle conversion under different particle sizes normally used in a CLOU system. As can be seen, under the particle radius of 50 μm, the effectiveness factor remains quite high throughout the entire reaction process, which means the whole oxidation reaction process is under the control of the chemical reaction at grain scale. The value of the effectiveness factor decreases with the increase in the particle size, which means the internal gas diffusion resistance is higher inside a particle with larger particle size, and the corresponding reaction rate decreases when the particle size increases. Under a certain particle size, as the reaction goes by, the value of the effectiveness factor increases, and the reaction rate decreases, which means chemical reaction resistance at grain scale increases. During the oxidation reaction process, the product islands grow quickly to cover the grain surface, leading to the reaction process changing from fast reaction stage to the second slower stage. Therefore, the increase in the chemical reaction resistance at grain scale results in the increase of the effectiveness factor.
5. Conclusions
A multiscale model was established to describe the Cu-based oxygen carrier oxidation reaction with oxygen in this paper, including the surface scale, grain scale, and particle scale. The effects of oxygen partial pressure, temperature, and particle structure on the oxidation kinetics were studied using the developed model. The modeling results indicate that the transition of the conversion curve occurs when product islands cover most part of the grain surface. The oxygen partial pressure and particle structure have an obvious influence on the duration time of the fast reaction stage. An increase of the particle porosity, a decrease of the particle size, or a decrease of grain size will lead to better oxidation reaction behavior. However, no significant effect on the reaction was found when the initial particle porosity is larger than 0.4, or the initial particle radius is smaller than 100 μm, which is due to the negligible gas diffusion resistance. Furthermore, the importance of the external mass transfer and the effectiveness factor during the oxidation reaction process under the particle sizes normally used in a CLOU system were discussed to investigate the controlling step of the oxidation reaction of Cu-based oxygen carrier. It was concluded that the external mass transfer step hardly affects the reaction performance, and the oxidation behavior of the Cu2O particle is controlled by the physical/chemical step inside the particle. The value of the effectiveness factor increases as the reaction goes by, which means the increased chemical reaction resistance at grain scale results from the growing number of product islands on the grain surface. Moreover, the multiscale model developed in this paper is expected to be useful for the oxidation kinetic analysis of other oxygen carriers used in CLOU.
Author Contributions
Conceptualization, H.W., Z.L. and N.C.; methodology, H.W. and Z.L.; software, H.W.; validation, H.W., Z.L. and N.C.; formal analysis, H.W.; investigation, H.W. and Z.L.; resources, Z.L. and N.C.; data curation, H.W. and Z.L.; Writing—Original Draft preparation, H.W.; Writing—Review and Editing, Z.L. and N.C.; visualization, Z.L.; supervision, N.C.; project administration, Z.L. and N.C.; funding acquisition, N.C.
Funding
This research was funded by National Natural Science Funds of China (Grant No. 51876095).
Conflicts of Interest
The authors declare no conflict of interest.
Nomenclature
| C | concentration of O2 inside the particle, mol/cm3 |
| C0 | concentration of O2 in the ambient gas, mol/cm3 |
| Ce | equilibrium concentration of O2, mol/cm3 |
| Cmet | concentration of metal ions on the Cu2O/CuO interface, mol/cm3 |
| Cs | concentration of O2 on the particle external surface, mol/cm3 |
| D1 | diffusivity of gas through the particle pores, cm2/s |
| De | effective diffusivity of gas through the particle pores, cm2/s |
| DK | Knudsen diffusivity, cm2/s |
| O2 molecular diffusivity, cm2/s | |
| Ds | diffusivity of metal ions through the product layer, cm2/s |
| Ek, ED | activation energy, kJ/mol |
| hc | critical solid reactant layer thickness, cm |
| k | chemical reaction rate constant, cm/s |
| kg | external mass transfer coefficient, cm/s |
| P | pressure, atm |
| Pe | equilibrium partial pressure of O2, atm |
| r | grain radius, cm |
| r0 | initial grain radius, cm |
| r1 | grain radius of CuO/O2 interface, cm |
| r1c | critical grain radius of CuO/O2 interface, cm |
| r2 | grain radius of Cu2O/CuO interface, cm |
| r2c | critical grain radius of Cu2O/CuO interface, cm |
| R | particle radius, cm |
| R0 | initial particle radius, cm |
| Rg | the universal gas constant, J/(mol·K) |
| t | reaction time, s |
| T | temperature, K |
| v | diffusion volume for molecule, cm3 |
| molar volume of CuO, cm3/mol | |
| molar volume of Cu2O, cm3/mol | |
| Z | stoichiometric molar volume ratio of the solid product to the solid reactant |
| α | local conversion |
| overall conversion | |
| δ | ratio of the unoccupied area on the grain surface |
| ε | local porosity |
| ε0 | initial porosity |
| effectiveness factor | |
| Thiele modulus |
References
- Lyngfelt, A. Chemical-Looping Combustion of Solid Fuels—Status of Development. Appl. Energy 2014, 113, 1869–1873. [Google Scholar]
- Lyngfelt, A.; Leckner, B.; Mattisson, T. A fluidized-bed combustion process with inherent CO2 separation application of chemical-looping combustion. Chem. Eng. Sci. 2001, 56, 3101–3113. [Google Scholar]
- Padurean, A.; Cormos, C.C.; Agachi, P.S. Pre-Combustion Carbon Dioxide Capture by Gas–Liquid Absorption for Integrated Gasification Combined Cycle Power Plants. Int. J. Greenh. Gas Con. 2012, 7, 1–11. [Google Scholar] [CrossRef]
- Romeo, L.M.; Bolea, I.; Escosa, J.M. Integration of Power Plant and Amine Scrubbing to Reduce CO2 Capture Costs. Appl. Therm. Eng. 2008, 28, 1039–1046. [Google Scholar]
- Petrakopoulou, F.; Boyano, A.; Cabrera, M.; Tsatsaronis, G. Exergoeconomic and Exergoenvironmental Analyses of a Combined Cycle Power Plant with Chemical Looping Technology. Int. J. Greenh. Gas Con. 2011, 5, 475–482. [Google Scholar]
- Mattisson, T.; Lyngfelt, A.; Leion, H. Chemical-looping with oxygen uncoupling for combustion of solid fuels. Int. J. Greenh. Gas Con. 2009, 3, 11–19. [Google Scholar] [CrossRef]
- Abad, A.; Mattisson, T.; Lyngfelt, A.; Rydén, M. Chemical looping combustion in a 300 Wth continuously operating reactor system using a manganese-based oxygen carrier. Fuel 2006, 85, 1174–1185. [Google Scholar] [CrossRef]
- Chuang, S.Y.; Dennis, J.S.; Hayhurst, A.N.; Scott, S.A. Kinetics of the oxidation of a co-precipitated mixture of Cu and Al2O3 by O2 for chemical-looping combustion. Energy Fuel 2010, 24, 3917–3927. [Google Scholar]
- Chuang, S.; Dennis, J.S.; Hayhurst, A.N.; Scott, S.A. Development and performance of Cu-based oxygen carriers for chemical-looping combustion. Combust. Flame 2008, 154, 109–121. [Google Scholar]
- Adanez-Rubio, I.; Abad, A.; Gayán, P.; Diego, L.F.D.; García-Labiano, F.; Adánez, J. Identification of operational regions in the chemical-looping with oxygen uncoupling (CLOU)process with a Cu-based oxygen carrier. Fuel 2012, 102, 634–645. [Google Scholar]
- Diego, L.F.D.; García-Labiano, F.; Adánez, J.; Gayán, P.; Abad, A.; Corbella, B.M.; Palaciosb, J.M. Development of Cu-based oxygen carriers for chemical-looping combustion. Fuel 2004, 83, 1749–1757. [Google Scholar] [Green Version]
- Goldstein, E.A.; Mitchell, R.E. Chemical kinetics of copper oxide reduction with CO. Proc. Combust. Inst. 2011, 33, 2803–2810. [Google Scholar] [CrossRef]
- Gayán, P.; Adánez-Rubio, I.; Abad, A.; Diego, L.F.D.; García-Labiano, F.; Adánez, J. Development of Cu-based oxygen carriers for chemical-looping with oxygen uncoupling (CLOU) process. Fuel 2012, 96, 226–238. [Google Scholar] [CrossRef]
- Adánez-Rubio, I.; Arjmand, M.; Leion, H.; Gayán, P.; Abad, A.; Mattisson, T.; Lyngfelt, A. Investigation of combined supports for Cu-based oxygen carriers for chemical-looping with oxygen uncoupling (CLOU). Energy Fuel 2013, 27, 3918–3927. [Google Scholar] [CrossRef]
- Diego, L.F.D.; Gayán, P.; García-Labiano, F.; Celaya, J.; Abad, A.; Adánez, J. Impregnated CuO/Al2O3 oxygen carriers for chemical-looping combustion, avoiding fluidized bed agglomeration. Energy Fuel 2005, 19, 1850–1856. [Google Scholar] [CrossRef]
- Clayton, C.K.; Sohn, H.Y.; Whitty, K.J. Oxidation Kinetics of Cu2O in Oxygen Carriers for Chemical Looping with Oxygen Uncoupling. Ind. Eng. Chem. Res. 2014, 53, 2976–2986. [Google Scholar] [CrossRef]
- García-Labiano, F.; Diego, L.F.D.; Adánez, J.; Abad, A.; Gayán, P. Temperature variations in the oxygen carrier particles during their reduction and oxidation in a chemical-looping combustion system. Chem. Eng. Sci. 2005, 60, 851–862. [Google Scholar] [CrossRef] [Green Version]
- Maya, J.C.; Chejne, F. Modeling of Oxidation and Reduction of a Copper-Based Oxygen Carrier. Energy Fuel 2014, 28, 5434–5444. [Google Scholar] [CrossRef]
- Dennis, J.S.; Pacciani, R. The rate and extent of uptake of CO2 by a synthetic, CaO-containing sorbent. Chem. Eng. Sci. 2009, 64, 2147–2157. [Google Scholar] [CrossRef]
- Liu, W.; Dennis, J.S.; Sultan, D.S.; Redfern, S.A.T.; Scott, S.A. An investigation of the kinetics of CO2 uptake by a synthetic calcium based sorbent. Chem. Eng. Sci. 2012, 69, 644–658. [Google Scholar] [CrossRef]
- Szekely, J.; Evans, J.W.; Sohn, H.Y. Gas−Solid Reactions; Academic Press: New York, NY, USA, 1976. [Google Scholar]
- Gattinoni, C.; Michaelides, A. Atomistic details of oxide surfaces and surface oxidation: The example of copper and its oxides. Surf. Sci. Rep. 2015, 70, 424–447. [Google Scholar]
- Zhang, R.; Liu, H.; Zheng, H.; Ling, L.; Wang, B. Adsorption and dissociation of O2 on the Cu2O(111) surface: Thermochemistry, reaction barrier. Appl. Surf. Sci. 2011, 257, 4787–4794. [Google Scholar]
- Yu, X.; Zhang, X.; Tian, X.; Wang, S.; Feng, G. Density functional theory calculations on oxygen adsorption on the Cu2O surfaces. Appl. Surf. Sci. 2015, 324, 53–60. [Google Scholar] [CrossRef]
- Bao, J.; Li, Z.; Sun, H.; Cai, N. Experiment and rate equation modeling of Fe oxidation kinetics in chemical looping combustion. Combust. Flame 2013, 160, 808–817. [Google Scholar]
- Li, Z.S.; Fang, F.; Cai, N.S. Characteristic of solid product layer of MgSO4 in the reaction of MgO with SO2. Sci. China Technol. Sci. 2010, 53, 1869–1876. [Google Scholar] [CrossRef]
- Fang, F.; Li, Z.S.; Cai, N.S.; Tang, X.Y.; Yang, H.T. AFM investigation of solid product layer of MgSO4 generated on MgO surfaces in the reaction of MgO with SO2 and O2. Chem. Eng. Sci. 2011, 66, 1142–1149. [Google Scholar] [CrossRef]
- Tang, X.Y.; Li, Z.S.; Fang, F.; Cai, N.S.; Yang, H.T. AFM investigation of the morphology of CaSO4 product layer formed during direct sulfation on polished single-crystal CaCO3 surfaces at high CO2 concentrations. Proc. Combust. Inst. 2011, 33, 2683–2689. [Google Scholar]
- Schulz, K.H.; Cox, D.F. Photoemission and low-energy-electron-diffraction study of clean and oxygen-dosed Cu2O (111) and (100) surfaces. Phys. Rev. B 1991, 43, 1610–1621. [Google Scholar]
- Le, D.; Stolbov, S.; Rahman, T.S. Reactivity of the Cu2O (100) surface: Insights from first principles calculations. Surf. Sci. 2009, 603, 1637–1645. [Google Scholar]
- Zhou, L.J.; Zou, Y.C.; Zhao, J.; Wang, P.P.; Feng, L.L.; Sun, L.W.; Wang, D.J.; Li, G.D. Facile synthesis of highly stable and porous Cu2O/CuO cubes with enhanced gas sensing properties. Sens. Actuators B 2013, 188, 533–539. [Google Scholar] [CrossRef]
- Trinh, T.T.; Tu, N.H.; Le, H.H.; Ryu, K.Y.; Le, K.B.; Pillai, K.; Yi, J. Improving the ethanol sensing of ZnO nano-particle thin films—The correlation between the grain size and the sensing mechanism. Sens. Actuators B 2011, 152, 73–81. [Google Scholar]
- Umar, A.; Alshahrani, A.A.; Algarni, H.; Kumar, R. CuO nanosheets as potential scaffolds for gas sensing applications. Sens. Actuators B 2017, 250, 24–31. [Google Scholar] [CrossRef]
- Wang, M.; Liu, J.; Shen, F.; Cheng, H.; Dai, J.; Long, Y. Theoretical study of stability and reaction mechanism of CuO supported on ZrO2 during chemical looping combustion. Appl. Surf. Sci. 2016, 367, 485–492. [Google Scholar]
- Alvarez, D.; Abanades, J.C. Determination of the critical product layer thickness in the reaction of CaO with CO2. Ind. Eng. Chem. Res. 2005, 44, 5608–5615. [Google Scholar]
- Marks, L.D. Modified wulff constructions for twinned particles. J. Cryst. Growth 1983, 61, 556–566. [Google Scholar] [CrossRef]
- Li, Z.S.; Sun, H.M.; Cai, N.S. Rate Equation Theory for the Carbonation Reaction of CaO with CO2. Energy Fuel 2012, 26, 4607–4616. [Google Scholar]
- Wang, H.; Li, Z.S.; Fan, X.X.; Cai, N.S. Rate-Equation-Based Grain Model for the Carbonation of CaO with CO2. Energy Fuel 2017, 31, 14018–14032. [Google Scholar] [CrossRef]
- Rapp, R.A. The high temperature oxidation of metals forming cation-diffusing scales. Metall. Mater. Trans. A 1984, 15, 765–782. [Google Scholar] [CrossRef]
- Fuller, E.N.; Ensley, K.; Giddings, J.C. New method for prediction of binary gas-phase diffusion coefficients. Ind. Eng. Chem. Res. 1996, 58, 19–27. [Google Scholar] [CrossRef]
- Khoshandam, B.; Kumar, R.V.; Allahgholi, L. Mathematical modeling of co2removal using carbonation with CaO: The grain model. Korean J. Chem. Eng. 2010, 27, 766–776. [Google Scholar] [CrossRef]
- Adánez-Rubio, I.; Gayán, P.; Abad, A.; García-Labiano, F.; De Diego, L.F.; Adánez, J. Kinetic analysis of a cu-based oxygen carrier: Relevance of temperature and oxygen partial pressure on reduction and oxidation reactions rates in chemical looping with oxygen uncoupling (CLOU). Chem. Eng. J. 2014, 256, 69–84. [Google Scholar]
- Whitty, K.; Clayton, C. Measurement and Modeling of Kinetics for Copper-Based Chemical Looping with Oxygen Uncoupling. In Proceedings of the 2nd International Conference on Chemical Looping, Darmstadt, Germany, 26–28 September 2012. [Google Scholar]
- Sahir, A.H.; Lighty, J.A.S.; Sohn, H.Y. Kinetics of Copper Oxidation in the Air Reactor of a Chemical Looping Combustion System using the Law of Additive Reaction Times. Ind. Eng. Chem. Res. 2011, 50, 566–580. [Google Scholar] [CrossRef]
- Alonso, M.; Criado, Y.A.; Abanades, J.C.; Grasa, G. Undesired effects in the determination of CO2 carrying capacities of CaO during TG testing. Fuel 2014, 127, 52–61. [Google Scholar]
- Sedghkerdar, M.H.; Mostafavi, E.; Mahinpey, N. Investigation of the Kinetics of Carbonation Reaction with Cao-Based Sorbents Using Experiments and Aspen Plus Simulation. Chem. Eng. Commun. 2015, 202, 746–755. [Google Scholar]
- Yao, J.G.; Zhang, Z.; Sceats, M.; Maitland, G.C.; Fennell, P.S. Two-phase fluidized bed model for pressurized carbonation kinetics of calcium oxide. Energy Fuel 2017, 31, 11181–11193. [Google Scholar] [CrossRef]
Figure 1.
Schematic diagram of the multiscale model.

Figure 2.
(a) Comparison of the product-islands-based model and traditional grain model; (b) Schematic diagram of the solid product morphology on grain surface during the oxidation reaction.
Figure 2.
(a) Comparison of the product-islands-based model and traditional grain model; (b) Schematic diagram of the solid product morphology on grain surface during the oxidation reaction.

Figure 3.
Equilibrium partial pressure of oxygen over the CuO/Cu2O redox pair.

Figure 4.
Effects of O2 volume percentage (vol%) on conversion at 900 °C. ([O2] = 2.5~21 vol%, N2 as equilibrium gas. Dots: experimental data [42]; lines: model results.)
Figure 4.
Effects of O2 volume percentage (vol%) on conversion at 900 °C. ([O2] = 2.5~21 vol%, N2 as equilibrium gas. Dots: experimental data [42]; lines: model results.)

Figure 5.
Profile of ratio of the unoccupied area on grain surface at R/R0 = 0.5 during the oxidation of the particle in Figure 4.
Figure 5.
Profile of ratio of the unoccupied area on grain surface at R/R0 = 0.5 during the oxidation of the particle in Figure 4.

Figure 6.
Effects of temperature on conversion of (a) 50_TiO2 material and (b) 45_ZrO2 material. ([O2] = 21 vol%, [N2] = 79 vol%. Dots: experimental data [16]; lines: calculated results.)
Figure 6.
Effects of temperature on conversion of (a) 50_TiO2 material and (b) 45_ZrO2 material. ([O2] = 21 vol%, [N2] = 79 vol%. Dots: experimental data [16]; lines: calculated results.)

Figure 7.
The relation curves of (a) lnk versus 1/T, (b) lnDs versus 1/T, and (c) hc versus T.
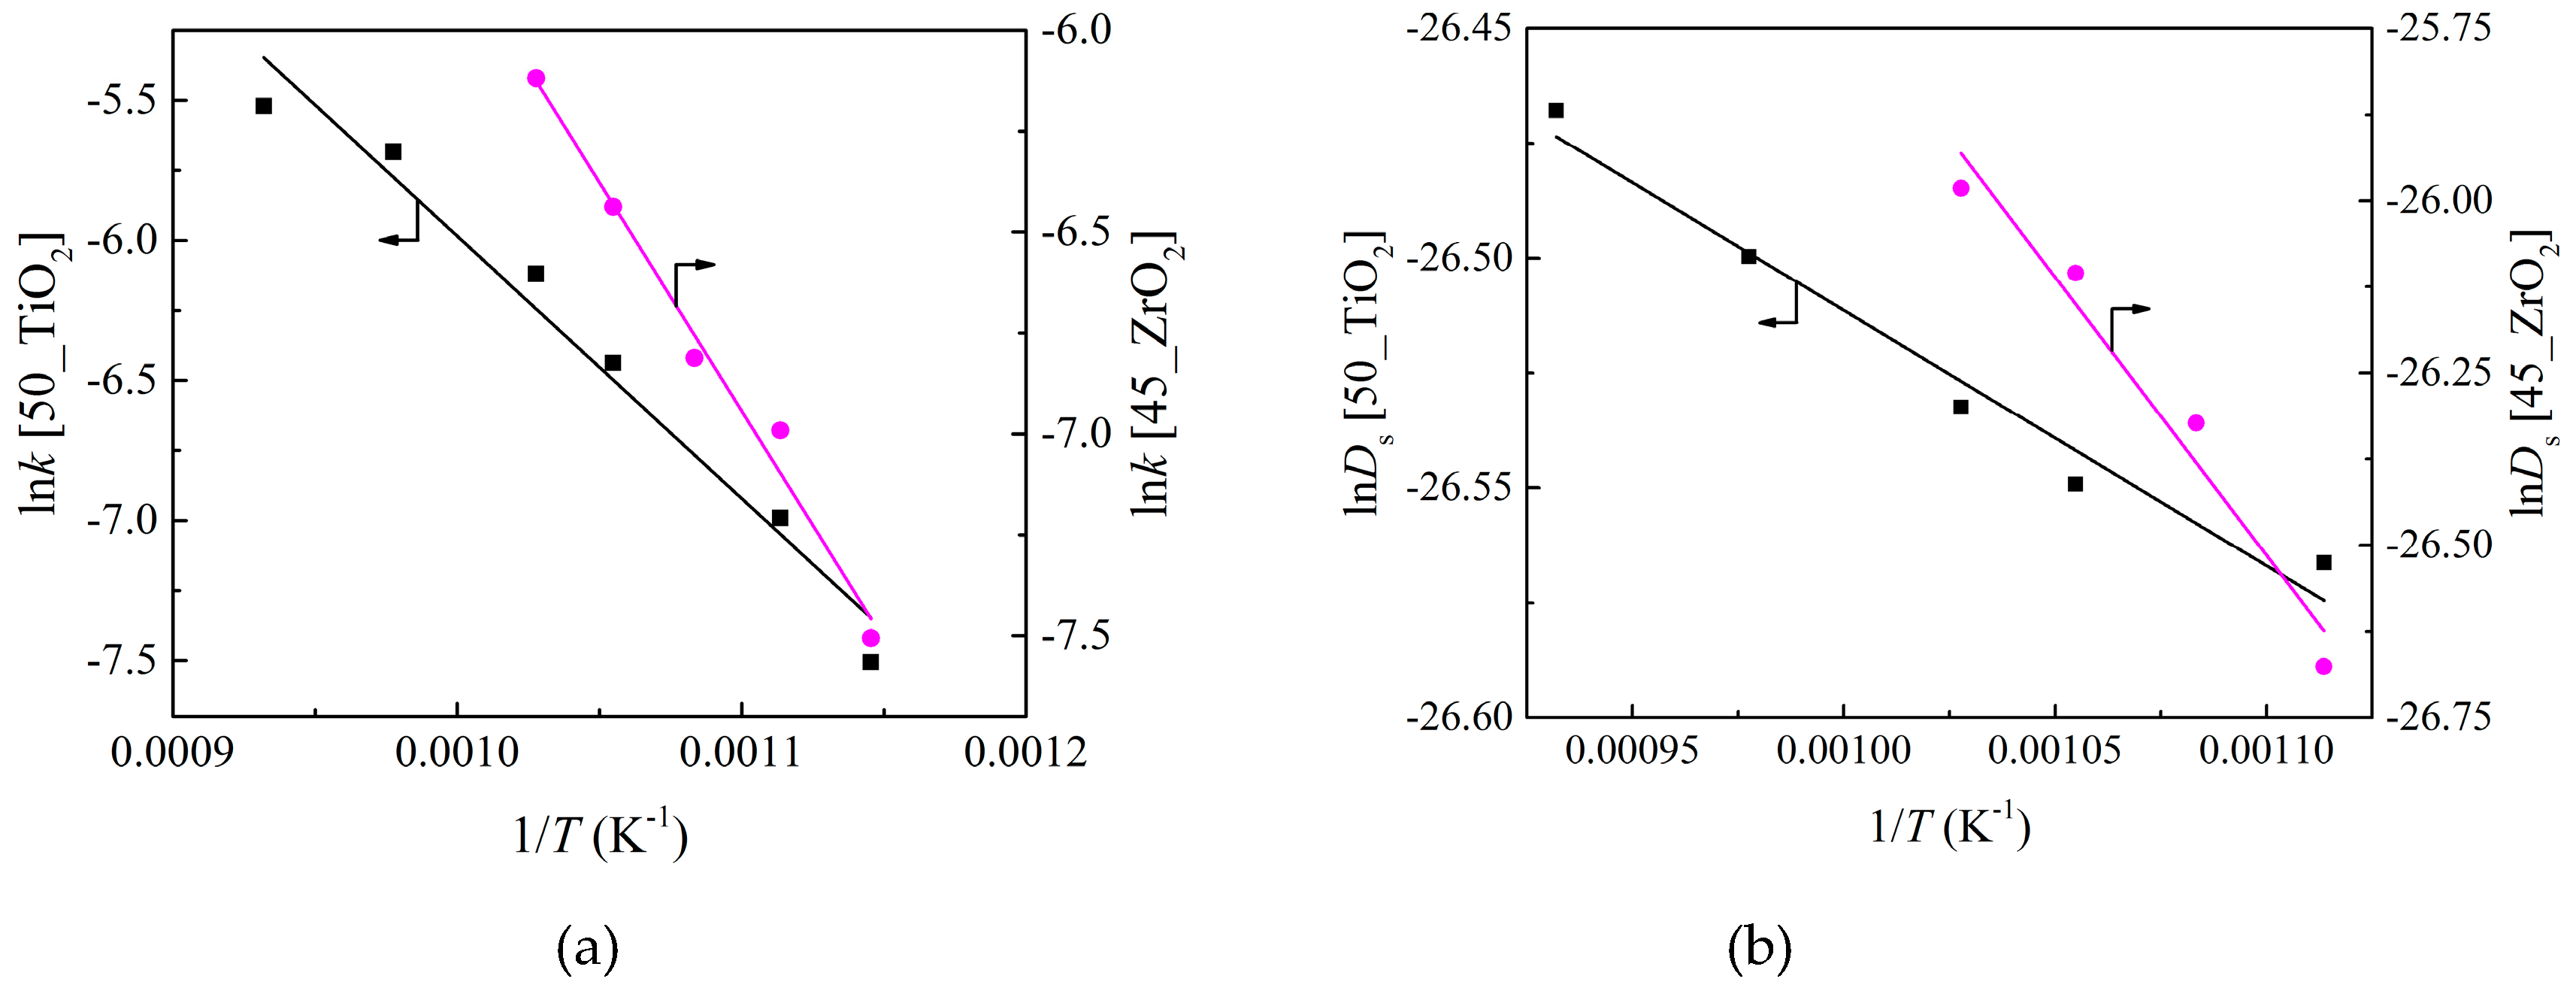

Figure 8.
Profiles of (a) ratio of unoccupied area on grain surface at R/R0 = 0.5 and (b) local porosity at R/R0 = 0.5 during the 50_TiO2_MM material oxidation reaction in Figure 6a.
Figure 8.
Profiles of (a) ratio of unoccupied area on grain surface at R/R0 = 0.5 and (b) local porosity at R/R0 = 0.5 during the 50_TiO2_MM material oxidation reaction in Figure 6a.

Figure 9.
Effects of particle porosity on (a) the overall conversion of the particle, (b) reaction rate of the particle, and (c) oxygen concentration at R/R0 = 0.5 during the oxidation reaction at 800 °C.
Figure 9.
Effects of particle porosity on (a) the overall conversion of the particle, (b) reaction rate of the particle, and (c) oxygen concentration at R/R0 = 0.5 during the oxidation reaction at 800 °C.

Figure 10.
Effects of particle size on (a) the overall conversion of the particle and (b) oxygen concentration at R/R0 = 0.5 during the oxidation reaction at 800 °C.
Figure 10.
Effects of particle size on (a) the overall conversion of the particle and (b) oxygen concentration at R/R0 = 0.5 during the oxidation reaction at 800 °C.

Figure 11.
Effects of grain size on (a) the overall conversion of the particle and (b) oxygen concentration at R/R0 = 0.5 during the oxidation reaction at 800 °C.
Figure 11.
Effects of grain size on (a) the overall conversion of the particle and (b) oxygen concentration at R/R0 = 0.5 during the oxidation reaction at 800 °C.
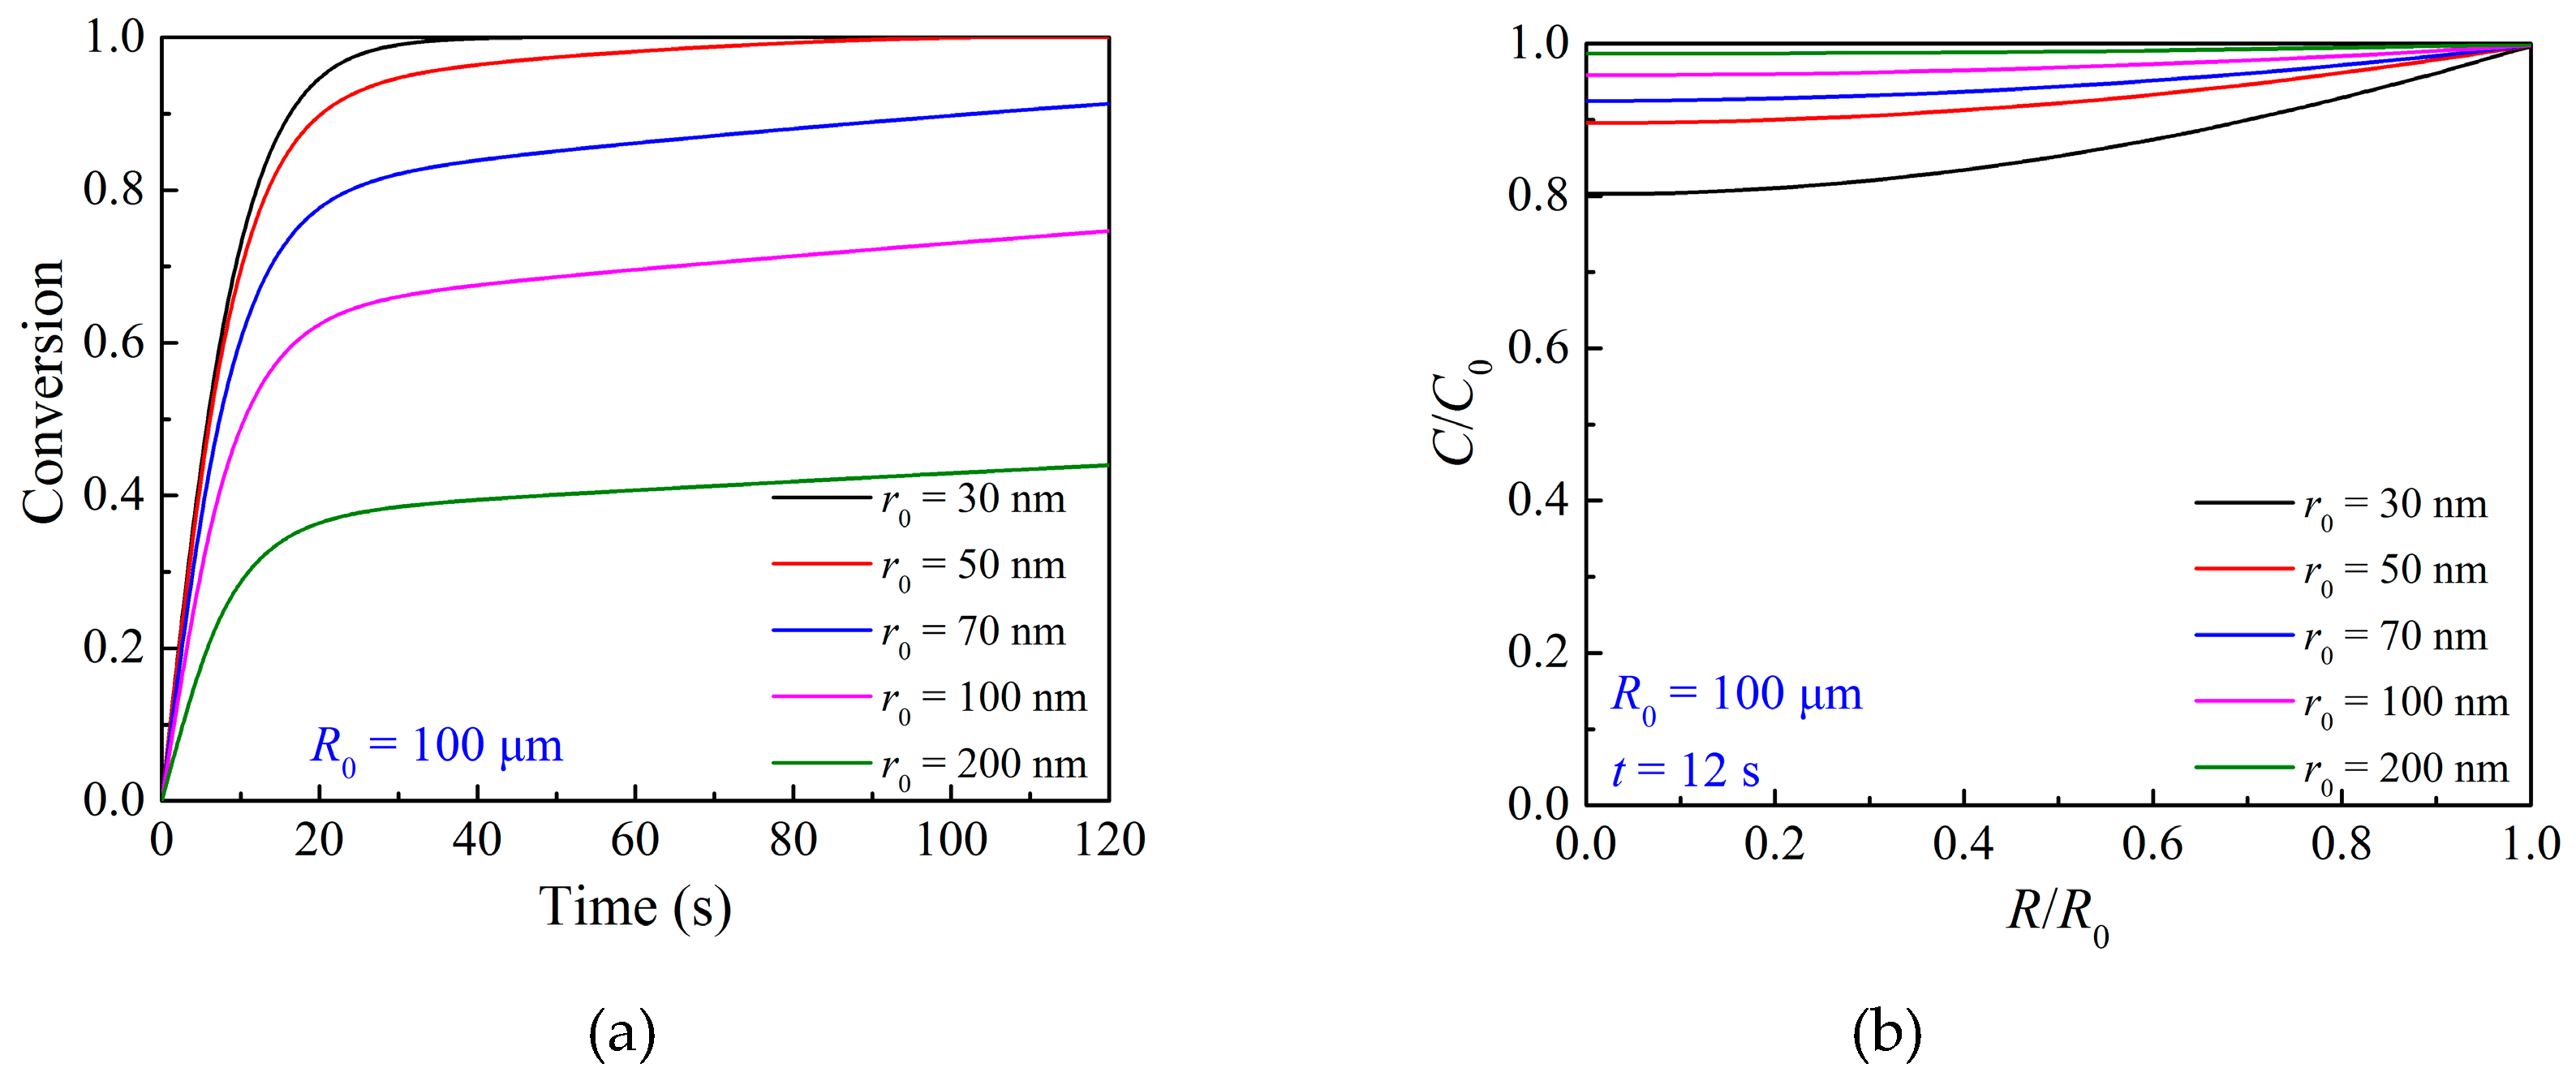
Figure 12.
The importance of external mass transfer resistance described by under different particle sizes at 800 °C.
Figure 12.
The importance of external mass transfer resistance described by under different particle sizes at 800 °C.
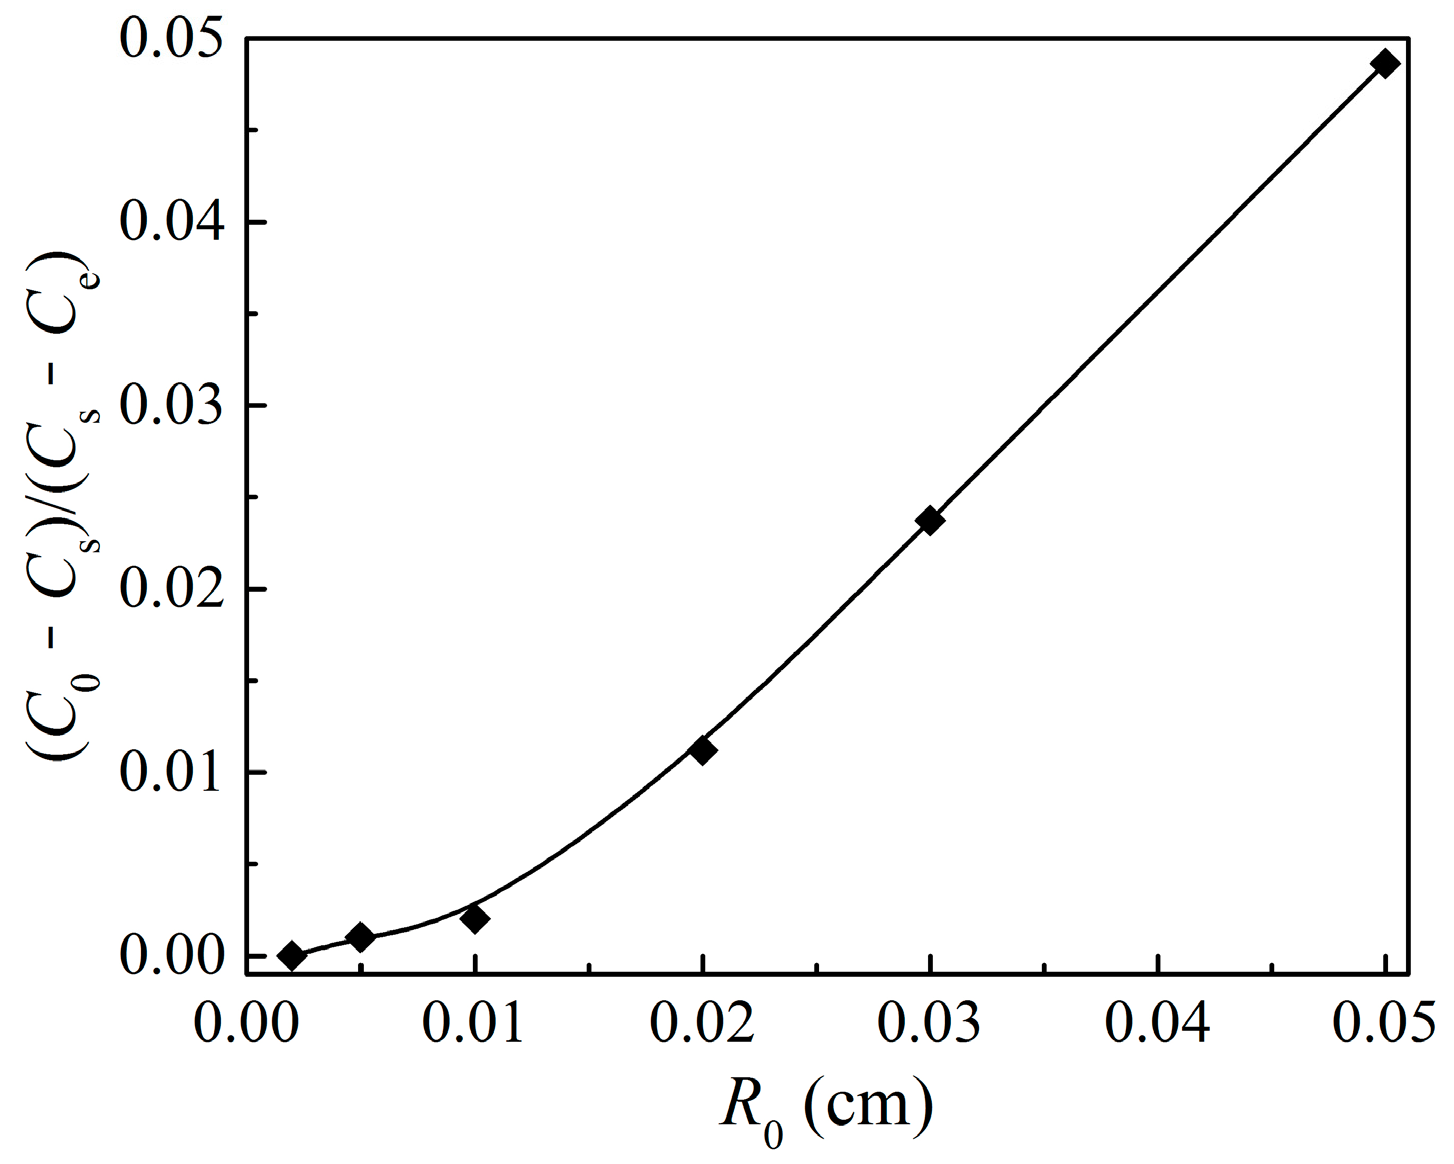
Figure 13.
Calculated results of effectiveness factor and reaction rate against particle conversion under different particle sizes at 800 °C.
Figure 13.
Calculated results of effectiveness factor and reaction rate against particle conversion under different particle sizes at 800 °C.


Table 1.
Values of the kinetic parameters for the oxidation of Cu-based oxygen carrier.
| Parameter | k0 (cm/s) | Ek (kJ/mol) | D0 (cm2/s) | ED (kJ/mol) | a (cm/K) | b (cm) |
|---|---|---|---|---|---|---|
| 50_TiO2 material | 29 | 78 | 5.3 × 10⁻¹² | 4.6 | 9.4 × 10⁻⁹ | −7.1 × 10⁻⁶ |
| 45_ZrO2 material | 245 | 94 | 2.2 × 10⁻⁸ | 67 | 5.7 × 10⁻⁹ | −4.4 × 10⁻⁶ |
© 2019 by the authors. Licensee MDPI, Basel, Switzerland. This article is an open access article distributed under the terms and conditions of the Creative Commons Attribution (CC BY) license (http://creativecommons.org/licenses/by/4.0/).
Share and Cite
MDPI and ACS Style
Wang, H.; Li, Z.; Cai, N. A Multiscale Model of Oxidation Kinetics for Cu-Based Oxygen Carrier in Chemical Looping with Oxygen Uncoupling. Materials 2019, 12, 1170. https://doi.org/10.3390/ma12071170
AMA Style
Wang H, Li Z, Cai N. A Multiscale Model of Oxidation Kinetics for Cu-Based Oxygen Carrier in Chemical Looping with Oxygen Uncoupling. Materials. 2019; 12(7):1170. https://doi.org/10.3390/ma12071170
Chicago/Turabian StyleWang, Hui, Zhenshan Li, and Ningsheng Cai. 2019. "A Multiscale Model of Oxidation Kinetics for Cu-Based Oxygen Carrier in Chemical Looping with Oxygen Uncoupling" Materials 12, no. 7: 1170. https://doi.org/10.3390/ma12071170
Note that from the first issue of 2016, this journal uses article numbers instead of page numbers. See further details here.