Abstract
The effect of microstructure and chemistry on the kinetics of passive layer growth and passivity breakdown of some Ti-based alloys, namely Ti-6Al-4V, Ti-6Al-7Nb and TC21 alloys, was studied. The rate of pitting corrosion was evaluated using cyclic polarization measurements. Chronoamperometry was applied to assess the passive layer growth kinetics and breakdown. Microstructure influence on the uniform corrosion rate of these alloys was also investigated employing dynamic electrochemical impedance spectroscopy (DEIS). Corrosion studies were performed in 0.9% NaCl solution at 37 °C, and the obtained results were compared with ultrapure Ti (99.99%). The different phases of the microstructure were characterized by X-ray diffraction (XRD) and scanning electron microscopy (SEM). Chemical composition and chemistry of the corroded surfaces were studied using X-ray photoelectron spectroscopy (XPS) analysis. For all studied alloys, the microstructure consisted of α matrix, which was strengthened by β phase. The highest and the lowest values of the β phase’s volume fraction were recorded for TC21 and Ti-Al-Nb alloys, respectively. The susceptibility of the investigated alloys toward pitting corrosion was enhanced following the sequence: Ti-6Al-7Nb < Ti-6Al-4V << TC21. Ti-6Al-7Nb alloy recorded the lowest pitting corrosion resistance (Rpit) among studied alloys, approaching that of pure Ti. The obvious changes in the microstructure of these alloys, together with XPS findings, were adopted to interpret the pronounced variation in the corrosion behavior of these materials.
1. Introduction
Titanium and its alloys are widely used in many industrial applications, because of their highly desirable properties, including very good mechanical properties, excellent corrosion and erosion resistance, and favorable strength to weight ratio [1]. In fact, titanium and its alloys have experienced increased use in the past years as biomaterials, because of their superior biocompatibility, high resistance to localized and generalized corrosion, and their good mechanical properties (fatigue resistance) [2]. Among all titanium and its alloys, the commonly used materials in biomedical area are commercially pure titanium (cpTi) and its (α + β) Ti6-Al4-V alloy [3,4,5].
Next to biomedical applications, aerospace sector has dominated titanium use, instead of heavy steel components, in the fabrication of crucial and decisive systems such as airfoils and airframes [6,7,8,9]. About 50% of titanium used in the aerospace industry is the (α + β) Ti-6Al-4V alloy. This alloy possesses a perfect combination of operational and technological properties [10,11]. Titanium alloys have also found widespread applications in a variety of fields such as in chemical and petrochemical sectors due to their excellent corrosion resistance [12]. The outstanding characteristics (such as high specific strength, high fatigue strength, good corrosion resistance, etc.) of the titanium alloys (particularly Ti-6Al-4V) are attributed to a very stable native oxide film (1.5–10 nm) formed on the Ti and Ti-alloy surface upon exposure to atmosphere and/or aqueous environments [13,14]. However, this thin oxide layer can be damaged and thus strongly impacts the bioactivity and other characteristics of the material. To improve the performance of Ti and Ti-alloys for biomedical and aerospace applications, oxidation (anodization) has been applied as a successful approach to improve the material properties [15,16].
The microstructure, formed during various processing methods, is found to greatly influence the mechanical properties of titanium alloys [17]. The microstructure type (bimodal, lamellar and equiaxed) affects the mechanical properties of Ti based alloys [18]. Even though the corrosion of Ti-alloys in different environments has previously beenstudied [19,20,21,22,23], to the best of our knowledge, the literature contains no reports onthe passive layer growth kinetics and breakdown, and subsequent initiation and propagation of pitting corrosion over the surfaces of Ti-6Al-7Nb, Ti-6Al-4V, and TC21 alloys. In this context, the mainobjective of our studywas to assess the effect of microstructure changes of tested alloys on their surface morphology and chemistry using different techniques such as scanning electron microscopy with electron dispersive X-ray spectroscopy (SEM/EDX), X-ray diffraction (XRD), and X-ray Photoelectron Spectroscopy (XPS). The influence of microstructure changes on the anodic behavior and passive layer growth kinetics and breakdown was also investigated. The corrosion resistances were compared using potentiodynamic polarization and impedance spectroscopy tools. All measurements were conducted in 0.9% NaCl solution at 37 °C.
2. Materials and Methods
The working electrodes investigated in this study consisted of three Ti-based alloys, namely Ti-6Al-4V, Ti-6Al-7Nb and TC21; their chemical compositions are presented in Table 1. The as-received titanium alloy samples were prepared by melting in a 500 kg vacuum induction furnace to obtain billets. These billets were then forged and machined into 10 mm diameter bars. The microstructures of these alloys werestudied by Meiji optical microscope (Meiji Techno Co., Ltd., Chikumazawa, Japan) fitted with a digital camera (Meiji Techno Co., Ltd., Chikumazawa, Japan). JEOL JSM5410 and Hitachi S-3400N scanning electron microscopes (LxRay Co., Ltd., Hyogo, Japan) (SEM) were also used for microstructure studies. For this purpose, the specimens were prepared following ASTM E3-11 standard metallographic procedures, and then etched in a mixture of 5 mL HNO3, 10 mL HF and 85 mL H2O. The alloys were machined in the form of rods to perform electrochemical measurements. These rods were mounted in a polyester resin offering an active cross-sectional area of ~0.2 cm2. Prior to conducting any electrochemical analysis, the surface of the working electrode was cleaned and polished using a silicon carbide paper (600-grit) installed on a polishing machine (Minitech 233). The surface was then washed copiouslywith distilled water and rinsed with absolute ethanol (SIGMA-ALDRICH, Steinheim, Germany).

Table 1.
Chemical composition of investigated Ti alloys.
Electrochemical measurements were conducted in a standard, double-walled electrochemical cell (Princeton Applied Research, USA) with an inner volume capacity of 200 mL. Temperature of the test solution was maintained constant at the desired value by means of a temperature-controlled water bath (FP40-MA Refrigerated/Heating Circulator) (JULABO GmbH, Seelbach, Germany). The water, after being adjusted to 37 ± 0.1 °C, wasallowed to circulate through external jacket of the cell. The cover of the electrochemical cell had five openings with different sizes. Such openings were designed to be fitted to the working electrode, counter electrode (a long, coiled platinum wire), reference electrode (KCl-saturated calomel electrode (SCE)), a thermometer and a gas inlet/outlet for gas release. The reference electrode was placed in a Luggin capillary, the tip of which was adjusted to be close to the working electrode to minimize iR drop. The cell was connected to a Potentiostat (Autolab PGSTAT30) (Metrohm, Herisau, Switzerland). The test solution was a normal saline (0.9% NaCl). A Millipore Milli-Q water system (Merck Millipore, MA, USA) (18.2 MΩ cm) was used to freshly prepare the saline solution. The salt was of analytical grade and purchased from Sigma-Aldrich (Steinheim, Germany).
Linear sweep voltammetry (LSV), Tafel plots, and Electrochemical Impedance Spectroscopy (EIS) techniques were applied to investigate the uniform corrosion characteristics of the studied alloys. The susceptibility of these alloys to passivity breakdown was evaluated via conducting potentiodynamic polarization measurements. Uniform corrosion measurements were started by stabilizing the working electrode at the rest potential for 2 h, followed by conducting EIS measurements at the respective corrosion potential (Ecorr) every day for a week of exposure in 0.9% NaCl solution at 37 °C, covering a wide frequency range (100 kHz–10 mHz), with 15 mV perturbation amplitude. Uniform corrosion study was assessed by constructing Tafel plots via sweeping the electrode potential around the Tafel potential (E = Ecorr ± 250 mV), applying a sweep rate of 1.0 mV s−1. After that, the electrode was removed from the cell (which was cleaned properly and re-filled with a new fresh test solution), cleaned and polished up to the mirror finish, as described above, and then inserted in the cell for cyclic polarization measurements. Chronoamperometry (CA) technique was also applied using a new set of cleaned and polished electrodes submerged in a cleaned cell filled with a new fresh solution.
Prior to performing cyclic polarization measurements, the working electrode was allowed to stabilize at rest potential for 2 h, then swept linearly, at a sweep rate of 1.0 mV s−1, starting from a cathodic potential of −2.0 V to +8.0 V vs.SCE. The potential sweep was then reversed back with the same sweep rate to reach the start point again, thus forming one complete cycle. To conduct chronoamperometry (current vs. time) measurements, a two-step route was applied. The working electrode was first held at a starting cathodic potential of −2.0 V vs. SCE for 60 s, and then polarized towards the anodic direction at a sweep rate of 1.0 mV s−1 untilthe required anodic potential (Ea). Finally, the anodic current was measured versus time (5.0 min) by holding the working electrode at Ea. To ensure reproducibility, each run was repeated at least three times, where mean values of the various electrochemical parameters and their standard deviations were calculated and reported.
The XRD diffraction patterns were collected for the bulk samples using a SmartLab SE (Rigaku Americas Corporation, Oxford, MS, USA) X-ray diffractometer with Cu Kα (λ = 1.54056 Å) operated at 40 kV and 40 mA. The scanning speed was 0.2°/min and the scanning angle ranged from 20° to 100° in 2θ. Energy dispersive X-ray spectroscopy (EDS) measurements were utilized to determine microstructural composition of investigated alloys as well asevaluate changes in chemical composition as a result of exposure to corrosive media. S-3400N SEM (Hitachi, Tokyo, Japan) was equipped with an UltraDry detector from ThermoFisher Scientific (Waltham, MA, USA). High-resolution X-ray photoelectron spectroscopy (XPS) studies were carried out on an Escalab 250 Xi from Thermofisher Scientific (Waltham, MA, USA), equipped with Al Kα source. Pass energy was 20 eV and the spot size diameter was 650 μm. Charge compensation was controlled through the low-energy electron and low energy Ar+ ions emission by means of a flood gun (emission current: 150 μA, beam voltage: 2.1 V, filament current: 3.5 A). Avantage software (Thermofisher Scientific, Waltham, MA, USA) was used for deconvolution purposes.
3. Results and Discussion
3.1. Microstructure Investigation
Based on the morphology of α phase, the microstructure of titanium alloys can be classified into equiaxed, lamellar and bi-modal microstructures [24]. The microstructure of Ti-based alloys can be controlled based on their chemical composition, i.e., based on the balance between the α phase stabilizing elements, such as Al, Sn and O, and the forming β phase elements such asV, Mo and Nb [25]. As shown in Figure 1, the microstructure of all studied titanium alloys consisted of bimodal structure of α/β phases. The initial microstructure of Ti-Al-V and Ti-Al-Nb alloys in as-received (forged) state was represented by equiaxed grains of primary αphase (dark), as well as β-transformed structure (light), as shown in Figure 1. The β phase formed in the microstructure of both alloys was globular in shape, but seemed larger in size in Ti-Al-V alloy than in Ti-Al-V alloy. The particle size of β phase in Al-Ti-V alloy was about 0.5–1.5 μm, while its size in Ti-Al-Nb alloy was slightly lower (about 0.25–1 μm), as depicted in Figure 1a,b.
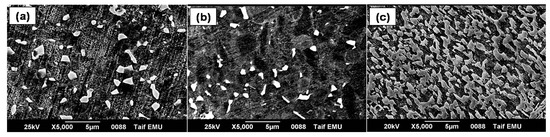
Figure 1.
Microstructure of the three investigated Ti alloys: (a) Ti-Al-V; (b) Ti-Al-Nb; and (c) TC21.
Similar to Ti-Al-V and Ti-Al-Nb alloys, the microstructure of TC21 alloy (Figure 1c) contained α and β phases, but displayed different morphologies and volume fractions. The TC21 alloy’s β phase consisted of two shapes:an acicular-like structure (Figure 2a) and a blocky shape (Figure 2b). The thickness of the acicular β phase in the TC21 alloy’s microstructure ranged from around 0.2 to 0.6 μm, while the size extent of the blocky β phase was about 0.75–1.5 μm. Moreover, the volume fraction of β phase in the microstructure of TC21 alloy was higher than that in the Ti-Al-V and Ti-Al-Nb alloys’ microstructure, as depicted in Figure 1.
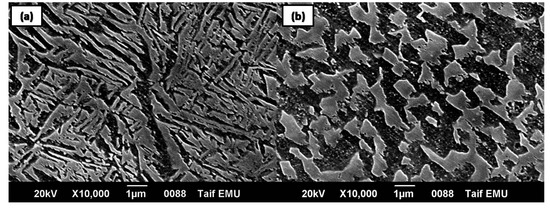
Figure 2.
Morphology of β phase in TC21 alloy: (a) acicular-like structure; and (b) blocky shaped structure.
Table 2 illustrates the volume fraction of α and β phases in the microstructure of the studied titanium alloys. The microstructure of pure Ti has the highest volume fraction of the α phase (~100%) and the lowest volume fraction of β phase (~0.0%). The presence of Al (α-phase stabilizer) and V (β-phase stabilizer) as alloying elements in the chemical composition of Ti-Al-V alloy influenced the volume fraction of α and β phases. The values of the volume fractions of α and β phases (Table 2) in the microstructure of Ti-Al-V alloy were 65% and 35%, respectively. Replacing V with Nb, yielding Ti-Al-Nb alloy, resulted in an obvious enhancement in the volume fraction of α phase (increased to 77%) at the expense of that of the β phase, which decreased to 23%, as shown in Table 2. The volume fraction of both phases in the microstructure of TC21 alloy wasalso altered, probably due to the mutual combination of the alloying elements of that alloy (cf. Table 1). The volume fractions of α and β phases in the microstructure of TC21 alloy recorded almost equal values: 48% for α phase and 52% for β phase (Table 2).
Table 2.
Volume fraction of α and β phases in the investigated Ti based alloys.
To further assess the influence of chemical composition on the microstructure and volume fraction of α and β phases, [Al]eq and [Mo]eq were calculated, where [Al]eq and [Mo]eq represent the alloying elements from α and β phases, respectively [5,26]. Table 3 illustrates the calculated values of [Al]eq and [Mo]eq for the tested Ti-based alloys, following Equations (1) and (2) [5,26].
Table 3.
and [Mo]eq for the investigated alloys [26,27].
As shown in Table 3, Ti-6Al-7Nb and TC21 alloys recorded the highest value (8.59) of [Al]eq, while the lowest value (8.05) was measured for the Ti-6Al-4V alloy. Additionally, Ti-6Al-7Nb alloy achieved the maximum value of [Mo]eq, 3.94, whileTC21 alloy recorded 1.71. Table 3 also depicts the ratio [Al]eq/[Mo]eq for the tested alloys. Ti-6Al-7Nb alloy displayed the maximum ratio, 3.94, while a minimum ratio of 1.71 was determined for the TC21 alloy. The results shown in Table 3 agree well with those in Table 2. The calculated ([Al]eq/[Mo]eq) and (α/β) ratios weremaximum in case of Ti-6Al-7Nb alloy, and minimum for the TC21 alloy.
The chemical composition of both phases in all microstructures of the investigated alloys was analyzed using the EDS unit attached to SEM. The averaged chemical composition (wt. %) for each investigated alloy is displayed in Table 4 and Table 5. It was evident that the Ti, Al, Sn and Zr elements tended to more segregate to α phase than to β phase [27]. However, V, Nb, Cr and Mo were β forming elements [28], meaning that higher ratios of these elements werefound in β phase rather than in α phase.The detailed EDS linescan/map analyses are discussed in the Supplementary Materials (Figures S1–S3).
Table 4.
Chemical composition (wt %) of different phases in Ti-6Al-4V and Ti-6Al-7Nb alloys.
Table 5.
Chemical composition (at %) of different phases in TC21 alloy.
3.2. X-ray Diffraction Studies
Phase identification was performed by X-ray diffraction (XRD) patterns to define the phases comprising each alloy sample. The diffraction patterns recorded for the studied alloys are compared in Figure 3. The phases were identified by matching the characteristic peaks with the Joint Committee on Powder Diffraction Standards (JCPDS) files [29]. The phases α-Ti (JCPDS#00-044-1294) andβ-Ti (JCPDS#00-044-1288) were common and dominated the composition of the three studied alloys. The Ti-Al-V and TC21 alloys were found to contain solely α-Ti and β-Ti phases, respectively. On the other hand, Ti-Al-Nb alloy contained some Ti and Nb oxides, TiO (JCPDS#00-008-0117) and Nb6O (JCPDS#00-015-0258).

Figure 3.
XRD diffraction patterns recorded for the Ti-6Al-4V, Ti-6Al-7Nb and TC21 samples.
An effective procedure for the simultaneous refinement of structural and microstructural parameters based on the integration of Fourier analysis for broadened peaks in the Rietveld method was first proposed by Lutterutti et al. [30] and is implemented in the Maud program [31]. Consequently, weight percent (wt.%), lattice parameters, isotropic crystallite size (D) and r.m.smicrostrain (µε) were regarded as fitting parameters in the Rietveld adjustments and refined simultaneously. The structural information for all the refined phases was obtained from the Inorganic Crystal Structure Database (ICSD) [32]. The results obtained for the structural and microstructural analysis are summarized in Table 6 for all alloys. It is worth mentioning that all studied alloys were characterized with considerable degree of preferred orientation, which strongly modified the relative intensities of the Bragg reflections, especially for α-Ti and β-Ti phases. The MAUD program also incorporates correction for preferred orientation [33,34] in the Rietveld adjustments to obtain the best fitting parameters.
Table 6.
The structural and microstructural parameters of the three alloys obtained by the Rietveld adjustment of the XRD patterns. Wt. % is the weight percentage of each phase, a and c are the cell parameters of the crystal lattice, D is the average crystallite-size and ε is the lattice microstrain.
The calculated diffraction patterns from the Rietveld adjustment are plotted with the observed ones for the three alloys in Figure 4. The average R-values obtained for the refinements were about Rwp (%) = 24–27 and Rb (%) = 15–20. The simultaneous refinements of both structural and microstructural parameters produced good matching of the calculated to observed profiles of diffracted intensities. In addition, the incorporation of the preferred orientation models enabled accounting for the variations of the peak intensities of α and β-Ti phases.
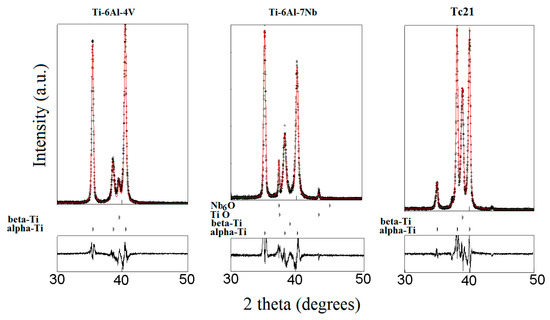
Figure 4.
The calculated (red line) and recorded (black dots) diffraction patterns for the three alloys as obtained from the Rietveld adjustments using the MAUD program; the positions of the Bragg reflections of each phase and the difference between the calculated and observed patterns are also presented at the bottom.
In the Rietveld adjustment of the Ti-6Al-4V alloy, the hcp α-Ti (Space group ) together with the bcc β-Ti (Space group ) dominated the composition of the alloy. In the second alloy, Ti-6Al-7Nb, the formation of some TiO (Space group ) and Nb6O (Space group ) was observed and they formed larger crystallites than those formed in the Ti phases. The total weight percent of those oxide phases was less than 10% (Table 6). For the third alloy, TC21, only α- and β-Ti phases were observed in the XRD patterns. No oxide phases were detected due to the slight oxygen content of this alloy. Nevertheless, there weresome mismatches between the wt% values obtained from the Rietveld adjustments and the corresponding wt% values determined with other techniques. This was attributed to the behavior of the preferred orientation of the α-Ti phase observed for the reflection (100), which was relatively stronger for the Ti-6Al-4V and Ti-6Al-7Nb alloys than in the TC21 alloy.
As shown in Table 6, the last two alloys, Ti-6Al-7Nb and TC21, contained relatively higher portions of β-Ti than α-Ti in contrast to the first alloy, Ti-6Al-4V, which hadα-Ti content higher than β-Ti. As known from the literature, Al is an α-stabilizing while V, Nb, Mo and Fe are β-stabilizing elements. Nevertheless, the results indicate that Nb, Mo and Fe hadstronger capabilities to stabilize β-Ti phase than V. These findings corroborate microstructural studies (cf. Section 3.1).
3.3. Electrochemical Measurements
3.3.1. Uniform Corrosion Studies
Figure 5 illustrates the cathodic and anodic polarization curves for the studied alloys in comparison with pure Ti, after seven days of immersion in 0.9% NaCl solution at 37 °C. As shown in Figure 5, among the studied alloys, TC21 alloy exhibited the lowest cathodic and anodic overpotentials, corresponding to enhanced corrosion rate. On the contrary, Ti-6Al-7Nb alloy displayed the highest overpotentials, close to that of Ti, for both the cathodic and anodic processes, thus referring to its highest corrosion resistance.
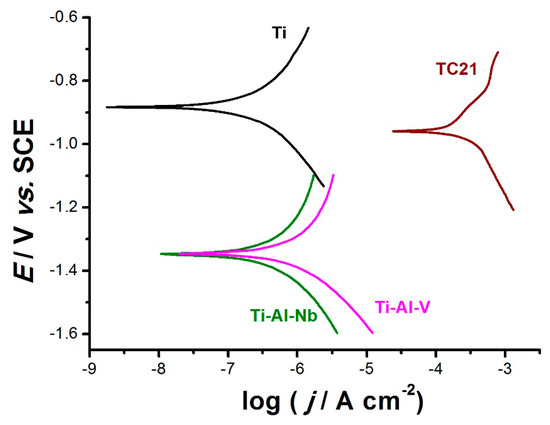
Figure 5.
Cathodic and anodic polarization curves recorded for the three tested alloys in comparison with pure Ti, after seven days of exposure in 0.9% NaCl solution at a scan rate of 0.5 mV s−1 at 37 °C.
Indeed, Tafel slopes and respective calculated uniform corrosion rates for a metal covered with a semi-conductive passive film raisedstrong doubts, despite the utilization of the Tafel extrapolation method to determine corrosion rates for Ti and some Ti-based alloys [35,36]. In addition, in Figure 5, the polarization curves do not display the expected log/linear Tafel behavior. This was clear in both the anodic and cathodic branches of alloys Ti-6Al-4V and Ti-6Al-7Nb and as well as in the anodic branches of Ti and TC21 alloy, which exhibited some sort of curvature over the complete applied potential range. This in turn made evaluation of Tafel slopes by Tafel extrapolation method, and hence corrosion rates, inaccurate [37,38,39]. There is, therefore, an uncertainty and source of error in the numerical values of Tafel slopes (βa and βc), and possibly in the values of jcorr.
The curvature of the anodic branch mightbe attributed to the deposition of the corrosion products and/or passive film formation, as evidenced from XPS studies. With respect to the cathodic branch, since the solution was stationary, diffusion of the electrochemically active species was slow, and concentration polarization couldact to shorten the cathodic linear Tafel region. In the extreme case, linearity mightdisappear altogether, with the cathodic reaction proceeding under combined activation and diffusion control at Ecorr [37,38,39]. This counteracted the validity of the Tafel extrapolation method for measuring uniform corrosion rates, which was successfully applied for the charge transfer controlled processes.
EIS measurements were also conducted at the respective Ecorr during sample’s exposure in 0.9% NaCl solution at 37 °C to confirm the polarization data and to assess the kinetics of the uniform corrosion process on alloy surface. The measurements were carried day-by-day allowing for monitoring of uniform corrosion susceptibility [40,41,42]. Figure 6 displays the impedance plots in Bode projection, recorded for the studied alloys during the second and the last day of exposure. Pure Ti (99.99%) was also included for comparison (see Figure 6a). The impedance spectra recorded on Day 1 (after initial 120 min of conditioning) were highly scattered due to non-stationary conditions at the metal/electrolyte interface, which is a common problem in EIS measurements. This issue became negligible after a few hours of exposure. For this reason, results recorded on Days 2–7 were considered for further analysis. All the impedance plots exhibited a single time constant (capacitive loop). The overall corrosion resistance of each investigated alloy was very high; the impedance modulus |Z| linearly increasedwith frequency decrease, reaching over 105 at 0.1 Hz. For each studied alloy, inclination of the phase angle θ was shifted towards lower frequencies on Day 7 of exposure, testifying tothe decreased corrosion process kinetics.
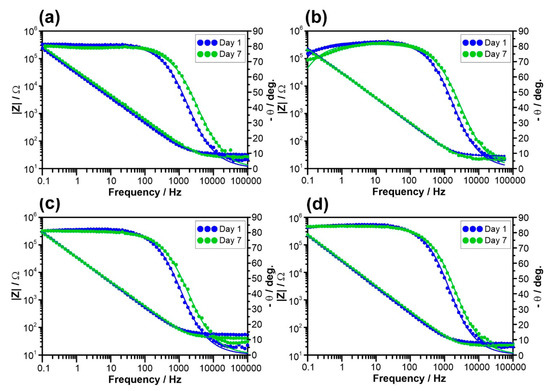
Figure 6.
Bode impedance plots on Days 2 and 7 of exposure, recorded for: (a) pure Ti; and three tested alloys: (b) TC21; (c) Ti-6Al-4V; and (d) Ti-6Al-7Nb. Studies performed at Ecorr in 0.9%NaCl solution at 37 °C. Points represent experimental results while the solid line was calculated based on R(QR) EEC.
An electric equivalent circuit (EEC) was proposed to analyze the impedance results. When defining the adequate EEC, one must consider whether to include the space charge layer resulting from the semi-conductive nature of titanium oxides. In his studies, Blackwood concluded that thickness of the space charge layer is considerably less than the oxide film itself in the open circuit conditions [43]. On the other hand, its dominant influence was observed under anodic polarization conditions [43,44,45,46]. The impedance measurements of titanium oxide films investigated within this manuscript were studied under open circuit conditions, thus the parallel resistance and CPE represented primarily the dielectric properties of the passive layer. Due to absence of additional time constants in the analyzed frequency rage, a simple Randles circuit was proposed with constant phase element (CPE) selected instead of capacitance to account for the dispersion of the time-constant. The parallel resistance represents the sum of charge-transfer limiting effects through the metal/electrolyte interface, dominated by the passive layer resistance RF [47]. The aforementioned time-constant dispersion originated from thepresence of the charge space layer in the semi-conductive film, thesurface distribution of the time-constant due to the geometric heterogeneity (pits, scratches, and porosity), and diversified surface electric properties due to adsorption processes of passive layer breakdown [48].
The CPE impedance ZCPE = (Q(jω)n)−1 represents a capacitor with capacitance 1/Q for a homogeneous surface n→ 1. Thus, it is often believed that CPE component n is the heterogeneity factor and its variation can be monitored. CPE describes quasi-capacitive behavior of the passive layer. The effective capacitance Ceff can be calculated based on CPE using Hirschorn’s model for surface distribution of time constants [49]. The EEC can be schematically written as RS(QRF), where RS is electrolyte resistance. The aforementioned single time-constant EEC covers all the applied frequency range. The fitting quality is represented by solid lines in Figure 6a–d.
Figure 7 depicts the electric parameters obtained on the base of RS(QRF) EEC and their changes during the one-week exposure. The higher was the RF, the lower was the corrosion current density, offering an easy comparison in uniform corrosion resistance of investigated alloys (see Figure 7a). Each investigated alloy was characterized with very high resistance, order of MΩ, owing to a presence of a passive layer tightly covering the metal surface. Nevertheless, for TC21 alloy, RFvalue wasone order of magnitude lower and slowly but consistently decreased throughout the exposure, revealing its lower corrosion resistance and corroborating DC electrochemical studies.
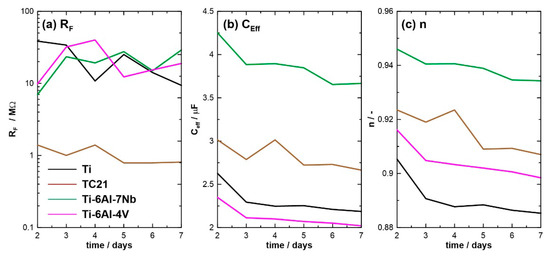
Figure 7.
Monitoring of (a) passive layer resistance RF, (b) effective capacitance Ceff and (c) CPE exponent n calculated on the base of RS (QRF) EEC for each investigated alloy. The one-week exposure was carried out in 0.9% NaCl solution at 37 °C.
The analysis of constant phase element (CPE) alloweddrawing conclusions onthe passive layer homogeneity. The effective capacitance Ceff, calculated using the surface distribution model, was similar for allinvestigated alloys, falling in a range between 2 and 5 μF. The differentiation may result from differences in passive layer thickness d and to some extent from relative permittivity of alloying additives and their oxides εr according to: C = ε0εrd/A, where ε0 is the absolute permittivity and A is the electrochemically active surface area. A steady decrease of Ceff was attributed to an increase of passive layer thickness, denouncing further passivation of metal in investigated electrolytic conditions. The presence of stable corrosion pits would be visible in theform of rapid increase in Ceff [49,50] (likely observed in TC21 alloy on Day 4).
The initial value of CPE exponent n depends on factors such as surface phase distribution and geometric defects remaining after polishing. Its decrease throughout the exposure in corrosive electrolyte reflected the appearance of heterogeneities on analyzed sample surface, which in this case was primarily associated with initial phases of corrosion pits formation (see Figure 8c). This effect was clearly seen in SEM micrographs (see below). Notably, the value of n factor of Ti-6Al-7Nb alloy was both the highest and the least affected by exposure in corrosive media. The aforementioned observation indicated high surface homogeneity, which may be the reason behind outstanding corrosion resistance of this alloy.
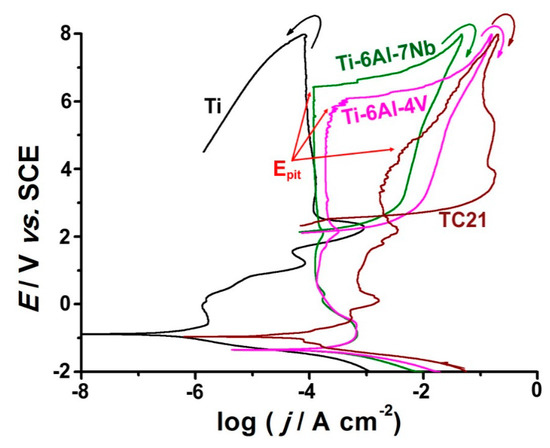
Figure 8.
Cyclic polarization curves recorded for the studied alloys in 0.9% NaCl solutions at a scan rate of 1.0 mV s−1 at 37 °C.
3.3.2. Cyclic Polarization Measurements
Figure 8 shows typical cyclic polarization curves recorded for the studied alloys between −2.0 V and + 8.0 V (SCE). Measurements were conducted in 0.9% NaCl solution at a scan rate of 5.0 mV s−1 at 37 °C.
The polarization curve of TC21 alloy exhibited active dissolution near Ecorr, followed by an obvious enhancement in the anodic current with the applied potential due to thinning and weakening of the passive layer as a result of the aggressive attack of Cl− anions. In addition, Ti-6Al-7Nb and Ti-6Al-4V alloys showed active dissolution near Ecorr, but to a much lower extent than TC21, and, in addition, tended to passivate with a very low current covering a wide range of potential. These findings reflect the weaker passivity of TC21 and its higher tendency to corrode in this solution than Ti-6Al-4V and Ti-6Al-7Nb alloys. On the contrary, as expected, the anodic polarization curve of pure Ti exhibited typical passivity near Ecorr, referring to its high corrosion resistance.
Passivity of the studied alloys persisted up to reaching pitting potential (Epit). Remarkable changes occurred within the passive region at potentials exceeding Epit. These involved a sudden increase in corrosion current density and formation of a hysteresis loop on the reverse potential scan. These events werea clear sign ofpassivity breakdown, and initiation and propagation of pitting corrosion. Repassivation was only achieved when the reverse scan intersected the forward one within the passive region, below which the working electrode was immune to pitting [51].
A current intermission could be seen on the reverse scan of the three tested alloys. This current discontinuity aws quite clear on the reverse scan of the TC21 alloy, and couldbe observed for Ti-6Al-7Nb and Ti-6Al-4V alloys. We previously reported similar findings during pitting corrosion studies of Zn in nitrite solutions [52]. Recently, Zakeri et al. [53] explored the transition potential and the repassivation potential of AISI type 316 stainless steel in chloride containing media devoid of and containing 0.01 M thiosulfate.
Beyond pit transition potential, the rate of anodic dissolution was diffusion-controlled [51,52,53]. Such a current transient relationship, when satisfied, referred to an anodic diffusion control process [53]. On reversing the potential scan, the thickness of the salt (pitting corrosion product) film diminished. This decrease in salt film thickness enhanced with back scanning untila certain potential was reached, at which the cation concentration decreased below the saturated concentration. At this stage, salt precipitation was stopped, and the remaining metal salt film dissolved, making the bottom of pits free from salt film. This in turn established an ohmic/activation control (a linear decrease of current density with potential) regime.
Ti-6Al-7Nb alloy’s passivity seemed stronger and more stable that of the Ti-6Al-4V alloy. The latter was characterized by a higher jpass, which enhanced with potential untilits Epit, which attained ~50 mV vs. SCE before that of the former. In addition, the pits existing on the surface of Ti-6Al-4V alloy were much more difficult to repassivate than those on the surface of Ti-6Al-7Nb alloy, as the hysteresis loop of the former was much larger than that of the later.
Another important pitting corrosion controlling electrochemical parameter is the pitting corrosion resistance Rpit = |Ecorr − Epit|, which defines the resistance against the nucleation of new pits [38]. Referring to Figure 8, it is clear that Rpit increased following the order: TC21 << Ti-6Al-4V < Ti-6Al-7Nb. The resistance against growth of the pits also controlled the susceptibility toward pitting corrosion. A specific routine of the software (Autolab frequency response analyzer (FRA) coupled to an Autolab PGSTAT30 potentiostat/galvanostat with FRA2 module) (Metrohm, Herisau, Switzerland.) was used to calculate the areas of the hysteresis loops, related to the charge consumed during the growth of such already formed pits. Again, the hysteresis loop of the TC21 alloy recorded the highest area (charge consumed) among the studied alloys, while the lowest value of the hysteresis loop charge consumed during was measured for Ti-6Al-7Nb alloy. Thus, the resistance against the growth of pre-existing pits was ranked as: Ti-6Al-7Nb > Ti-6Al-4V >> TC21. These findings mean that replacing V by Nb in Ti-6Al-4V alloy promoted alloy’s repassivation, thus enhancing its pitting corrosion resistance.
3.3.3. Chronoamperometry Measurements
Chronoamperometry (j/t) measurements were also carried out to confirm the above results and gain more information about the influence of alloyed V and Nb on the passive layer growth kinetics and breakdown. Figure 9a and Figure 10b depict the j/t curves measured for the tested alloys at two different Ea values, far below and close to Eb. Measurements were conducted in 0.9% NaCl solution at 37 °C. The profile of the obtained curves was found to vary according to the chemical composition of the studied alloy and the position of Ea versus Epit. When Ea was located far cathodic to Epit, a j/t profile with two stages was obtained, as shown in Figure 9a. During the first stage, the anodic current (ja) declined with a rate depending upon chemical composition of the tested alloy, denoting passive layer electroformation and growth [39]. This decay in current then reached a steady-state value (jss), an almost constant passive current related to jpass (cf. Figure 8), constituting the secondstage of the current. The constancy of jss originated from a balance between the rates of the passive layer growth (current builds up) and its dissolution (current decays) [54,55].
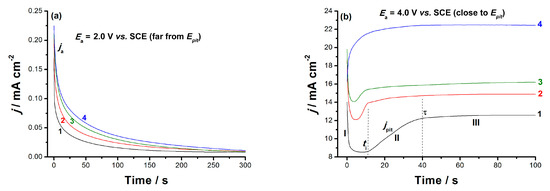
Figure 9.
Chronoamperometry (current–time) curves recorded for the studied solder alloys in 0.9% NaCl solution at applied anodic potentials of 2.0 V (a) and 4.0 V (b) vs. SCE at 37 °C: (1) pure Ti; (2) Ti-6Al-7Nb; (3) Ti-6Al-4V; and (4) TC21.
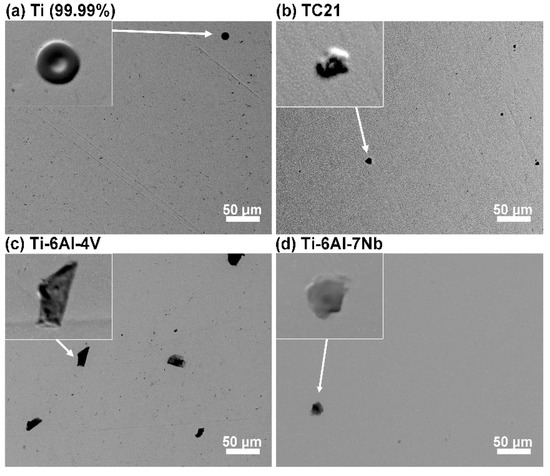
Figure 10.
SEM micrographs taken in secondary electron mode for each investigated sample: (a) pure Ti as a reference; (b) TC21 alloy; (c) Ti-6Al-4V; and (d) Ti-6Al-7Nb at the end of one-week exposure in 0.9% NaCl at 37 °C. Magnification: × 500. In the inset, back-scatter electron topography mode images of selected surface defects. Magnification: × 2000.
Further, Figure 9a demonstrates that the rate of ja decay, and consequently the rate of passive layer growth, diminished upon alloying Ti with V and Nb. These results further confirm the influence of the alloying elements V and Nb, with V being more active than Nb, which, when added to Ti, weakened its passivity viadepassivation (destabilizing the passive oxide film through oxide film thinning/dissolution [56]). This in turn madethe passive film more susceptible to pitting.
At an Ea value very close to Epit (Figure 9b), the j/t curves with three different stages (I–III) were recorded. Similar results were previously obtained in our lab [55,57]. Stage I refersto the passive layer electroformation and growth, as its current fellwith time [54,55,57]. Stage I ended at a certain time (ti), the incubation time, where Stage I’s current reached its minimum value; ti is defined as the time the adsorbed aggressive Cl− anions must acquire to locally attack and subsequently remove the passive oxide film [54]. The magnitude of ti, more specifically its reciprocal value (1/ti), denotes the rate of pit initiation and growth [54,55], and measures the susceptibility of the oxide film to breakdown and initiate pit formation and growth.
Stage II began at ti and terminated at time τ, and its current aws termed jpit (pit growth current density). jpit increased from the moment just after ti and continuedto grow until τ, suggesting that the pit formation and growth dominated over passivation during this stage. Ultimately, jpit attaineda steady-state just after the time τ, denoting the onset of Stage III, and remained almost constant until the end of the run. The constancy of Stage III’s current was attributed to the hindrance of the current flow (jpit) through the pits sealed off by the pitting corrosion products formed during the events of Stage II, namely pit initiation and growth [55,57]. This hindrance in jpit was balanced by a current increase due to metal dissolution, thus yielding an overall steady-state current.
Close inspection of Figure 9 reveals that jpit increased and ti shortened, thus referring to accelerated pitting attack, in presence of alloyed V. These results again support the catalytic impact of alloyed V towards pitting corrosion
3.4. Surface Morphology and Composition
After one-week exposure, the investigated samples were reexamined using SEM to evaluate the susceptibility to pitting corrosion. This procedure was carried out after rinsing in ethanol using ultrasonic cleaner. The results of the analysis are exhibited in Figure 10. Defects started to appear on the surface of each analyzed sample throughout the exposure. The micrographs in the inset of Figure 10 were taken using back-scatter electrons (BSE) in topography mode. This allowed bringing out the geometry of aforementioned defects. As can be seen, each analyzed defect formed a bulge above the alloy’s surface, testifying to either repassivation once shallow corrosion pits formed or at an early stage of passive layer degradation. Ti-6Al-4V sample was characterized with both the highest amount and the largest defects, reaching 30 μm in diameter. On the other hand, the surface of pure Ti and Ti-6Al-7Nb appeared the most intact. No real corrosion pits were observed on the surface of either investigated alloy at the end of exposure in 0.9% NaCl solution at 37 °C, testifying tothe overall high pitting corrosion resistance.
Nevertheless, the passive layer must have weakened, hence it was possible for corrosion products to adsorb on the metal surface. EDS analysis was carried out on the defects observed on each investigated alloy to qualify their chemical constitution. The exemplary results, obtained for Ti-6Al-7Nb alloy, are summarized in Figure S4 (Supplementary Materials). The chemistry of defects observed for each investigated alloy was similar. The defects were primarily composed of carbon and oxygen, most likely forming metal carbonates typical for early pitting corrosion stages [58]. Small amount of chlorine was also found within defects. Its low amount was distorted by EDS depth of analysis ranging few microns.
The chemistry of the passive layer in each examined case was composed primarily of titanium (IV) oxides, as verified by a strong recorded Ti2p peak doublet, with Ti2p3/2 component located each time at 458.6 eV [48,59,60] (Figure 11). Furthermore, there was no sign of titanium oxides at lower oxidation states corroborating the aforementioned result (see Supplementary Materials, Figure S5). Besides the titanium, other alloying additives also tookpart in the passivation process. The strongest signal among the alloying additives was recorded for aluminum oxide Al2O3 (Al2p3/2 peak at 74.5 eV), ranging between 3.5 and 3.8 at.% for each sample [61,62]. The contribution of VO2 (V2p3/2 at 516.4 eV) in Ti-Al-V and Nb2O5 (Nb3d5/2 at 207.1 eV) in Ti-Al-Nb alloy did not exceed 0.7 at.% [60,63,64]. The passive film formed on the surface of TC21 alloy was naturally more complex. Besides TiO2, it wascomposed of Al2O3 (3.8 at.%), Nb2O5 (0.3 at.%), ZrO2 (0.4 at.%, Zr3d5/2 at 182.4 eV), Cr2O3 (0.8 at.%, Cr2p3/2 at 576.0 eV), SnO2 (0.1 at.%, Sn3d3/2 at 486.5 eV), MoO3 and MoO2 (0.2+0.2 at.%, Mo3d5/2 at 232.9 and 229.2 eV, respectively) [65,66,67,68].
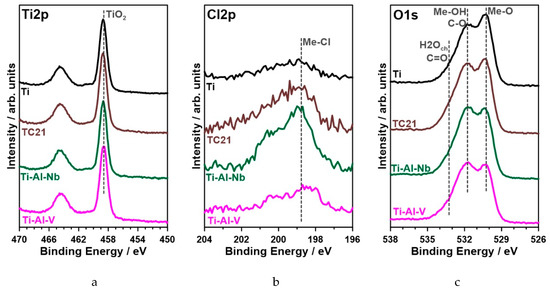
Figure 11.
High-resolution XPS spectra recorded in (a) Ti2p, (b) Cl2p and (c) O1s energy range for each investigated alloy after seven days of exposure to 0.9% NaCl solution at 37 °C.
The high-resolution spectra analysis carried out in the Cl2p energy range confirmed the electrochemical and microscopic studies regarding chloride adsorption on the metal surface as a result of seven-day metal exposure to chloride-containing electrolyte. Full chemical analysis is summarized in Table 7. Metal chlorides were found on the surface of each investigated sample, which confirmed metal-chlorine bond formation, shownby a peak doublet: Cl2p3/2 at 198.9 eV [48,55,69]. Nevertheless, the amount of adsorbed chlorides Was nearly 2.5 times higher for the TC21 alloy than pure titanium. The chloride concentration obtained for highly resistant Ti-6Al-7Nb alloy was nearly on par withTi sample, and slightly smaller than in the case of Ti-6Al-4V. An interesting conclusion couldbe drawn based on O1s peak analysis for each investigated sample. The spectra were conventionally deconvoluted into three components. Two dominant components located at 530.2 and 531.6 eV were ascribed to Me-O and Me-OH species, respectively. The second component intensity mightbe further influenced by the presence of C-O bonds in carbonates. Its formation may result from prolonged electrolyte exposure as well as adventitious carbon deposition due to air exposure [61,64]. The finding regarding carbonate adsorption on the metal surface wasfurther confirmed by a third O1s component at 532.8 eV, typical for C=O bonds but also chemisorbed water molecules. For clarity purposes, the analysis excluded data recorded for carbon C1s, which was found in large amounts, up to 30 at.%, at binding energies corroborating adventitious carbon and carbonates. Importantly, the highest amount of the adsorbed carbonate species was found on Ti-Al-V sample surface, which is in very good agreement with SEM micrographs presented in Figure 10. The least amount of carbonate species was once more found on the surface of Ti sample.
Table 7.
XPS deconvolution results carried out in Ti2p, Cl2p and O1s energy range after seven days of exposure to 0.9% NaCl solution at 37 °C (in at.%).
4. Conclusions
The effect of microstructure on the uniform and pitting corrosion characteristics of Ti-Al-V, and Ti-Al-Nb alloys were studied. Pure Ti and TC21 alloy were included for comparison. Measurements were conducted in 0.9% NaCl solution at 37 °C employing various electrochemical techniques, and complemented with XRD and SEM/EDS analysis. The obtained results reveal that:
- The microstructure of the investigated alloys consisted of α matrix, which was strengthened by β phase in all studied alloys except cp-Ti alloy.
- The volume fraction of β phase in TC21 alloy was higher than in both Ti-Al-V and Ti-Al-Nb alloys. In comparison with other alloys, Ti-Al-Nb alloy had the lowest volume fraction of β phase.
- Ti-Al-Nb alloy exhibitedthe highest corrosion resistance (lowest corrosion rate) among other alloys.
- The addition of Nb alloying element at the expense of V in Ti-Al-V alloy decreased the volume fraction of β phase, which improvedthe corrosion resistance of Ti based alloy.
- The polarization curve of TC21 alloy exhibited active dissolution near Ecorr, followed by enhanced anodic current with the applied potential, thus revealing weak passivity. On the contrary, Ti-6Al-7Nb and Ti-6Al-4V alloys recorded much lower dissolution rate near Ecorr followed by a wide potential range of stable passivity.
- Stable passivity of Ti-6Al-7Nb and Ti-6Al-4V alloys was translated into an obvious anodic (more noble) drift in their pitting potential (Epit) versus that of the TC21 alloy.
- Chronoamperometry measurements, conducted at a fixed anodic potential, revealed that the rate of passivity breakdown of Ti-6Al-7Nb and Ti-6Al-4V alloys wasmuch lower than that of the TC21 alloy.
- The XPS results reveal adsorption of chloride and carbonate species on the surface of the investigated alloys with the lowest amount recorded for cp-Ti and Ti-6Al-7Nb alloys, affecting the observed corrosion resistance.
- Corrosion studies confirmed that the uniform and pitting corrosion rates increased following the sequence: Ti< Ti-6Al-7Nb < Ti-6Al-4V < TC21.
Supplementary Materials
The following are available online at https://www.mdpi.com/1996-1944/12/8/1233/s1. Figure S1—SEM image (a) and EDS spectrum (b) of phase in Ti-Al-V alloy; Figure S2—Line analysis of β phase in TiAlNb alloy; Figure S3—Microstructure of the Ti-Al-Nb alloy (a), and mapping of Ti (b), Al (c), and Nb (d) alloying elements. Figure S4—(a) SEM micrograph with marked areas for EDS analysis, (b) EDS examination at defect and at the surrounding, not corroded area. Figure S5—High-resolution Ti2p XPS spectra with the quality fit (light blue line) for each studied alloy: (a) pure Ti reference, (b) TC21, (c) Ti-6Al-4V, (d) Ti-6Al-7Nb.
Author Contributions
Conceptualization, M.A.A. and R.B.; resources, N.E.-B. and S.E.-H.; investigation, S.I.A. and O.A.A.A, (XRD), A.M.F. and M.M.I. (uniform corrosion), M.A.A. and G.A.M.M. (passive layer breakdown), N.E.-B., J.W. and S.E.-H. (microstructure), J.R. (XPS), and J.R. and J.W. (EIS); writing—original draft preparation, all authors; writing—review and editing, J.R., M.A.A. and R.B.; and project administration, M.A.A.
Funding
This study was funded by the Deanship of Scientific Research, Taif University, Saudi Arabia (Project No. 1-439-6070).
Conflicts of Interest
The authors declare no conflict of interest.
References
- de Assis, S.L.; Wolynec, S.; Costa, I. Corrosion characterization of titanium alloys by electrochemical techniques. Electrochim. Acta 2006, 51, 1815–1819. [Google Scholar] [CrossRef]
- Geetha, M.; Singh, A.K.; Asokamani, R.; Gogia, A.K. Ti based biomaterials, the ultimate choice for orthopaedic implants—A review. Prog. Mater. Sci. 2009, 54, 397–425. [Google Scholar] [CrossRef]
- Jiang, H. Enhancement of Titanium Alloy Corrosion Resistance via Anodic Oxidation Treatment. Int. J. Electrochem. Sci. 2018, 3888–3896. [Google Scholar] [CrossRef]
- Moiseyev, V.N. Titanium Alloys: Russian Aircraft and Aerospace Applications; Advances in Metallic Alloys; Taylor & Francis: Boca Raton, FL, USA, 2006; ISBN 978-0-8493-3273-9. [Google Scholar]
- Leyens, C.; Peters, M. (Eds.) Titanium and Titanium Alloys: Fundamentals and Applications; Wiley-VCH: Weinheim, Germany; John Wiley: Chichester, UK, 2003; ISBN 978-3-527-30534-6. [Google Scholar]
- Lütjering, G.; Williams, J.C. Titanium: With 51 Tables; Springer: Berlin/Heidelberg, Germany, 2007; ISBN 978-3-540-71397-5. [Google Scholar]
- Oberwinkler, B.; Riedler, M.; Eichlseder, W. Importance of local microstructure for damage tolerant light weight design of Ti–6Al–4V forgings. Int. J. Fatigue 2010, 32, 808–814. [Google Scholar]
- Knobbe, H.; Köster, P.; Christ, H.-J.; Fritzen, C.-P.; Riedler, M. Initiation and propagation of short fatigue cracks in forged Ti6Al4V. Procedia Eng. 2010, 2, 931–940. [Google Scholar]
- Fekry, A.M.; El-Sherif, R.M. Electrochemical corrosion behavior of magnesium and titanium alloys in simulated body fluid. Electrochim. Acta 2009, 54, 7280–7285. [Google Scholar] [CrossRef]
- Whittaker, M. Titanium Alloys. Metals 2015, 5, 1437–1439. [Google Scholar] [CrossRef]
- Mountford, J.A., Jr. Titanium—Properties, Advantages and Applications Solving the Corrosion Problems in Marine Service. In Proceedings of the CORROSION, Denver, CO, USA, 7–11 April 2002. [Google Scholar]
- Al-Mayouf, A.; Al-Swayih, A.; Al-Mobarak, N.; Al-Jabab, A. Corrosion behavior of a new titanium alloy for dental implant applications in fluoride media. Mater. Chem. Phys. 2004, 86, 320–329. [Google Scholar] [CrossRef]
- García, C.; Ceré, S.; Durán, A. Bioactive coatings deposited on titanium alloys. J. Non-Cryst. Solids 2006, 352, 3488–3495. [Google Scholar]
- Sharma, A.K. Anodizing titanium for space applications. Thin Solid Film. 1992, 208, 48–54. [Google Scholar] [CrossRef]
- Barjaktarević, D.R.; Cvijović-Alagić, I.L.; Dimić, I.D.; Đokić, V.R.; Rakin, M.P. Anodization of Ti-based materials for biomedical applications: A review. Metall. Mater. Eng. 2016, 22, 129–144. [Google Scholar] [CrossRef]
- Qu, Q.; Wang, L.; Chen, Y.; Li, L.; He, Y.; Ding, Z. Corrosion Behavior of Titanium in Artificial Saliva by Lactic Acid. Materials 2014, 7, 5528–5542. [Google Scholar] [CrossRef]
- Hines, J.A.; Lutjering, G. Propagation of microcracks at stress amplitudes below the conventional fatigue limit in Ti-6Al-4V. Fatigue Fract. Eng. Mater. Struct. 1999, 22, 657–665. [Google Scholar]
- Sieniawski, J.; Ziaja, W.; Kubiak, K.; Motyk, M. Microstructure and Mechanical Properties of High Strength Two-Phase Titanium Alloys. In Titanium Alloys—Advances in Properties Control; Sieniawski, J., Ed.; InTech: London, UK, 2013; ISBN 978-953-51-1110-8. [Google Scholar]
- Gai, X.; Bai, Y.; Li, J.; Li, S.; Hou, W.; Hao, Y.; Zhang, X.; Yang, R.; Misra, R.D.K. Electrochemical behaviour of passive film formed on the surface of Ti-6Al-4V alloys fabricated by electron beam melting. Corros. Sci. 2018, 145, 80–89. [Google Scholar]
- Dadé, M.; Esin, V.A.; Nazé, L.; Sallot, P. Short- and long-term oxidation behaviour of an advanced Ti2AlNb alloy. Corros. Sci. 2019, 148, 379–387. [Google Scholar] [CrossRef]
- Chávez-Díaz, M.; Escudero-Rincón, M.; Arce-Estrada, E.; Cabrera-Sierra, R. Effect of the Heat-Treated Ti6Al4V Alloy on the Fibroblastic Cell Response. Materials 2017, 11, 21. [Google Scholar] [CrossRef] [PubMed]
- Hussein, M.; Kumar, M.; Drew, R.; Al-Aqeeli, N. Electrochemical Corrosion and In Vitro Bioactivity of Nano-Grained Biomedical Ti-20Nb-13Zr Alloy in a Simulated Body Fluid. Materials 2017, 11, 26. [Google Scholar] [CrossRef] [PubMed]
- Zhang, L.; Duan, Y.; Gao, R.; Yang, J.; Wei, K.; Tang, D.; Fu, T. The Effect of Potential on Surface Characteristic and Corrosion Resistance of Anodic Oxide Film Formed on Commercial Pure Titanium at the Potentiodynamic-Aging Mode. Materials 2019, 12, 370. [Google Scholar] [CrossRef] [PubMed]
- Reda, R.; Nofal, A.; Hussein, A.-H. Effect of Single and Duplex Stage Heat Treatment on the Microstructure and Mechanical Properties of Cast Ti–6Al–4V Alloy. Metallogr. Microstruct. Anal. 2013, 2, 388–393. [Google Scholar] [CrossRef]
- El-Bagoury, N.; Ibrahim, K. Microstructure, Phase Transformations and Mechanical Properties of Solution Treated Bi-Modal Titanium Alloy. Int. J. Eng. Sci. Res. Technol. 2016, 5, 517–525. [Google Scholar]
- Zhao, X.; Sun, S.; Wang, L.; Liu, Y.; He, J.; Tu, G. A New Low-Cost β-Type High-Strength Titanium Alloy with Lower Alloying Percentage for Spring Applications. Mater. Trans. 2014, 55, 1455–1459. [Google Scholar] [CrossRef]
- Phukaoluan, A.; Khantachawana, A.; Dechkunakorn, S.; Anuwongnukroh, N.; Santiwong, P.; Kajornchaiyakul, J. Effect of Cu and Co Additions on Corrosion Behavior of NiTi Alloys for Orthodontic Applications. Adv. Mater. Res. 2011, 378–379, 650–654. [Google Scholar] [CrossRef]
- Lee, C.S.; Won, J.W.; Lee, Y.; Yeom, J.-T.; Lee, G.Y. High Temperature Deformation Behavior and Microstructure Evolution of Ti-4Al-4Fe-0.25Si Alloy. Korean J. Met. Mater. 2016, 54, 338–346. [Google Scholar] [CrossRef]
- ICDD. PDF 2, Database Sets 1-45; The International Centre for Diffraction Data: Newtown Square, PA, USA, 1995. [Google Scholar]
- Lutterotti, L.; Scardi, P. Simultaneous structure and size–strain refinement by the Rietveld method. J. Appl. Crystallogr. 1990, 23, 246–252. [Google Scholar] [CrossRef]
- Lutterotti, L. Total pattern fitting for the combined size–strain–stress–texture determination in thin film diffraction. Nucl. Instrum. Methods Phys. Res. Sect. B Beam Interact. Mater. At. 2010, 268, 334–340. [Google Scholar] [CrossRef]
- Belsky, A.; Hellenbrand!, M.; Karen., V.L.; Luksch, P. New developments in the inorganic crystal structure database (ICSD): Accessibility in support of materials research and design. Acta Crystallogr. 2002, 858, 364–369. [Google Scholar] [CrossRef]
- Dollase, W.A. Correction of intensities for preferred orientation in powder diffractometry: Application of the March model. J. Appl. Crystallogr. 1986, 19, 267–272. [Google Scholar] [CrossRef]
- Will, G.; Bellotto, M.; Parrish, W.; Hart, M. Crystal structures of quartz and magnesium germanate by profile analysis of synchrotron-radiation high-resolution powder data. J. Appl. Crystallogr. 1988, 21, 182–191. [Google Scholar] [CrossRef]
- Cvijović-Alagić, I.; Cvijović, Z.; Mitrović, S.; Panić, V.; Rakin, M. Wear and corrosion behaviour of Ti–13Nb–13Zr and Ti–6Al–4V alloys in simulated physiological solution. Corros. Sci. 2011, 53, 796–808. [Google Scholar] [CrossRef]
- Simsek, I.; Ozyurek, D. Investigation of the wear and corrosion behaviors of Ti5Al2.5Fe and Ti6Al4V alloys produced by mechanical alloying method in simulated body fluid environment. Mater. Sci. Eng. C 2019, 94, 357–363. [Google Scholar] [CrossRef] [PubMed]
- Mansfeld, F. Tafel slopes and corrosion rates obtained in the pre-Tafel region of polarization curves. Corros. Sci. 2005, 47, 3178–3186. [Google Scholar] [CrossRef]
- Flitt, H.J.; Schweinsberg, D.P. A guide to polarisation curve interpretation: Deconstruction of experimental curves typical of the Fe/H2O/H+/O2 corrosion system. Corros. Sci. 2005, 47, 2125–2156. [Google Scholar] [CrossRef]
- Flitt, H.J.; Schweinsberg, D.P. Evaluation of corrosion rate from polarisation curves not exhibiting a Tafel region. Corros. Sci. 2005, 47, 3034–3052. [Google Scholar] [CrossRef]
- Krakowiak, S.; Darowicki, K.; Ślepski, P. Impedance of metastable pitting corrosion. J. Electroanal. Chem. 2005, 575, 33–38. [Google Scholar] [CrossRef]
- Darowicki, K.; Krakowiak, S.; Slepski, P. The time dependence of pit creation impedance spectra. Electrochem. Commun. 2004, 6, 860–866. [Google Scholar] [CrossRef]
- Gerengi, H.; Slepski, P.; Ozgan, E.; Kurtay, M. Investigation of corrosion behavior of 6060 and 6082 aluminum alloys under simulated acid rain conditions: Corrosion behavior of 6060 and 6082 Al alloys under acid rain. Mater. Corros. 2015, 66, 233–240. [Google Scholar] [CrossRef]
- Blackwood, D. Influence of the space-charge region on electrochemical impedance measurements on passive oxide films on titanium. Electrochim. Acta 2000, 46, 563–569. [Google Scholar] [CrossRef]
- Hamadou, L.; Aïnouche, L.; Kadri, A.; Yahia, S.A.A.; Benbrahim, N. Electrochemical impedance spectroscopy study of thermally grown oxides exhibiting constant phase element behaviour. Electrochim. Acta 2013, 113, 99–108. [Google Scholar] [CrossRef]
- Gnedenkov, S.V.; Sinebryukhov, S.L. Electrochemical Impedance Spectroscopy of Oxide Layers on the Titanium Surface. Russ. J. Electrochem. 2005, 41, 858–865. [Google Scholar] [CrossRef]
- Cámara, O.R.; Avalle, L.B.; Oliva, F.Y. Protein adsorption on titanium dioxide: Effects on double layer and semiconductor space charge region studied by EIS. Electrochim. Acta 2010, 55, 4519–4528. [Google Scholar] [CrossRef]
- Jorcin, J.-B.; Orazem, M.E.; Pébère, N.; Tribollet, B. CPE analysis by local electrochemical impedance spectroscopy. Electrochim. Acta 2006, 51, 1473–1479. [Google Scholar] [CrossRef]
- Alqarni, N.D.; Wysocka, J.; El-Bagoury, N.; Ryl, J.; Amin, M.A.; Boukherroub, R. Effect of cobalt addition on the corrosion behavior of near equiatomic NiTi shape memory alloy in normal saline solution: Electrochemical and XPS studies. RSC Adv. 2018, 8, 19289–19300. [Google Scholar] [CrossRef]
- Hirschorn, B.; Orazem, M.E.; Tribollet, B.; Vivier, V.; Frateur, I.; Musiani, M. Determination of effective capacitance and film thickness from constant-phase-element parameters. Electrochim. Acta 2010, 55, 6218–6227. [Google Scholar] [CrossRef]
- Krakowiak, S.; Darowicki, K.; Slepski, P. Impedance investigation of passive 304 stainless steel in the pit pre-initiation state. Electrochim. Acta 2005, 50, 2699–2704. [Google Scholar] [CrossRef]
- Dong, Z.H.; Shi, W.; Guo, X.P. Initiation and repassivation of pitting corrosion of carbon steel in carbonated concrete pore solution. Corros. Sci. 2011, 53, 1322–1330. [Google Scholar] [CrossRef]
- Amin, M.A.; Hassan, H.H.; Abd El Rehim, S.S. On the role of NO2− ions in passivity breakdown of Zn in deaerated neutral sodium nitrite solutions and the effect of some inorganic inhibitors. Electrochim. Acta 2008, 53, 2600–2609. [Google Scholar] [CrossRef]
- Zakeri, M.; Naghizadeh, M.; Nakhaie, D.; Moayed, M.H. Pit Transition Potential and Repassivation Potential of Stainless Steel in Thiosulfate Solution. J. Electrochem. Soc. 2016, 163, C275–C281. [Google Scholar] [CrossRef]
- Amin, M.A.; Abd El-Rehim, S.S.; Aarão Reis, F.D.A.; Cole, I.S. Metastable and stable pitting events at zinc passive layer in alkaline solutions. Ionics 2014, 20, 127–136. [Google Scholar] [CrossRef]
- Amin, M.A.; El-Bagoury, N.; Mahmoud, M.H.H.; Hessien, M.M.; Abd El-Rehim, S.S.; Wysocka, J.; Ryl, J. Catalytic impact of alloyed Al on the corrosion behavior of Co50Ni23Ga26Al1.0 magnetic shape memory alloy and catalysis applications for efficient electrochemical H 2 generation. Rsc Adv. 2017, 7, 3635–3649. [Google Scholar] [CrossRef]
- Amin, M.A.; Fadlallah, S.A.; Alosaimi, G.S. Activation of Titanium for Synthesis of Supported and Unsupported Metallic Nanoparticles. J. Electrochem. Soc. 2014, 161, D672–D680. [Google Scholar] [CrossRef]
- Amin, M.A.; Abd El-Rehim, S.S.; El-Sherbini, E.E.F.; Mahmoud, S.R.; Abbas, M.N. Pitting corrosion studies on Al and Al–Zn alloys in SCN−solutions. Electrochim. Acta 2009, 54, 4288–4296. [Google Scholar] [CrossRef]
- Scully, J.R. Localized Corrosion of Sputtered Aluminum and Al-0.5% Cu Alloy Thin Films in Aqueous HF Solution. J. Electrochem. Soc. 1990, 137, 1365. [Google Scholar] [CrossRef]
- Pouilleau, J.; Devilliers, D.; Garrido, F.; Durand-Vidal, S.; Mahé, E. Structure and composition of passive titanium oxide films. Mater. Sci. Eng. B 1997, 47, 235–243. [Google Scholar] [CrossRef]
- Milošev, I.; Kosec, T.; Strehblow, H.-H. XPS and EIS study of the passive film formed on orthopaedic Ti–6Al–7Nb alloy in Hank’s physiological solution. Electrochim. Acta 2008, 53, 3547–3558. [Google Scholar] [CrossRef]
- Wysocka, J.; Cieslik, M.; Krakowiak, S.; Ryl, J. Carboxylic acids as efficient corrosion inhibitors of aluminium alloys in alkaline media. Electrochim. Acta 2018, 289, 175–192. [Google Scholar] [CrossRef]
- Amin, M.A.; Ahmed, E.M.; Mostafa, N.Y.; Alotibi, M.M.; Darabdhara, G.; Das, M.R.; Wysocka, J.; Ryl, J.; Abd El-Rehim, S.S. Aluminum Titania Nanoparticle Composites as Nonprecious Catalysts for Efficient Electrochemical Generation of H2. ACS Appl. Mater. Interfaces 2016, 8, 23655–23667. [Google Scholar] [CrossRef]
- Weibin, Z.; Weidong, W.; Xueming, W.; Xinlu, C.; Dawei, Y.; Changle, S.; Liping, P.; Yuying, W.; Li, B. The investigation of NbO2 and Nb2O5 electronic structure by XPS, UPS and first principles methods: The investigation of NbO2 and Nb2O5 electronic structure. Surf. Interface Anal. 2013, 45, 1206–1210. [Google Scholar] [CrossRef]
- Kharitonov, D.S.; Sommertune, J.; Örnek, C.; Ryl, J.; Kurilo, I.I.; Claesson, P.M.; Pan, J. Corrosion inhibition of aluminium alloy AA6063-T5 by vanadates: Local surface chemical events elucidated by confocal Raman micro-spectroscopy. Corros. Sci. 2019, 148, 237–250. [Google Scholar] [CrossRef]
- Kumar, S.; Kumar, S.; Tiwari, S.; Srivastava, S.; Srivastava, M.; Yadav, B.K.; Kumar, S.; Tran, T.T.; Dewan, A.K.; Mulchandani, A.; et al. Biofunctionalized Nanostructured Zirconia for Biomedical Application: A Smart Approach for Oral Cancer Detection. Adv. Sci. 2015, 2, 1500048. [Google Scholar] [CrossRef] [PubMed]
- Siuzdak, K.; Szkoda, M.; Karczewski, J.; Ryl, J.; Darowicki, K.; Grochowska, K. Fabrication and Significant Photoelectrochemical Activity of Titania Nanotubes Modified with Thin Indium Tin Oxide Film. Acta Metall. Sin. (Engl. Lett.) 2017, 30, 1210–1220. [Google Scholar] [CrossRef]
- Mandrino, D.; Godec, M.; Torkar, M.; Jenko, M. Study of oxide protective layers on stainless steel by AES, EDS and XPS. Surf. Interface Anal. 2008, 40, 285–289. [Google Scholar] [CrossRef]
- Wang, C.; Irfan, I.; Liu, X.; Gao, Y. Role of molybdenum oxide for organic electronics: Surface analytical studies. J. Vac. Sci. Technol. Bnanotechnol. Microelectron. Mater. Process. Meas. Phenom. 2014, 32, 040801. [Google Scholar] [CrossRef]
- Liu, J.; Alfantazi, A.; Asselin, E. Effects of Temperature and Sulfate on the Pitting Corrosion of Titanium in High-Temperature Chloride Solutions. J. Electrochem. Soc. 2015, 162, C189–C196. [Google Scholar] [CrossRef]
© 2019 by the authors. Licensee MDPI, Basel, Switzerland. This article is an open access article distributed under the terms and conditions of the Creative Commons Attribution (CC BY) license (http://creativecommons.org/licenses/by/4.0/).