Article

The Effect of Heavy Ion Irradiation on the Forward Dissolution Rate of Borosilicate Glasses Studied In Situ and Real Time by Fluid-Cell Raman Spectroscopy

1
Institut für Geowissenschaften und Meteorologie, Universität Bonn, Poppelsdorfer Schloss, Meckenheimer Allee 169, 53115 Bonn, Germany
2
SCHOTT AG, Hattenbergstr. 10, 55122 Mainz, Germany
3
GSI Helmholtzzentrum, 64291 Darmstadt and Technische Universität Darmstadt, 64287 Darmstadt, Germany
4
Department of Nuclear Engineering, University of Tennessee, Knoxville, TN 37996, USA
*
Author to whom correspondence should be addressed.
Materials 2019, 12(9), 1480; https://doi.org/10.3390/ma12091480
Submission received: 27 March 2019 / Revised: 29 April 2019 / Accepted: 1 May 2019 / Published: 7 May 2019
(This article belongs to the Special Issue Materials for Nuclear Waste Immobilization)

Abstract

:
Borosilicate glasses are the favored material for immobilization of high-level nuclear waste (HLW) from the reprocessing of spent fuel used in nuclear power plants. To assess the long-term stability of nuclear waste glasses, it is crucial to understand how self-irradiation affects the structural state of the glass and influences its dissolution behavior. In this study, we focus on the effect of heavy ion irradiation on the forward dissolution rate of a non-radioactive ternary borosilicate glass. To create extended radiation defects, the glass was subjected to heavy ion irradiation using 197Au ions that penetrated ~50 µm deep into the glass. The structural damage was characterized by Raman spectroscopy, revealing a significant depolymerization of the silicate and borate network in the irradiated glass and a reduction of the average boron coordination number. Real time, in situ fluid-cell Raman spectroscopic corrosion experiments were performed with the irradiated glass in a silica-undersaturated, 0.5 M NaHCO3 solution at temperatures between 80 and 85 °C (initial pH = 7.1). The time- and space-resolved in situ Raman data revealed a 3.7 ± 0.5 times increased forward dissolution rate for the irradiated glass compared to the non-irradiated glass, demonstrating a significant impact of irradiation-induced structural damage on the dissolution kinetics.

1. Introduction

Borosilicate glass is the favored material for the geological disposal of high-level nuclear waste (HLW) from the reprocessing of spent fuel used in nuclear power plants [1,2,3]. Vitrification of HLW is currently the treatment of choice for immobilization of radionuclides for the following reasons: (a) high capability of glass to reliably incorporate a wide spectrum of isotopes with different ionic charges and sizes, (b) simple and economic production technology adapted from glass manufactures, (c) small volume of the resulting waste form, (d) high chemical durability of waste form glasses in contact with natural waters, and (e) high tolerance of these glasses to self-irradiation damage. Vitrification is also attracting great interest for other types of wastes, such as operational radioactive wastes from nuclear power plants as well as radioactive and toxic legacy waste from medicine [4]. In a deep geological disposal, the vitrified nuclear waste can come into contact with infiltrating ground waters once the protective metallic containers are broken or corroded. Numerous laboratory experiments were conducted to identify the key mechanisms that lead to glass breakdown in aqueous solutions and to determine the reaction kinetics [1,2,5,6,7,8,9,10,11,12]. There is still an intensive debate on the reaction and transport mechanisms controlling glass alteration and the formation of silica-based surface alteration layers (SALs) over geological time scales, reflected by the formulation of several different mechanisms, including the fundamentally different and highly debated leaching and interface-coupled dissolution-precipitation (ICDP) models [5,6,7,8,9,10,11,12,13]. While the leaching model is based on the fact that the SAL forms by diffusion-controlled chemical leaching of the glass, the ICDP model is based on the notion that the glass initially dissolves congruently until a surface solution boundary layer is supersaturated with amorphous silica, which eventually precipitates at the surface of the glass. Both, glass dissolution and silica precipitation are coupled in space and time, resulting in the formation of an inwardly migrating dissolution-precipitation front. In a recent study, however, Lenting et al. [14] presented a unifying model based on an ICPD mechanism as the SAL forming process, but also includes an interdiffusion zone that develops ahead of the ICDP front inside the glass once the ICDP reaction slowed down due to chemical transport limitations.
Regardless of the mechanistic details, several kinetic stages have been identified during nuclear glass corrosion as schematically shown in Figure 1 [2,15,16]. During the first kinetic stage, the corrosion rate r0, defined as the amount of glass lost per unit time, is assumed to be constant until it linearly drops to a residual rate rr [3,16,17]. However, Ojovan et al. [4] proposed an exponential decrease of the elemental release rate already from the beginning of reaction. A late-stage resumption of the corrosion rate can occur under yet unclear circumstances, which are in focus of current research [18,19,20].
Using a unique experimental setup that allows the in situ observation of the corrosion process by fluid-cell confocal Raman spectroscopy, Geisler et al. [21] found a linear decrease of the dissolution rate with time already from the beginning of the reaction (Figure 1). The in situ experiments with a ternary Na borosilicate glass revealed an initially continuously retreating glass-water interface without any evidence for the formation of an SAL, suggesting that the glass initially dissolved congruently and that affinity effects control the initial rate decrease until a several micrometer-thick SAL had formed and the rate dramatically dropped to zero. The initial dissolution rate r0 was determined from the intercept of a linear fit with the rate axis and interpreted to be the forward dissolution rate of the investigated borosilicate glass far away from equilibrium under the given physicochemical conditions (Figure 1).
To reliably assess the chemical durability of nuclear waste glasses over geological time scales, it is critical to understand the impact of self-irradiation damage on the glass properties and particularly its effect on the aqueous dissolution kinetics. Self-irradiation damage from alpha-decay falls into two categories: (i) the transfer of the energy from the damaging energetic alpha particle to the electrons of the glass (ionization and electronic excitations); and (ii) the transfer of energy to the atomic nuclei, primarily by ballistic processes involving elastic collisions. The more massive, but low energy (70–100 keV) α-recoil particles account for most of the total number of displacements produced by ballistic processes in HLW glasses. The α-recoils lose nearly their entire energy in elastic collisions over a very short range, producing highly localized damage (displacement cascades) [22,23,24,25]. For the simulation of the absorbed dose from both types of electronic or nuclear collisions, the irradiation of non-radioactive glass with heavy or light ions is a scientifically valuable method [13]. In particular, ion accelerator experiments allow an assessment of the effect of a single process on the material structure that is produced during the radioactive decay under well-controlled conditions. The ability to isolate defect mechanisms is crucial to the study of complex irradiation-damage problems, where both competing and synergistic contributions from the irradiation environment of temperature and stress exist [26].
In this study, Au ions of ~1 GeV energy were chosen to evaluate the effect of purely electronic collisions on the glass network and ultimately on the initial forward dissolution rate r0. The use of swift heavy ions has the advantage that a relatively thick layer of irradiated material can be produced (Figure 2). For this, we performed two in situ and real time, fluid-cell Raman spectroscopic corrosion experiments with an ion-irradiated Na borosilicate glass in a 0.5 mol NaHCO3 solution, following the method described in detail in Geisler et al. [21]. These authors already carried out corrosion experiments with non-irradiated glass samples of the same composition and under very similar physicochemical conditions, which serve as reference. In addition, we repeated one experiment with a non-irradiated sample to test the reproducibility of the method.

2. Materials and Methods

2.1. Glass Synthesis

The irradiation experiment was carried out with a polished, homogenous, ternary Na borosilicate glass (TBG) coupon (13 × 5 × 3 mm3) that was prepared from a second production batch of the glass used by Geisler et al. [18]. The nominal composition of the glass was 57.9 wt.% SiO2, 19.7 wt.% Na2O, and 22.3 wt.% B2O3 [21]. It was synthesized from SiO2, B2O3, and Na2CO3 precursors in a platinum crucible at 1400 °C. The glass was molten a second time after crushing and milling it in a ball mill to ensure chemical homogeneity. After quenching the melt in a pre-heated stainless steel mold, it was tempered at 560 °C for 6 h and then letting it cool down over night by switching off the oven.

2.2. Heavy Ion Bombardment

One side of the polished sample was irradiated at room temperature and at normal incidence with 197Au ions at the beamline M3 of the UNILAC at the GSI Helmholtz Center for Heavy Ion Research in Darmstadt, Germany. The generated 197Au ions had an energy of 4.8 MeV/u (with u being the mass unit) and an effective energy of 4.5 MeV/u at the sample surface, i.e., a kinetic energy of 945.6 MeV. The samples were irradiated to a fluence of 5 × 10¹² ions/cm2 with an uncertainty in the order of 10–20%. The penetration depth of the 197Au ions in the Na borosilicate glass (2.51 g/cm3) was 48 ± 5 µm as calculated with the SRIM 2013.00 code [27] (Figure 2). For the two corrosion experiments, the irradiated glass coupon was cut in two smaller coupons with a size of about 6 × 5 × 3 mm3 and 7 × 5 × 3 mm³, respectively.

2.3. Raman Spectroscopy

All Raman measurements were conducted with a high resolution Horiba Scientific HR800 confocal Raman system at the Institute for Geosciences and Meteorology of the University in Bonn, Germany. A 2 W solid state Nd:YAG laser (532.09 nm) with about 600 mW power at the sample surface was used. The scattered light was detected with an electron multiplier charge-coupled device detector after having passed a 1000 µm confocal aperture and a 100 µm spectrometer entrance slit, and being dispersed by a grating of 600 grooves/mm. A 100× long working distance (LWD) microscope objective with a numerical aperture of 0.8 was used for all measurements, yielding an empirically determined lateral resolution of about 6 µm at the depth of the in situ Raman measurements [21]. The Raman signal was measured in the wavenumber ranges from 200 to 1800 and from 2800 to 4000 cm−1. The first frequency range includes a Ne line at 1706.06 cm−1 that was recorded as an internal wavenumber standard to correct each spectrum for any spectrometer shift during long term measurements of up to 75 h (resulting from ±0.5 °C temperature variations in the laboratory) by placing a Ne lamp in the beam path of the scattered light.
To determine the relative fractions of different structural glass units in the non-irradiated and irradiated glass from Raman intensities, the measured Raman intensities I(ν) were corrected for (1) the wavelength-dependent instrumental sensitivity (white light correction); (2) the thermal population of the excited states by the Bose–Einstein temperature factor B = [1 − exp(−hνc/kT)] with h, k, c, and T being the Planck and Boltzmann constant, the speed of light, and the absolute temperature, respectively; (3) the scattering factor qs = (νe – ν)–3 with νe and ν being the excitation wavenumber and Raman shift, respectively; (4) the frequency factor ν; and, finally, (5) for background signals (stray light, fluorescence) that were fitted with a third order polynomial function. The corrected spectrum, the so-called reduced or R(ν) spectrum, is directly proportional to the relative scattering activity in terms of mass-weighted normal coordinates and thus most closely matches the vibrational density of states.

2.4. Experimental Set-Up and Determination of Glass Retreat/Dissolution Rate

Three in situ experiments were performed with two irradiated and one non-irradiated reference glass coupon under similar physiochemical conditions using a home-made fluid-cell (Figure 3a) [21]. Before each experiment, the fluid-cell was disassembled, cleaned with 35% HCl solution and rinsed with MilliQ© water. The glass coupon was placed in a sample holder that is integrated in the sealing cap. In the closed fluid-cell the accurate positioning of the glass coupon, perpendicular to the fused silica window, is of great importance for the reliable determination of the glass retreat, i.e., the glass dissolution rate. Furthermore, the distance between the window and the glass sample surface was kept as small as possible in order to minimize corrosive processes in this region and to obtain the best possible spatial resolution. In the first experimental set up the distance between the fused silica window and the sample surface was ~60 µm. In the second experiment the distance was ~20 µm. The fluid-cell was then filled with 13.0 ± 0.2 mL of 0.5 M NaHCO3 solution (initial pH of 7.1 at 85 °C; [21]) and heated to nominal temperature of 90 °C. Due to a slight temperature gradient in the cell, the actual temperature at the position of the Raman measurements was between about 80 and 85 °C (Table 1), which was accurately determined from the temperature-related frequency shifts of the ν5(HCO3) band as described in detail in [21].
Point-by-point parallel Raman line scans were performed every ~2 h about 100 µm below the surface of the glass monolith with a 2-µm step size by automatically moving the stage in y–x direction (Figure 3a). The total counting time for each point was about 25 s, involving the two spectral windows that were each measured for 2 × 6 s. For the determination of the glass retreat as a function of time, the integrated total intensity of the Qn species between 1000 and 1250 cm−1 was determined from white light- and background-corrected I(ν) spectra. The resulting intensity profiles across the glass-water interface were than fitted with an exponential function from which the glass retreat was determined with an error better than about ± 1 µm. For a more detailed description of the determination of the glass retreat we refer to Geisler et al. [21].

3. Results

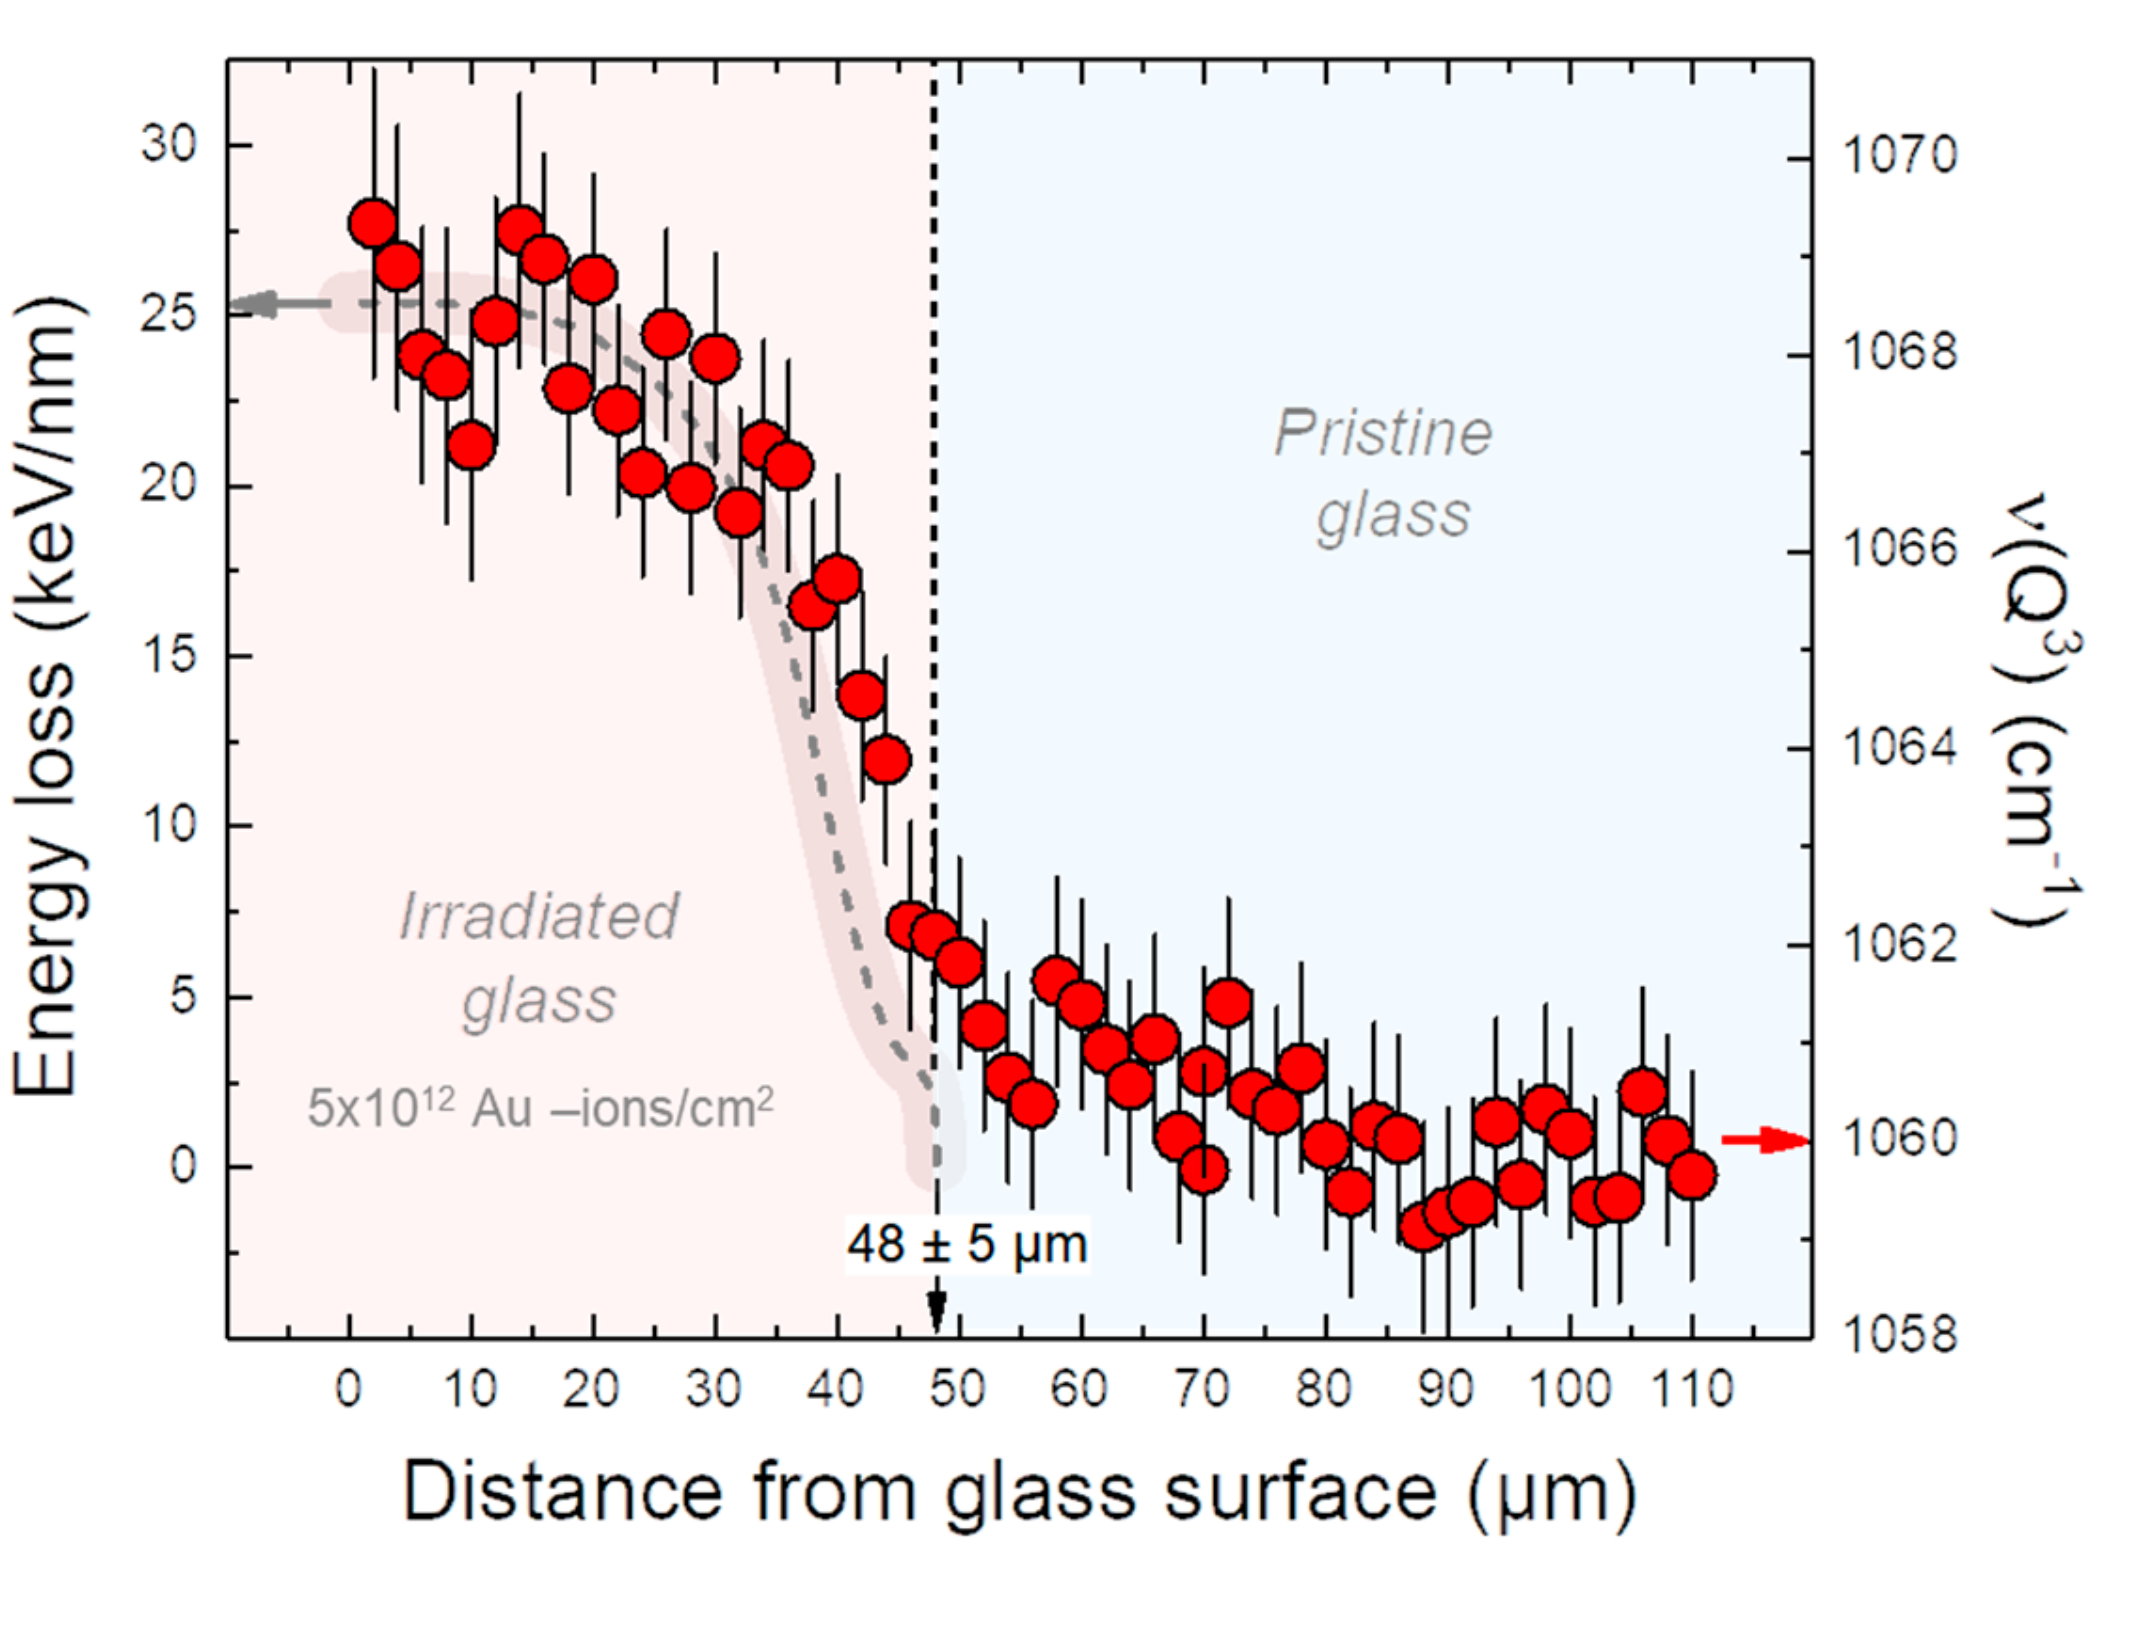
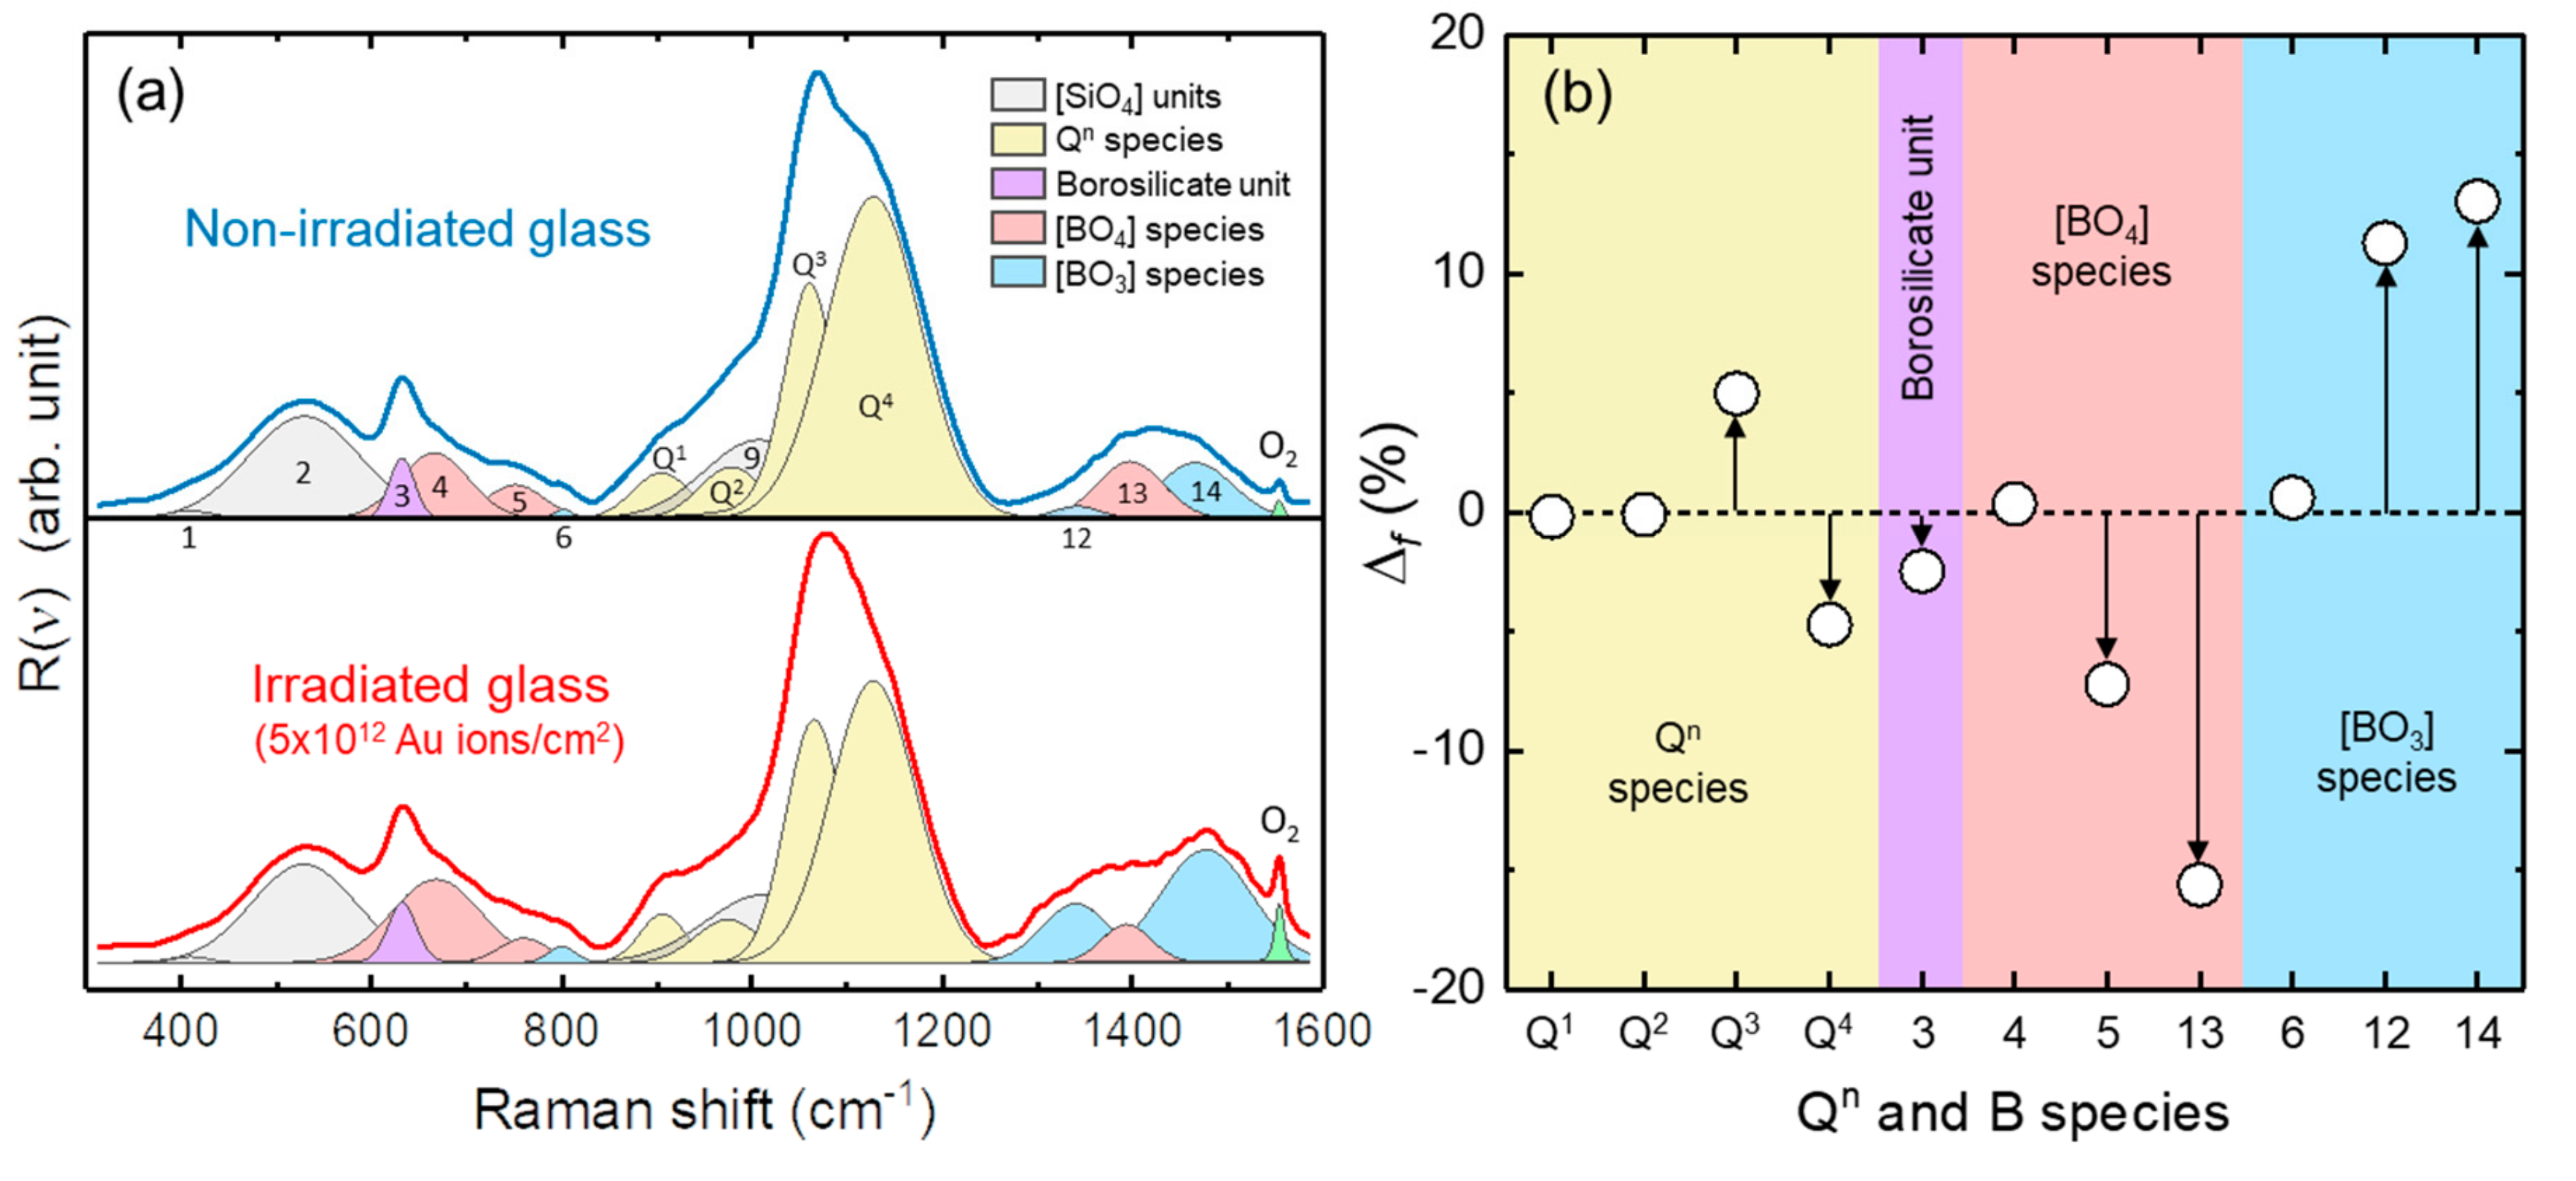
3.1. Structural State of the Irradiated Glass Samples

The Au irradiation of the pristine glass with a kinetic energy of ~950 MeV (at the surface) and a fluence of 5 × 10¹² Au ions/cm2 did not result in any macroscopically visible changes of the sample. However, an effect of heavy ion irradiation on the structure of the ternary Na borosilicate glass (TBG) was detected by Raman spectroscopy. Figure 4a shows a representative, average R(ν) Raman spectrum from both the irradiated and non-irradiated TBG, which were extracted from the first Raman point-by-point line scan from the irradiated glass surface into the non-irradiated glass that was measured at the beginning of each experiment (Figure 3b). To quantify spectral changes after irradiation, which are already evident by visible inspection of the Raman spectra, we fitted the background-corrected R(ν) spectra shown in Figure 4a with 15 Gauss-Lorentz functions in the wavenumber range between 300 and 1600 cm−1. It is noted that the least-squares fitting procedure of silicate glass vibrational bands is still highly debated [28]. For instance, some researchers favor the use of Gauss functions to fit Raman bands of silicate glasses (e.g., [29,30]), whereas others use a convolution of a Gauss and Lorentz function (e.g., [28,31]), which takes into account phonon dumping on the density of states which is particularly relevant in disordered materials where phonon life times are short [28]. Furthermore, the broad vibrational bands from silicate glasses make it often difficult to decide how many vibrational modes contribute to a broad band profile. In this study, we applied the deconvolution procedure proposed by Manara et al. [31], who used 14 Gauss-Lorentz functions to fit the Raman spectra of a series of ternary Na borosilicate glasses in the wavenumber range between 300 and 1600 cm−1. The 15th band observed in this study was located near 1555 cm−1 and reflects the stretching mode of molecular oxygen. The assignment of the 14 vibrational modes of typical structural units in Na borosilicate glasses, which is given in Figure 4a, was also adapted from Manara et al. [31], but their assignment also bases on earlier work (e.g., [32,33,34]).
The band near 495 cm−1 in the spectrum of the non-irradiated glass—also called R band (band 2 in Figure 4a)—was assigned to bending and rocking modes of Si–O–Si bonds. A wavenumber upshift by 10 cm−1 was observed for this band in the spectra from the irradiated part of the sample, which is in perfect agreement with findings of Mir et al. [35] on borosilicate glass irradiated with 129Xe ions, and indicates a decreased mean Si-O-Si angle due to irradiation (Figure 4a). Vibrational stretching motions of the silicate network are represented by bands near 905, 978, 1061, and 1128 cm−1 in the non-irradiated TBG, which have been assigned to Q1, Q2, Q3, and Q4 species in the silicate network, respectively (the superscript refers to the number of bridging oxygen atoms). Another Raman band contributes to the overall profile in this wavenumber region, namely a band near 1008 cm−1 (band 9 in Figure 4a) that was considered to represent Si–O0 bridging oxygen stretching motions [34] or alternatively vibrations of structural units associated with Na+ ([32,33]). In general, the structural units with a high degree of polymerization contribute to the high-frequency side of the Qn region, whereas the units with a low degree of polymerization contribute to the low frequency side [35]. Here, we observed a 5.0 ± 0.5% increase of the Q3 fraction in the irradiated part of the TBG (Figure 4b), and a simultaneous −4.7 ± 0.5% decrease of the Q4 fraction, clearly indicating a depolymerization of the SiO4 glass network. On the other hand, the Q1 and Q2 fractions did not significantly change. The Q3 band showed the largest frequency shift (~8 cm−1; Figure 2) among the Qn bands in response to Au ion irradiation. The variation of the frequency of the Q3 band as a function of depth perfectly mimics the energy loss curve for Au ions in the TBG calculated by the SRIM code (Figure 2).
We consider the Raman bands assigned to the different borate species in borosilicate glasses. The pronounced band near 632 cm−1 (band 3 in Figure 4a) has been associated with bending motions of danburite-like borosilicate ring units [31]. The intensity fraction of this band on the total intensity of all Raman bands assigned to boron species (Figure 4a) was 2.5 ± 0.4% lower in the spectra from the irradiated surface layer (Figure 4b). However, the intensity fraction of the bands near 1342 and 1466 cm−1 (bands 12 and 14 in Figure 4a, respectively), that were assigned to the BO3 units in boroxol rings, was significantly higher in the spectra from the irradiated surface layer (Figure 4b). This change was complemented by significantly lower intensity fractions of BO4-related bands (Figure 4b), i.e., bands 4, 5, and 14 (Figure 4a). A detailed inspection of the spectra furthermore revealed that the broad band profile between 1250 and 1650 cm−1 in the spectra from the irradiated surface layer were characterized by a number of new inflection points. This suggests that apart from an average reduction of the boron coordination number, the B–O bond length ordering has also changed due to irradiation. These changes are clear evidence for significant structural alterations of the borate sub-network as a result of heavy ion irradiation. In this respect, we also noted a significantly higher intensity of the O2 band in the spectrum from the irradiated compared to the non-irradiated part of the samples (Figure 4a). Whereas the O2 band in the spectra from the non-irradiated glass areas solely stems from air located between the glass surface and the objective, the higher intensity of the O2 band in the spectra from the irradiated part of the TBG indicates the occurrence of additional molecular oxygen within the irradiated glass structure. This is consistent with Raman spectroscopic results of Mir et al. [32], who also observed the O2 band after irradiation of a ternary Na borosilicate glass with 129Xe ions.

3.2. Glass Retreat and forward Dissolution Rate

Two in situ fluid-cell Raman spectroscopic corrosion experiments were conducted with the irradiated TBG samples for ~45 and ~75 h (Figure 5a,b). Another short-term experiment was performed with a non-irradiated TBG coupon for 7 hours to test the reproducibility of the method by comparing results with those from Geisler et al. [21]. The results are summarized in Table 1. Both experiments with irradiated samples started with a remarkably higher initial forward dissolution rate than experiments with the non-irradiated glass (Figure 5), clearly demonstrating a significant effect of radiation damage and associated structural modifications on the glass dissolution kinetics. In agreement with results from Geisler et al. [21], an approximately linear decrease of the glass retreat rate is observed from the beginning of both experiments until about 12 to 15 h, when a sharp rate drop occurred. Two rate-time regimes can thus be distinguished that were each individually fitted with a linear function (red and blue lines in Figure 5). Since the drop of the glass retreat rates occurred just about when the dissolution of the glass reached the maximum penetration depth of the Au ions (Figure 5 insets), the drop can reliably be linked to the time when the irradiated surface layer is dissolved completely so that the non-irradiated glass is exposed to the solution. In this respect, it is also noteworthy that first silica signals were observed only in the second, longer experiment after about 60 h, which is fully in line with findings of Geisler et al. [21]. Thus, extrapolation of the linear fits to the initial rate data of both experiments (red lines in Figure 5) to t = 0 delivered the initial forward dissolution rate of the irradiated glass, i.e., r0irr = 5.1 ± 0.4 and 5.5 ± 0.6 µm/h, respectively (Figure 5; Table 1). The relative large uncertainty of the dissolution rates at the beginning reflects the fast dissolution kinetics with respect to the scanning time and thickness of the irradiated surface layer. The intercept of the best fit line of both kinetic regimes should correspond to the initial dissolution rate of the non-irradiated TBG. It also gives the time when the rate drop occurred, i.e., after 15 ± 3 and 12 ± 2 h, respectively (Figure 5). Indeed, we obtain r0 values of 1.8 ± 0.2 and 1.5 ± 0.1 µm/h that are comparable with the forward dissolution rates obtained from the non-irradiated TBG (Table 1). Figure 6 shows a compilation of all data in an Arrhenius diagram to consider the slightly different temperatures of the experiments (Table 1).
The significantly higher forward dissolution rate of the irradiated glass compared to the non-irradiated counterpart is immediately apparent, but the rate data from the non-irradiated TBG themselves are highly scattered. This excess scatter may reflect (i) the slightly different chemistry of the glass coupons used in this study compared with those used by Geisler et al. [21], and/or (ii) the observation that the dissolution rate may locally vary as reflected by etch pits often observed in glass dissolution studies [12]. An unweighted linear least squares fit to the data yielded a slope that corresponds to an activation energy of 71 ± 66 kJ/mol, whereas the slope of an error-weighted linear fit yielded an activation energy of 116 ± 83 kJ/mol (Figure 6). Both values are statistically not significantly different from zero, but are nevertheless in the typical range of activation energies for hydrolysis reactions at borosilicate glass surfaces that were calculated from first principles density functional theory (DFT) simulations and measured in neutral solutions ([36], and references therein). However, it is not expected that the dissolution rates obtained for the non-irradiated glass from the experiment with the surface-irradiated TBG perfectly fit to those obtained with non-irradiated glass coupons, since at the time when the irradiated surface layer is completely dissolved, the solution chemistry is different from the initial chemistry. At that time the solution was no longer free of silica (but still undersaturated with respect to amorphous silica) and the pH near the surface changed, so the chemical affinity or driving force for the dissolution reactions also changed [34]. In any case, to obtain a reliable activation energy for the dissolution of this TBG under close to neutral conditions, more experiments under a wider temperature range are necessary. The unweighted fit yielded a ratio between r0irr and r0 of 3.7 ± 0.5 (Figure 6). Thus, an almost four-fold increase of the forward dissolution rate was observed for the irradiated TBG.

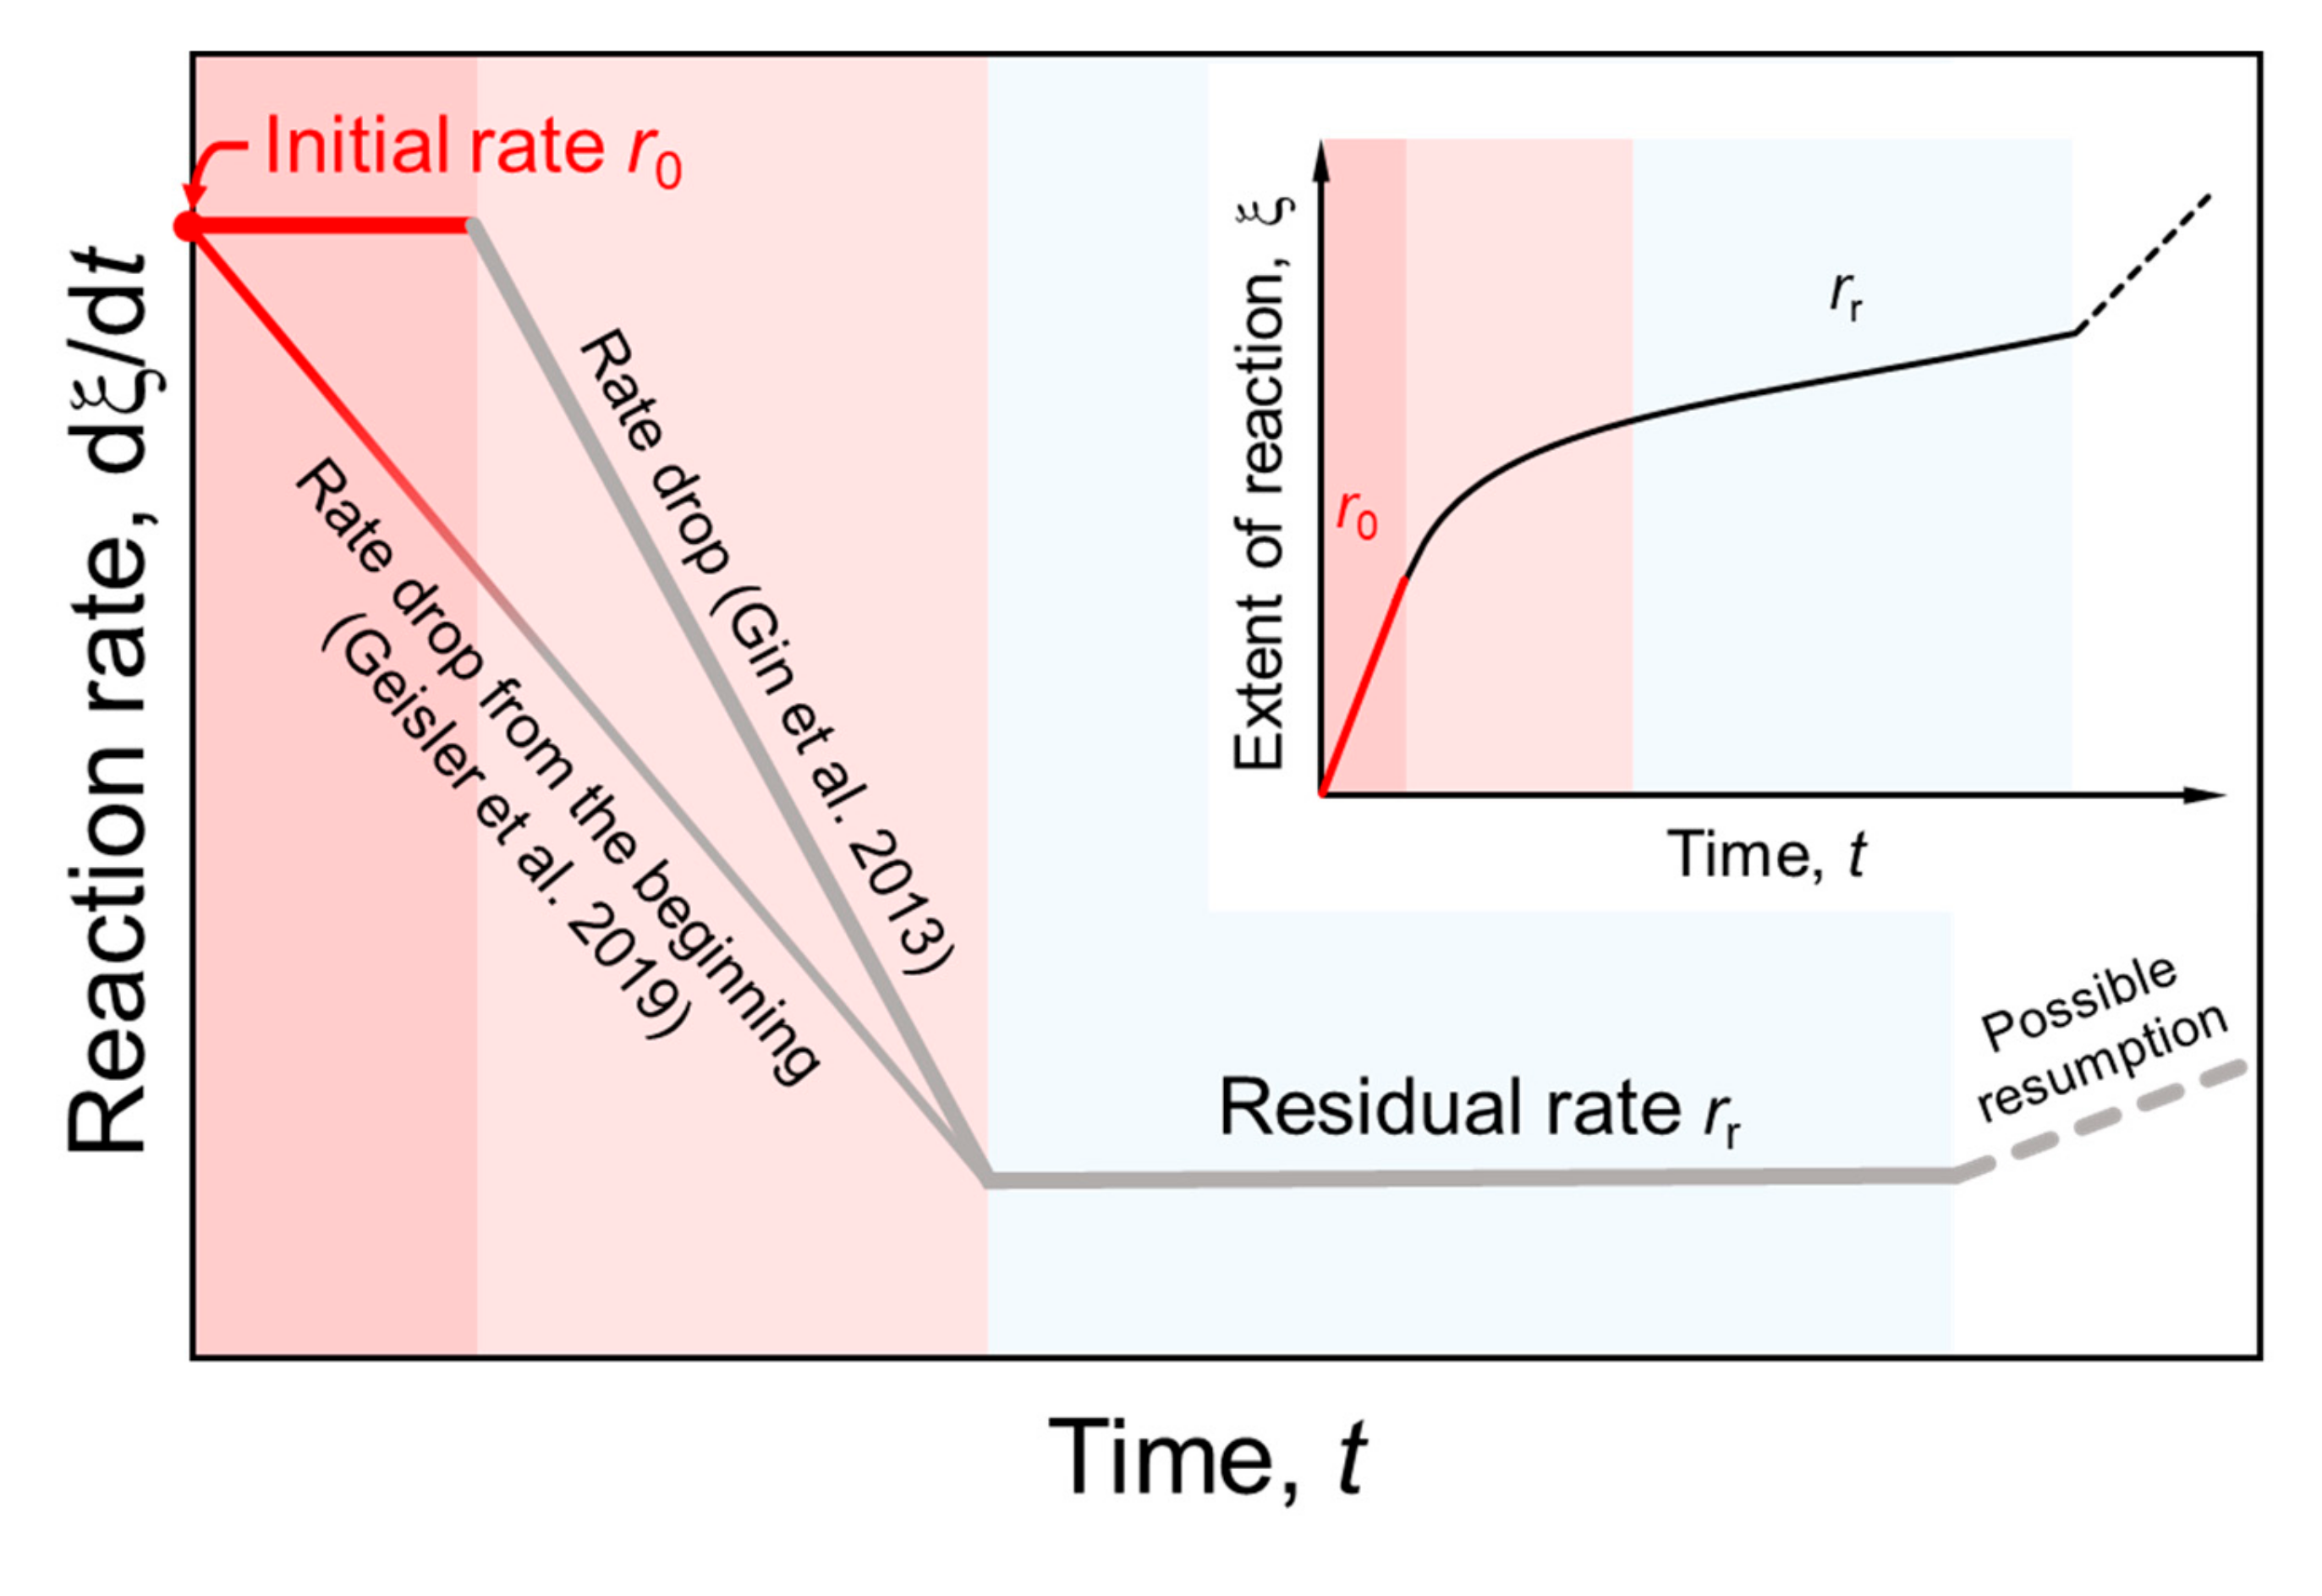
4. Discussion and Conclusions

In this study, the irradiated glass structure was found to dissolve 3.7 ± 0.5 times faster than the corresponding non-irradiated glass, verifying previous studies that also reported an increased dissolution kinetics of radiation-damaged silicate glasses [37,38,39]. In contrast, other studies claim that neither the alpha activity nor the alpha decay dose has a significant impact on the initial dissolution rate [40,41]. The reasons for such a disagreement are not evident and should be subject of future investigations, particularly given the importance of this knowledge to assess the chemical durability of nuclear glasses in a natural nuclear repository. Raman spectroscopic measurements of the Au-irradiated TBG have revealed (1) a significant modification of the short-range order around the main network formers, (2) a decrease of the average boron coordination number, (3) an accumulation of molecular oxygen, and (4) an increase of the Q3 fraction at the expense of the Q4 species, indicating depolymerization of the silicate network due to radiation damage. Such structural and chemical modifications are in line with findings of Mir et al. [35] and known to be accompanied by changes in the physical properties, including hardness and Young’s modulus, density, and fracture toughness [23,37,42,43,44,45,46,47]. Our study reveals that such structural modifications due to irradiation have a profound effect on the glass dissolution property.
The increased dissolution kinetics can principally be explained by the less interlinked, irradiated glass network that offers a larger free volume for the hydrolysis of Si–O and B–O bonds in the glass by hydrogen species from solution. During heavy ion bombardment, several micrometer-long cylindrical damage trails, so-called ion tracks [48], are created, which have been made visible by transmission electron microscopy [24] and atomic force microscopy [49]. In particular, the Si–O and B–O bonds inside the ion tracks are likely high energy sites that can preferentially be hydrolyzed. In our samples, these ion tracks must be parallel oriented and elongated in the direction of the dissolution front movement due to the direction of bombardment. Considering the long-range ballistic character of heavy ions in the material, it would be interesting to test whether the dissolution kinetics depends on track orientation? This question directly relates to the general debate about the scientific value of external heavy ion irradiation experiments for the simulation of α-recoil damage [37]. Charpentier et al. [50], for example, observed a higher damage level in silicate glasses irradiated with Au ions than in short-lived actinide-doped glasses that accumulated an equivalent dose of recoil events. A possible explanation for this observation could be partial self-healing processes which arise from alpha particles involved in alpha decay events [49]. External irradiation with energetic heavy ions may also induce the removal of alkali ions even from depths that correspond to the ion penetration depth [51]. At high fluences, the entire near surface region may be depleted of alkali ions to depths even exceeding the ion range [51]. However, for our samples electron microprobe measurements across the irradiated surface layer did not reveal any Na loss from areas deeper than ~1 µm (lateral resolution of the measurements) below the surface. Moreover, a very critical point is that in real case scenarios, radiolysis reactions in the surface boundary solution may significantly affect the glass dissolution kinetics as also observed to affect the dissolution of UO2, respectively spent fuel [39,52,53].
All these observations challenge the assignability of results from heavy ion irradiated samples to the real world of self-irradiation in nuclear glasses. However, the irradiation with swift heavy ions requires less experimental effort and represents an effective approach to simulate radiation damage over micrometer length scale and thus allows studying the effects of radiation damage on the long-term durability of borosilicate glasses. On the other hand, experiments with borosilicate glasses doped with short- and long-lived actinide and/or fission products appear to be most important for the assessment of the long-term durability of a nuclear glass in a natural repository and, not to forget, to compare the results with those obtained from externally irradiated samples. Here, fluid-cell Raman spectroscopy can potentially open up new possibilities to study the corrosion of nuclear glass in situ without disturbing or interrupting the reaction. As shown by Geisler et al. [21], and partly in this work, fluid-cell Raman spectroscopy thereby provides a wealth of chemical and structural information with a spatial resolution at the micrometer-scale. Moreover, light stable isotopes, such as 2H and 18O, can be used to in situ trace distinct reaction and transport processes, as demonstrated by Geisler et al. [21], who quantified the transport of molecular water through a silica-based surface alteration layer by using a 2H-labelled solution. A single experiment thus delivers the information of numerous quench experiments with different samples so that complicated sample syntheses and preparation that require a radiation-protected environment, as well as costs and new nuclear waste, are minimized. Such experiments can potentially also be performed over longer durations to be able to also investigate the corrosion process of nuclear waste glasses as they are kinetically more stable against aqueous corrosion than the glass used in the present study.

Author Contributions

T.G. initiated and planned the study, and obtained funding; M.I.L., L.D., and C.L. carried out the experiments; M.I.L., L.D., C.L., and T.G. refined and analyzed the Raman spectroscopic data; M.L. performed the SRIM calculations; C.T. carried out the irradiation experiments at the Helmholtz Centre in Darmstadt; M.I.L. and T.G. wrote the first draft of the manuscript, but all authors contributed to the final version.

Funding

This research has financially been supported by Schott AG Mainz, Germany, and the German Research Foundation (grant no. GE1094/21-1).

Acknowledgments

We thank G. Paulus (Schott AG) for synthesizing and characterizing the borosilicate glass, and D. Lülsdorf and H. Blanchard (University of Bonn) as well as W. Bauer (Schott AG) for helping with the design and construction of the fluid cell. The results presented here are based on a UMAT experiment performed at the M-branch of the UNILAC at the GSI Helmholtzzentrum für Schwerionenforschung, Darmstadt (Germany) in the frame of FAIR Phase-0. We acknowledge support by M. Bender and D. Severin during the ion irradiation. Part of this research is being performed using funding received from the DOE Office of Nuclear Energy’s Nuclear Energy University Program under US-DOE, contract DE-NE0008694.

Conflicts of Interest

The authors declare no conflict of interest.

References

  1. Grambow, B. Nuclear waste glasses—How durable? Elements 2006, 2, 357–364. [Google Scholar] [CrossRef]
  2. Gin, S.; Abdelouas, A.; Criscenti, L.J.; Ebert, W.L.; Ferrand, K.; Geisler, T.; Harrison, M.T.; Inagaki, Y.; Mitsui, S.; Mueller, K.T.; et al. An international initiative on long-term behavior of high-level nuclear waste glass. Mater. Today 2013, 16, 243–248. [Google Scholar] [CrossRef]
  3. Icenhower, J.P.; Steefel, C.I. Experimentally determined dissolution kinetics of SON68 glass at 90 °C over a silica saturation interval: Evidence against a linear rate law. J. Nucl. Mater. 2013, 439, 137–147. [Google Scholar] [CrossRef]
  4. Ojovan, M.I.; Lee, W.E. Glassy wasteforms for nuclear waste immobilization. Metall. Mater. Trans. A 2011, 42, 837–851. [Google Scholar] [CrossRef]
  5. Grambow, B. A General rate equation for nuclear waste glass corrosion. MRS Proc. 1984, 44, 15–27. [Google Scholar] [CrossRef]
  6. Hellmann, R.; Cotte, S.; Cadel, E.; Malladi, S.; Karlsson, L.S.; Lozano-Perez, S.; Cabié, M.; Seyeux, A. Nanometre-scale evidence for interfacial dissolution–reprecipitation control of silicate glass corrosion. Nat. Mater. 2015, 14, 307–311. [Google Scholar] [CrossRef]
  7. Grambow, B.; Müller, R. First-order dissolution rate law and the role of surface layers in glass performance assessment. J. Nucl. Mater. 2001, 298, 112–124. [Google Scholar] [CrossRef]
  8. Lanford, W.A.; Davis, K.; Lamarche, P.; Laursen, T.; Groleau, R.; Doremus, R.H. Hydration of soda-lime glass. J. Non Cryst. Solids 1979, 33, 249–266. [Google Scholar] [CrossRef]
  9. Geisler, T.; Janssen, A.; Scheiter, D.; Stephan, T.; Berndt, J.; Putnis, A. Aqueous corrosion of borosilicate glass under acidic conditions: A new corrosion mechanism. J. Non Cryst. Solids 2010, 356, 1458–1465. [Google Scholar] [CrossRef]
  10. Doremus, R.H. Interdiffusion of hydrogen and alkali ions in a glass surface. J. Non Cryst. Solids 1975, 19, 137–144. [Google Scholar] [CrossRef]
  11. Abraitis, P.K.; Livens, F.R.; Monteith, J.E.; Small, J.S.; Trivedi, D.P.; Vaughan, D.J.; Wogelius, R.A. The kinetics and mechanisms of simulated british magnox waste glass dissolution as a function of pH, silicic acid activity and time in low temperature aqueous systems. Appl. Geochem. 2000, 15, 1399–1416. [Google Scholar] [CrossRef]
  12. Geisler, T.; Nagel, T.; Kilburn, M.R.; Janssen, A.; Icenhower, J.P.; Fonseca, R.O.; Grange, M.; Nemchin, A.A. The mechanism of borosilicate glass corrosion revisited. Geochim. Cosmochim. Acta 2015, 158, 112–129. [Google Scholar] [CrossRef]
  13. Gin, S.; Patrick, J.; Magaly, T.; Sylvain, P.; Schuller, S. Radionuclides containment in nuclear glasses: An overview. Radiochim. Acta 2017, 105, 927–959. [Google Scholar] [CrossRef]
  14. Lenting, C.; Plümper, O.; Kilburn, M.; Guagliardo, P.; Klinkenberg, M.; Geisler, T. Towards a unifying mechanistic model for silicate glass corrosion. Npj. Mater. Degrad. 2018, 2, 28. [Google Scholar] [CrossRef]
  15. Poinssot, C.; Gin, S. Long-term behavior science: The cornerstone approach for reliably assessing the long-term performance of nuclear waste. J. Nucl. Mater. 2012, 420, 182–192. [Google Scholar] [CrossRef]
  16. Vernaz, E.; Gin, S.; Jégou, C.; Ribet, I. Present understanding of R7t7 glass alteration kinetics and their impact on long-term behavior modeling. J. Nucl. Mater. 2001, 298, 27–36. [Google Scholar] [CrossRef]
  17. Frugier, P.; Gin, S.; Minet, Y.; Chave, T.; Bonin, B.; Godon, N.; Lartigue, J.-E.; Jollivet, P.; Ayral, A.; De Windt, L.; et al. SON68 Nuclear glass dissolution kinetics: Current state of knowledge and basis of the new GRAAL model. J. Nucl. Mater. 2008, 380, 8–21. [Google Scholar] [CrossRef]
  18. Fournier, M.; Gin, S.; Frugier, P. Resumption of nuclear glass alteration: State of the art. J. Nucl. Mater. 2014, 448, 348–363. [Google Scholar] [CrossRef]
  19. Ribet, S.; Gin, S. Role of neoformed phases on the mechanisms controlling the resumption of SON68 glass alteration in alkaline media. J. Nucl. Mater. 2004, 324, 152–164. [Google Scholar] [CrossRef]
  20. Frugier, P.; Fournier, M.; Gin, S. Modeling resumption of glass alteration due to zeolites precipitation. Procedia Earth Planet. Sci. 2017, 17, 340–343. [Google Scholar] [CrossRef]
  21. Geisler, T.; Dohmen, L.; Lenting, C.; Fritzsche, M.B.K. Real-time in situ observations of reaction and transport phenomena during silicate glass corrosion by fluid-cell Raman spectroscopy. Nat. Mater. 2019, 18, 342–348. [Google Scholar] [CrossRef]
  22. Advocat, T.; Jollivet, P.; Crovisier, J.L.; Del Nero, M. Long-term alteration mechanisms in water for SON68 radioactive borosilicate glass. J. Nucl. Mater. 2001, 298, 55–62. [Google Scholar] [CrossRef]
  23. Weber, W.J.; Ewing, R.C.; Angell, C.A.; Arnold, G.W.; Cormack, A.N.; Delaye, J.M.; Griscom, D.L.; Hobbs, L.W.; Navrotsky, A.; Price, D.L.; et al. Radiation effects in glasses used for immobilization of high-level waste and plutonium disposition. J. Mater. Res. 1997, 12, 1948–1978. [Google Scholar] [CrossRef]
  24. Hobbs, L.W.; Pascucci, M.R. Radiolysis and defect structure in electron-irradiated α-quartz. J. Phys. Colloq. 1980, 41, 237–242. [Google Scholar] [CrossRef]
  25. Hobbs, L.W. Topology and geometry in the irradiation-induced amorphization of insulators. Nucl. Instrum. Methods Phys. Res. Sect. B Beam Interact. Mater. At. 1994, 91, 30–42. [Google Scholar] [CrossRef]
  26. Lang, M.; Tracy, C.L.; Palomares, R.; Zhang, F.; Severin, D.; Bender, M.; Trautmann, C.; Park, C.; Prakapenka, V.B.; Skuratov, V.A.; et al. Characterization of ion-induced radiation effects in nuclear materials using synchrotron x-ray techniques. J. Mater. Res. 2015, 30, 1366–1379. [Google Scholar] [CrossRef]
  27. Ziegler, J.F.; Ziegler, M.D.; Biersack, J.P. SRIM—The stopping and range of ions in matter (2010). Nucl. Instrum. Methods Phys. Res. Sect. B Beam Interact. Mater. At. 2010, 268, 1818–1823. [Google Scholar] [CrossRef]
  28. Efimov, A. Vibrational spectra, related properties, and structure of inorganic glasses. J. Non Cryst. Solids 1999, 253, 95–118. [Google Scholar] [CrossRef]
  29. Mysen, B.O.; Finger, L.W.; Virgo, D.; Seifert, F.A. Curve-fitting of Raman spectra of silicate glasses. Am. Mineral. 1982, 67, 686–695. [Google Scholar]
  30. Mckeown, D.; Muller, I.; Buechele, A.; Pegg, I.L.; Kendziora, C. Structural characterization of high-zirconia borosilicate glasses using Raman spectroscopy. J. Non Cryst. Solids 2000, 262, 126–134. [Google Scholar] [CrossRef]
  31. Manara, D.; Grandjean, A.; Neuville, D.R. Advances in understanding the structure of borosilicate glasses: A Raman spectroscopy study. Am. Mineral. 2009, 94, 777–784. [Google Scholar] [CrossRef]
  32. Fukumi, K.; Hayakawa, J.; Komiyama, T. Intensity of Raman band in silicate glasses. J. Non Cryst. Solids 1990, 119, 297–302. [Google Scholar] [CrossRef]
  33. Neuville, D. Viscosity, structure and mixing in (Ca, Na) silicate melts. Chem. Geol. 2006, 229, 28–41. [Google Scholar] [CrossRef]
  34. Frantza, J.D.; Mysen, B.O. Raman spectra and structure of BaO-SiO2 SrO-SiO2 and CaO-SiO2 melts to 1600 °C. Chem. Geol. 1995, 121, 155–176. [Google Scholar] [CrossRef]
  35. Mir, A.H.; Monnet, I.; Boizot, B.; Jégou, C.; Peuget, S. Electron and electron-ion sequential irradiation of borosilicate glasses: Impact of the pre-existing defects. J. Nucl. Mater. 2017, 489, 91–98. [Google Scholar] [CrossRef]
  36. Zapol, P.; He, H.; Kwon, K.; Criscenti, L. First-Principles Study of Hydrolysis Reaction Barriers in a Sodium Borosilicate Glass. Int. J. Appl. Glass Sci. 2013, 4, 395–407. [Google Scholar] [CrossRef]
  37. Peuget, S.; Tribet, M.; Mougnaud, S.; Miro, S.; Jégou, C. Radiations effects in ISG glass: from structural changes to long-term aqueous behavior. Npj. Mater. Degrad. 2018, 2, 23. [Google Scholar] [CrossRef]
  38. Burns, W.G.; Hughes, A.E.; Marples, J.A.C.; Nelson, R.S.; Stoneham, A.M. Effects of radiation on the leach rates of vitrified radioactive waste. J. Nucl. Mater. 1982, 107, 245–270. [Google Scholar] [CrossRef]
  39. Weber, W.J.; McVay, G.L.; Wald, J.W. Effects of alpha-radiolysis on leaching of a nuclear waste glass. J. Am. Ceram. Soc. 1985, 68, 253–255. [Google Scholar] [CrossRef]
  40. Peuget, S.; Broudic, V.; Jégou, C.; Frugier, P.; Roudil, D.; Deschanels, X.; Rabiller, H.; Y. Noel, P. Effect of alpha radiation on the leaching behaviour of nuclear glass. J. Nucl. Mater. 2007, 362, 474–479. [Google Scholar] [CrossRef]
  41. Wellman, D.; Icenhower, J.; Weber, W. Elemental Dissolution Study of Pu-Bearing Borosilicate Glasses. J. Nucl. Mater. 2005, 340, 149–162. [Google Scholar] [CrossRef]
  42. Marples, J.A.C. Dose rate effects in radiation damage to vitrified radioactive waste. Nucl. Instrum. Methods Phys. Res. Sect. B Beam Interact. Mater. At. 1988, 32, 480–486. [Google Scholar] [CrossRef]
  43. Delaye, J.-M.; Kerrache, A.; Gin, S. Topography of borosilicate glass reacting interface under aqueous corrosion. Chem. Phys. Lett. 2013, 588, 180–183. [Google Scholar] [CrossRef]
  44. Dewan, L.; Hobbs, L.W.; Delaye, J.-M. Topological Analysis of the Structure of Self-irradiated Sodium Borosilicate Glass. J. Non Cryst. Solids 2012, 358, 3427–3432. [Google Scholar] [CrossRef]
  45. Peuget, S.; Maugeri, E.A.; Charpentier, T.; Mendoza, C.; Moskura, M.; Fares, T.; Bouty, O.; Jégou, C. Comparison of radiation and quenching rate effects on the structure of a sodium borosilicate glass. J. Non Cryst. Solids 2013, 378, 201–212. [Google Scholar] [CrossRef]
  46. Karakurt, G. Effect of alpha radiation on the physical and chemical properties of silicate glasses. Ph.D. Thesis, Ecole des Mines de Nantes, Nantes, France, 2014. [Google Scholar]
  47. Mir, A.H.; Peuget, S.; Toulemonde, M.; Bulot, P.; Jégou, C.; Miro, S.; Bouffard, S. Defect recovery and damage reduction in borosilicate glasses under double ion beam irradiation. EPL Europhys. Lett. 2015, 112, 36002. [Google Scholar] [CrossRef]
  48. Kluth, P.; Schnohr, C.S.; Pakarinen, O.H.; Djurabekova, F.; Sprouster, D.J.; Giulian, R.; Ridgway, M.C.; Byrne, A.P.; Trautmann, C.; Cookson, D.J.; et al. Fine structure in swift heavy ion tracks in amorphous SiO2. Phys. Rev. Lett. 2008, 101, 175503. [Google Scholar] [CrossRef]
  49. Mir, A.H.; Monnet, I.; Toulemonde, M.; Bouffard, S.; Jégou, C.; Peuget, S. Mono and sequential ion irradiation induced damage formation and damage recovery in oxide glasses: Stopping power dependence of the mechanical properties. J. Nucl. Mater. 2015, 469, 244–250. [Google Scholar] [CrossRef]
  50. Charpentier, T.; Martel, L.; Mir, A.H.; Somers, J.; Jégou, C.; Peuget, S. Self-healing capacity of nuclear glass observed by NMR spectroscopy. Sci. Rep. 2016, 6, 25499. [Google Scholar] [CrossRef] [PubMed]
  51. Arnold, G.W. Alkali depletion and ion beam mixing in glasses. Nucl. Instrum. Methods Phys. Res. Sect. B Beam Interact. Mater. At. 1984, 1, 516–520. [Google Scholar] [CrossRef]
  52. Stroes-Gascoyne, S.; King, F.; Betteridge, J.S.; Garisto, F. The effects of alpha-radiolysis on UO2 dissolution determined from electrochemical experiments with 238Pu-doped UO2. Radiochim. Acta 2002, 90, 9–11. [Google Scholar] [CrossRef]
  53. McVay, G.L.; Weber, W.J.; Pederson, L.R. Effects of radiation on the leaching behavior of nuclear waste forms. Nucl. Chem. Waste Manag. 1981, 2, 103–108. [Google Scholar] [CrossRef]
Figure 1. Kinetic regimes of glass corrosion that have been identified to date [2], illustrated by a plot of the reaction rate and the extent of reaction, ξ (inset diagram), as a function of time. Here, ξ represents the amount of glass dissolved into solution or transformed into a silica-based surface layer (SAL). In the present work, we are mainly concerned with the initial reaction rate, r0, that represents the forward dissolution rate of the glass. Gin and coworkers [2] proposed a constant r0 for a certain time until an SAL is formed. In contrast, Geisler et al. [21] recently observed a linearly decreasing r0 over time already from the beginning of the reaction without the formation of an SAL.
Materials 12 01480 g001
Figure 2. The energy loss of 4.8 MeV/u Au ions calculated with the SRIM code [27] (dashed gray line) and the frequency of the Q3 Si-O stretching mode (red circles) as a function of depth. Note the good agreement between the SRIM calculation, indicating a maximum Au penetration depth of 48 ± 5 µm, and structural changes reflected by the shift of the frequency of the Q3 band.
Materials 12 01480 g002
Figure 3. (a) Schematic drawing of the fluid cell (not to scale) used in this study, and (b) the location of the Raman spectroscopic line scans cross the heavy ion bombarded (5 × 10¹² Au ions/cm2) surface layer into the non-irradiated glass.
Materials 12 01480 g003
Figure 4. (a) Representative background-corrected R(ν) Raman spectra (average of 10 individual spectra) from the non-irradiated glass (upper spectrum) and the irradiated surface layer (lower spectrum) of the ternary Na borosilicate glass (TBG) used in this study for dissolution experiments along with the result of a least-squares fit with 15 Gauss–Lorentz functions. The assignment of the Raman bands to a vibrational mode of a structural glass unit and to O2 is indicated by colored Gauss-Lorentz profiles. The different glass bands are labeled by numbers and by the Qn notation in the cases of the stretching motions of [SiO4] groups with n = 1, 2, 3, or 4 bridging oxygen atoms. Note the significantly higher intensity of the O2 band near 1555 cm−1 in the spectrum from the irradiated sample. (b) Diagram showing the difference, Δf= firrfnon-irr, between the intensity fraction of different silicate- and borate-related bands of the irradiated, firr, and non-irradiated, fnon-irr, TBG. The fractions were determined from the integrated intensities and the intensity sum of the respective Raman bands that are shown and labeled in Figure 4a.
Materials 12 01480 g004
Figure 5. The dissolution rate and glass retreat (inset) as a function of time for (a) the first and (b) the second experiment with the irradiated TBG. The rate data clearly define two distinct trends that were individually fitted with a linear function. Light blue data points in Figure 5b were identified as outliers and excluded from the fit. The two trends can be related to the congruent (stoichiometric) dissolution of the irradiated surface layer (red symbols) and the underlying non-irradiated glass (blue symbols). The intercept of the red line with the y axis defines the forward dissolution rate, r0, of the irradiated glass, whereas the intercept of the blue line with the red line gives the forward dissolution rate of the non-irradiated glass and defines the time when glass dissolution reached the non-irradiated part of the glass.
Materials 12 01480 g005
Figure 6. Arrhenius diagram with the initial or forward dissolution rates r0 obtained for the non-irradiated (blue symbols) and irradiated (red symbols) TBG. Data from Geisler et al. [21] are also plotted. The dark and light blue lines represent an unweighted and an error-weighted linear fit to the data, respectively. For the unweighted fit the 1-sigma confidence interval is also shown as we use this fit to estimate r0irr/r0 and its error.
Materials 12 01480 g006
Table 1. Summary of forward dissolution rates of non-irradiated, r0, and irradiated TBG, r0irr, obtained by in situ fluid-cell Raman spectroscopy. The uncertainties were obtained from the least-squares fit (Figure 5) and are given at the 1-sigma level.
SampleNon-Irradiated TBGIrradiated TBG
T (°C)
r0irr (µm/h)
r0 (µm/h)
85.2 ± 0.2
-
1.61 ± 0.04
81.7± 0.1
-
1.00 ± 0.03
85.1 ± 0.7
-
2.10 ± 0.03
80.0 ± 0.2
5.1 ± 0.4
1.8 ± 0.2
82.6 ± 0.3
5.5 ± 0.6
1.5 ± 0.1
Reference[21]This study

