Fluoride Fiber-Based Plasmonic Biosensor with Two-Dimensional Material Heterostructures: Enhancement of Overall Figure-of-Merit via Optimization of Radiation Damping in Near Infrared Region


Abstract
:1. Introduction
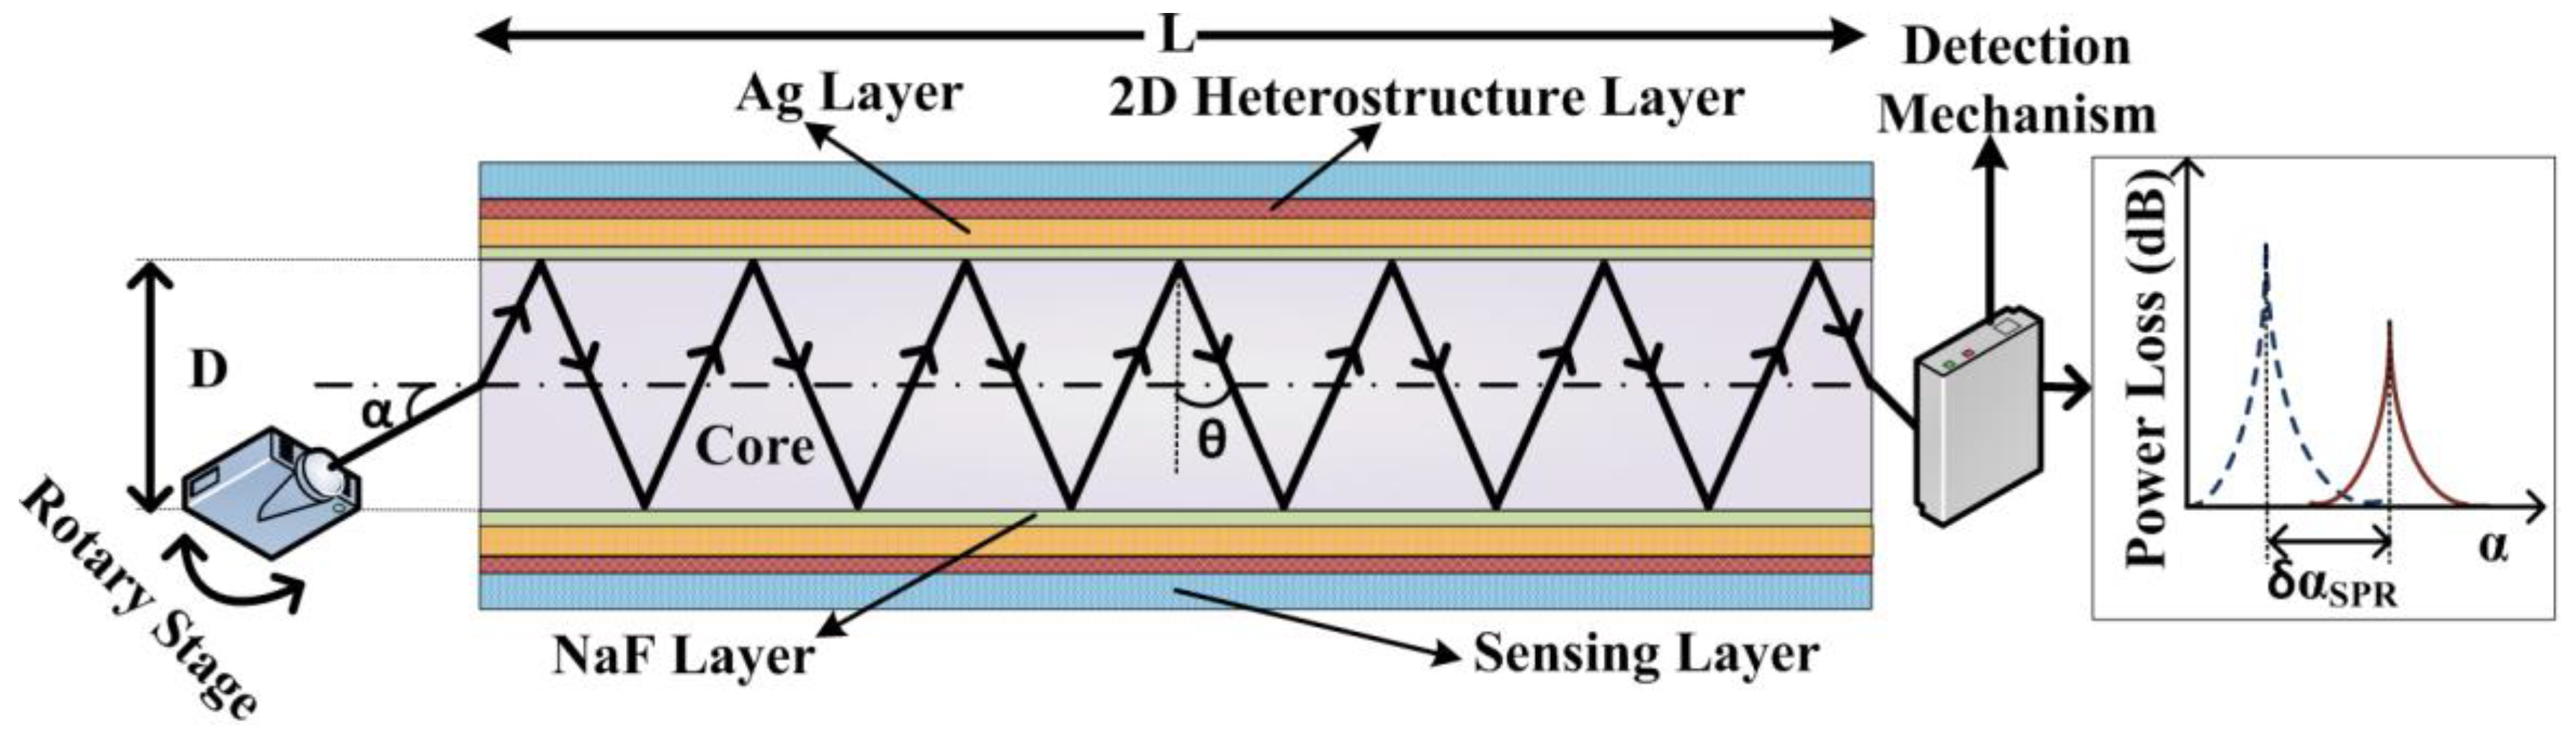
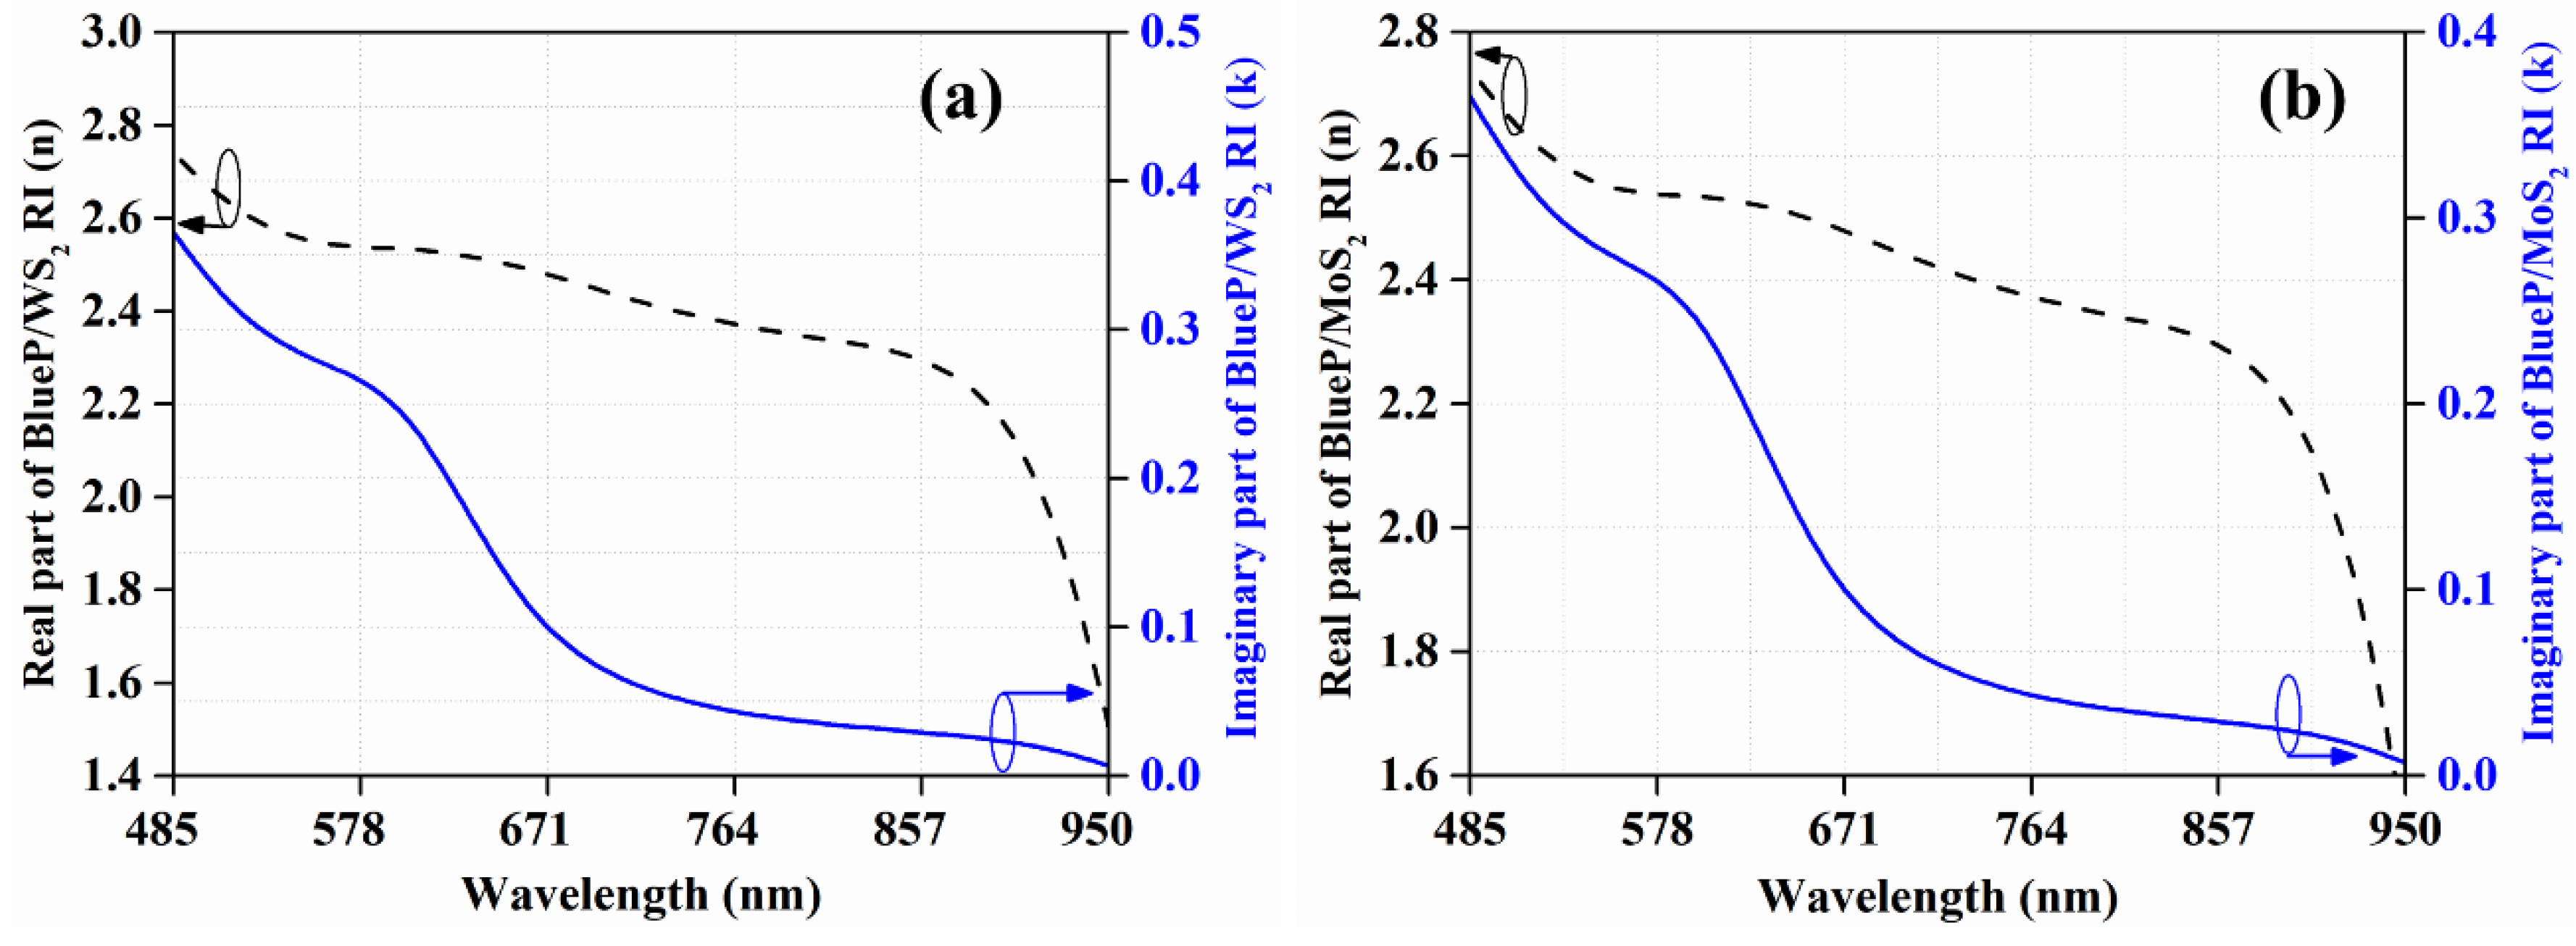
2. Theory and Design Consideration
3. Results and Discussion
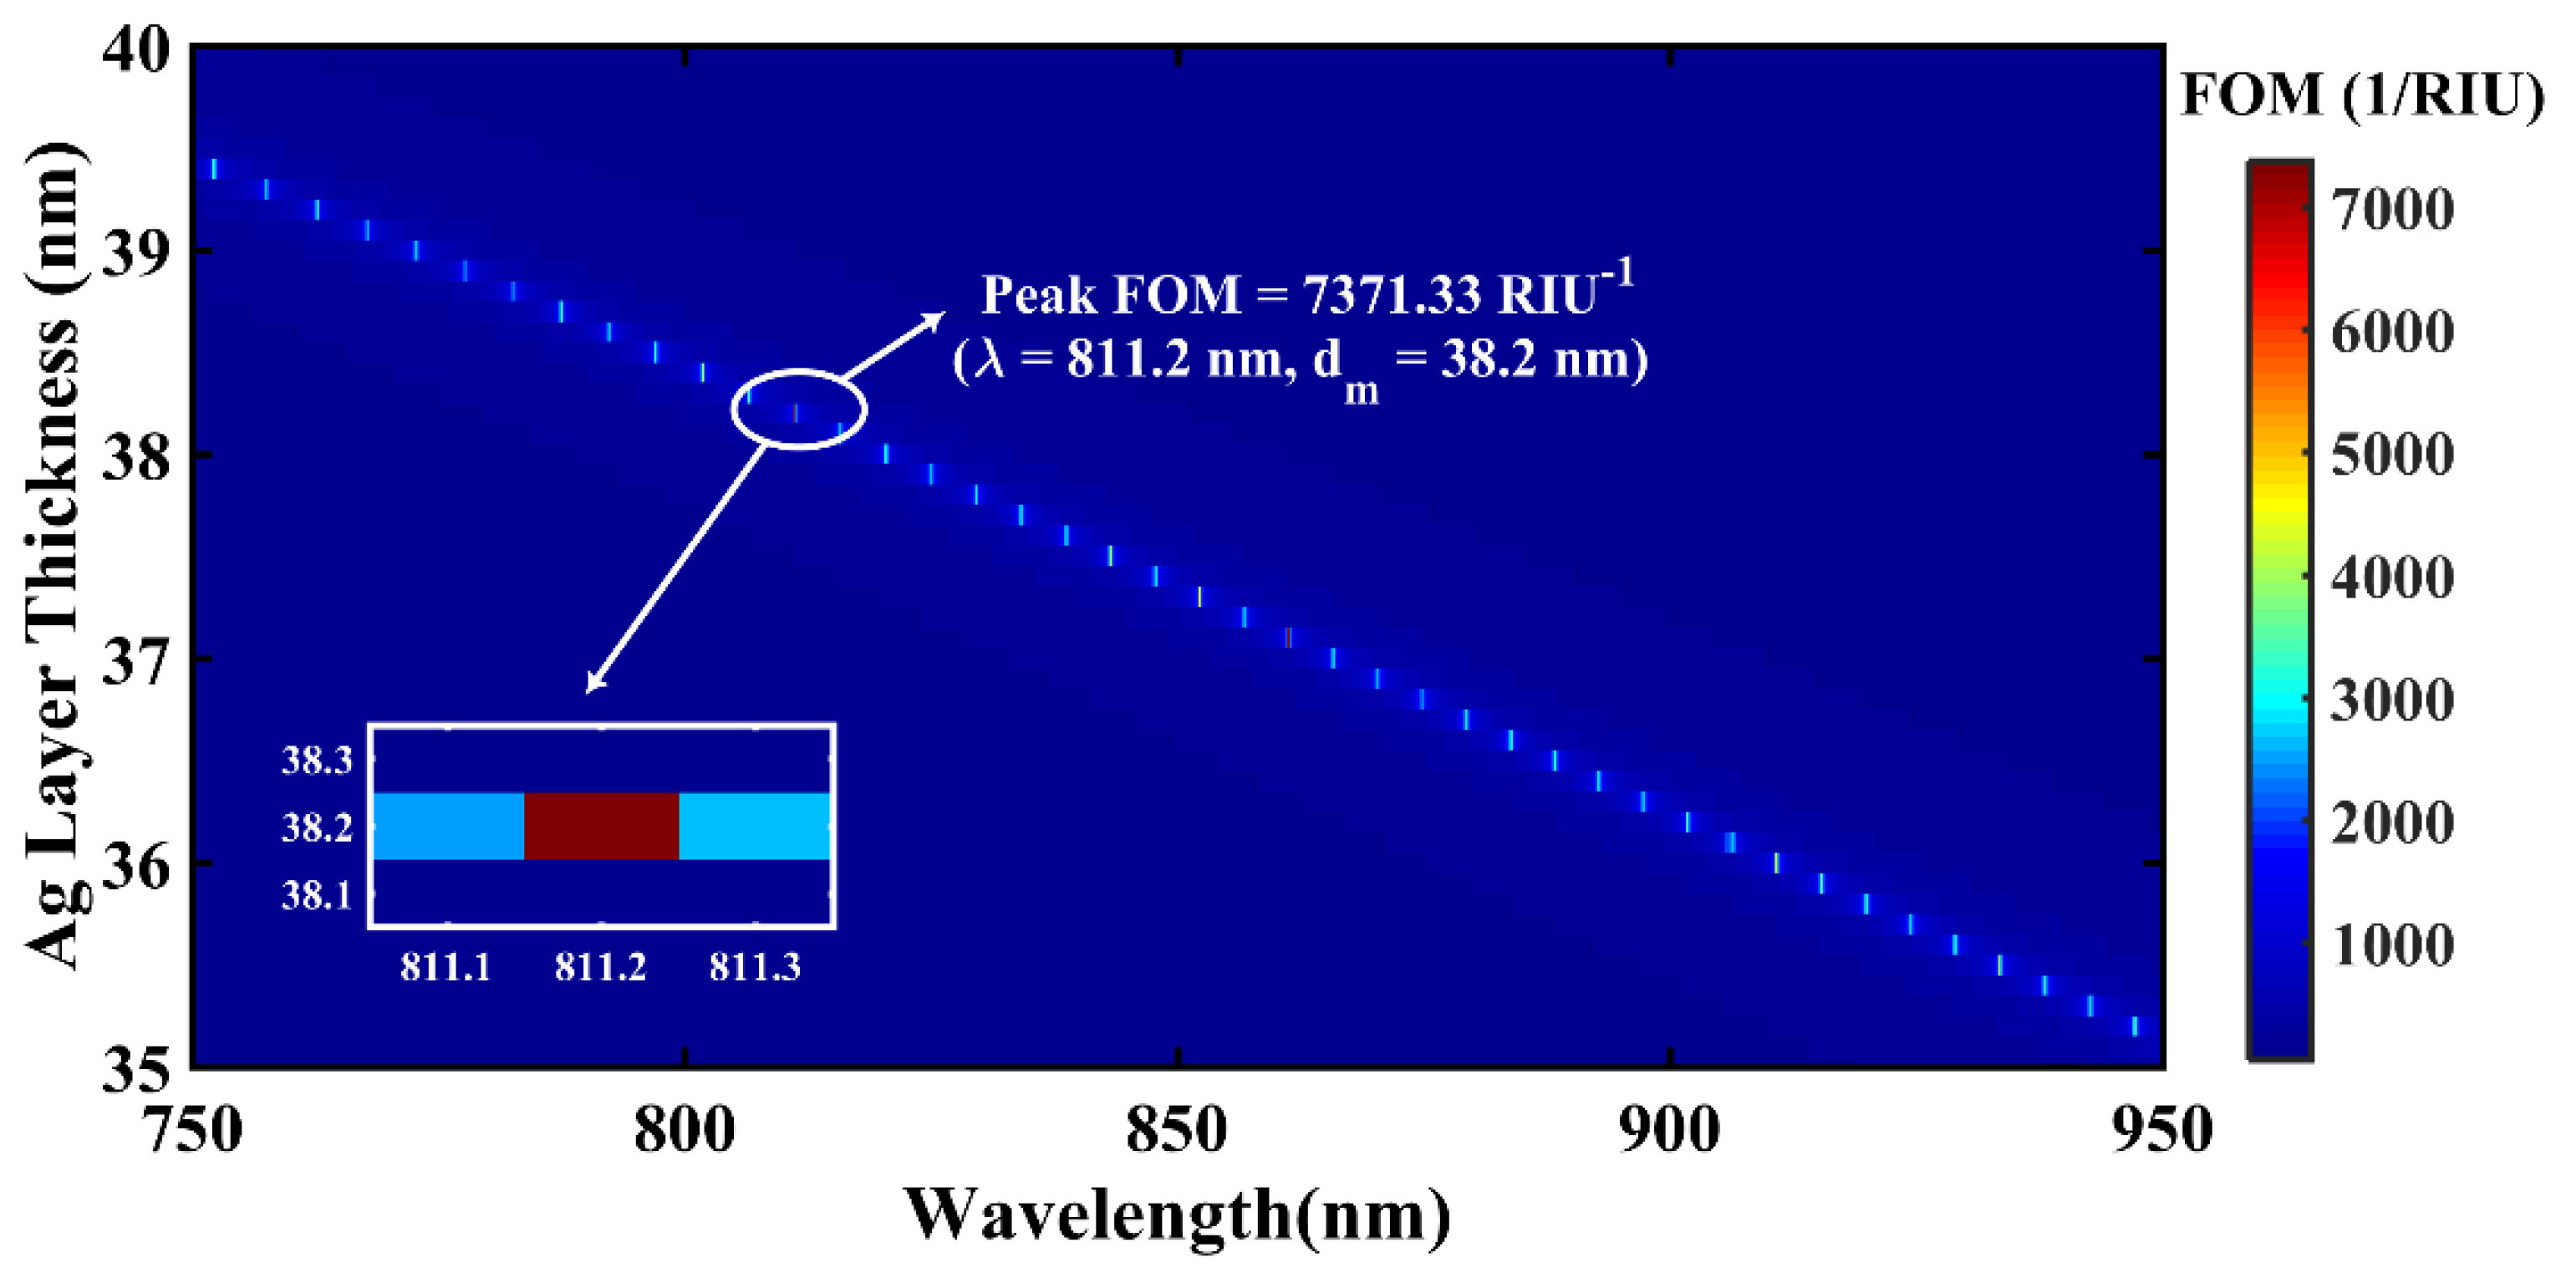
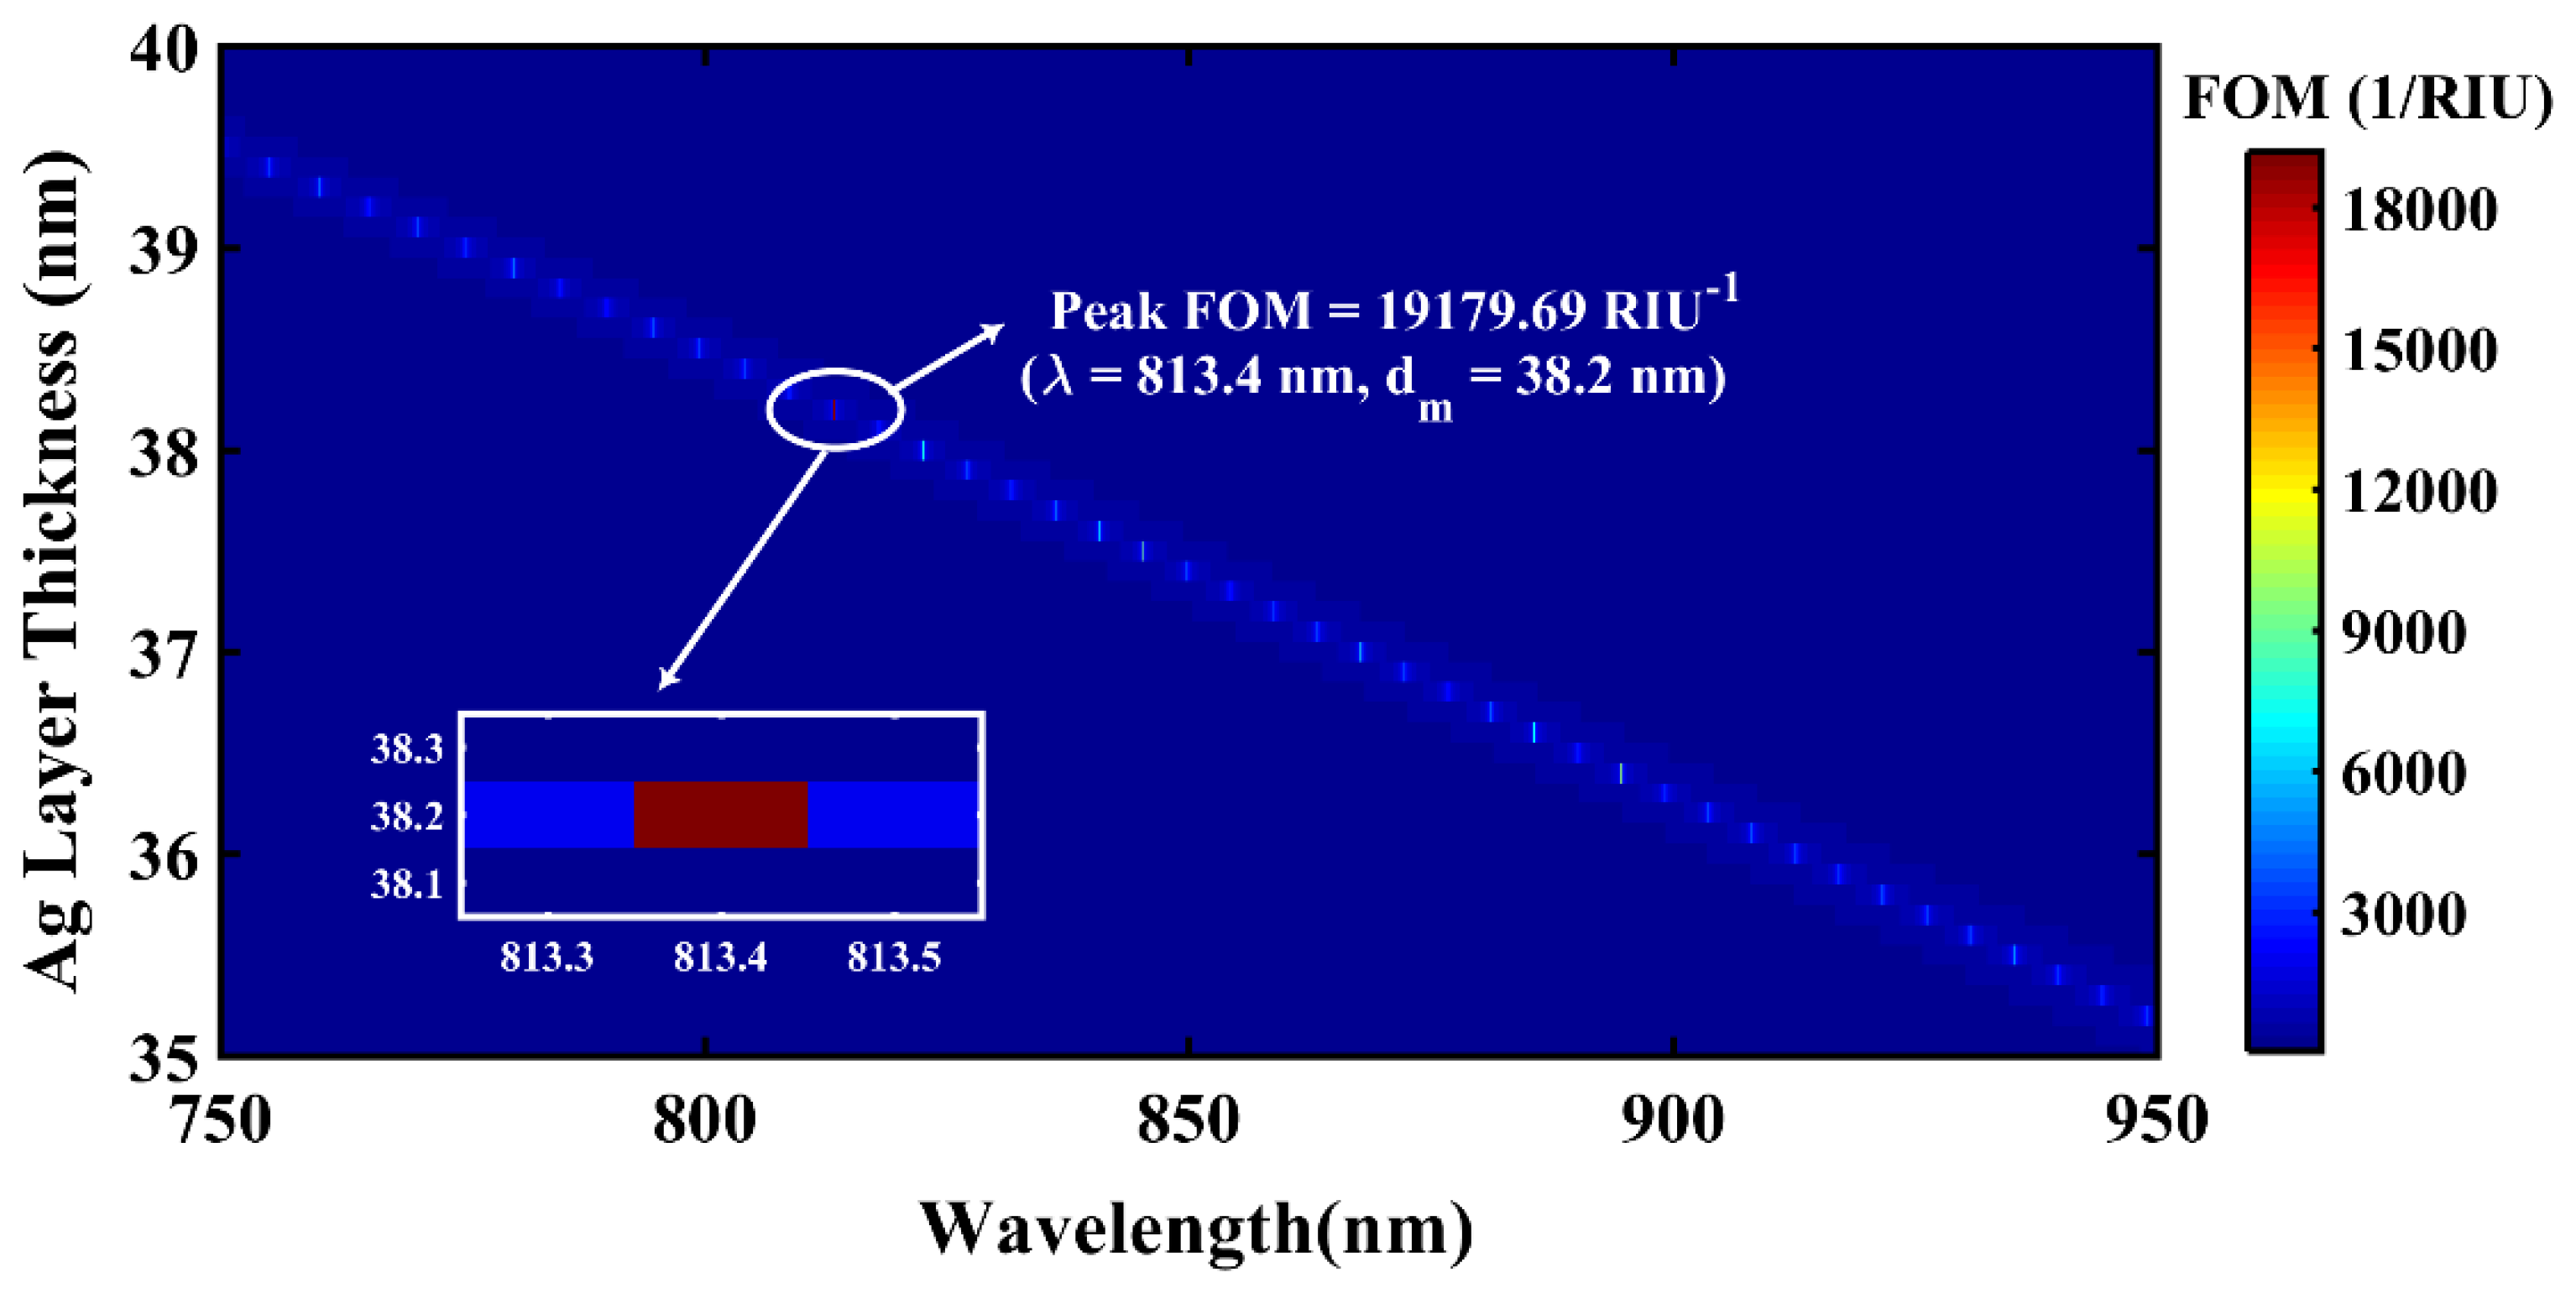
3.1. Analysis of 2D (dm, λ) Variation of FOM for Sensor Designs with BlueP/WS2 & BlueP/MoS2 Heterostructures
3.2. Comparative Analysis between BlueP/WS2 and BlueP/MoS2 Heterostructure-Based Sensor Designs
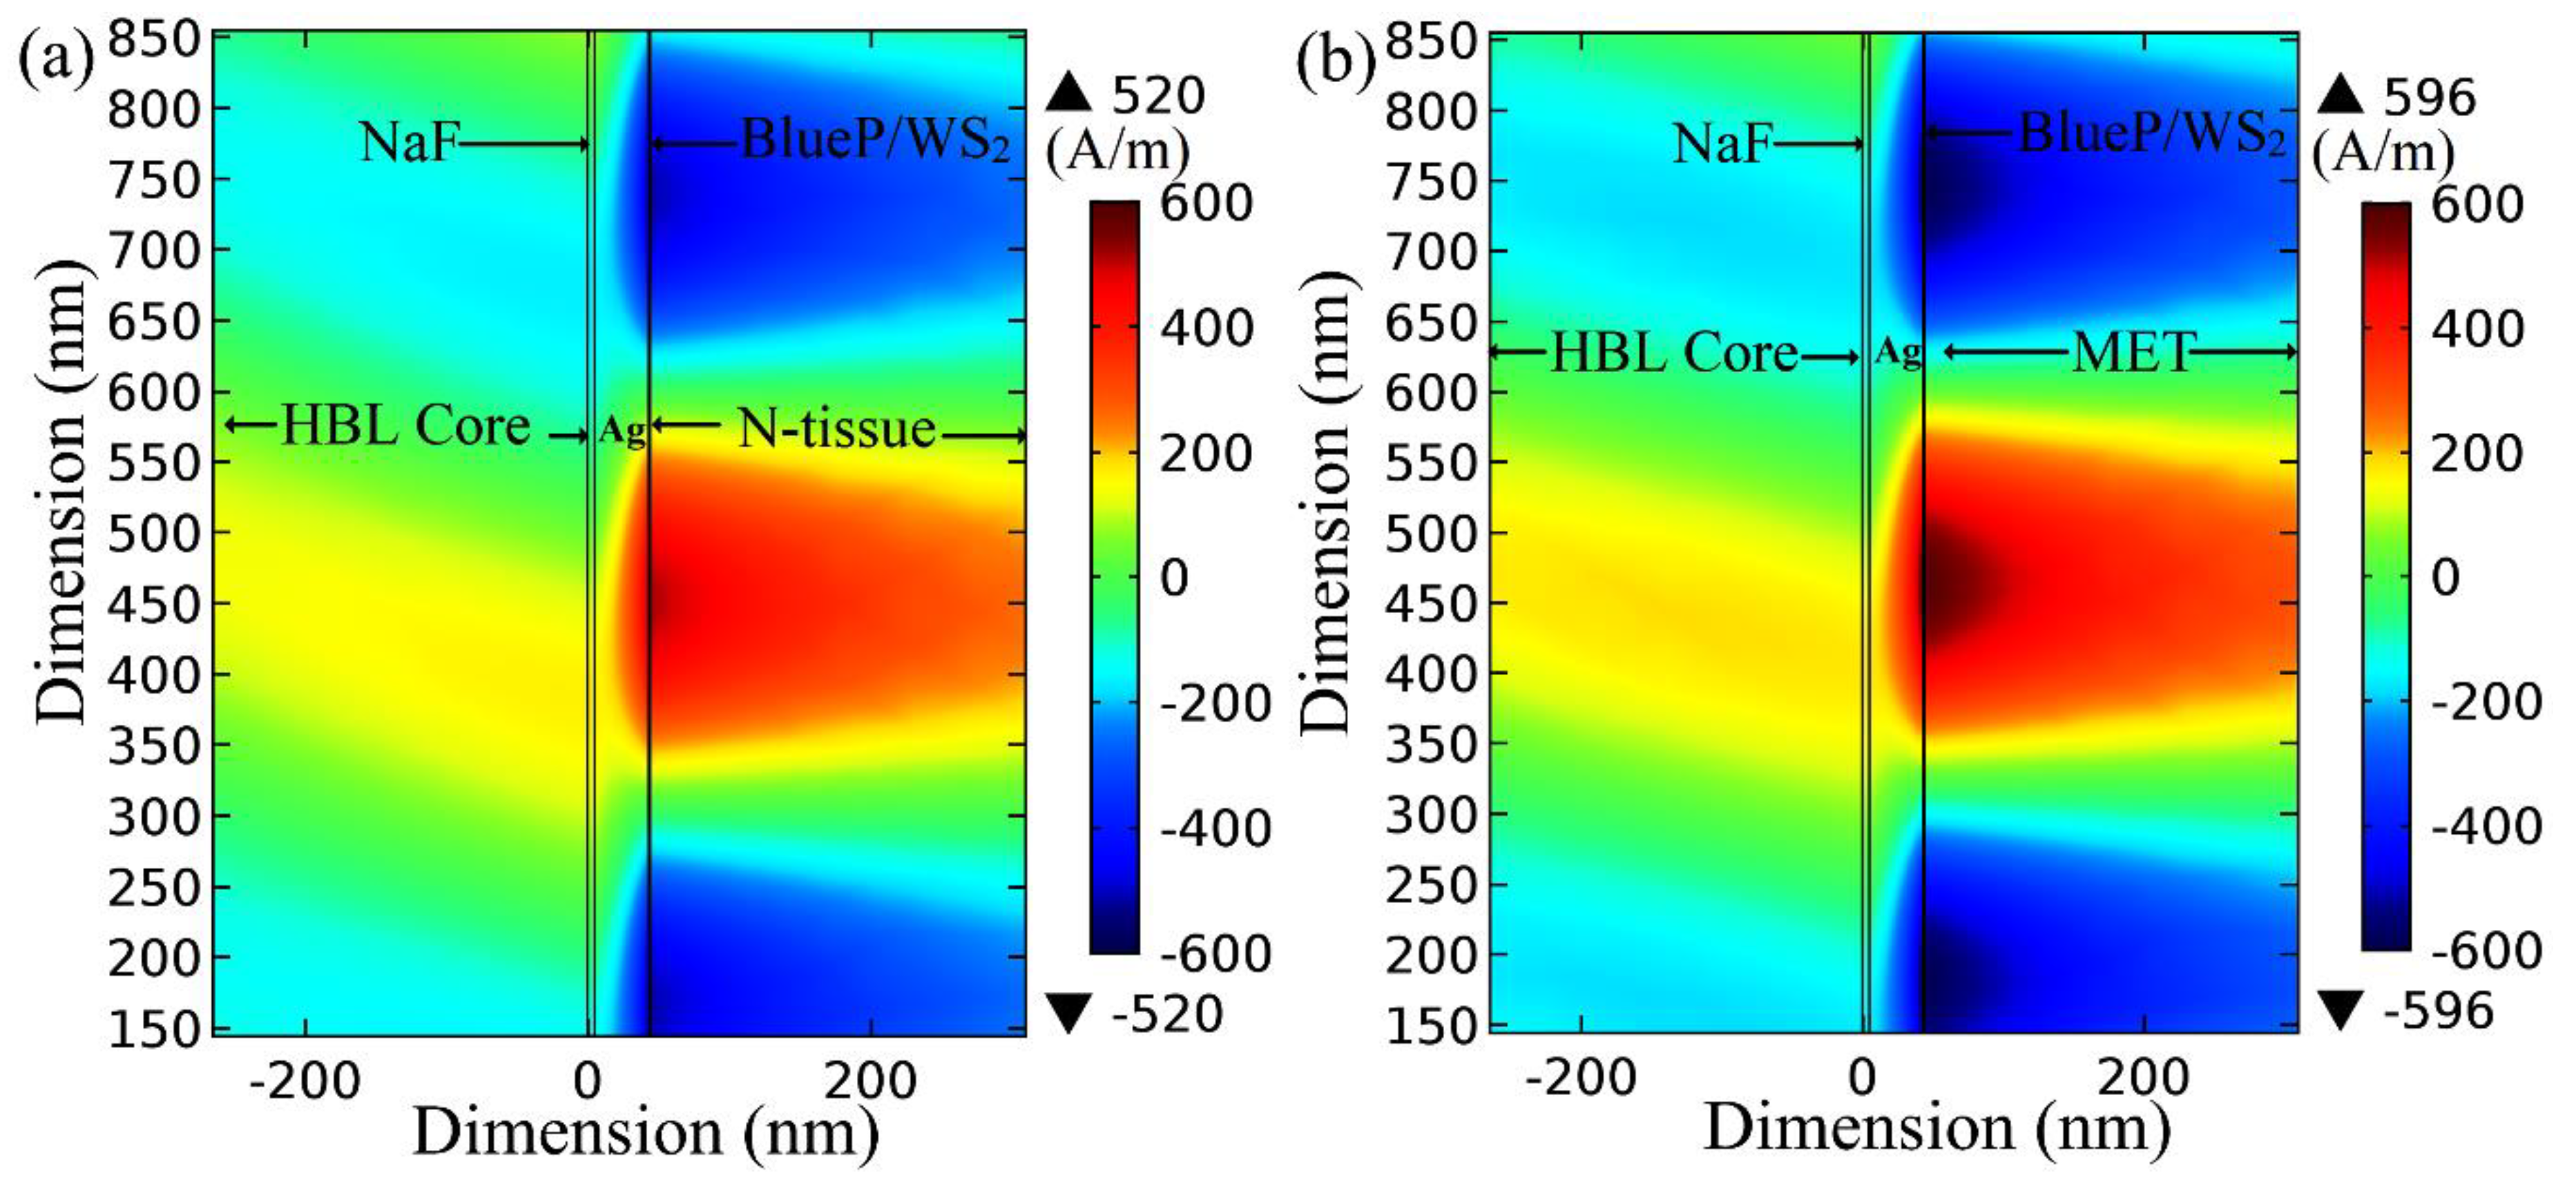
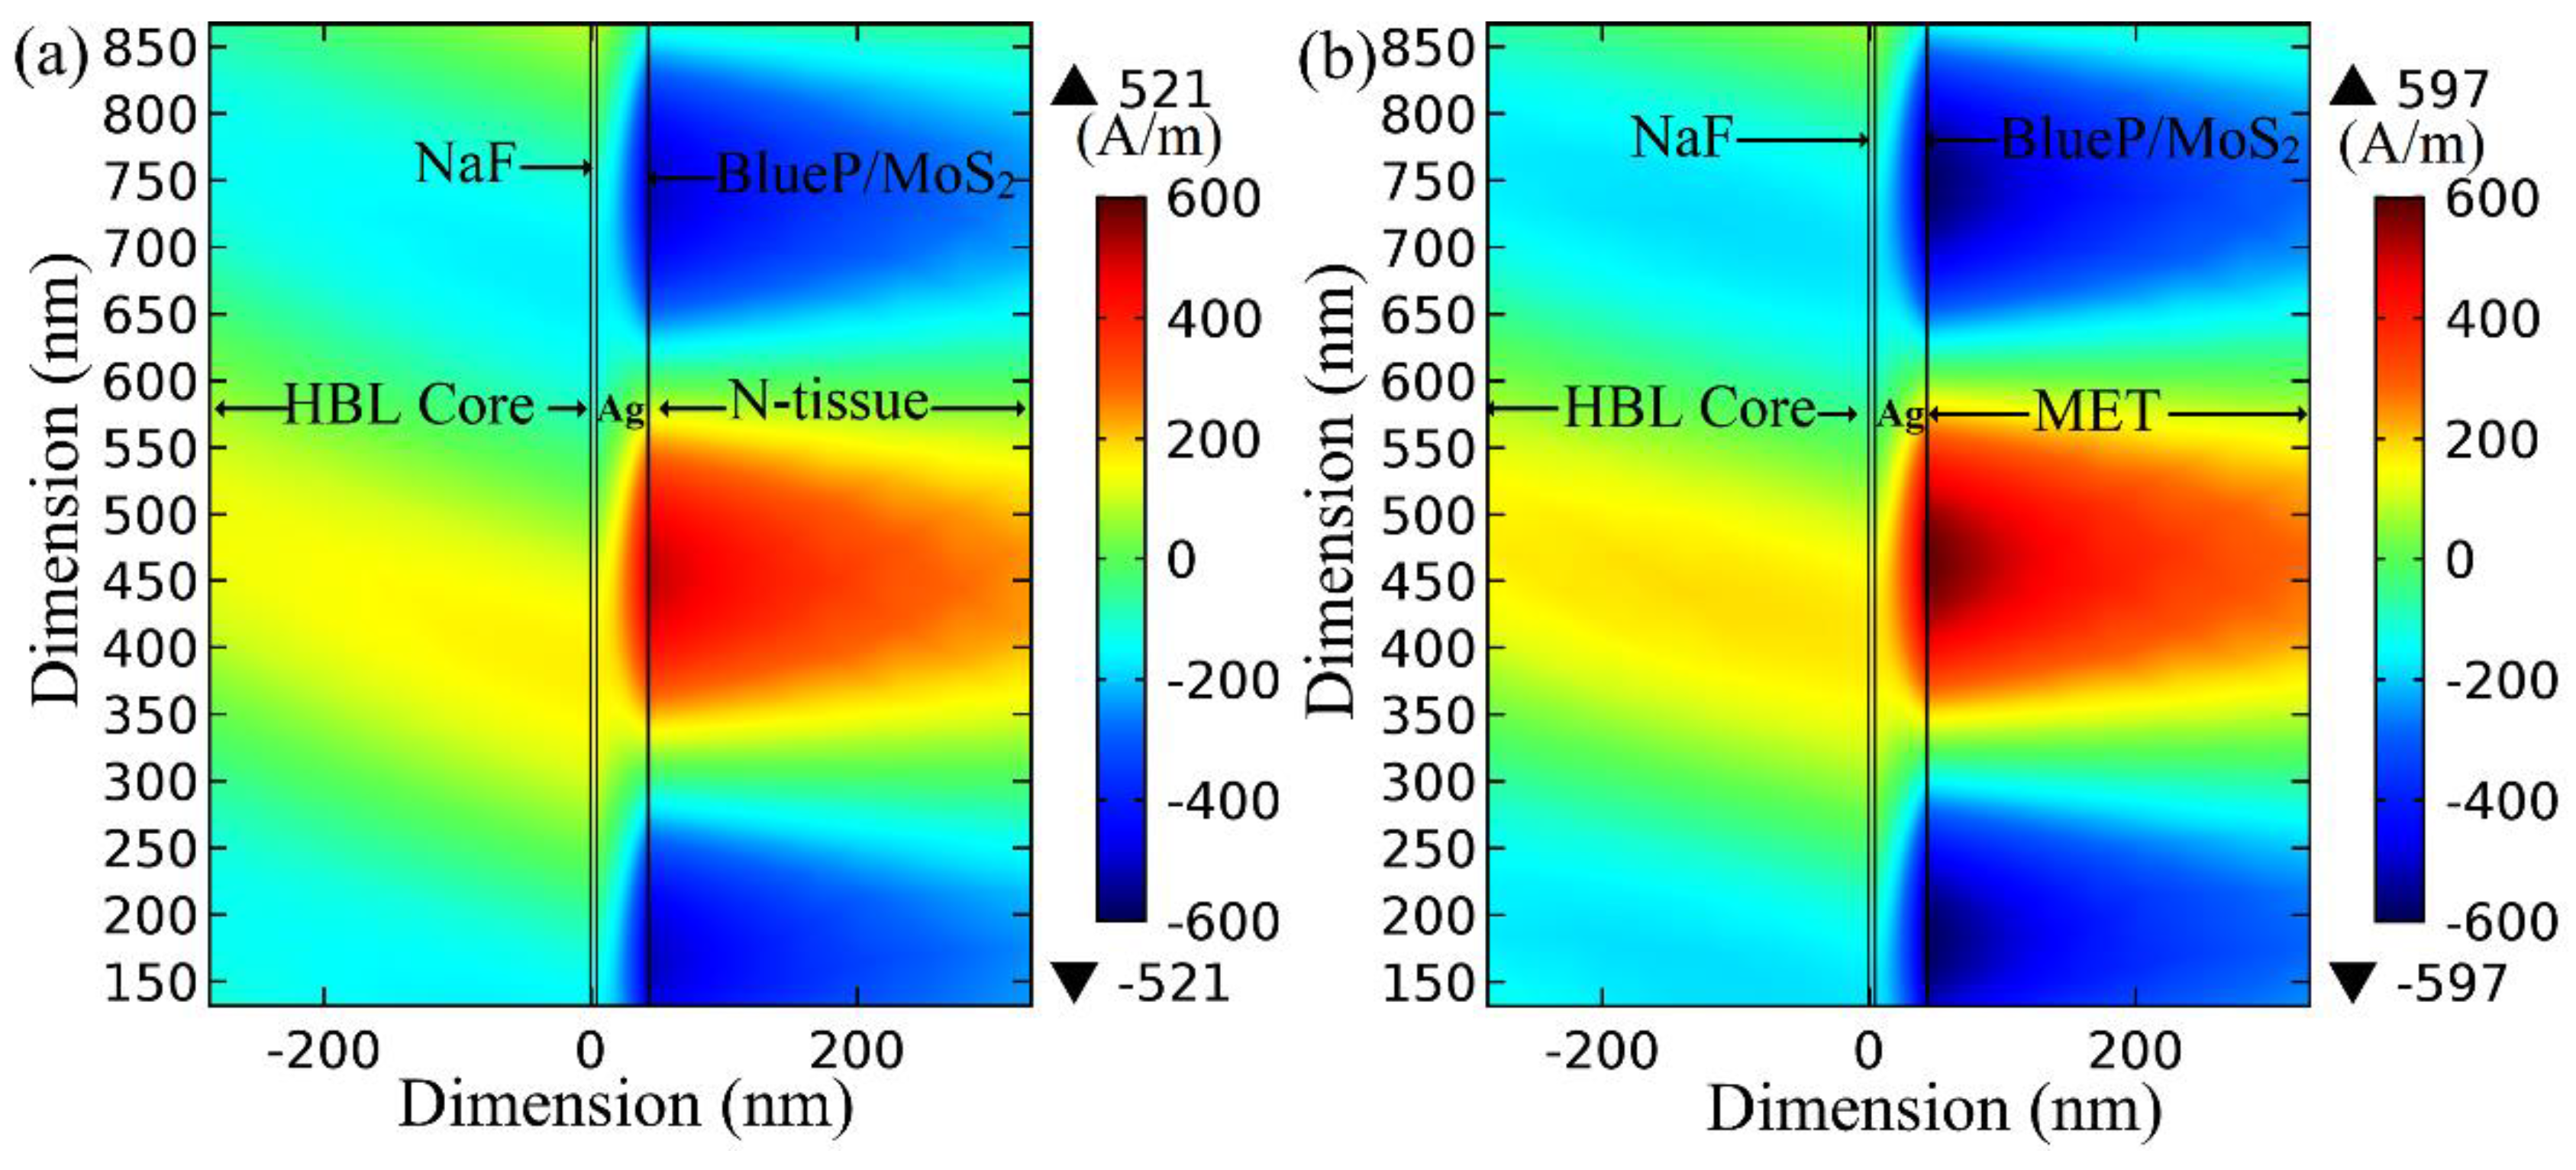
3.3. Field Analysis at Resonance Condition
3.4. Comprehensive Performance Analysis under ORD Conditions
- (i)
- the wavelength of sensor operation should ideally be as large as possible in the NIR range, owing to the lower photodamage of the analyte (biosamples, in particular) [42] and the smaller Rayleigh scattering factor, RSF (i.e., λ−4),
- (ii)
- the ratio (PLR) of peak PL (MET tissue) to peak PL (N tissue) under corresponding ORD conditions (as depicted in Figure 5) can be added as another performance element,
- (iii)
- as discussed in Section 3.3, field enhancement factor (FEF) is another possible inclusion to the sensor’s performance evaluation.
4. Conclusions
Author Contributions
Funding
Acknowledgments
Conflicts of Interest
References
- Balendhran, S.; Walia, S.; Nili, H.; Sriram, S.; Bhaskaran, M. Elemental analogues of graphene: Silicene, germanene, stanene, and phosphorene. Small 2015, 11, 640–652. [Google Scholar] [CrossRef] [PubMed]
- Rubio-Bollinger, G.; Guerrero, R.; de Lara, D.; Quereda, J.; Vaquero-Garzon, L.; Agraït, N.; Bratschitsch, R.; Castellanos-Gomez, A. Enhanced Visibility of MoS2, MoSe2, WSe2 and Black-Phosphorus: Making Optical Identification of 2D Semiconductors Easier. Electronics 2015, 4, 847–856. [Google Scholar] [CrossRef]
- Mas-Ballesté, R.; Gómez-Navarro, C.; Gómez-Herrero, J.; Zamora, F. 2D materials: To graphene and beyond. Nanoscale 2011, 3, 20–30. [Google Scholar] [CrossRef] [PubMed]
- Song, B.; Li, D.; Qi, W.; Elstner, M.; Fan, C.; Fang, H. Graphene on Au(111): A highly conductive material with excellent adsorption properties for high-resolution bio/nanodetection and identification. ChemPhysChem 2010, 11, 585–589. [Google Scholar] [CrossRef]
- Koppens, F.H.L.; Chang, D.E.; de Abajo, F.J. Graphene Plasmonics: A Platform for Strong Light-Matter Interactions. Nano Lett. 2011, 11, 3370–3377. [Google Scholar] [CrossRef] [PubMed]
- Bonaccorso, F.; Sun, Z.; Hasan, T.; Ferrari, A.C. Graphene Photonics and Optoelectronics. Nat. Photonics 2010, 4, 611–622. [Google Scholar] [CrossRef]
- Wu, L.; Guo, J.; Wang, Q.; Lu, S.; Dai, X.; Xiang, Y.; Fan, D. Sensitivity enhancement by using few-layer black phosphorus-graphene/TMDCs heterostructure in surface plasmon resonance biochemical sensor. Sens. Actuators B Chem. 2017, 249, 542–548. [Google Scholar] [CrossRef]
- Novoselov, K.S.; Mishchenko, A.; Carvalho, A.; Neto, A.H.C. 2D materials and van der Waals heterostructures. Research 2016, 353, aac9439. [Google Scholar]
- Mcgaughey, G.B.; Gagne, M.; Rappe, A.K. π-Stacking Interactions. J. Biol. Chem. 1998, 273, 15458–15463. [Google Scholar] [CrossRef]
- Kong, L.; Enders, A.; Rahman, T.S.; Dowben, P. A Molecular adsorption on graphene. J. Phys. Condens. Matter 2014, 26, 443001. [Google Scholar]
- Zhao, Y.; Li, X.; Zhou, X.; Zhang, Y. Review on the graphene based optical fiber chemical and biological sensors. Sens. Actuators B Chem. 2016, 231, 324–340. [Google Scholar] [CrossRef]
- Maharana, P.K.; Srivastava, T.; Jha, R. On the Performance of Highly Sensitive and Accurate Graphene-on-Aluminum and Silicon-Based SPR Biosensor for Visible and Near Infrared. Plasmonics 2014, 9, 1113–1120. [Google Scholar] [CrossRef]
- Pandey, A.K.; Sharma, A.K. Simulation and analysis of plasmonic sensor in NIR with fluoride glass and graphene layer. Photonics Nanostruct. Fundam. Appl. 2018, 28, 94–99. [Google Scholar] [CrossRef]
- Wu, L.; Guo, J.; Dai, X.; Xiang, Y.; Fan, D. Sensitivity Enhanced by MoS2-Graphene Hybrid Structure in Guided-Wave Surface Plasmon Resonance Biosensor. Plasmonics 2017, 13, 281–285. [Google Scholar] [CrossRef]
- Wu, L.; Jia, Y.; Jiang, L.; Guo, J.; Dai, X.; Xiang, Y.; Fan, D. Sensitivity Improved SPR Biosensor Based on the MoS2/Graphene–Aluminum Hybrid Structure. J. Light. Technol. 2017, 35, 82–87. [Google Scholar] [CrossRef]
- Maurya, J.B.; Prajapati, Y.K.; Singh, V.; Saini, J.P.; Tripathi, R. Improved performance of the surface plasmon resonance biosensor based on graphene or MoS2 using silicon. Opt. Commun. 2016, 359, 426–434. [Google Scholar] [CrossRef]
- Sharma, A.K.; Pandey, A.K. Blue Phosphorene/MoS2 Heterostructure based SPR Sensor with Enhanced Sensitivity. IEEE Photonics Technol. Lett. 2018, 30, 595–598. [Google Scholar] [CrossRef]
- Liang, G.; Luo, Z.; Liu, K.; Wang, Y.; Dai, J.; Duan, Y. Fiber Optic Surface Plasmon Resonance–Based Biosensor Technique: Fabrication, Advancement, and Application. Crit. Rev. Anal. Chem. 2016, 46, 213–223. [Google Scholar] [CrossRef]
- Sharma, A.K.; Pandey, A.K.; Kaur, B. A Review of advancements (2007–2017) in plasmonics-based optical fiber sensors. Opt. Fiber Technol. 2018, 43, 20–34. [Google Scholar] [CrossRef]
- Fu, H.; Zhang, S.; Chen, H.; Weng, J. Graphene Enhances the Sensitivity of Fiber-Optic Surface Plasmon Resonance Biosensor. IEEE Sens. J. 2015, 15, 5478–5482. [Google Scholar] [CrossRef]
- Mishra, A.K.; Mishra, S.K.; Verma, R.K. Graphene and Beyond Graphene MoS2: A New Window in Surface-Plasmon-Resonance-Based Fiber Optic Sensing. J. Phys. Chem. C 2016, 120, 2893–2900. [Google Scholar] [CrossRef]
- Sharma, A.K.; Kaur, B. Fiber optic SPR sensing enhancement in NIR via optimum radiation damping catalyzed by 2D materials. IEEE Photonics Technol. Lett. 2018, 30. [Google Scholar] [CrossRef]
- Sharma, A.K.; Kaur, B. Simulation of multilayered heterojunction-based chalcogenide fiber SPR sensor with ultrahigh figure of merit in near infrared. IEEE Sens. J. 2019. [Google Scholar] [CrossRef]
- Peng, Q.; Wang, Z.; Sa, B.; Wu, B.; Sun, Z. Electronic structures and enhanced optical properties of blue phosphorene/transition metal dichalcogenides van der Waals heterostructures. Sci. Rep. 2016, 6, 31994. [Google Scholar] [CrossRef]
- Jariwala, D.; Davoyan, A.R.; Tagliabue, G.; Sherrott, M.C.; Wong, J.; Atwater, H.A. Near-Unity Absorption in van der Waals Semiconductors for Ultrathin Optoelectronics. Nano Lett. 2016, 16, 5482–5487. [Google Scholar] [CrossRef]
- ZBLAN Fluoride Glass Fibers & Cables. Available online: https://www.fiberlabs.com/fiberindex/fiber-stock (accessed on 30 April 2019).
- Sharma, A.K. Plasmonic biosensor for detection of hemoglobin concentration in human blood: Design considerations. J. Appl. Phys. 2013, 114. [Google Scholar] [CrossRef]
- Bendow, B.; Brown, R.N.; Lipson, H.G.; Drexhage, M.G.; Moynihan, C.T. Infrared edge absorption in fluorohafnate glass. Appl. Opt. 1982, 21, 4393–4395. [Google Scholar] [CrossRef]
- Tran, D.C.; Sigel, G.H.; Bendow, B. Heavy Metal Fluoride Glasses and Fibers: A Review. J. Lightw. Technol. 1984, 2, 566–586. [Google Scholar] [CrossRef]
- Pandey, A.K.; Sharma, A.K.; Basu, R. Fluoride Glass based Surface Plasmon Resonance Sensor in Infrared region: Performance Evaluation. J. Phys. D Appl. Phys. 2017, 50, 185103. [Google Scholar] [CrossRef]
- Ghatak, A.; Thyagarajan, K. An Introduction to Fiber Optics; Cambridge University Press: Cambridge, UK, 1998; ISBN 9780521577854. [Google Scholar]
- Li, H.H. Refractive index of alkaline earth halids and its wavelength and temperature derivatives. J. Phys. Chem. 1980, 9, 161–289. [Google Scholar]
- Rakic, A.D.; Djurisic, A.B.; Elazar, J.M.; Majewski, M.L. Optical properties of metallic films for vertical-cavity optoelectronic devices. Appl. Opt. 1998, 37, 5271–5283. [Google Scholar] [CrossRef]
- Giannios, P.; Toutouzas, K.G.; Matiatou, M.; Stasinos, K.; Konstadoulakis, M.M.; Zografos, G.C.; Moutzouris, K. Visible to near-infrared refractive properties of freshly-excised human-liver tissues: Marking hepatic malignancies. Sci. Rep. 2016, 6, 27910. [Google Scholar] [CrossRef]
- Ross, K.F.A.; Gordon, R.E. Water in malignant tissue, measured by cell refractometry and nuclear magnetic resonance. J. Microsc. 1982, 128, 7–21. [Google Scholar] [CrossRef]
- Palumbo, A.; Tourlomousis, F.; Chang, R.C.; Yang, E.-H. Influence of Transition Metal Dichalcogenide Surfaces on Cellular Morphology and Adhesion. ACS Appl. Biol. Mater. 2018, 1, 1448–1457. [Google Scholar] [CrossRef]
- Wolfram, T.; Vojak, B.A.; Edward, T.; Maas, J.; Burnham, R.D. Optically Pumped Laser. U.S. Patent 4,901,330, 13 February 1990. [Google Scholar]
- Lattice Trap Improves Optical Clocks. Available online: http://optics.org/article/22237 (accessed on 30 April 2019).
- Mao, Y.; Bao, Y.; Wang, W.; Li, Z.; Li, F.; Niu, L. Development and Application of Time-Resolved Surface Plasmon Resonance Spectrometer. Am. J. Anal. Chem. 2011, 2, 589–604. [Google Scholar] [CrossRef]
- Li, L.; Zhang, X.; Liang, Y.; Guang, J.; Peng, W. Dual-channel fiber surface plasmon resonance biological sensor based on a hybrid interrogation of intensity and wavelength modulation. J. Biomed. Opt. 2016, 21, 127001. [Google Scholar] [CrossRef]
- Li, L.; Liang, Y.; Guang, J.; Cui, W.; Zhang, X.; Masson, J.-F.; Peng, W. Dual Kretschmann and Otto configuration fiber surface plasmon resonance biosensor. Opt. Express 2017, 25, 26950. [Google Scholar] [CrossRef]
- Ziblat, R.; Lirtsman, V.; Davidov, D.; Aroeti, B. Infrared surface plasmon resonance: A novel tool for real time sensing of variations in living cells. Biophys. J. 2006, 90, 2592–2599. [Google Scholar] [CrossRef]
- Sharma, A.K.; Kaur, B. Optical Fiber Technology Chalcogenide fiber-optic SPR chemical sensor with MoS 2 monolayer, polymer clad, and polythiophene layer in NIR using selective ray launching. Opt. Fiber Technol. 2018, 43, 163–168. [Google Scholar] [CrossRef]
- Popescu, V.; Puscas, N.; Perrone, G. The Sensing Characteristics of a Bragg Fiber Based Plasmonic Biosensor Using an As2S3 Chalcogenide Layer. Optics 2018, 6, 21–27. [Google Scholar] [CrossRef]
- Xia, K.; Feng, X.; Yang, M.; Luo, Y.; Tang, J.; Guan, H.; Lu, H.; Yu, J.; Zhang, J.; Chen, Y.; et al. Long range surface plasmon resonance sensor based on side polished fiber with a buffer layer of magnesium fluoride. Opt. Quant. Electron. 2017, 49, 147. [Google Scholar]
- Bialiayeu, A.; Bottomley, A.; Prezgot, D.; Ianoul, A.; Albert, J. Plasmon-enhanced refractometry using silver nanowire coatings on tilted fibre Bragg gratings. Nanotechnology 2012, 23, 444012. [Google Scholar] [CrossRef] [PubMed]
- Gazzaz, K.; Berini, P. Theoretical biosensing performance of surface plasmon polariton Bragg gratings. Appl. Opt. 2015, 54, 1673. [Google Scholar] [CrossRef]


| S.N. | Monolayer 2D Heterostructure | dm (nm) | λ (nm) | δns (RIU) | δαSPR (°) | Sensitivity (°/RIU) | FWHM (°) | M-FOM (RIU−1) |
|---|---|---|---|---|---|---|---|---|
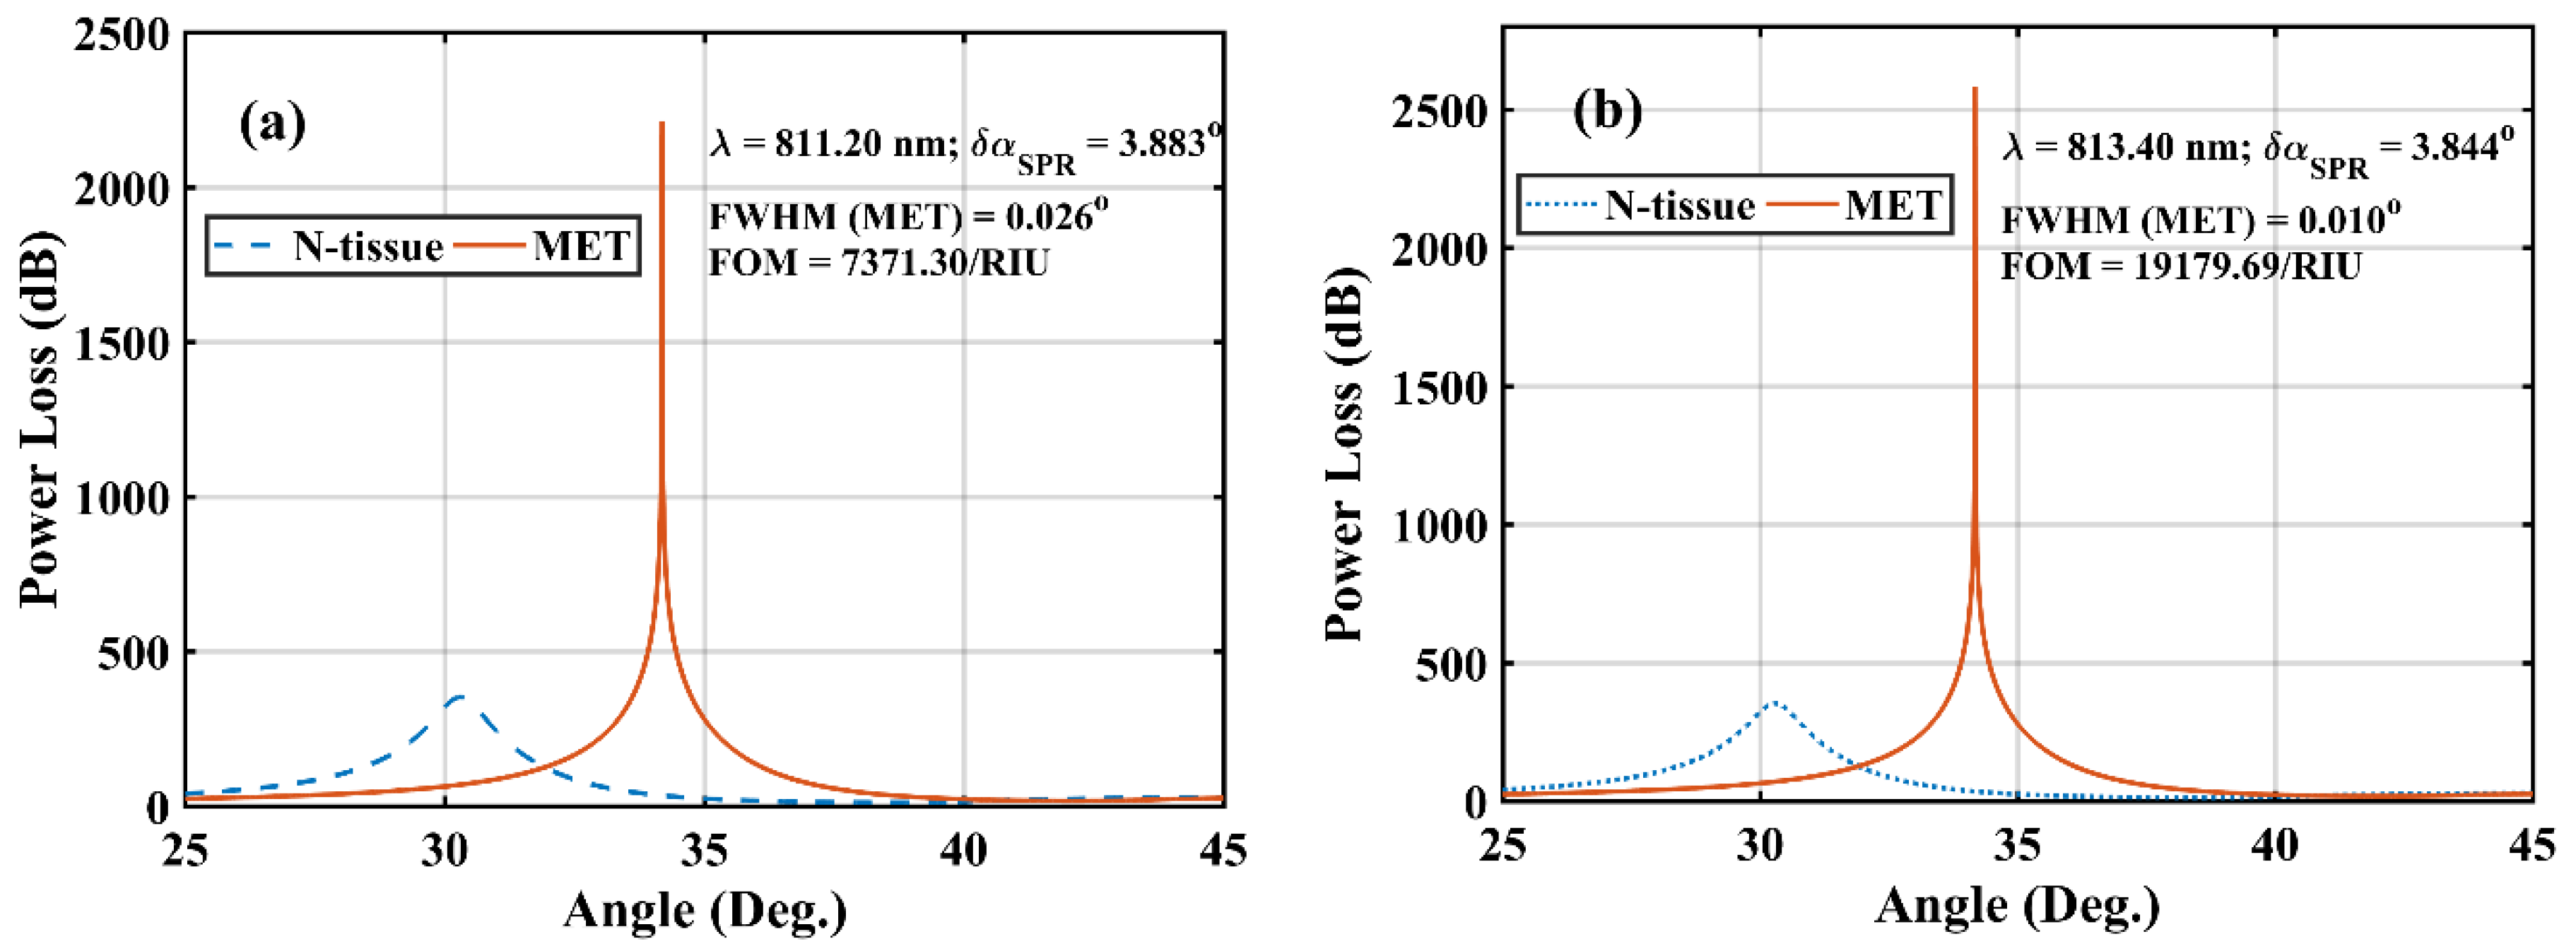
| 1 | BlueP/WS2 | 38.2 | 811.2 | 0.02026040 | 3.883 | 191.6547 | 0.026 | 7371.30 |
| 2 | BlueP/WS2 | 37.1 | 861.3 | 0.02004785 | 3.727 | 185.9052 | 0.026 | 7150.19 |
| 3 | BlueP/MoS2 | 38.2 | 813.4 | 0.02004203 | 3.844 | 191.7969 | 0.010 | 19,179.69 |
| 4 | BlueP/MoS2 | 36.4 | 894.7 | 0.01991865 | 3.649 | 183.1951 | 0.018 | 10,177.50 |
| Heterostructure | M-FOM (RIU−1) | λORD (µm) | RSF (µm−4) | PLR | FEF | C-FOM (µm4/RIU) |
|---|---|---|---|---|---|---|
| BlueP/MoS2 | 19,179.69 | 0.8134 | 2.284 | 7.317 | 1.14 | 70,046.01 |
| BlueP/WS2 | 7371.30 | 0.8112 | 2.301 | 6.263 | 1.14 | 22,871.63 |
| References | SPR Modalities | FOM (RIU−1) |
|---|---|---|
| Sharma and Kaur [22] | Samarium-doped fiber coated with 2D material | 6904.012 (graphene) 5897.082 (MoS2) |
| Sharma and Kaur [43] | Chalcogenide fiber sensor with polymer and 2D layer | 1647 (λ = 1200 nm) |
| Popescu et al. [44] | Bragg fiber with AS2S3 chalcogenide layer | 233.10 |
| Feng et al. [45] | Long range SPR on side-polished fiber with MgF2 layer | 156.19 |
| Bialiayeu et al. [46] | Tilted fiber Bragg gratings coated with silver nanowire | 3700 |
| Gazzaz and Berini [47] | Waveguide Bragg gratings supporting surface plasmons | 1000 |
| This work | Fluoride fiber coated with Ag layer (38.2 nm) and (BlueP/TMDs) heterostructure | 19,179.69 (BlueP/MoS2) 7371.30 (BlueP/WS2) |
© 2019 by the authors. Licensee MDPI, Basel, Switzerland. This article is an open access article distributed under the terms and conditions of the Creative Commons Attribution (CC BY) license (http://creativecommons.org/licenses/by/4.0/).
Share and Cite
Sharma, A.K.; Pandey, A.K.; Kaur, B. Fluoride Fiber-Based Plasmonic Biosensor with Two-Dimensional Material Heterostructures: Enhancement of Overall Figure-of-Merit via Optimization of Radiation Damping in Near Infrared Region. Materials 2019, 12, 1542. https://doi.org/10.3390/ma12091542
Sharma AK, Pandey AK, Kaur B. Fluoride Fiber-Based Plasmonic Biosensor with Two-Dimensional Material Heterostructures: Enhancement of Overall Figure-of-Merit via Optimization of Radiation Damping in Near Infrared Region. Materials. 2019; 12(9):1542. https://doi.org/10.3390/ma12091542
Chicago/Turabian StyleSharma, Anuj K., Ankit Kumar Pandey, and Baljinder Kaur. 2019. "Fluoride Fiber-Based Plasmonic Biosensor with Two-Dimensional Material Heterostructures: Enhancement of Overall Figure-of-Merit via Optimization of Radiation Damping in Near Infrared Region" Materials 12, no. 9: 1542. https://doi.org/10.3390/ma12091542