Characterization of Corrosion Behavior of CLF-1 in Liquid Lithium Using Calibration-Free Laser-Induced Breakdown Spectroscopy in Depth Profile Analysis

Abstract
:1. Introduction
2. Materials and Methods
2.1. Specimen Preparation
2.2. Corrosion Experiment
2.3. Device and Setup of LIBS
3. Results
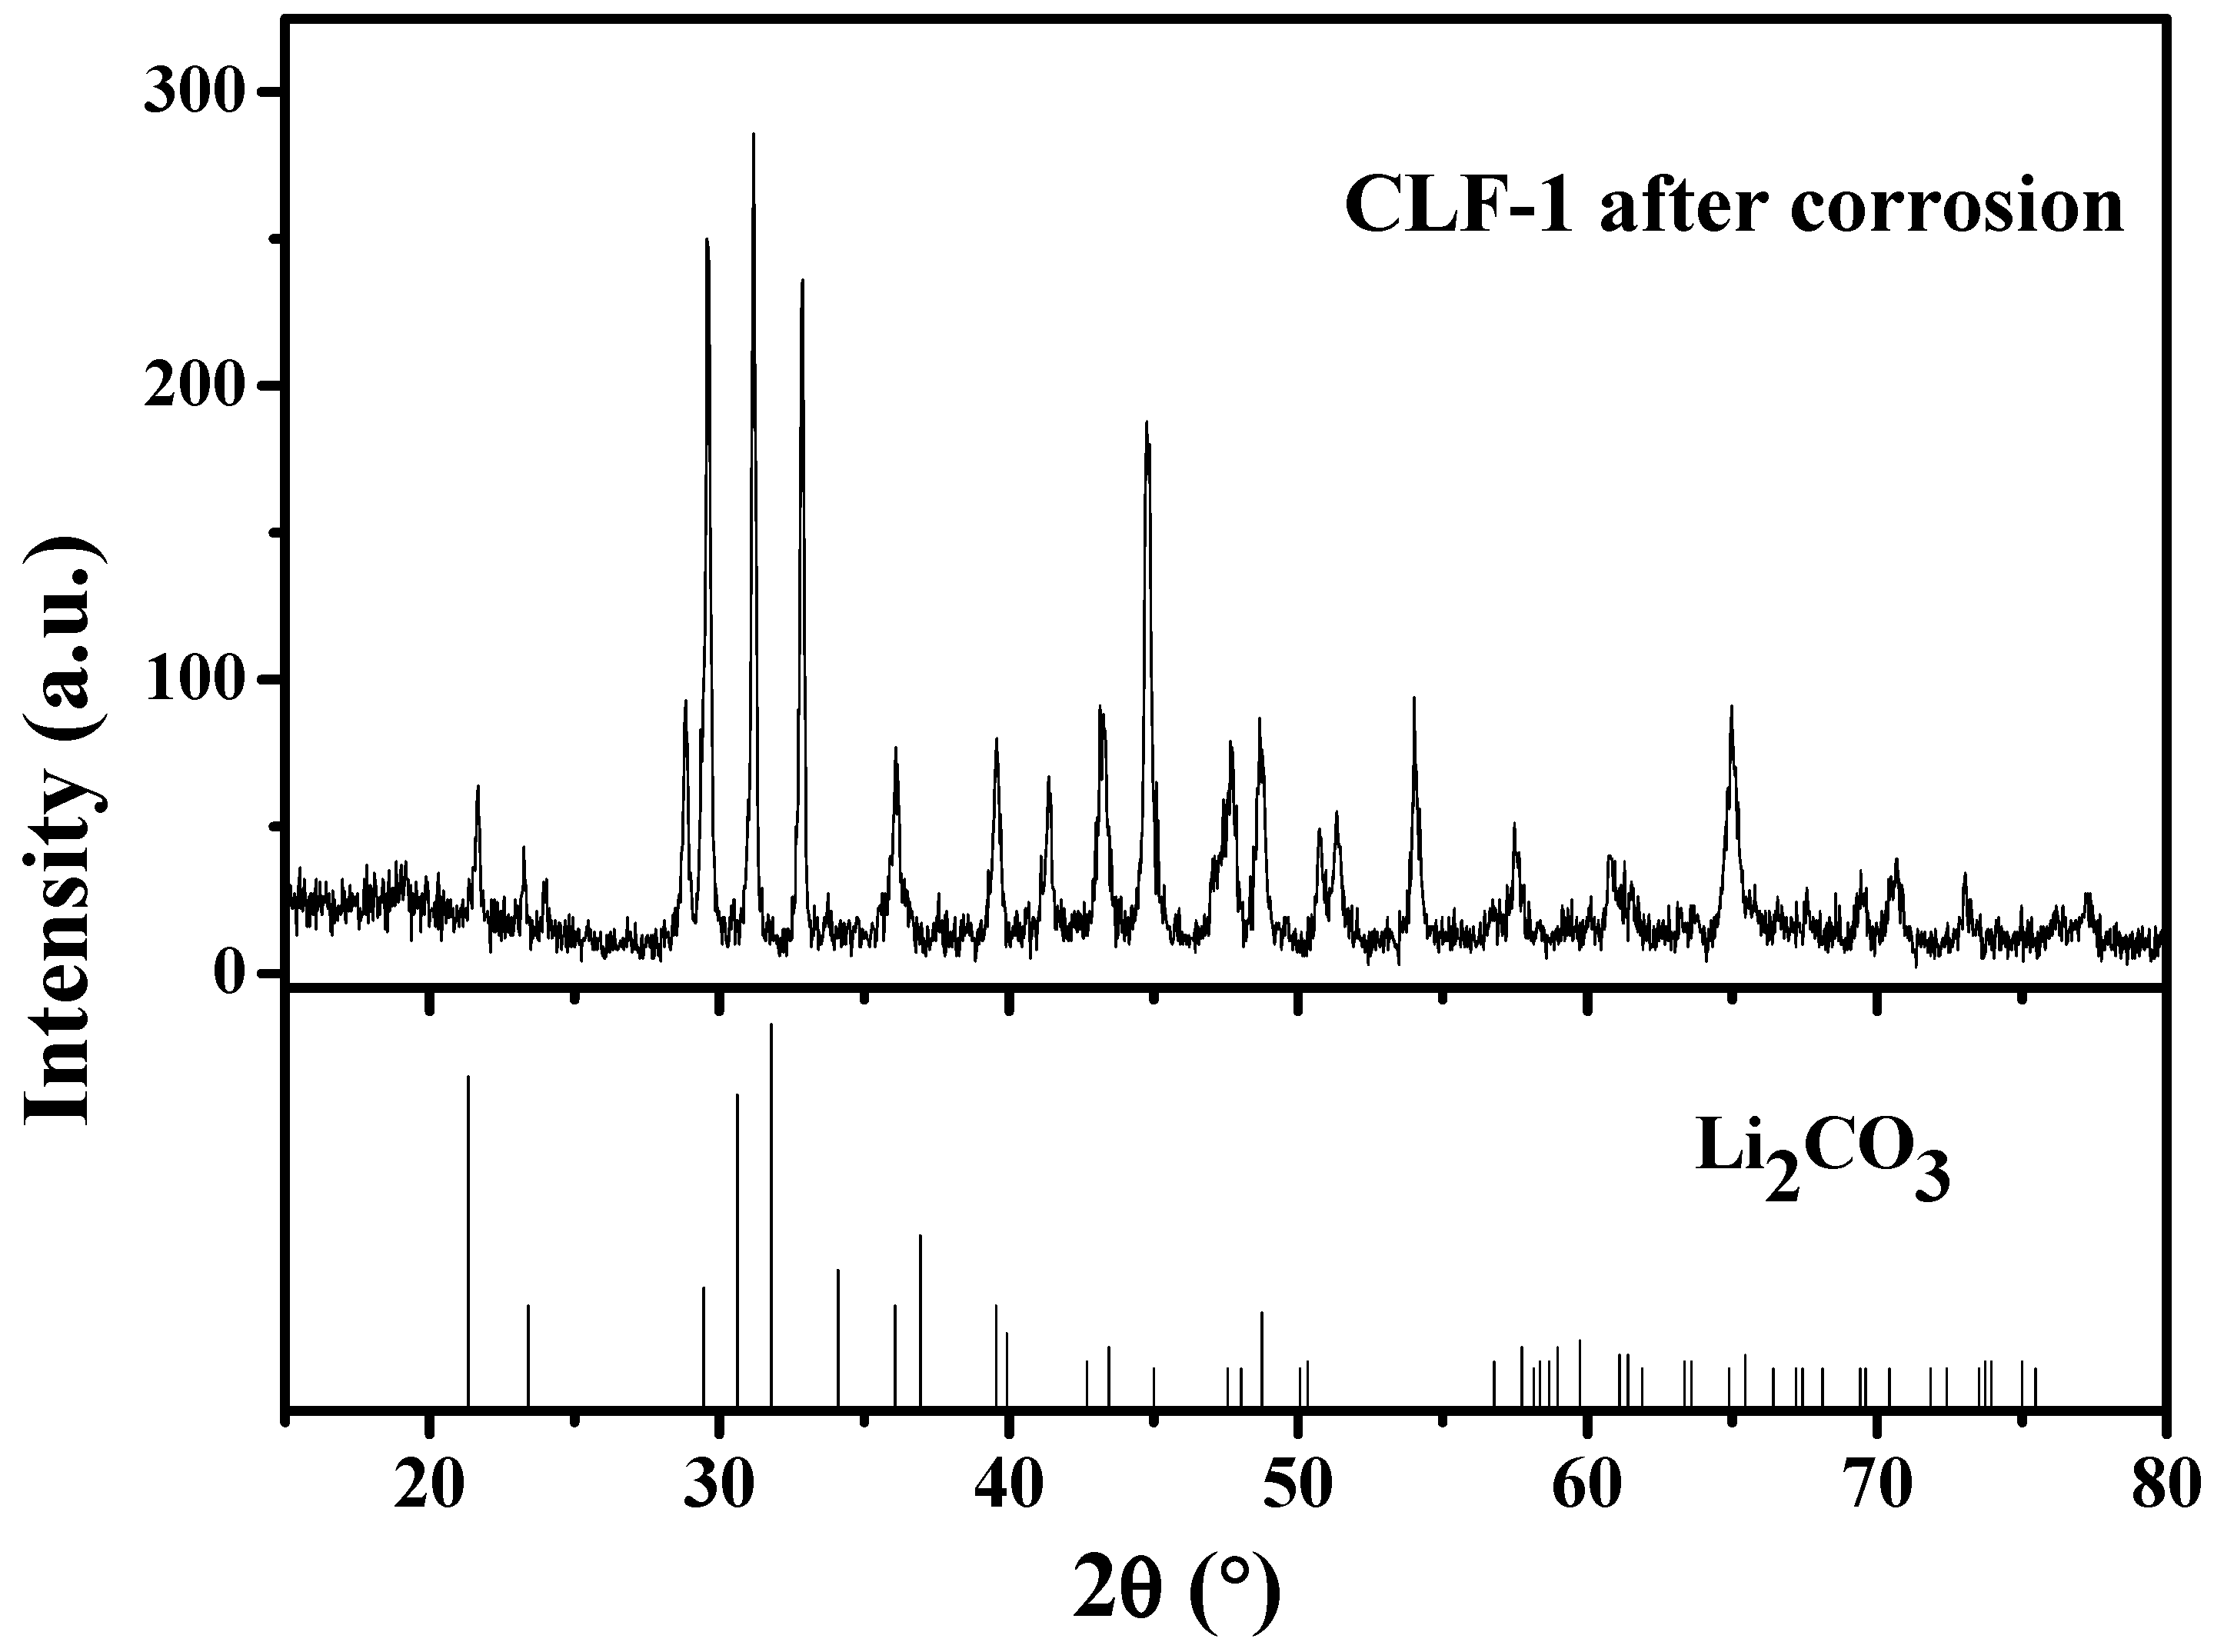
3.1. Microstructure
3.2. LIBS Spectra
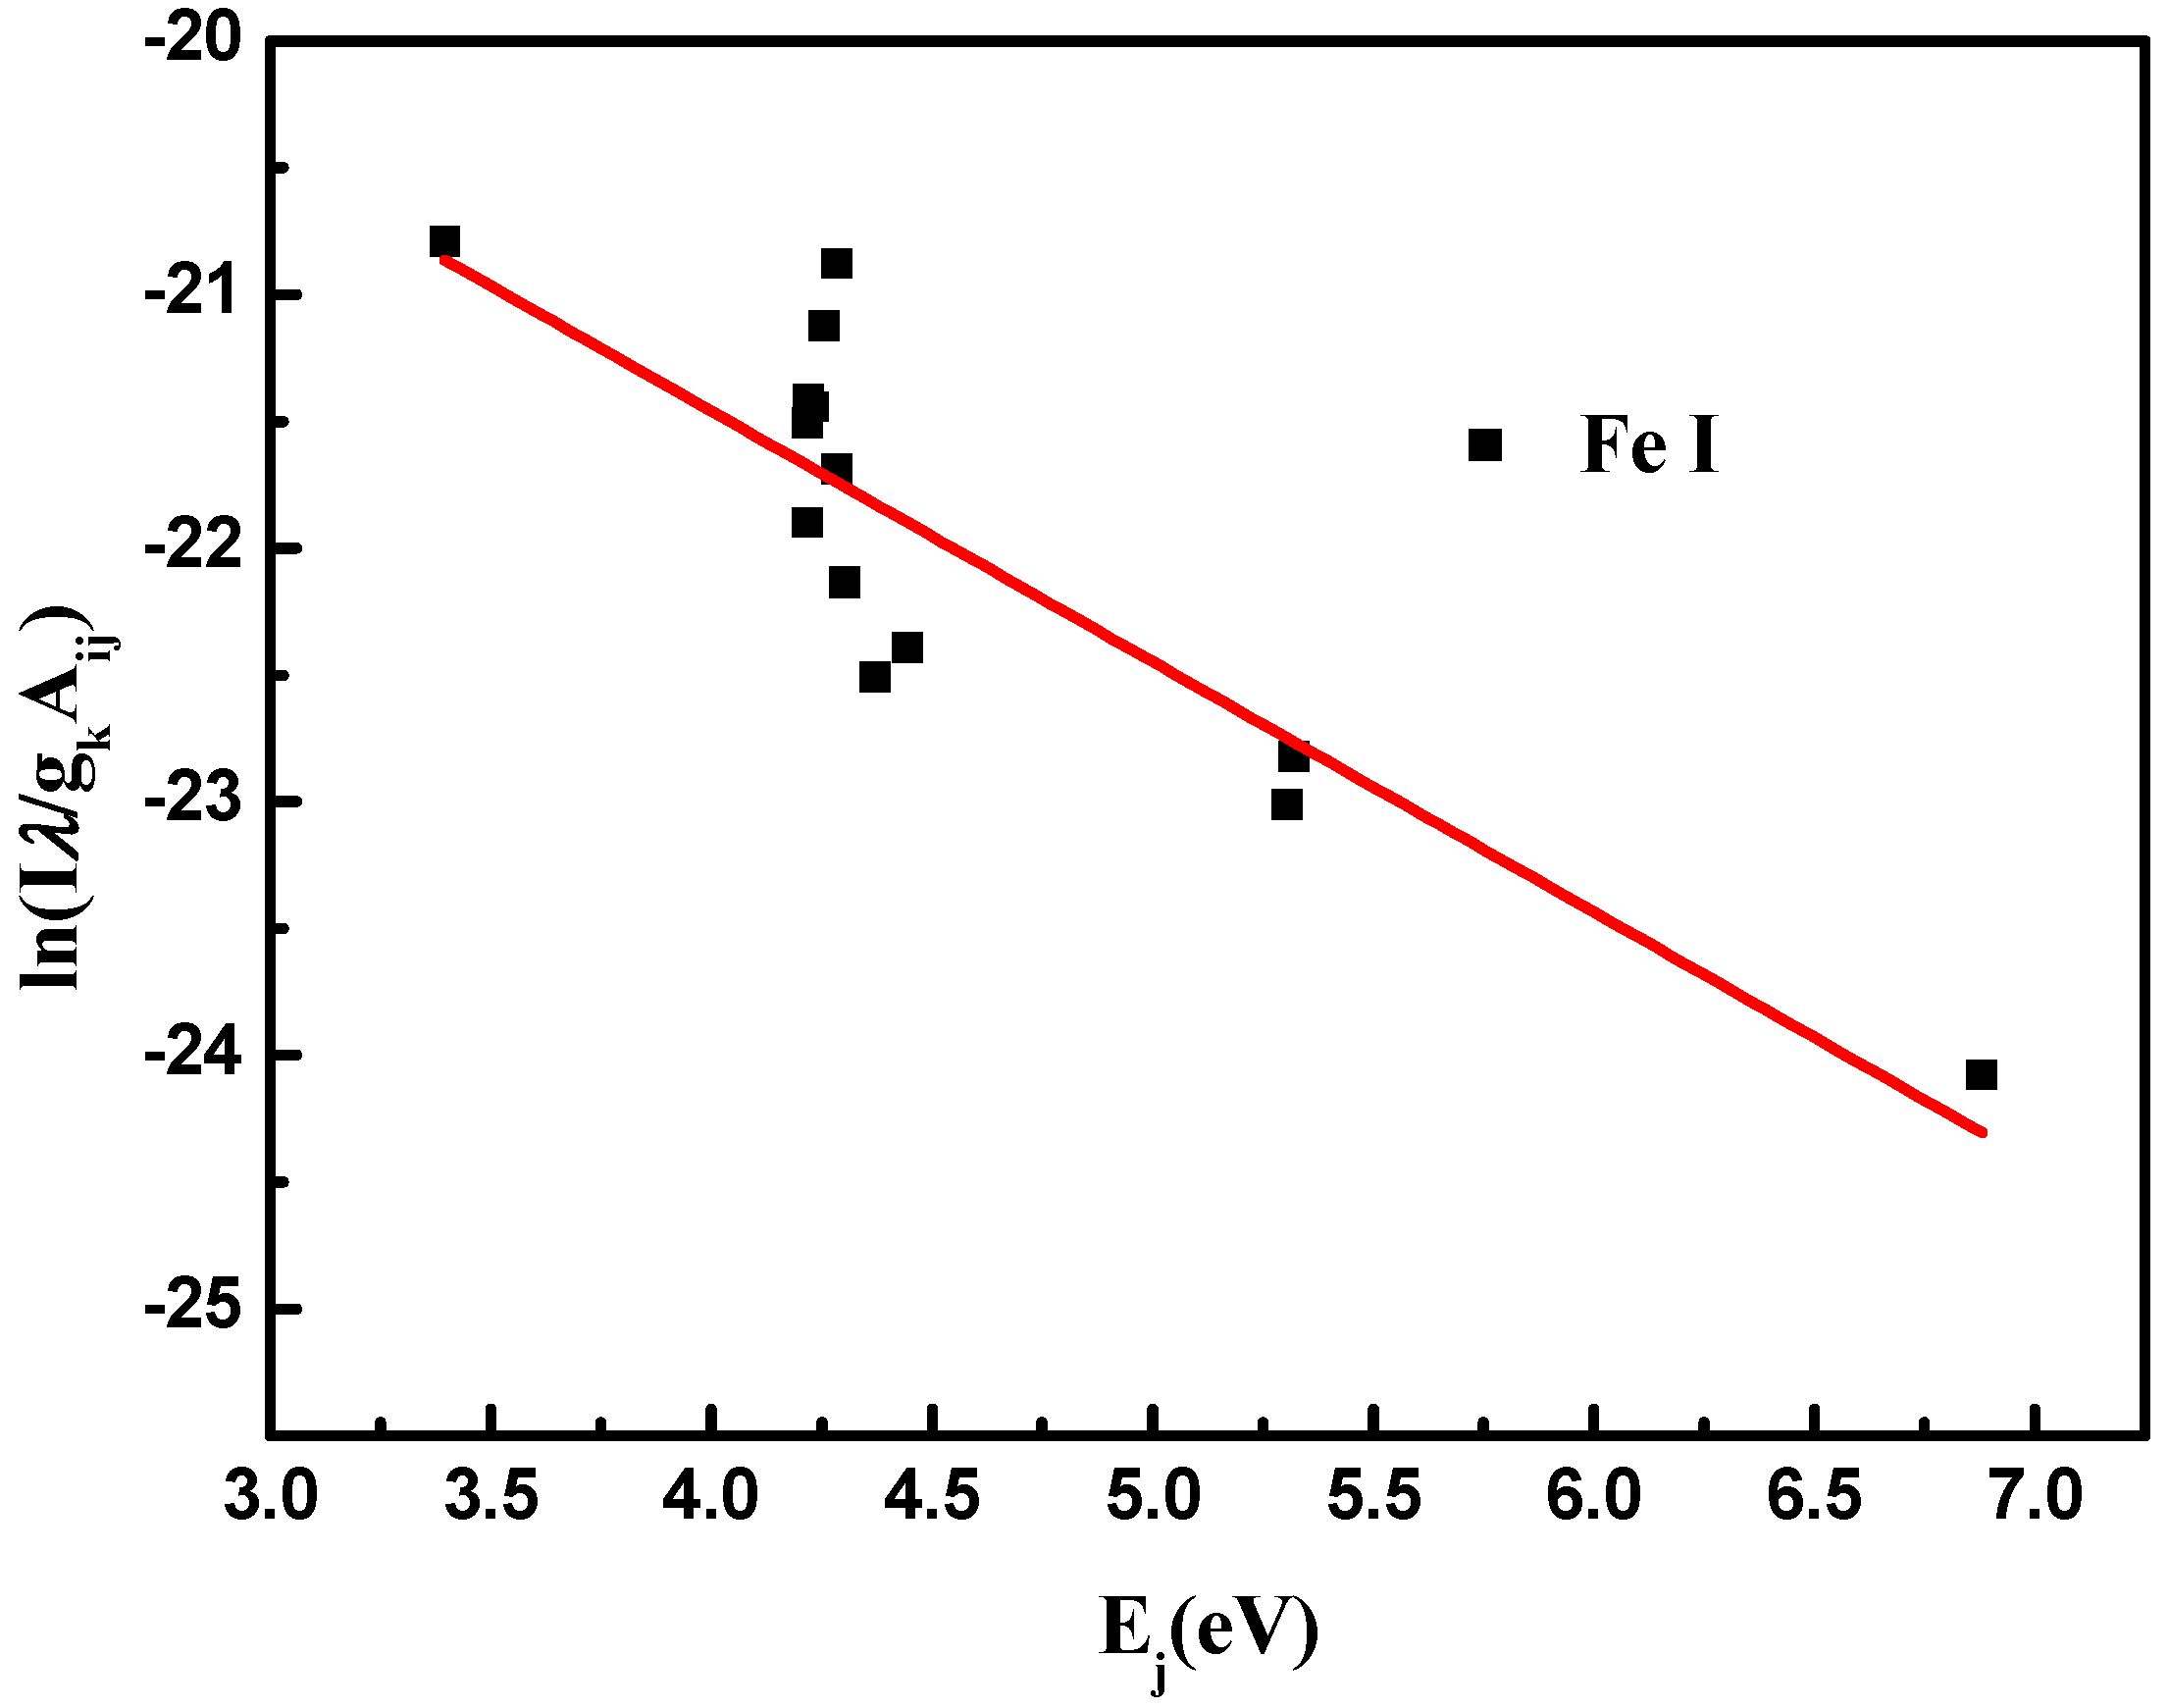
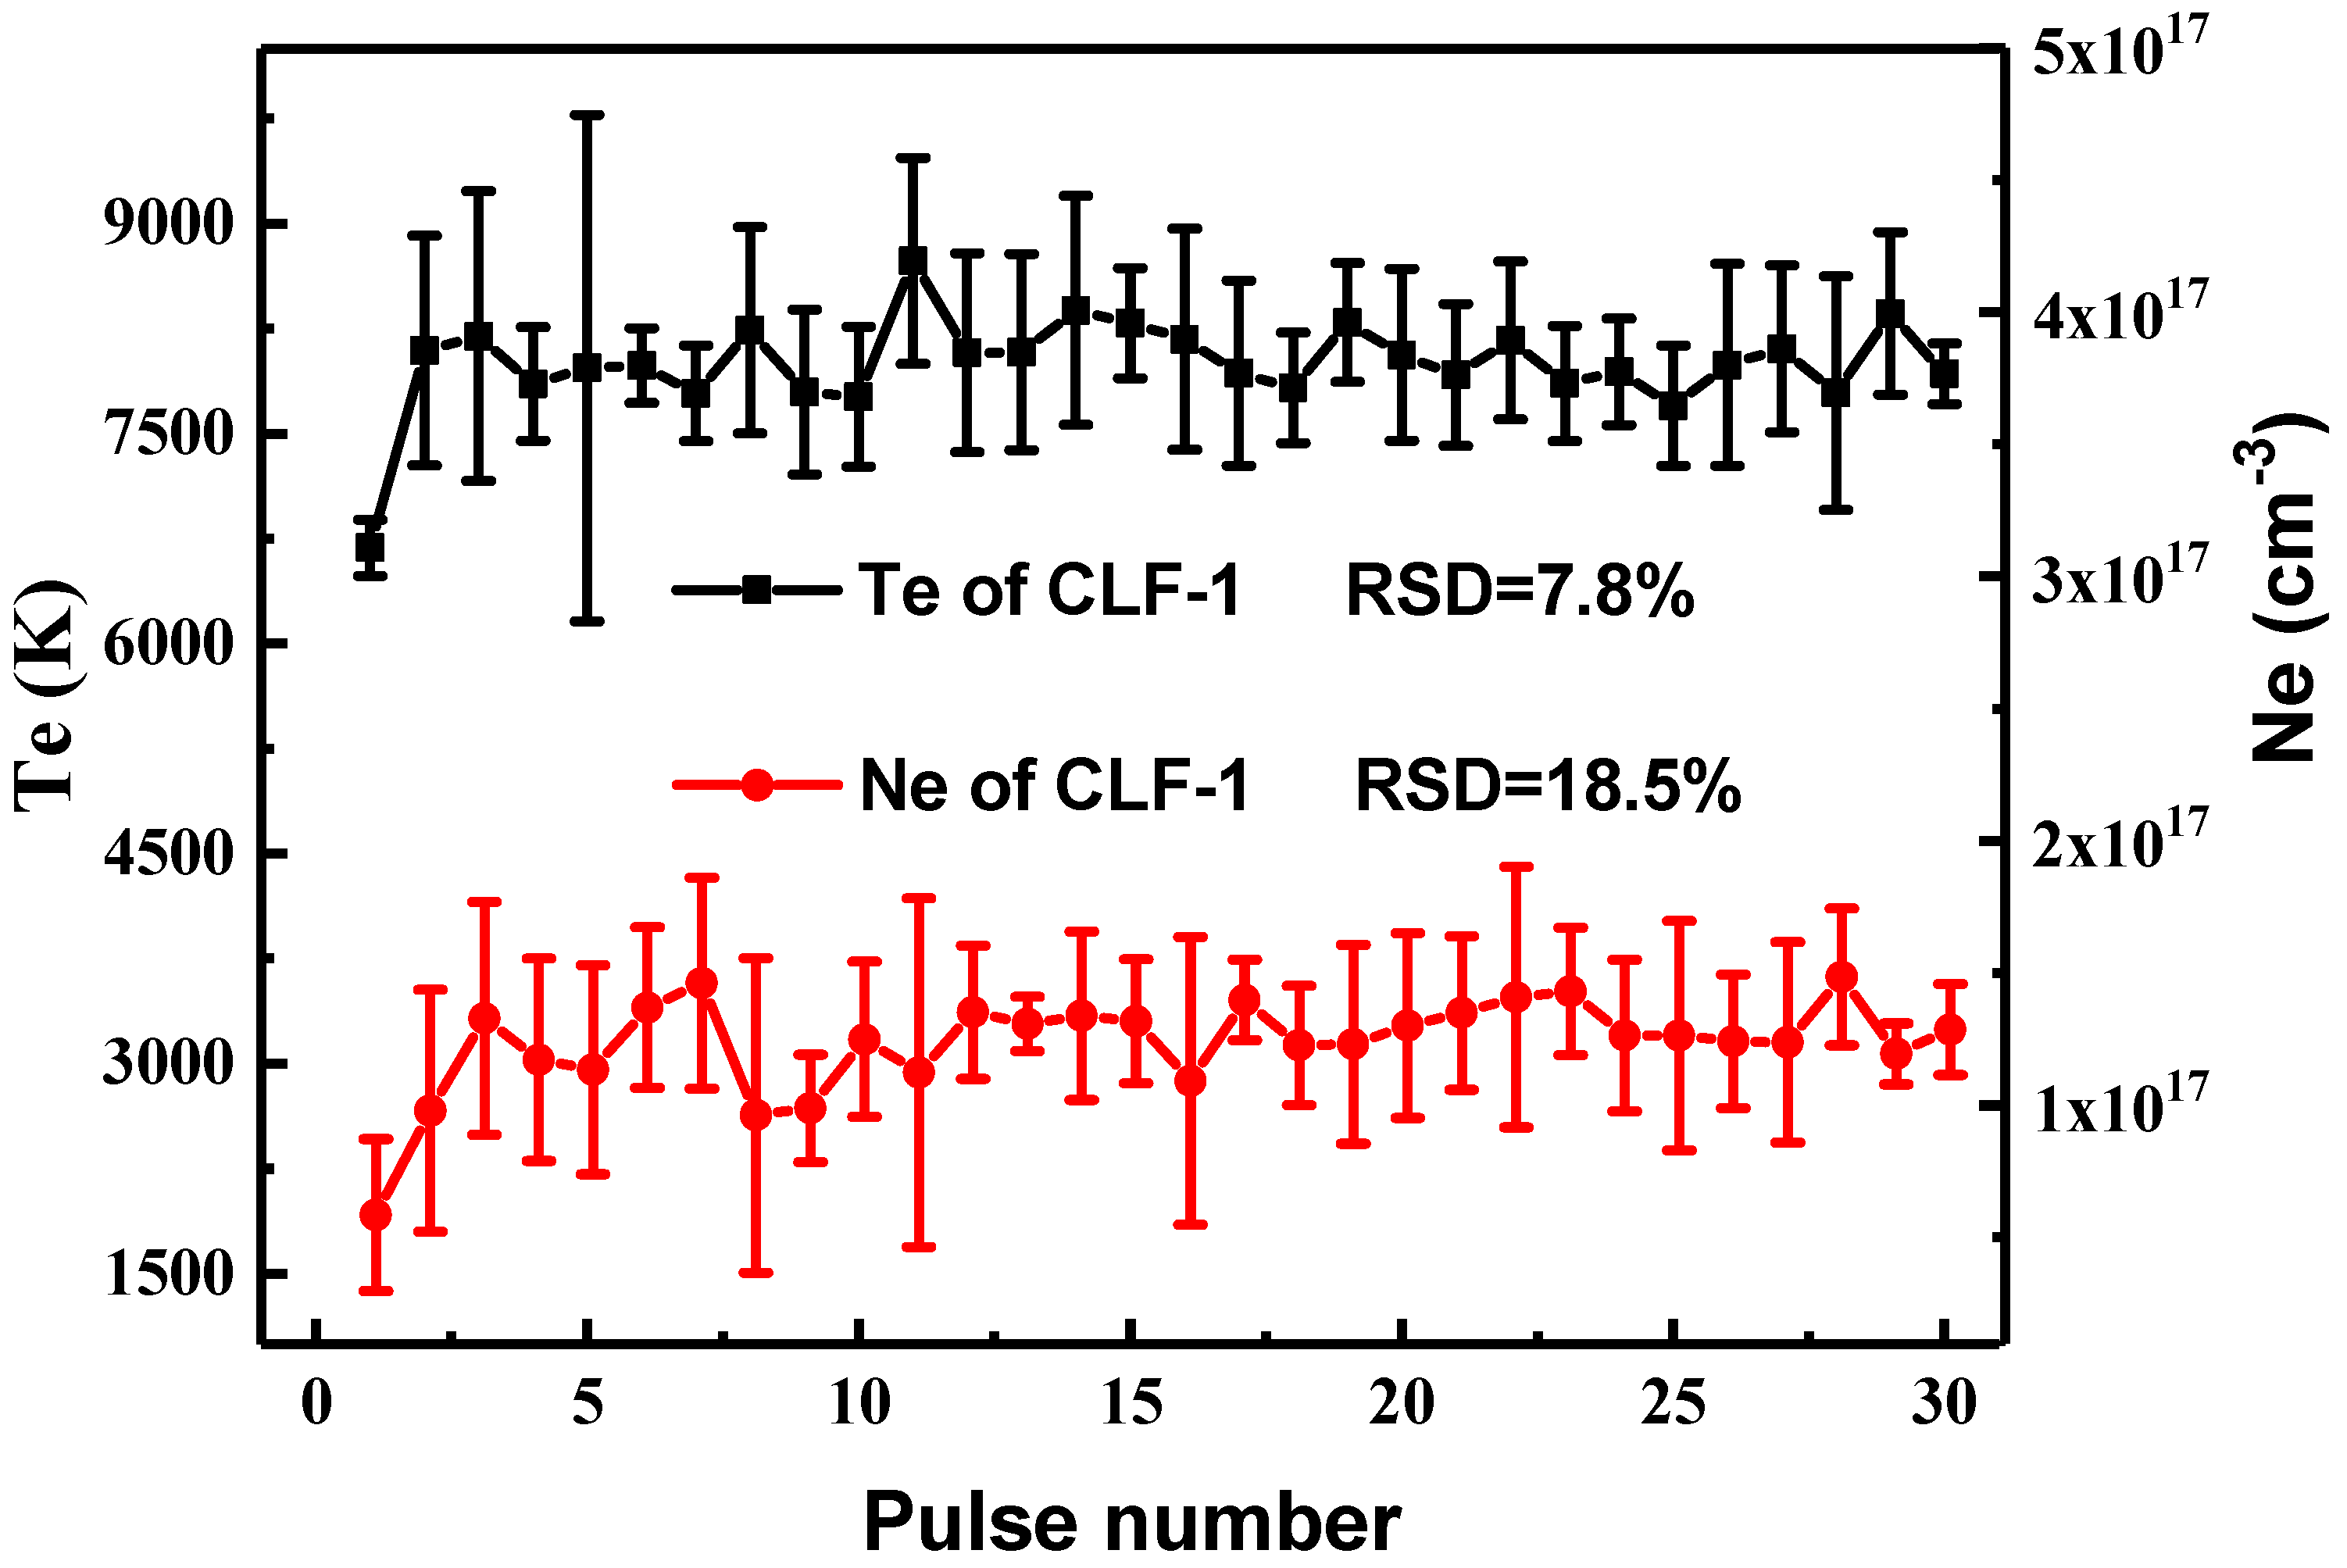
3.2.1. Evaluation of Local Thermodynamic Equilibrium and Matrix Effect
3.2.2. Chemical Depth Profile of CF-LIBS Results
4. Conclusions
Author Contributions
Funding
Acknowledgments
Conflicts of Interest
Appendix A

| Element (wt.%) | O | C | Cr | Fe | W | Mn | V |
|---|---|---|---|---|---|---|---|
| Light spot | 5.58 | 3.5 | 8.2 | 80.67 | 1.1 | 0.40 | 0.55 |
| Dark spot | 10.90 | 6.36 | 6.95 | 71.99 | 1.6 | - | 2.2 |
References
- Mansfield, D.K.; Hill, K.W.; Strachan, J.D. Enhancement of Tokamak Fusion Test Reactor performance by lithium conditioning. Phys. Plasmas 1996, 3, 1892–1897. [Google Scholar] [CrossRef]
- Wong, C.P.C.; Salavy, J.F.; Kim, Y.; Kirillov, I.; Rajendra Kumar, E.; Morley, N.B.; Tanaka, S.; Wu, Y.C. Overview of liquid metal TBM concepts and programs. Fusion Eng. Des. 2008, 83, 850–857. [Google Scholar] [CrossRef]
- Mansfield, D.K.; Johnson, D.W.; Grek, B.; Kugel, H.W.; Bell, M.G.; Bell, R.E.; Budny, R.V.; Busha, C.E.; Fredrickson, E.D.; Hill, K.W. Observations concerning the injection of a lithium aerosol into the edge of TFTR discharges. Nucl. Fusion 2000, 41, 1823–1834. [Google Scholar] [CrossRef]
- Yamaki, E.; Ginestar, K.; Martinelli, L. Dissolution mechanism of 316L in Lead-bismuth eutectic at 500 °C. Corros. Sci. 2011, 53, 3075–3085. [Google Scholar] [CrossRef]
- Muroga, T.; Gasparotto, M.; Zinkle, S.J. Overview of materials research for fusion reactors. Fusion Eng. Des. 2002, 61, 13–25. [Google Scholar] [CrossRef]
- Zhang, M.; Team, F.D.S. Corrosion experiment for CLAM and SS316L in liquid LiPb loop of China. Ann. Nucl. Energy 2015, 80, 203–206. [Google Scholar] [CrossRef]
- Wang, P.; Chen, J.; Fu, H.; Liu, S.; Li, X.; Xu, Z. Technical issues for the fabrication of a CN-HCCB-TBM based on RAFM steel CLF-1. Plasma Sci. Technol. 2013, 15, 133–136. [Google Scholar] [CrossRef]
- Oriani, R.A. Intergranular corrosion of steels and alloys. Mater. Sci. Eng. 1985, 73, 219. [Google Scholar] [CrossRef]
- Burakov, V.S.; Kiris, V.V.; Naumenkov, P.A.; Raikov, S.N. Calibration-free laser spectral analysis of glasses and copper alloys. J. Appl. Spectrosc. 2004, 71, 740–746. [Google Scholar] [CrossRef]
- Colao, F.; Fantoni, R.; Lazic, V.; Paolini, A.; Fabbri, F.; Ori, G.G.; Marinangeli, L.; Baliva, A. Investigation of LIBS feasibility for in situ planetary exploration: An analysis on Martian rock analogues. Planet. Space Sci. 2004, 52, 117–123. [Google Scholar] [CrossRef]
- Fantoni, R.; Almaviva, S.; Caneve, L.; Colao, F.; Popov, A.M.; Maddaluno, G. Development of calibration-free laser-induced-breakdown-spectroscopy based techniques for deposited layers diagnostics on ITER-like tiles. Spectrochim. Acta B 2013, 87, 153–160. [Google Scholar] [CrossRef]
- Thakur, S.N.; Singh, J.P. Fundamentals of Laser Induced Breakdown Spectroscopy. In Laser-Induced Breakdown Spectroscopy; Elsevier: Amsterdam, The Netherland, 2007; Chapter 1; pp. 3–21. [Google Scholar]
- Pandhija, S.; Rai, N.K.; Rai, A.K.; Thakur, S.N. Contaminant concentration in environmental samples using LIBS and CF-LIBS. Appl. Phys. B 2010, 98, 231–241. [Google Scholar] [CrossRef]
- Ciucci, A.; Corsi, M.; Palleschi, V.; Rastelli, S.; Salvetti, A.; Tognoni, E. New procedure for quantitative elemental analysis by laser-induced plasma spectroscopy. Appl. Spectrosc. 1999, 53, 960–964. [Google Scholar] [CrossRef]
- NIST Data Base. Available online: http://physics.nist.gov/PhysRefData/ASD/lines_form.html (accessed on 20 December 2019).
- Ma, Q.; Motto-Ros, V.; Lei, W.; Boueri, M.; Zheng, L.; Zeng, H.; Bar-Matthews, M.; Ayalon, A.; Panczer, G.; Yu, J. Multi-elemental mapping of a speleothem using laser-induced breakdown spectroscopy. Spectrochim. Acta B 2010, 65, 707–714. [Google Scholar] [CrossRef]
- Ng, C.W.; Ho, W.F.; Cheung, N.H. Spectrochemical analysis of liquids using laser-induced plasma emissions: Effects of laser wavelength on plasma properties. Appl. Spectrosc. 1997, 51, 967–983. [Google Scholar] [CrossRef]
- Cristoforetti, G.; DeGiacomo, A.; Dell’Aglio, M.; Legnaioli, S.; Tognoni, E.; Palleschi, V.; Omenetto, N. Local thermodynamic equilibrium in laser-induced breakdown spectroscopy: Beyond the McWhirter criterion. Spectrochim. Acta B 2010, 65, 86–95. [Google Scholar] [CrossRef]
- Nishijima, D.; Doerner, R.P.; Hollmann, E.M.; Miyamoto, M. Laser-induced breakdown spectroscopy thickness measurements of films thinner than ablation rate. Spectrochim. Acta B 2017, 136, 34–38. [Google Scholar] [CrossRef]
- Xu, T.; Zhang, Y.; Zhang, M.; He, Y.; Yu, Q.; Duan, Y. Temporal-resolved characterization of laser-induced plasma for spectrochemical analysis of gas shales. Spectrochim. Acta B 2016, 121, 28–37. [Google Scholar] [CrossRef]
- Sabsabi, M.; Cielo, P. Quantitative analysis of aluminum alloys by laser-induced breakdown spectroscopy and plasma characterization. Appl. Spectrosc. 1995, 49, 499–507. [Google Scholar] [CrossRef]
- Xu, T.; Liu, J.; Shi, Q.; He, Y.; Niu, G.; Duan, Y. Multi-elemental surface mapping and analysis of carbonaceous shale by laser-induced breakdown spectroscopy. Spectrochim. Acta B 2016, 115, 31–39. [Google Scholar] [CrossRef]
- Chopra, O.K.; Smith, D.L. Effects of lithium environment on the fatigue properties of ferritic and austenitic steels. J. Nucl. Mater. 1981, 103, 651–656. [Google Scholar] [CrossRef]
- Li, Y.; Ke, C.; Liu, X.; Gou, F.; Duan, X.; Zhao, Y. Compositional depth profiles of the type 316 stainless steel undergone the corrosion in liquid lithium using laser-induced breakdown spectroscopy. J. Nucl. Mater. 2017, 497, 1–9. [Google Scholar] [CrossRef]
- Xu, Q.; Kondo, M.; Nagasaka, T.; Muroga, T.; Nagura, M.; Suzuki, A. Compatibility of Reduced Activation Ferritic Steels with Liquid Lithium. Fusion Sci. Technol. 2007, 52, 609–612. [Google Scholar] [CrossRef] [Green Version]
- Leavenworth, H.W.; Cleary, R.E. The solubility of Ni, Cr, Fe, Ti and Mo in liquid lithium. Acta Met. 1961, 9, 519–520. [Google Scholar] [CrossRef]
- Eremenko, V.N.; Natanzon, Y.V. Kinetics of external dissolution of metals in metallic melts (Review). Sov. Powder Met. Met. Ceram. 1970, 9, 645–658. [Google Scholar] [CrossRef]
- Chakraborty, P.; Kain, V.; Pradhan, P.K.; Fotedar, R.K.; Krishnamurthy, N.; Dey, G.K. Corrosion of Indian RAFMS in Pb–17Li in a rotating disc corrosion test facility at 773 K. Fusion Eng. Des. 2015, 100, 181–189. [Google Scholar] [CrossRef]
- Chopra, O.K.; Smith, D.L. Compatibility of ferritic steels in forced circulation lithium and Pb-17Li systems. J. Nucl. Mater. 1988, 155, 715–721. [Google Scholar] [CrossRef]
- Atchutuni, S.S.; Agravat, H.S.; Chauhan, J.P. Corrosion behavior of IN-RAFM steel with stagnant lead-lithium at 550 °C up to 9000 h. Fusion Eng. Des. 2018, 135, 102–109. [Google Scholar] [CrossRef]
- Votinov, S.N.; Kolotushkin, V.P.; Lyublinskii, I.E.; Vertkov, A.V.; Nikulin, S.A.; Turilina, V.Y. Corrosion resistance of vanadium alloys clad by a ferrtic corrosion-resistant steel in liquid-metal heat-transfer agents. Russ. Metall. 2009, 1, 93–98. [Google Scholar] [CrossRef]


| Sample | Cr | Mn | C | W | V | Ta | N | Fe |
|---|---|---|---|---|---|---|---|---|
| CLF-1 | 8.5 | 0.5 | 0.11 | 1.5 | 0.26 | 0.1 | 0.03 | Balance |
| Species | Wavelength (nm) | Aij (s−1) | gk | Ei (eV) | Ej (eV) |
|---|---|---|---|---|---|
| Fe I | 277.390 | 9.36 × 10⁷ | 9 | 2.4534 | 6.8744 |
| 281.329 | 3.42 × 10⁷ | 11 | 0.9146 | 5.3204 | |
| 360.886 | 8.13 × 10⁷ | 5 | 1.0111 | 4.4456 | |
| 363.146 | 5.17 × 10⁷ | 9 | 0.9582 | 4.3714 | |
| 370.557 | 3.21 × 10⁶ | 7 | 0.0516 | 3.3965 | |
| 372.762 | 2.24 × 10⁷ | 5 | 0.9582 | 4.2833 | |
| 376.719 | 6.39 × 10⁷ | 3 | 1.0111 | 4.3013 | |
| 378.788 | 1.29 × 10⁷ | 5 | 1.0111 | 4.2833 | |
| 379.500 | 1.15 × 10⁷ | 7 | 0.9901 | 4.2562 | |
| 425.079 | 1.02 × 10⁷ | 7 | 1.5574 | 4.4733 | |
| 426.047 | 3.99 × 10⁷ | 11 | 2.3992 | 5.3085 | |
| 427.176 | 2.28 × 10⁷ | 11 | 1.4849 | 4.3865 | |
| 430.790 | 3.38 × 10⁷ | 9 | 1.5574 | 4.4346 | |
| 438.354 | 5.00 × 10⁷ | 11 | 1.4849 | 4.3125 | |
| 440.475 | 2.75 × 10⁷ | 9 | 1.5574 | 4.3714 |
| Species | Wavelength (nm) | Aij (s−1) | gk | Ei (eV) | Ej (eV) |
|---|---|---|---|---|---|
| V I | 250.330 | 4.40 × 10⁷ | 4 | 0.0000 | 4.9513 |
| 306.638 | 2.10 × 10⁸ | 12 | 0.0685 | 3.9597 | |
| 318.398 | 2.50 × 10⁸ | 5 | 0.0000 | 3.1758 | |
| 438.472 | 1.10 × 10⁸ | 8 | 0.0000 | 3.0751 | |
| V II | 250.622 | 9.72 × 10⁷ | 9 | 1.0962 | 6.0418 |
| 309.310 | 2.00 × 10⁸ | 13 | 0.3921 | 4.3994 | |
| W I | 386.798 | 4.60 × 10⁶ | 3 | 0.0000 | 3.8807 |
| 429.460 | 1.24 × 10⁷ | 3 | 0.0000 | 3.2633 | |
| Mn I | 279.480 | 3.70 × 10⁸ | 58 | 0.0000 | 4.4349 |
| 403.076 | 1.65 × 10⁷ | 6 | 0.0000 | 3.0751 | |
| 403.307 | 1.58 × 10⁷ | 4 | 0.0000 | 3.0733 | |
| 403.450 | 1.58 × 10⁷ | 4 | 0.0000 | 3.0722 | |
| 404.141 | 7.87 × 10⁷ | 10 | 2.1142 | 5.1812 | |
| Mn II | 257.615 | 2.80 × 10⁸ | 9 | 0.0000 | 4.8114 |
| 294.928 | 1.96 × 10⁸ | 7 | 1.1745 | 5.3772 | |
| 348.870 | 2.11 × 10⁷ | 3 | 1.8475 | 5.4004 | |
| Cr I | 425.440 | 3.15 × 10⁷ | 9 | 0.0000 | 2.9134 |
| 427.480 | 3.07 × 10⁷ | 7 | 0.0000 | 2.8995 | |
| 428.970 | 3.16 × 10⁷ | 5 | 0.0000 | 2.8894 | |
| 520.450 | 5.09 × 10⁷ | 3 | 0.9414 | 3.3230 | |
| 520.602 | 5.14 × 10⁷ | 5 | 0.9414 | 3.3223 | |
| 520.841 | 5.06 × 10⁷ | 7 | 0.9414 | 3.3212 | |
| Cr II | 284.980 | 9.20 × 10⁷ | 8 | 1.5100 | 5.8622 |
| 286.090 | 6.90 × 10⁷ | 4 | 1.4800 | 5.8245 | |
| 286.263 | 6.30 × 10⁷ | 8 | 1.5300 | 5.8683 | |
| 286.671 | 1.20 × 10⁸ | 4 | 1.4918 | 5.8154 | |
| 311.865 | 1.70 × 10⁸ | 4 | 2.4211 | 6.3956 | |
| 312.041 | 1.50 × 10⁸ | 6 | 2.4339 | 6.4061 | |
| Li I | 610.354 | 5.71 × 10⁷ | 4 | 1.8478 | 3.8786 |
| 670.776 | 1.47 × 10⁸ | 4 | 0.0000 | 1.8478 | |
| Fe I | 360.886 | 8.13 × 10⁷ | 5 | 1.0111 | 4.4456 |
| 363.146 | 5.17 × 10⁷ | 9 | 0.9582 | 4.3714 | |
| 370.557 | 3.21 × 10⁶ | 7 | 0.0516 | 3.3965 | |
| 372.762 | 2.24 × 10⁷ | 5 | 0.9582 | 4.2833 | |
| 376.719 | 6.39 × 10⁷ | 3 | 1.0111 | 4.3013 | |
| 378.788 | 1.29 × 10⁷ | 5 | 1.0111 | 4.2833 | |
| 379.500 | 1.15 × 10⁷ | 7 | 0.9901 | 4.2562 | |
| 400.524 | 2.04 × 10⁷ | 5 | 1.5574 | 4.6520 | |
| 404.581 | 8.62 × 10⁷ | 9 | 1.4849 | 4.5485 | |
| 407.174 | 7.64 × 10⁷ | 5 | 1.6079 | 4.6520 | |
| 425.079 | 1.02 × 10⁷ | 7 | 1.5574 | 4.4733 | |
| 426.047 | 3.99 × 10⁷ | 11 | 2.3992 | 5.3085 | |
| 427.176 | 2.28 × 10⁷ | 11 | 1.4849 | 4.3865 | |
| 430.790 | 3.38 × 10⁷ | 9 | 1.5574 | 4.4346 | |
| 438.354 | 5.00 × 10⁷ | 11 | 1.4849 | 4.3125 | |
| 440.475 | 2.75 × 10⁷ | 9 | 1.5574 | 4.3714 | |
| Fe II | 261.187 | 1.20 × 10⁸ | 8 | 0.0477 | 4.7932 |
| 261.382 | 2.12 × 10⁸ | 2 | 0.1069 | 4.8489 | |
| 262.166 | 5.60 × 10⁷ | 2 | 0.1211 | 4.8489 | |
| 262.566 | 3.52 × 10⁷ | 10 | 0.0477 | 4.7683 | |
| 262.829 | 8.74 × 10⁷ | 4 | 0.1211 | 4.8370 | |
| 263.104 | 8.16 × 10⁷ | 6 | 0.1069 | 4.8178 | |
| 266.466 | 1.91 × 10⁸ | 10 | 3.3866 | 8.0381 | |
| 268.475 | 1.57 × 10⁸ | 10 | 3.8143 | 8.4310 | |
| 298.554 | 2.39 × 10⁷ | 4 | 1.7239 | 5.8755 |
© 2020 by the authors. Licensee MDPI, Basel, Switzerland. This article is an open access article distributed under the terms and conditions of the Creative Commons Attribution (CC BY) license (http://creativecommons.org/licenses/by/4.0/).
Share and Cite
Cao, Z.; An, Y.; Wang, X.; Chen, C.; Li, Y. Characterization of Corrosion Behavior of CLF-1 in Liquid Lithium Using Calibration-Free Laser-Induced Breakdown Spectroscopy in Depth Profile Analysis. Materials 2020, 13, 240. https://doi.org/10.3390/ma13010240
Cao Z, An Y, Wang X, Chen C, Li Y. Characterization of Corrosion Behavior of CLF-1 in Liquid Lithium Using Calibration-Free Laser-Induced Breakdown Spectroscopy in Depth Profile Analysis. Materials. 2020; 13(1):240. https://doi.org/10.3390/ma13010240
Chicago/Turabian StyleCao, Zhi, Yongtao An, Xianglin Wang, Chang’an Chen, and Ying Li. 2020. "Characterization of Corrosion Behavior of CLF-1 in Liquid Lithium Using Calibration-Free Laser-Induced Breakdown Spectroscopy in Depth Profile Analysis" Materials 13, no. 1: 240. https://doi.org/10.3390/ma13010240