Impact of Surface Treatment on the Functional Properties Stainless Steel for Biomedical Applications

 , , , , ,
Abstract
:1. Introduction
2. Materials and Methods
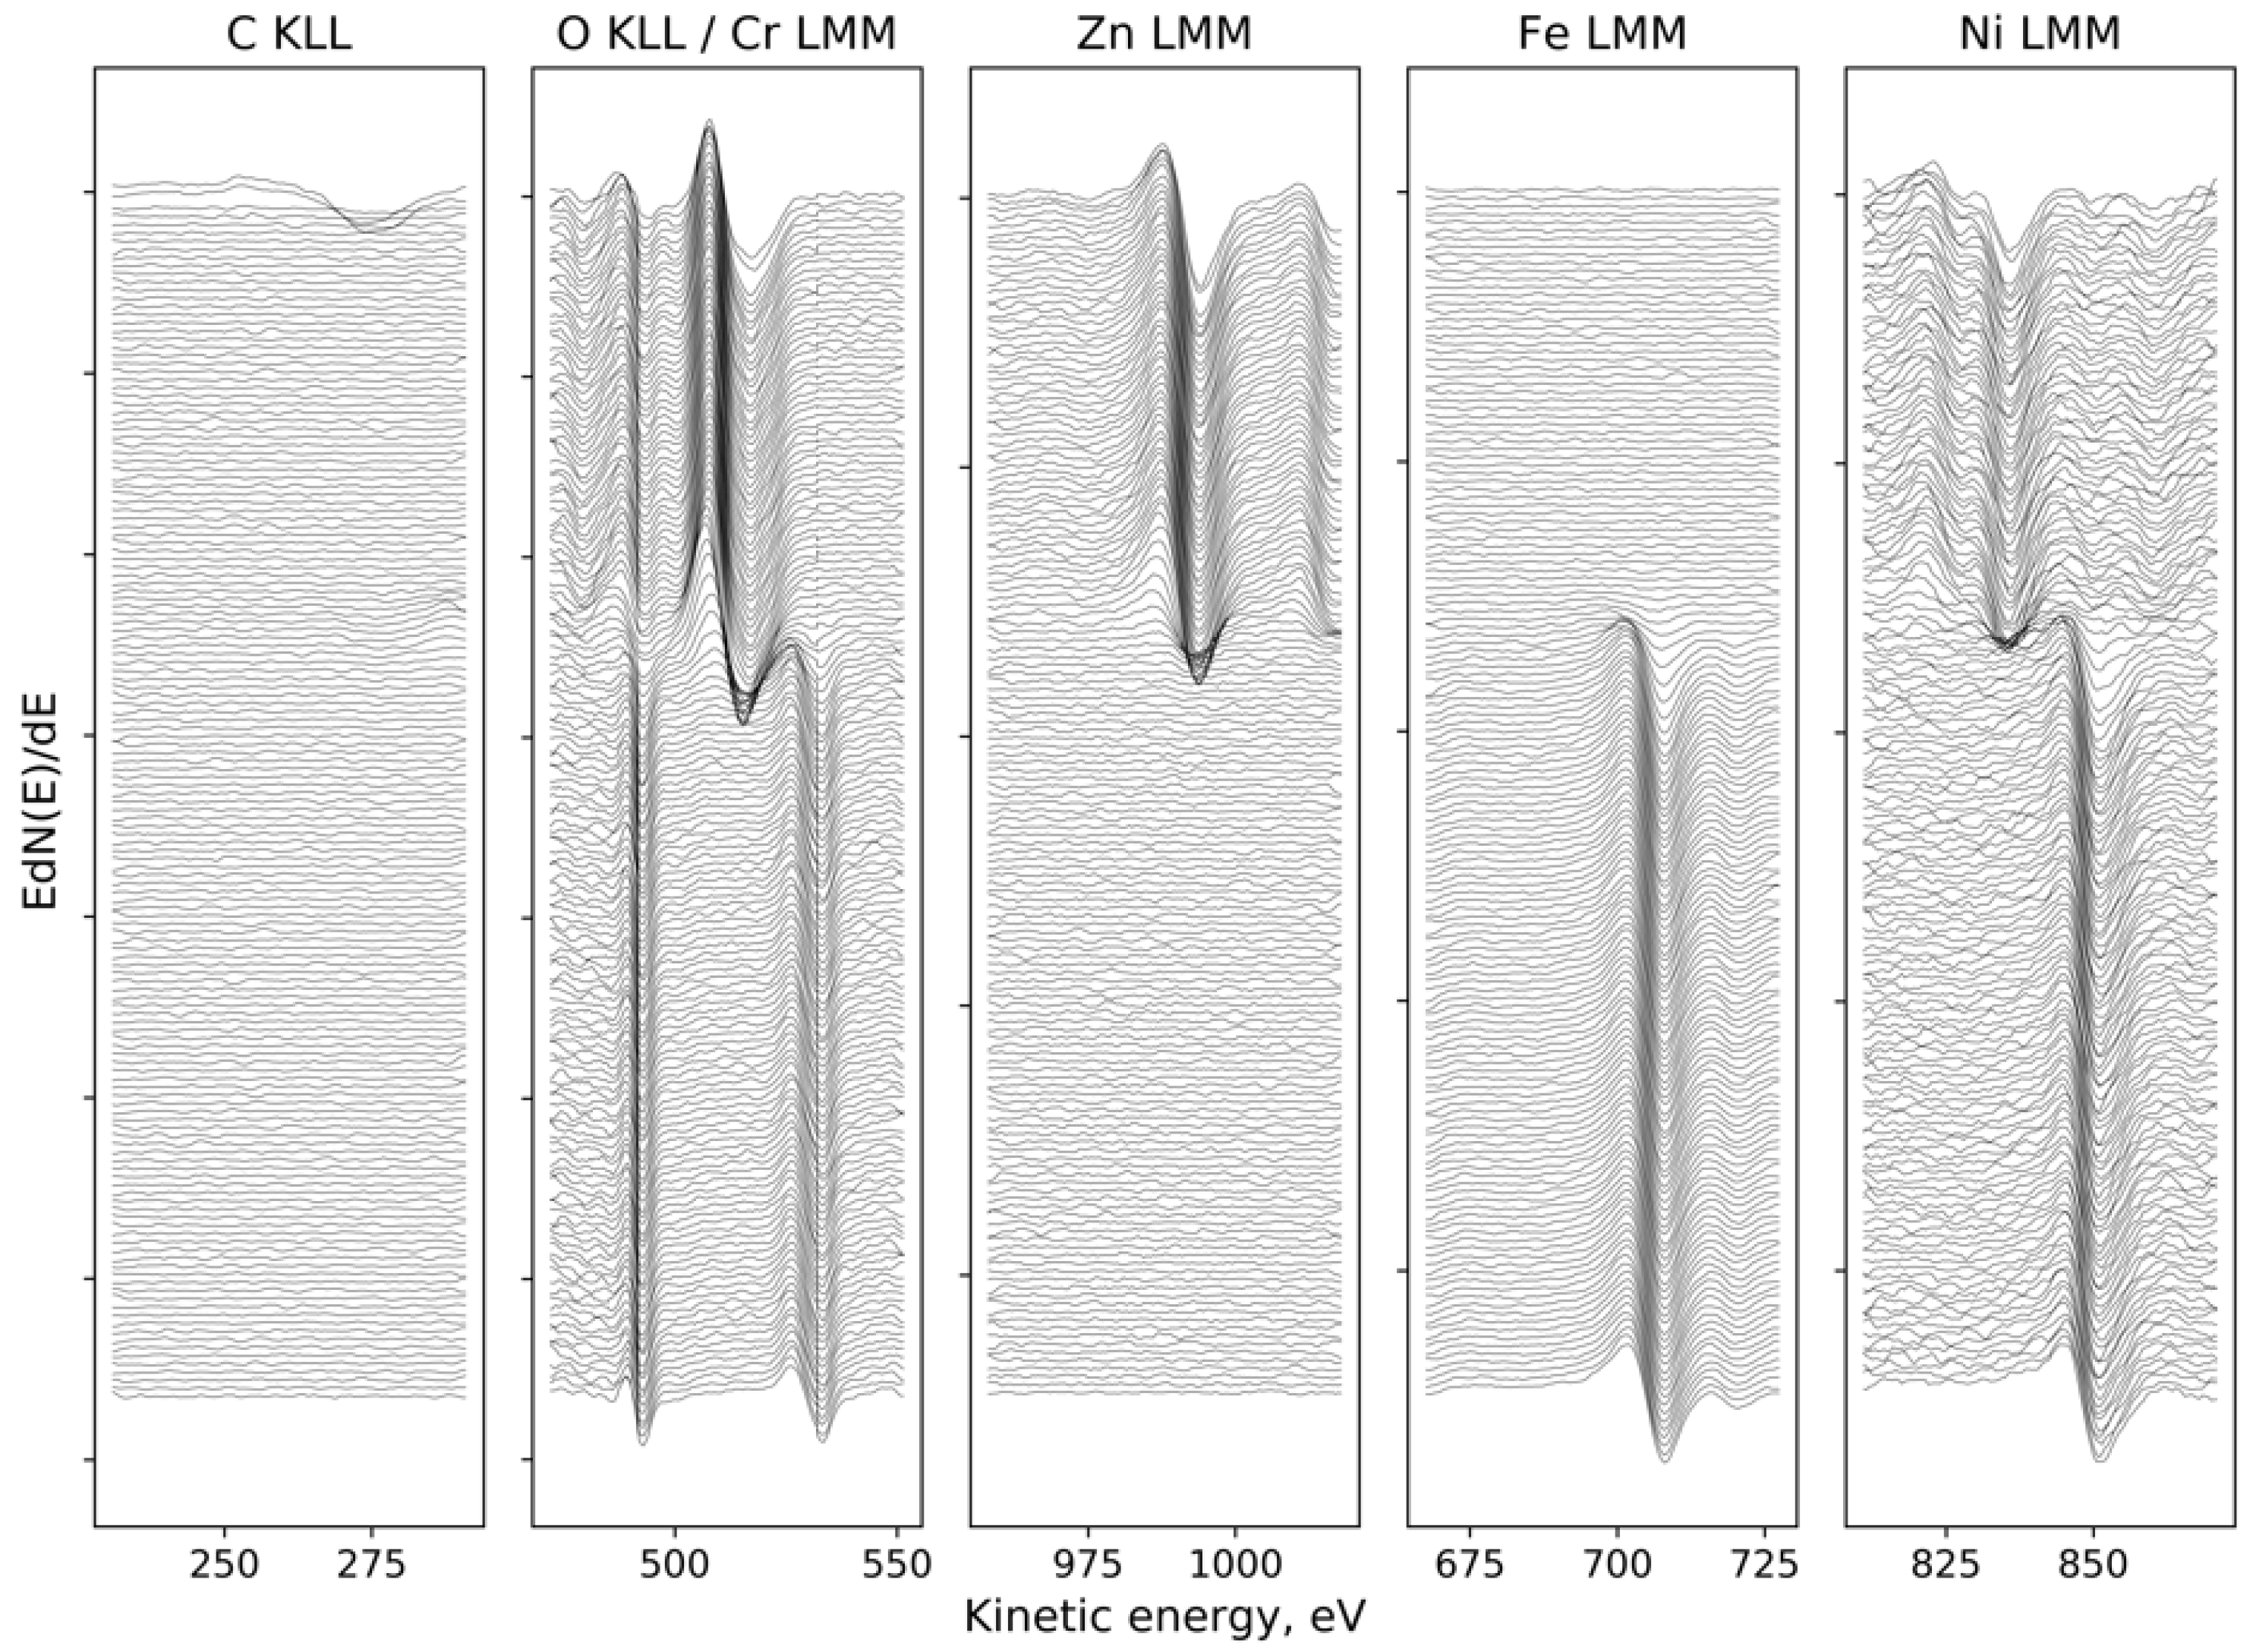
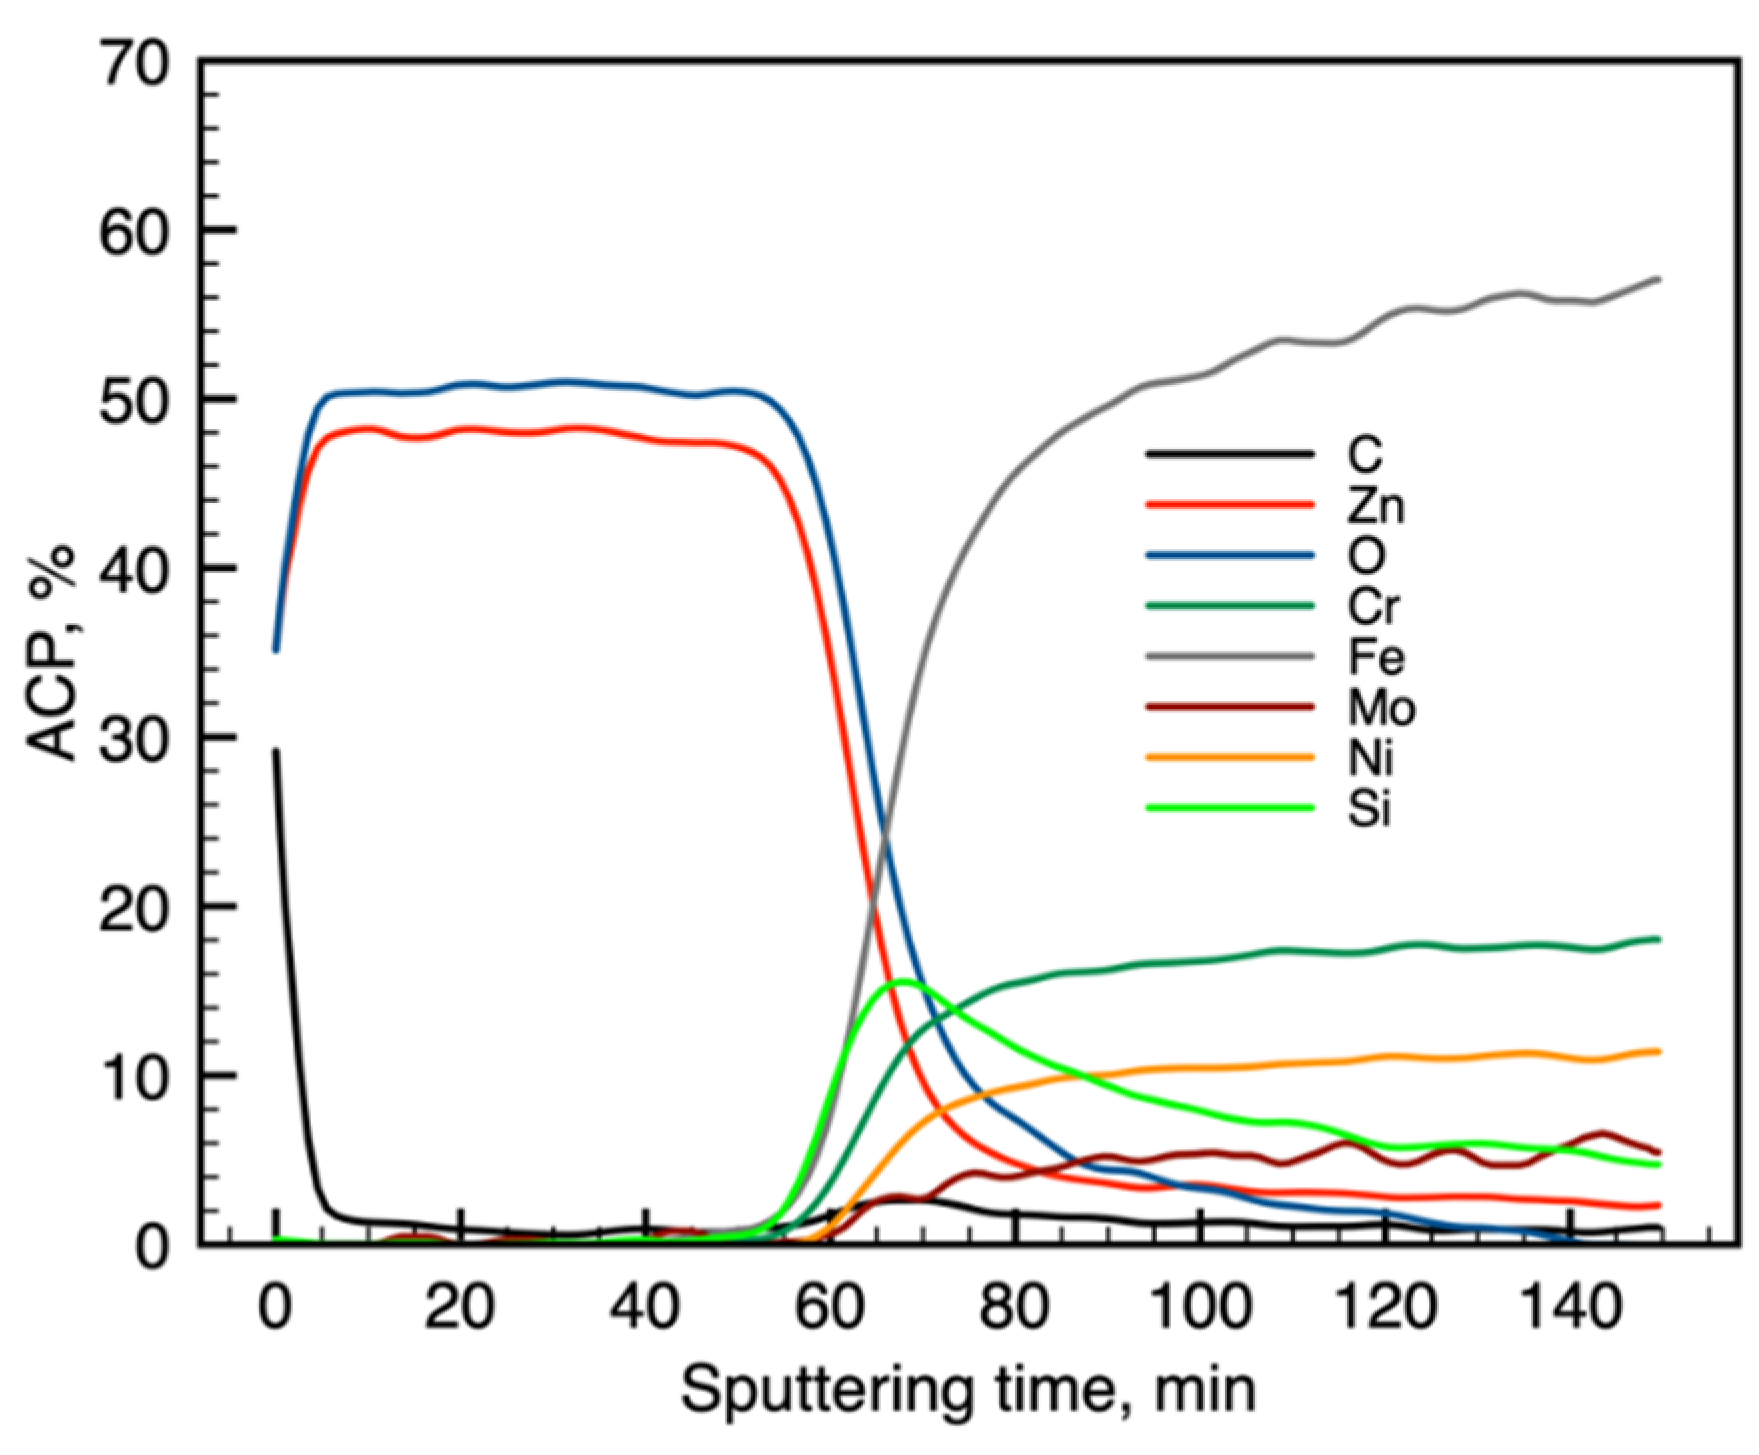
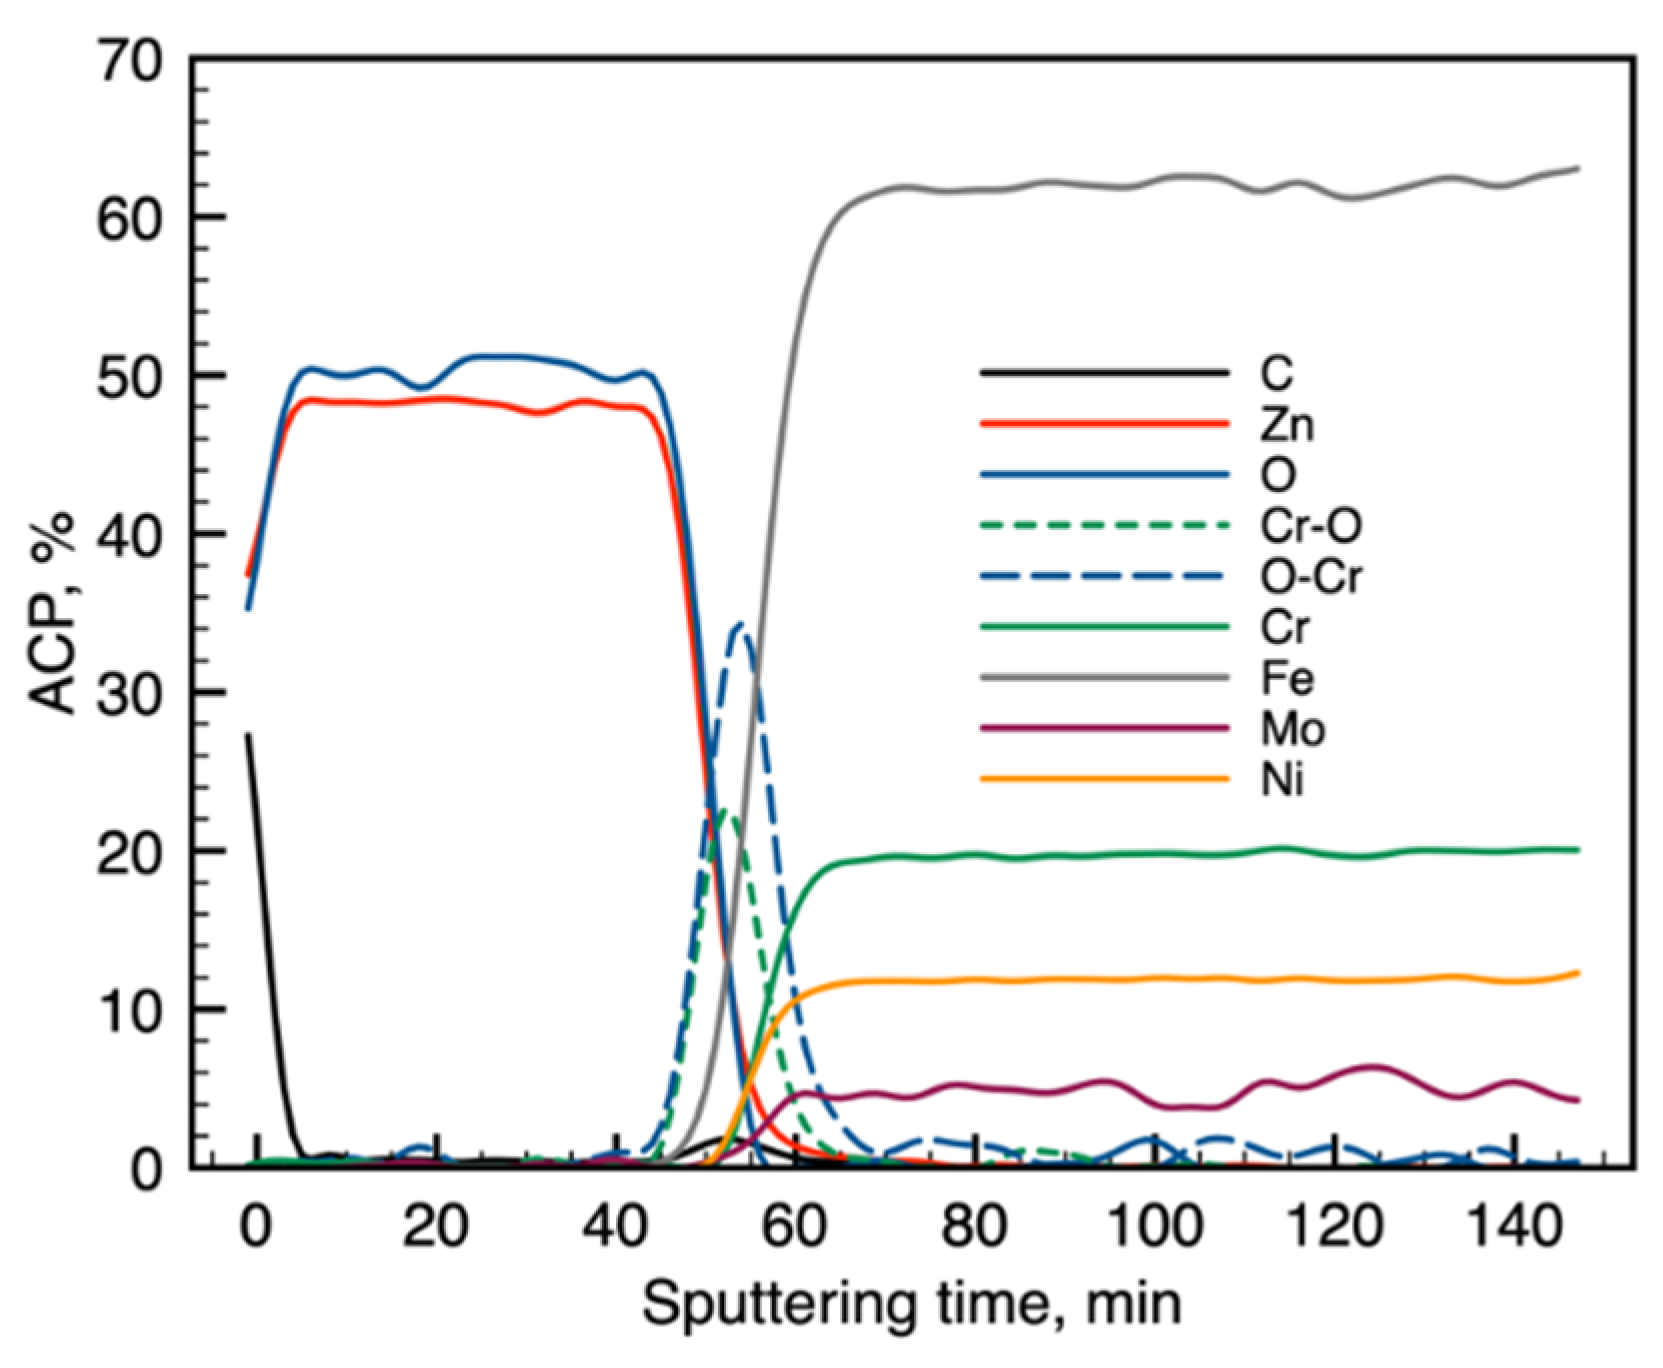
2.1. Chemical Composition of the Layer
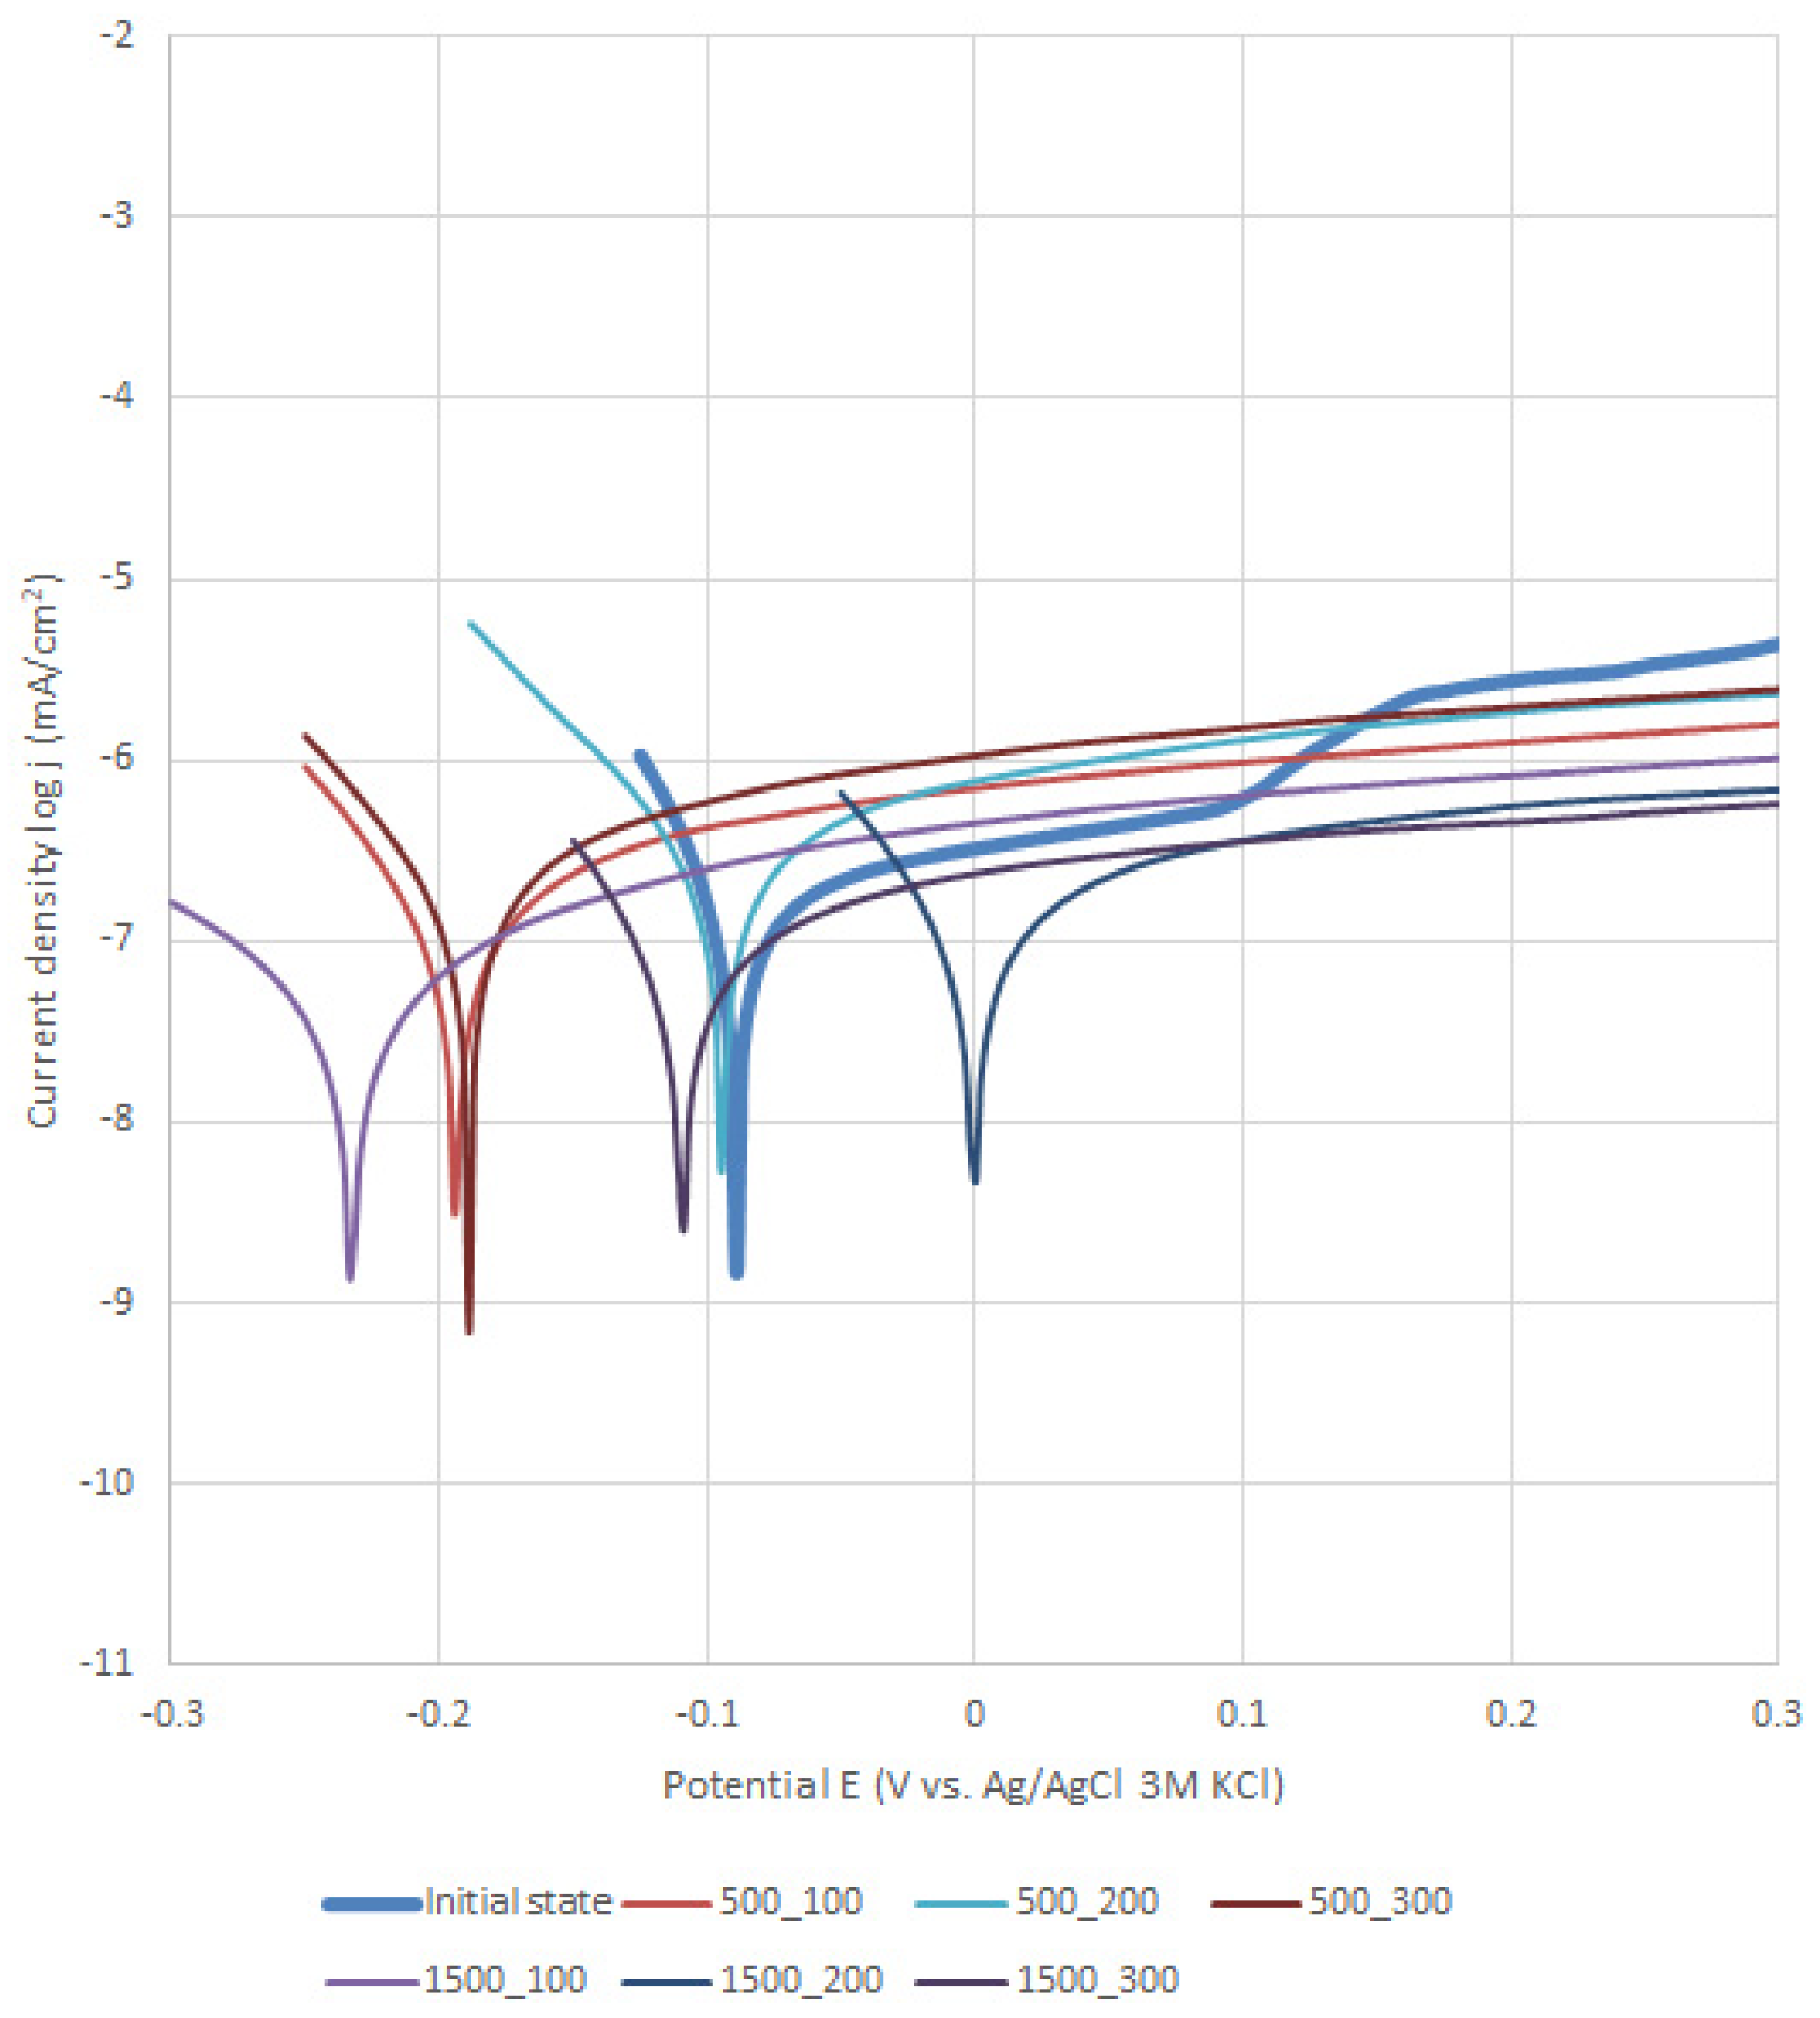
2.2. Potentiodynamic Test
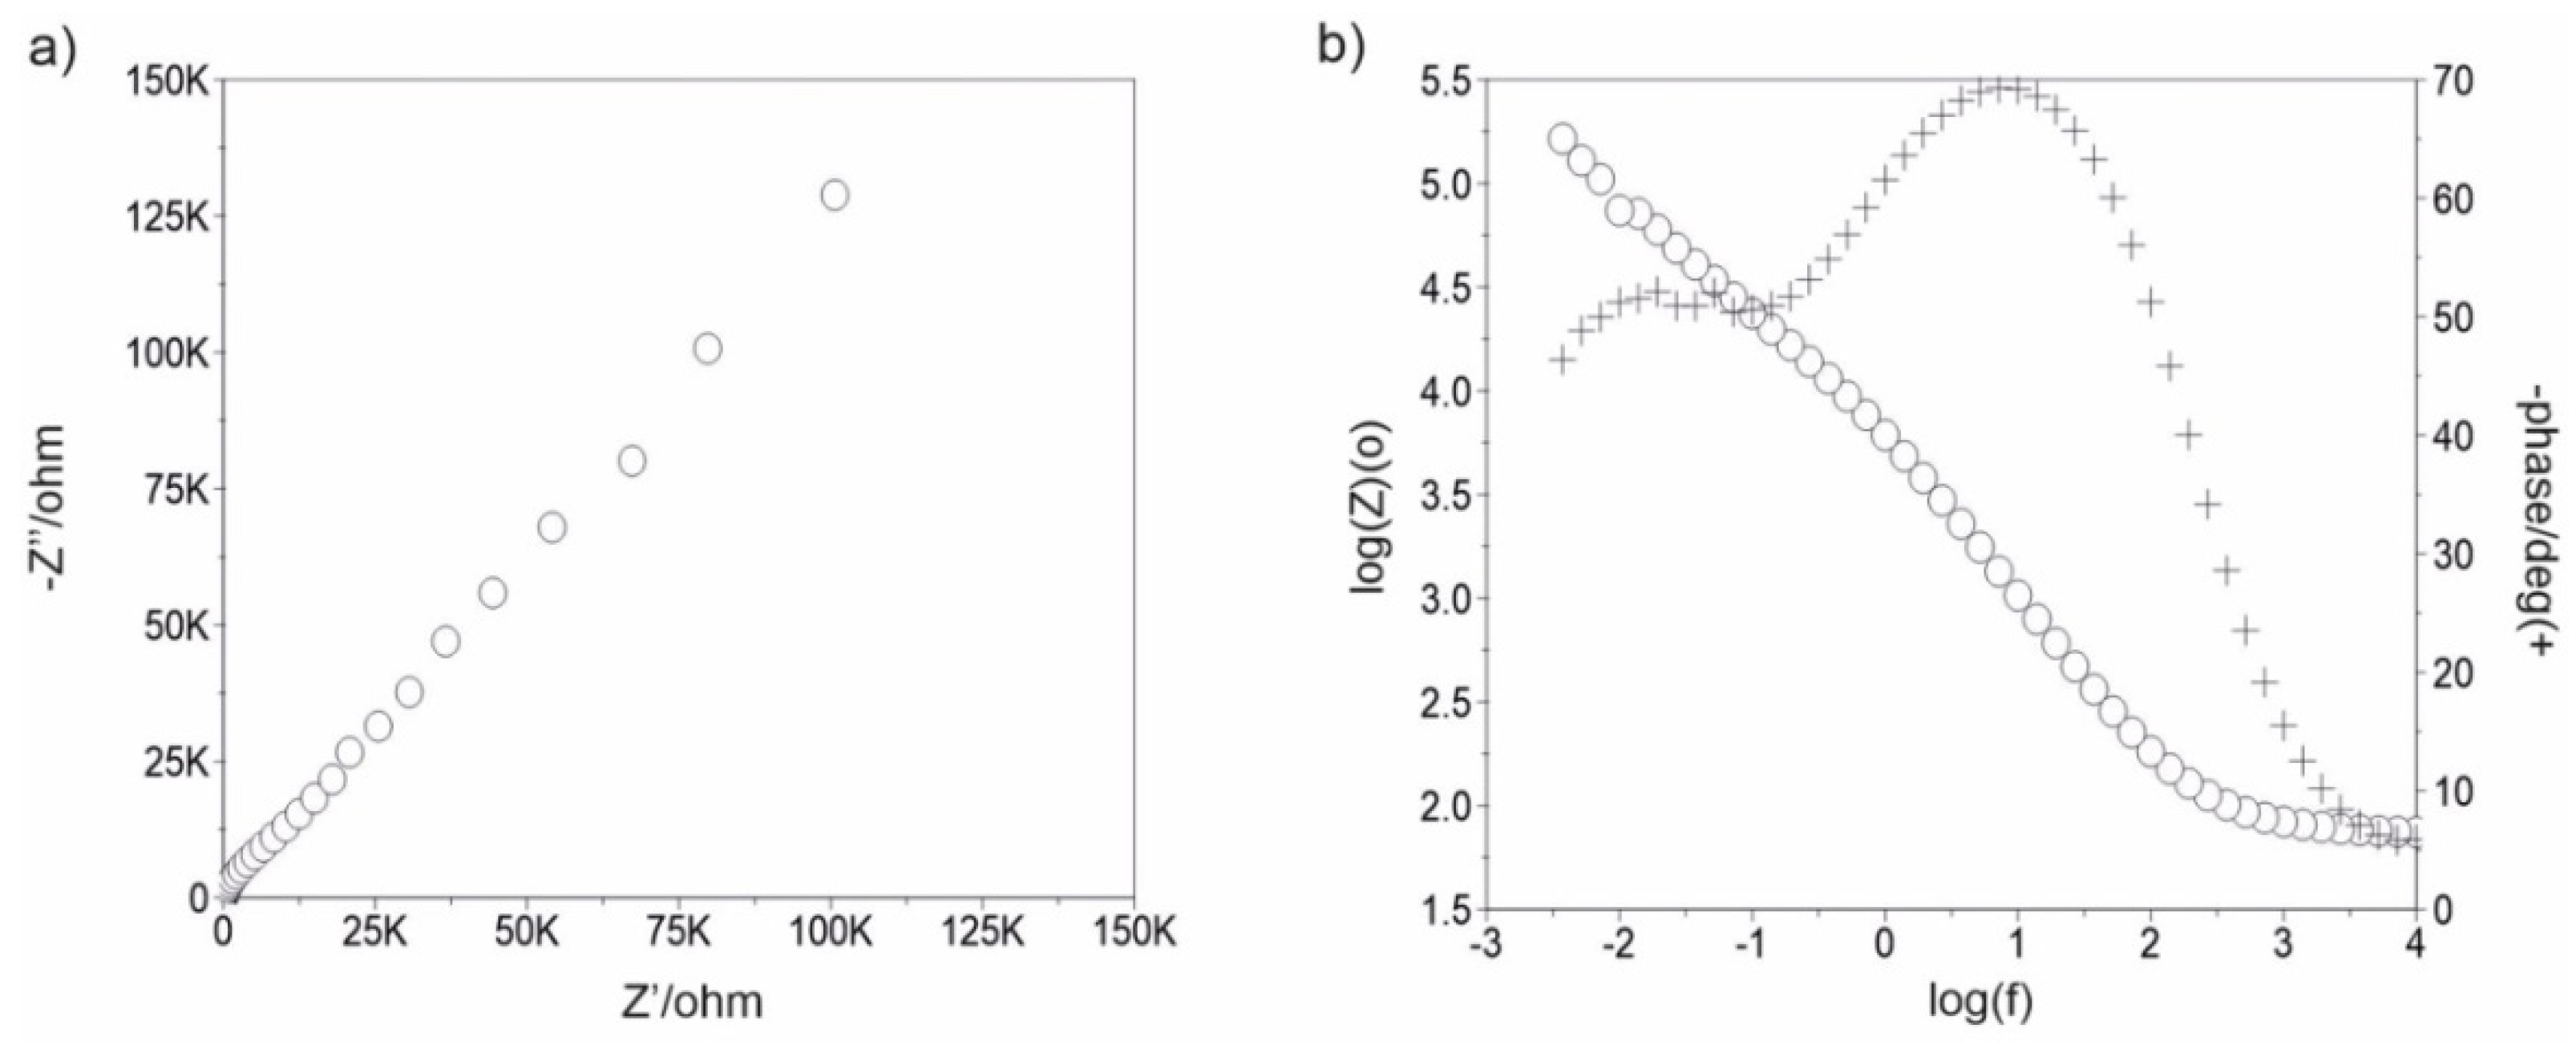
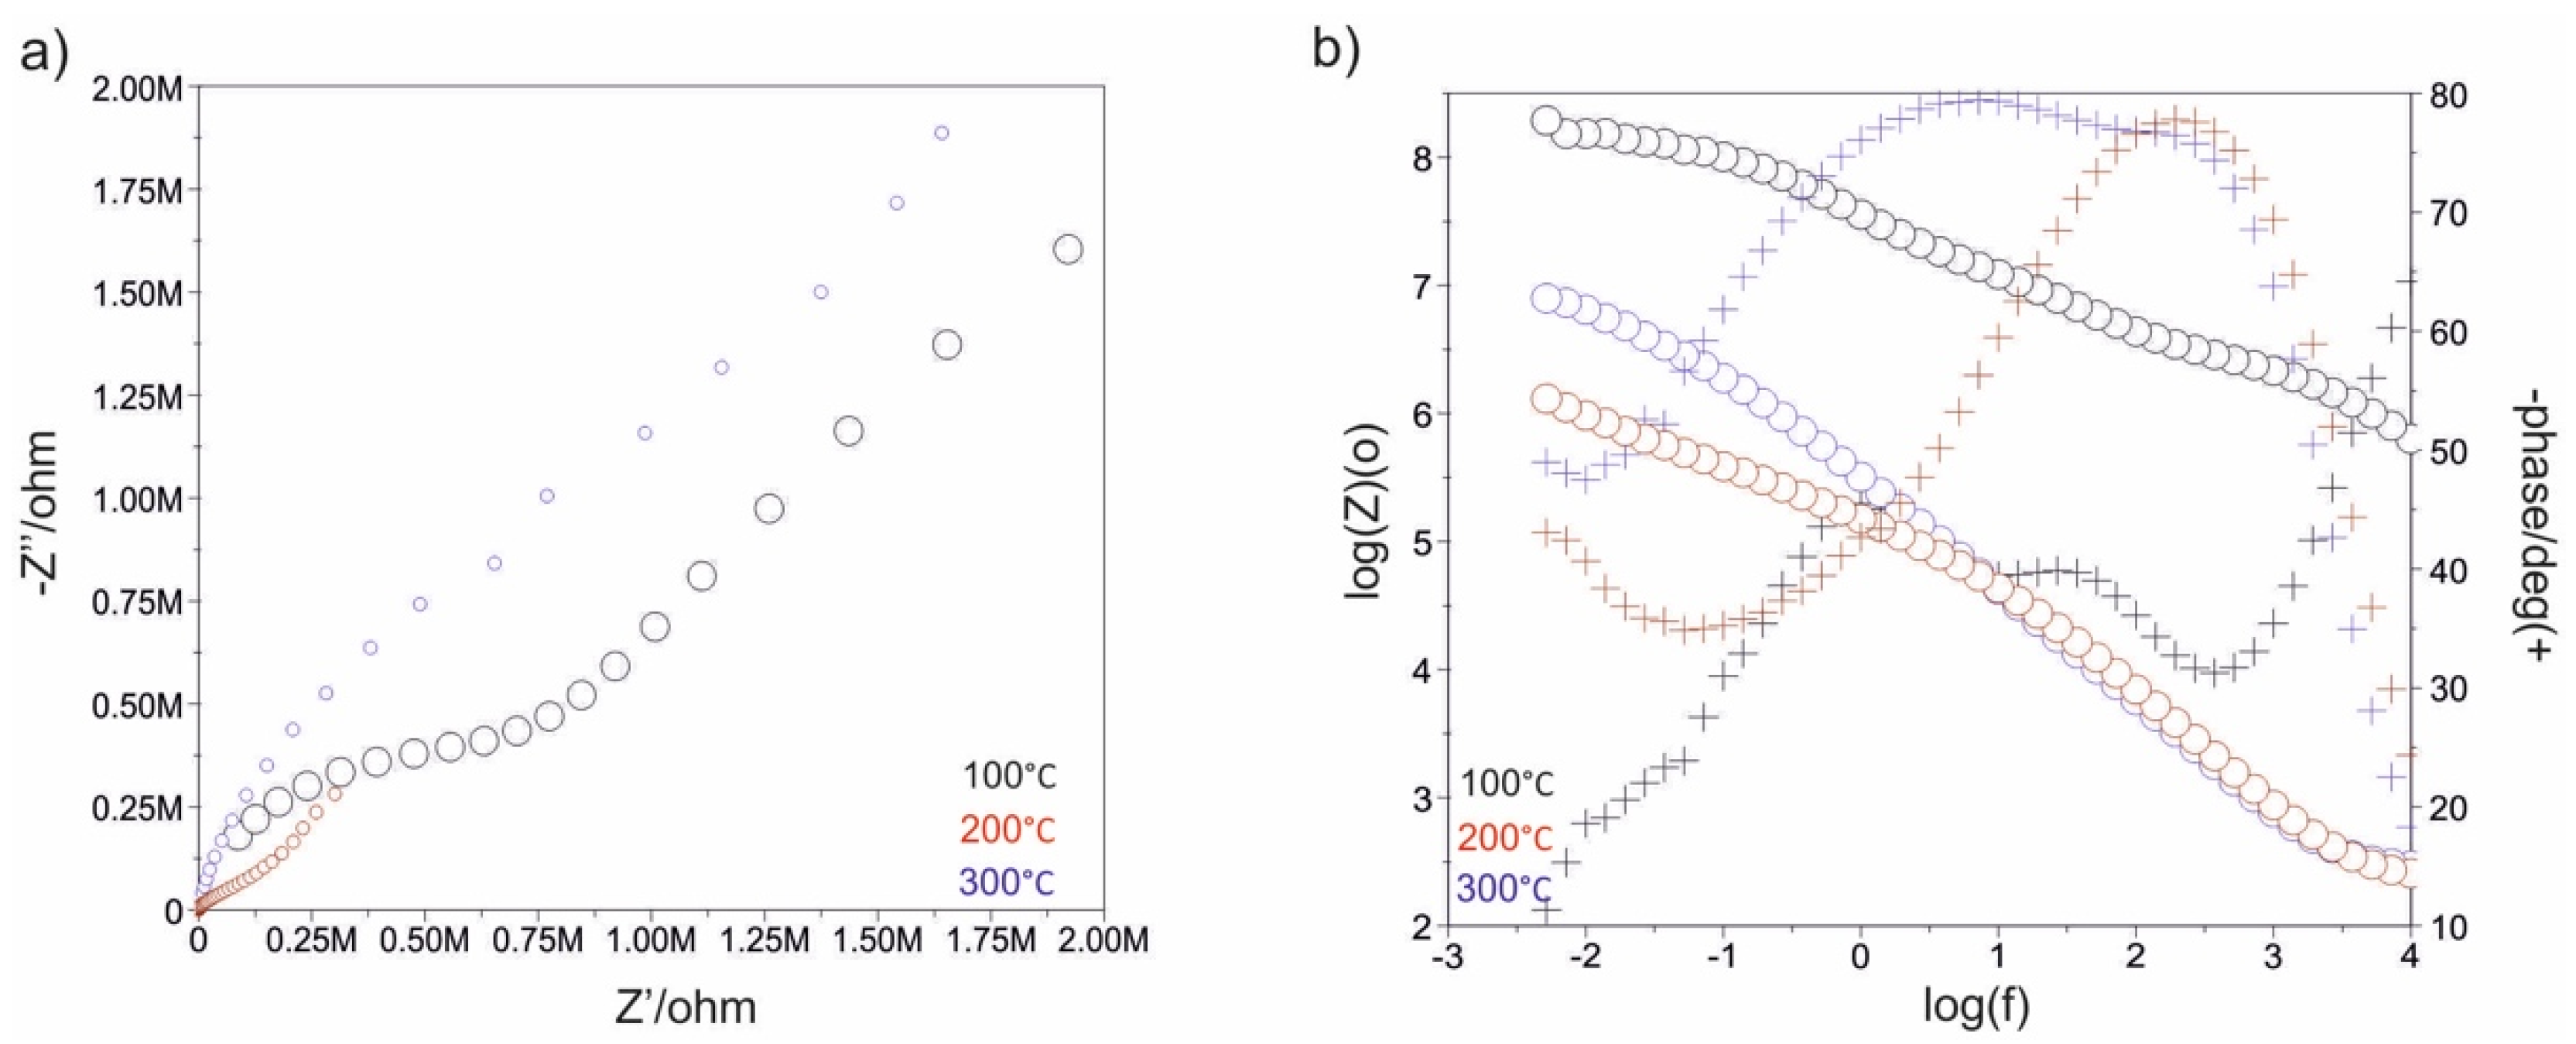
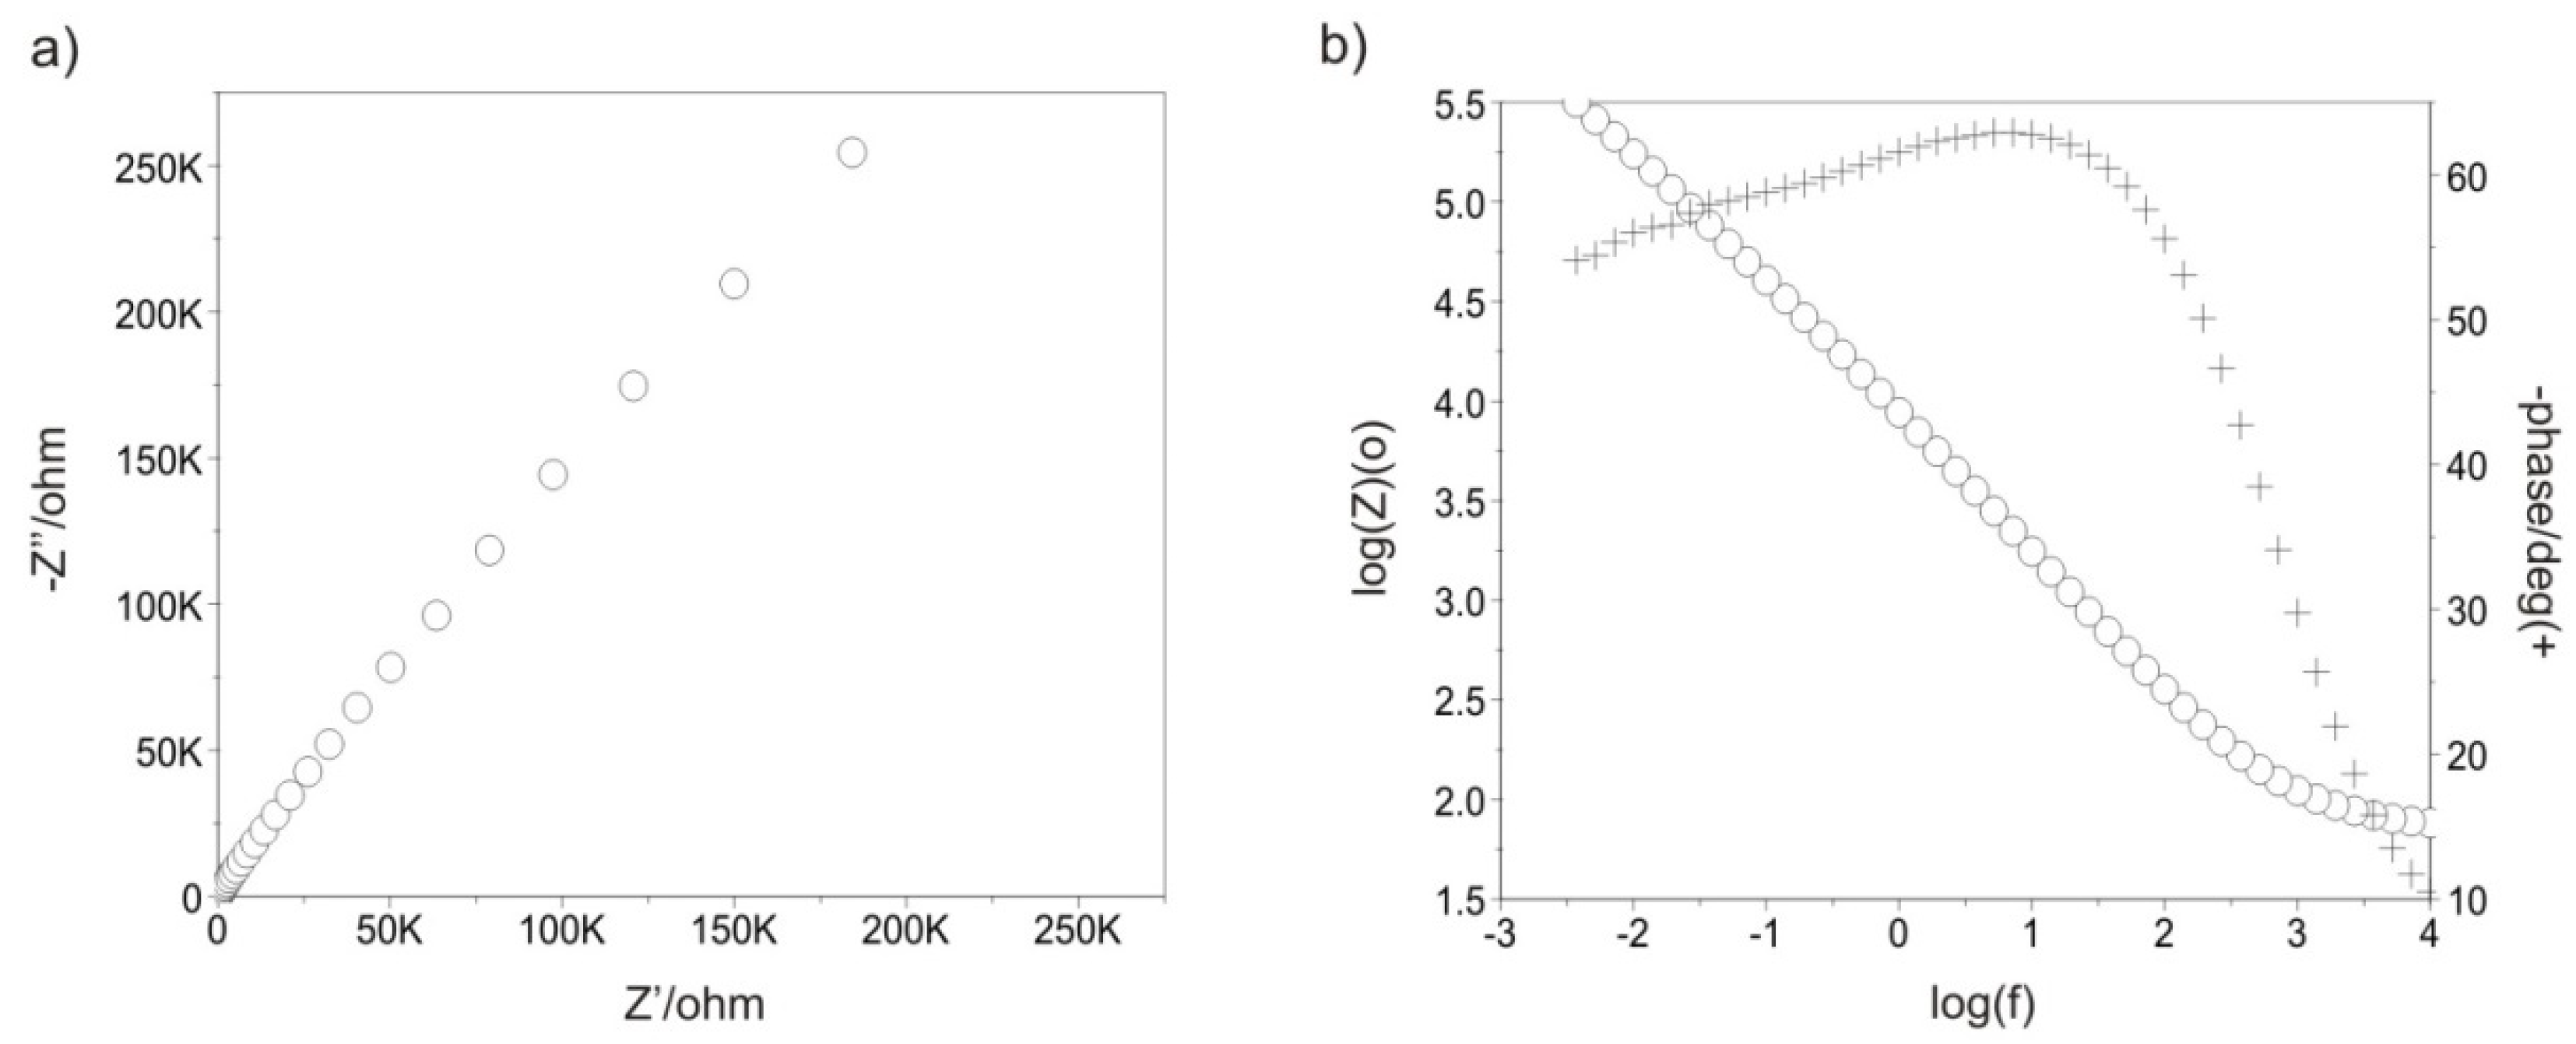
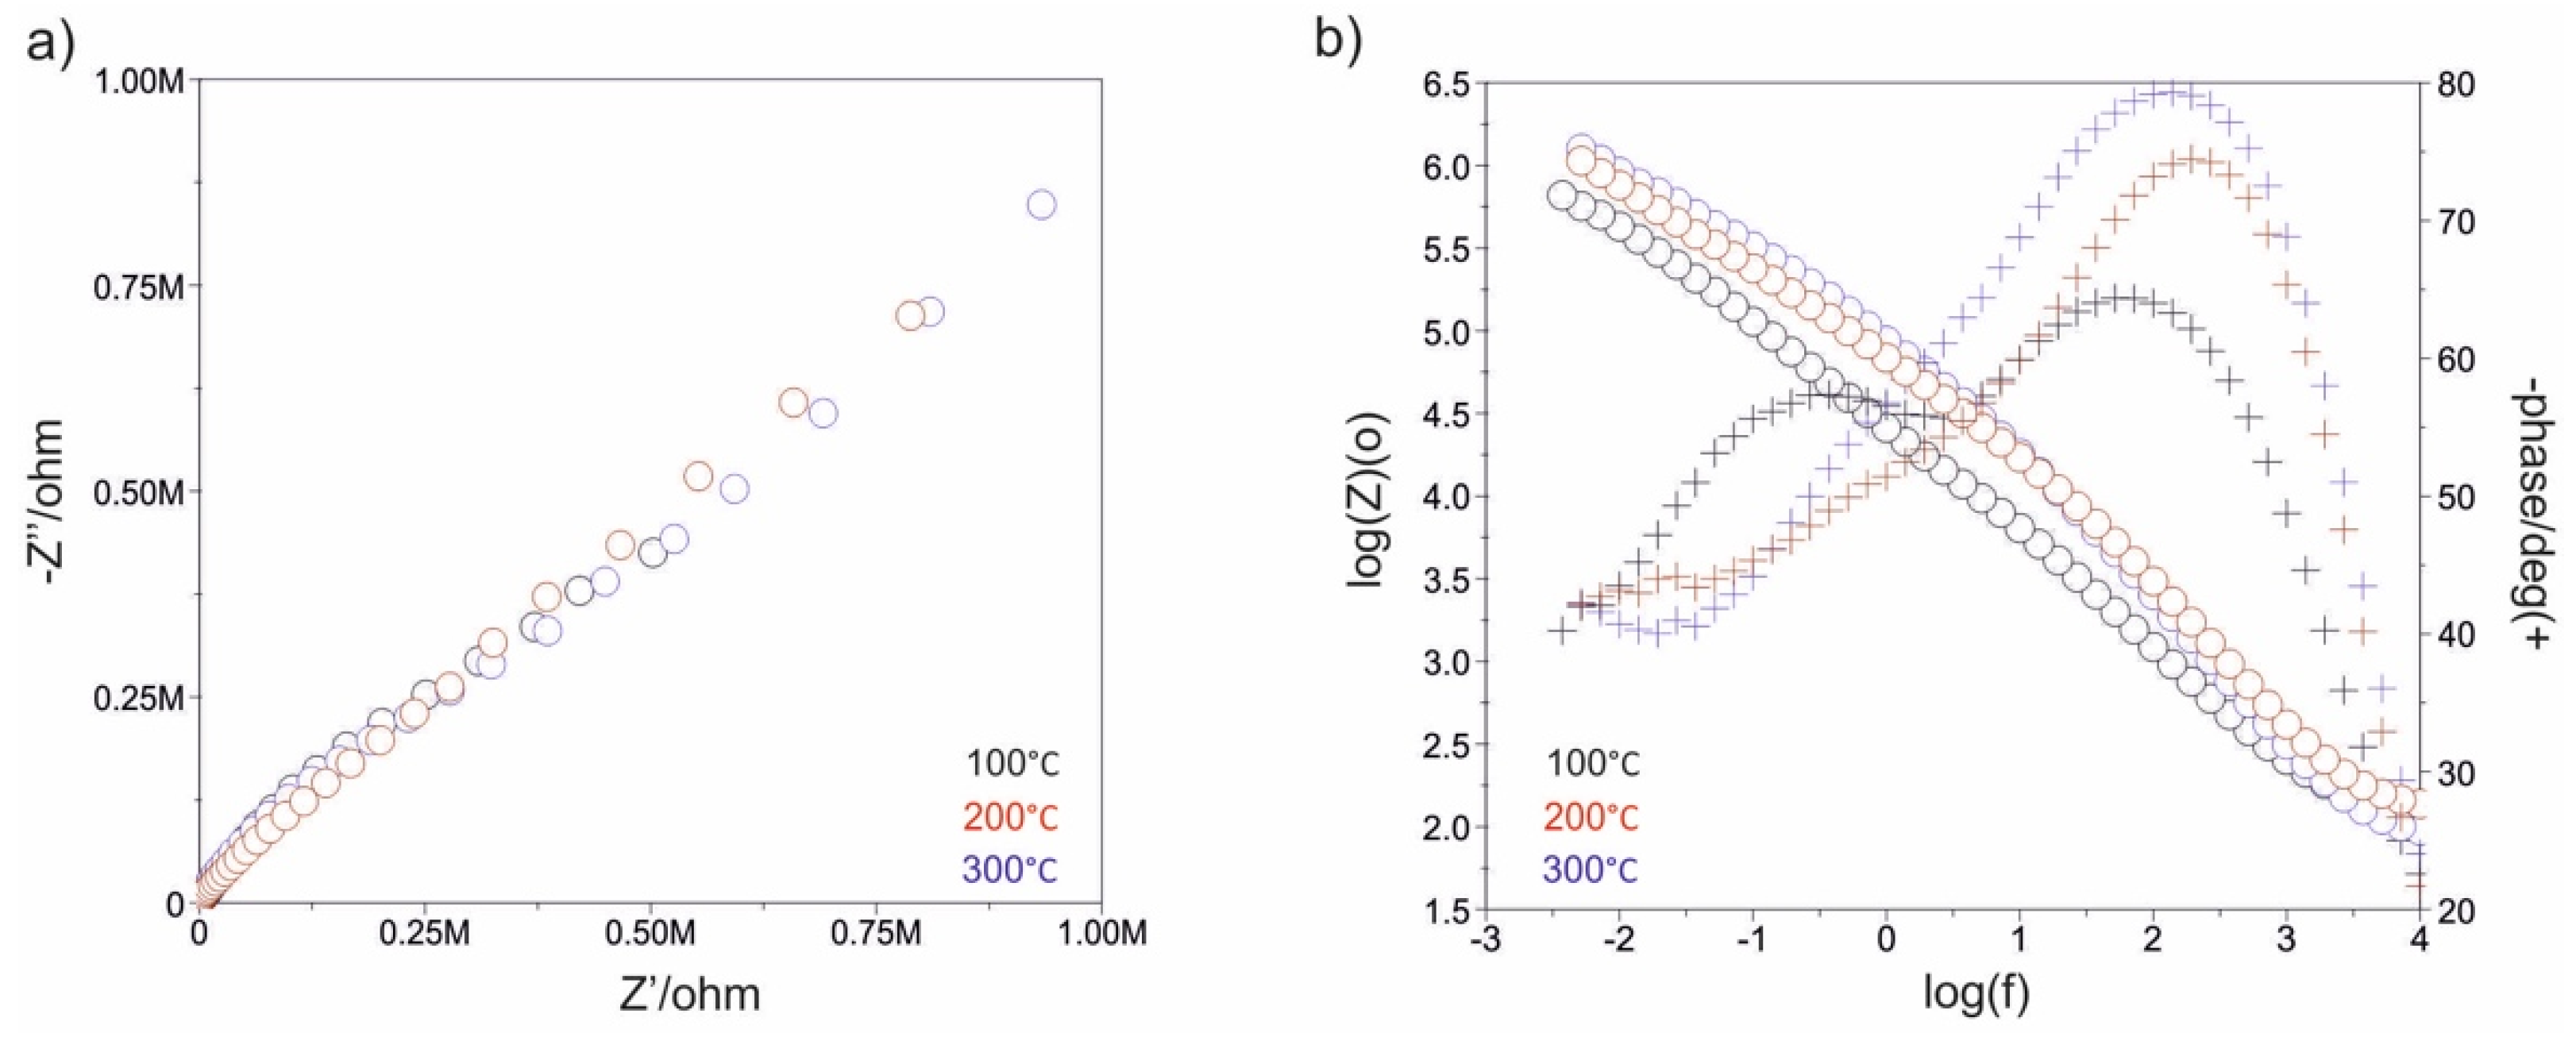
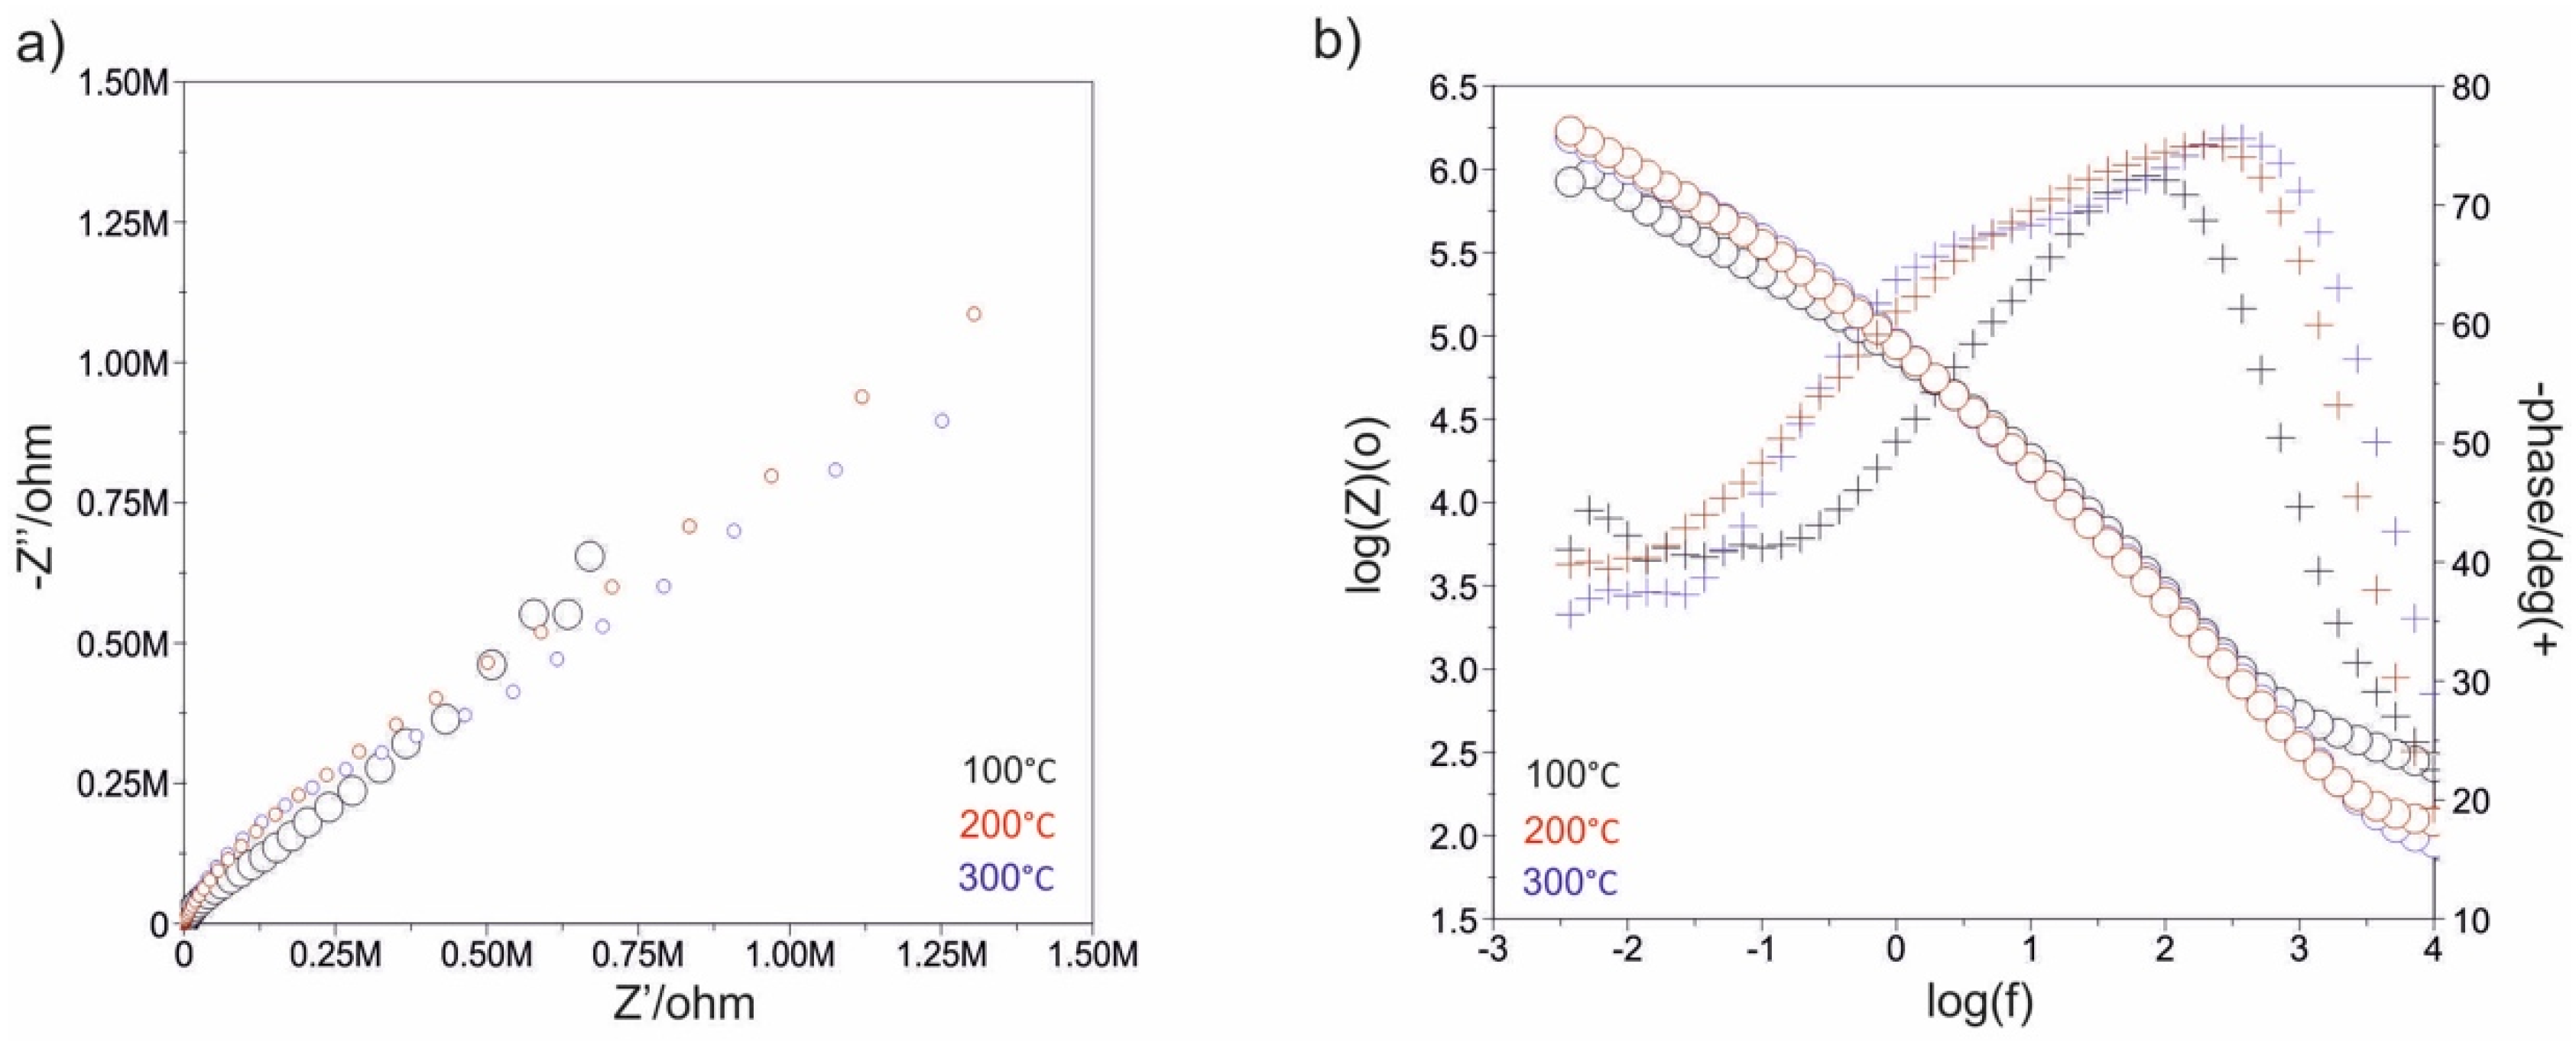
2.3. Impedance Test
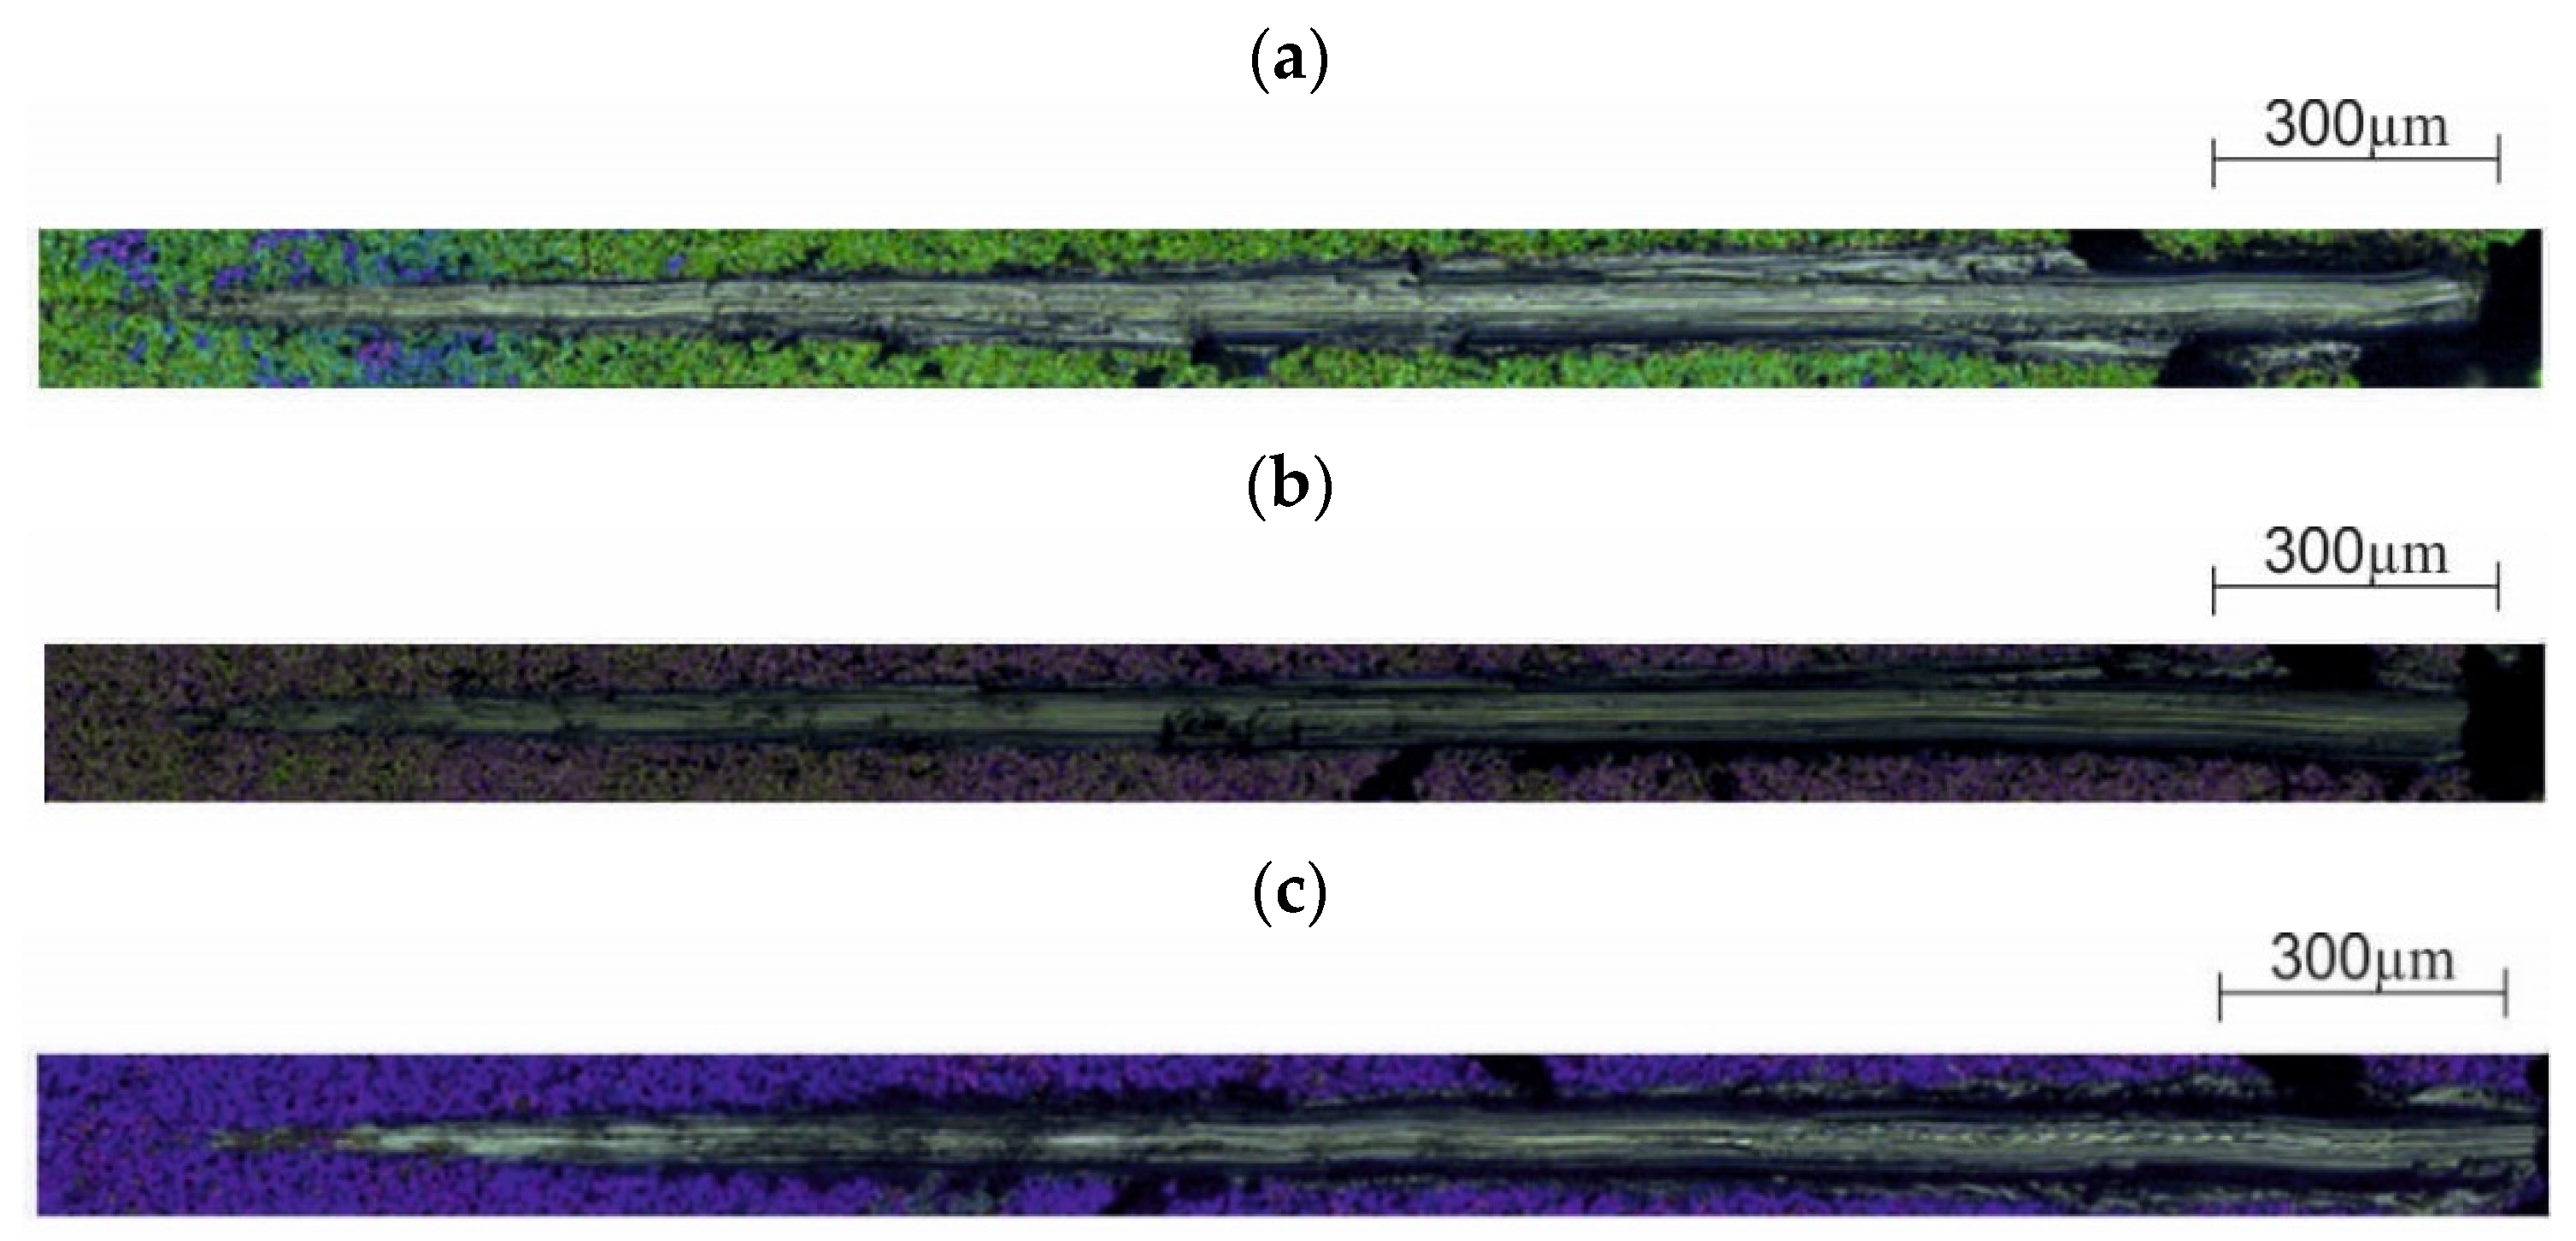
2.4. Scratch Test
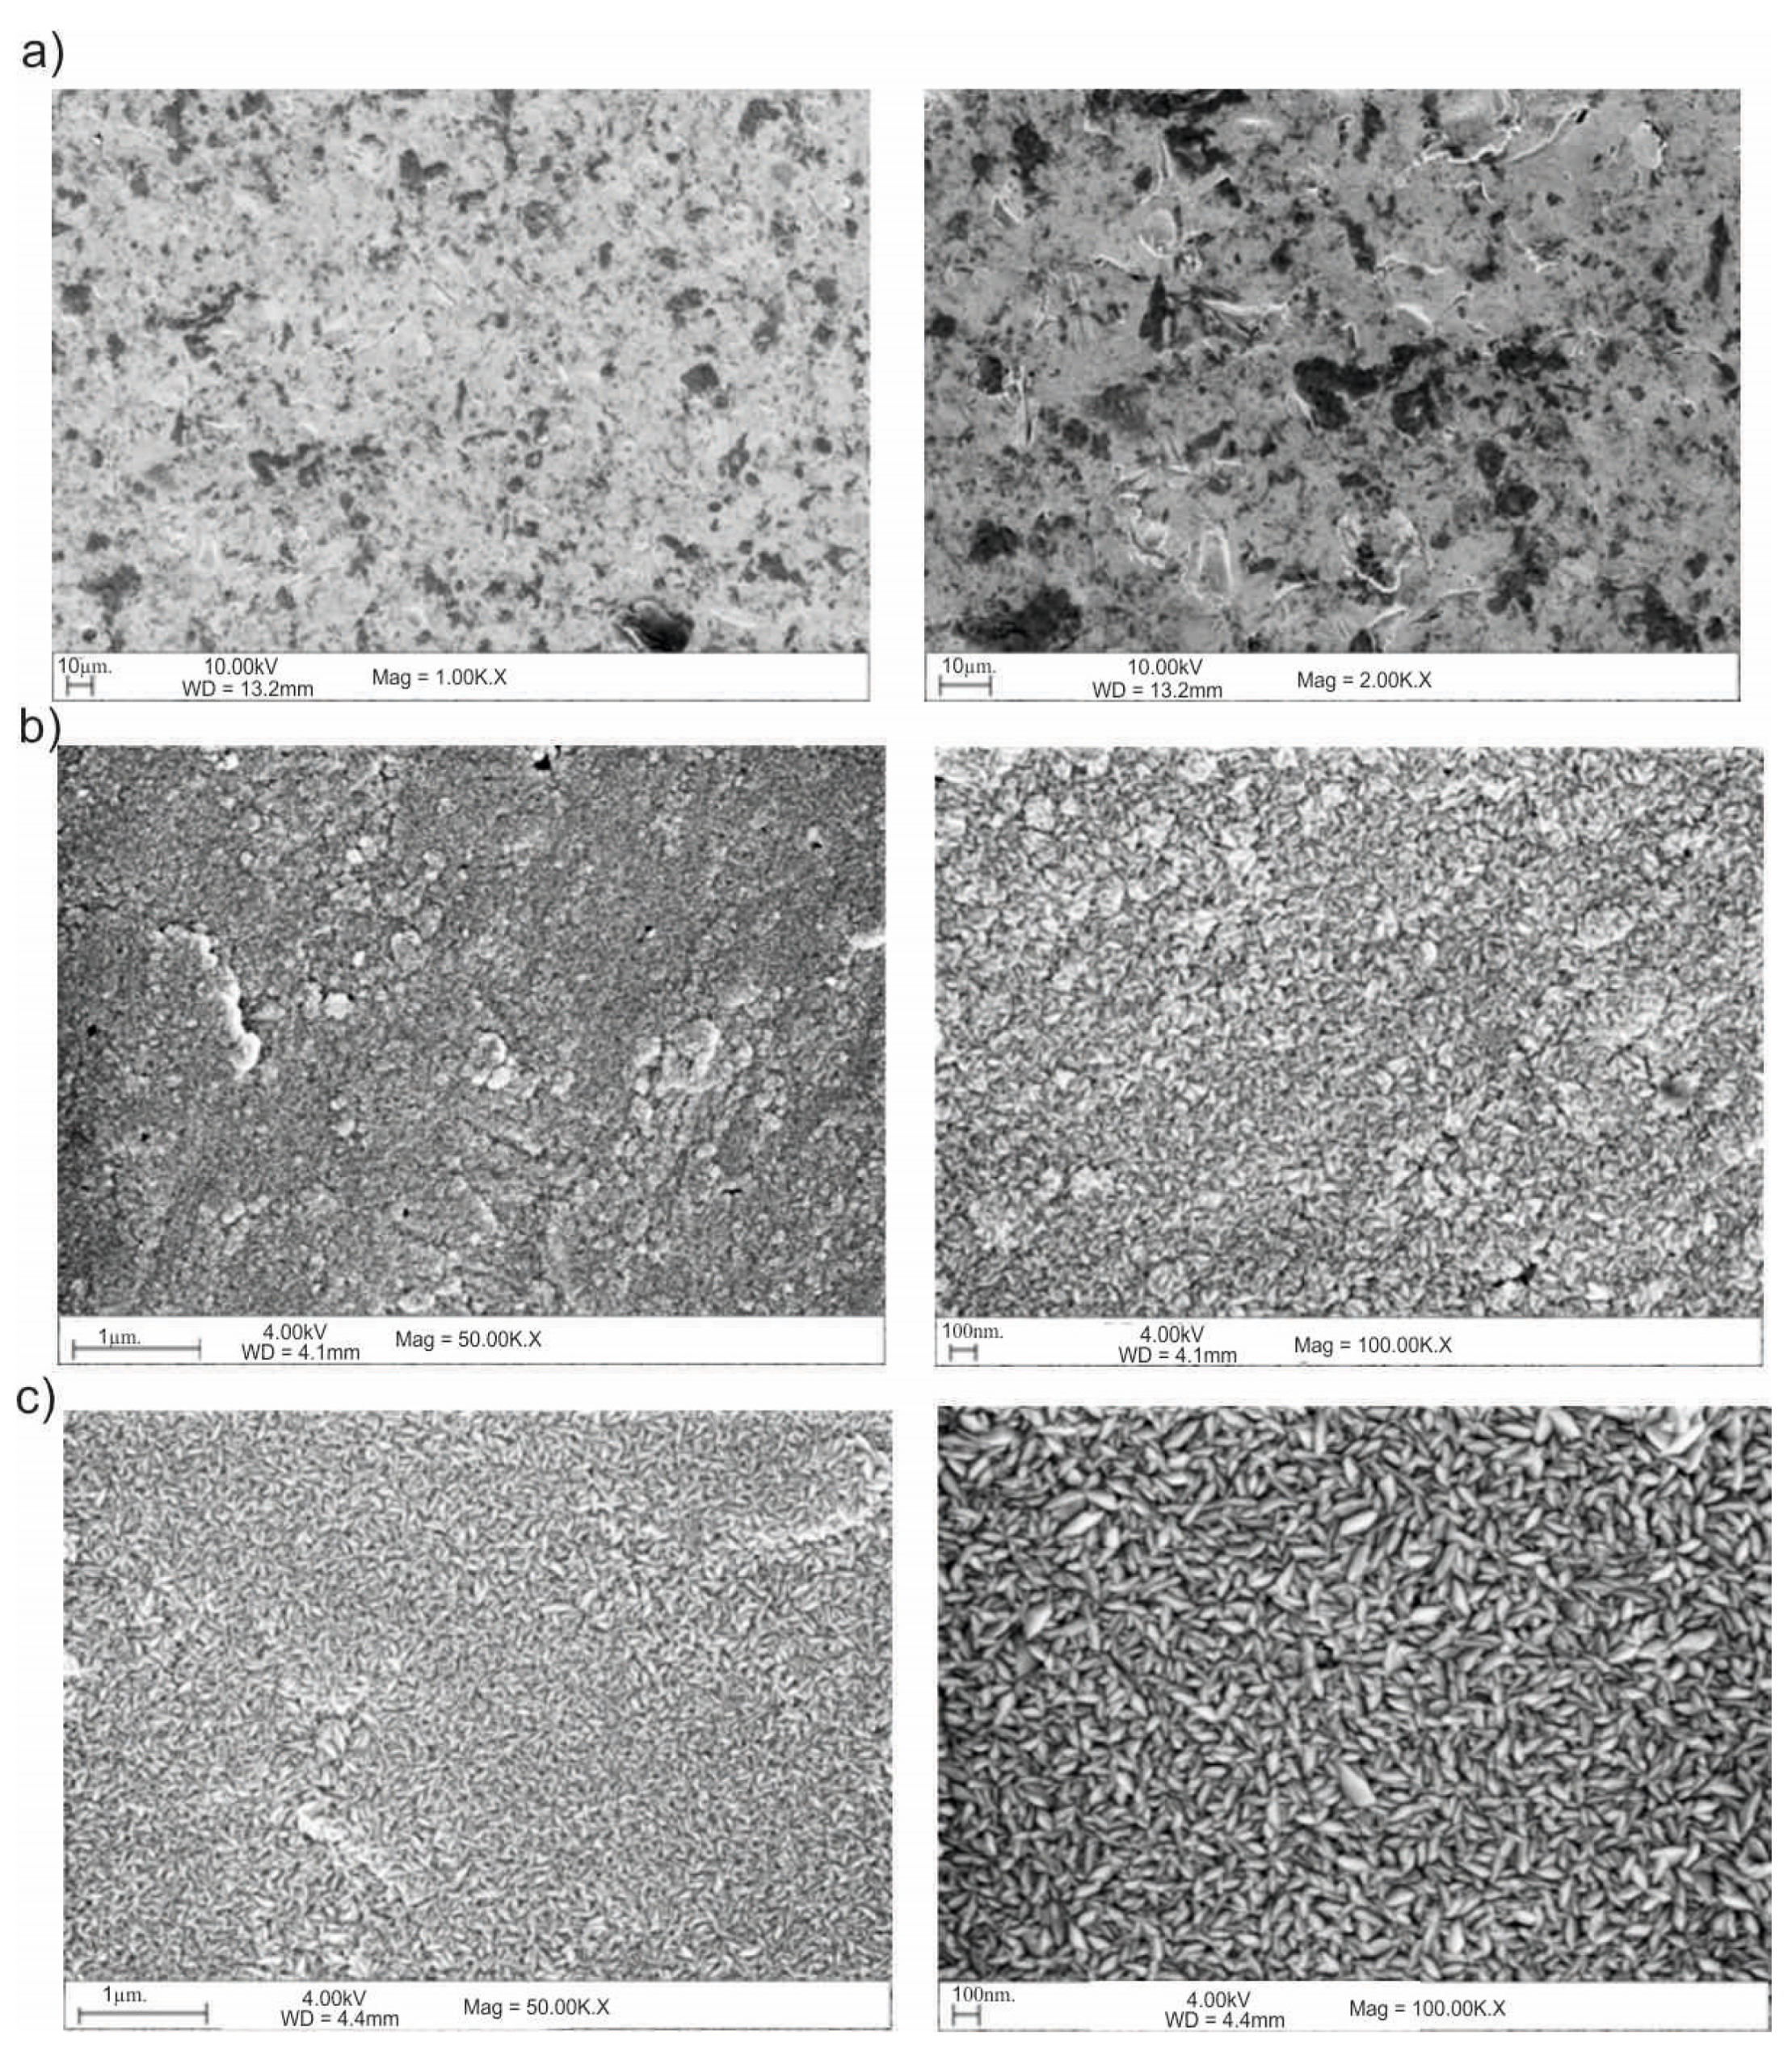
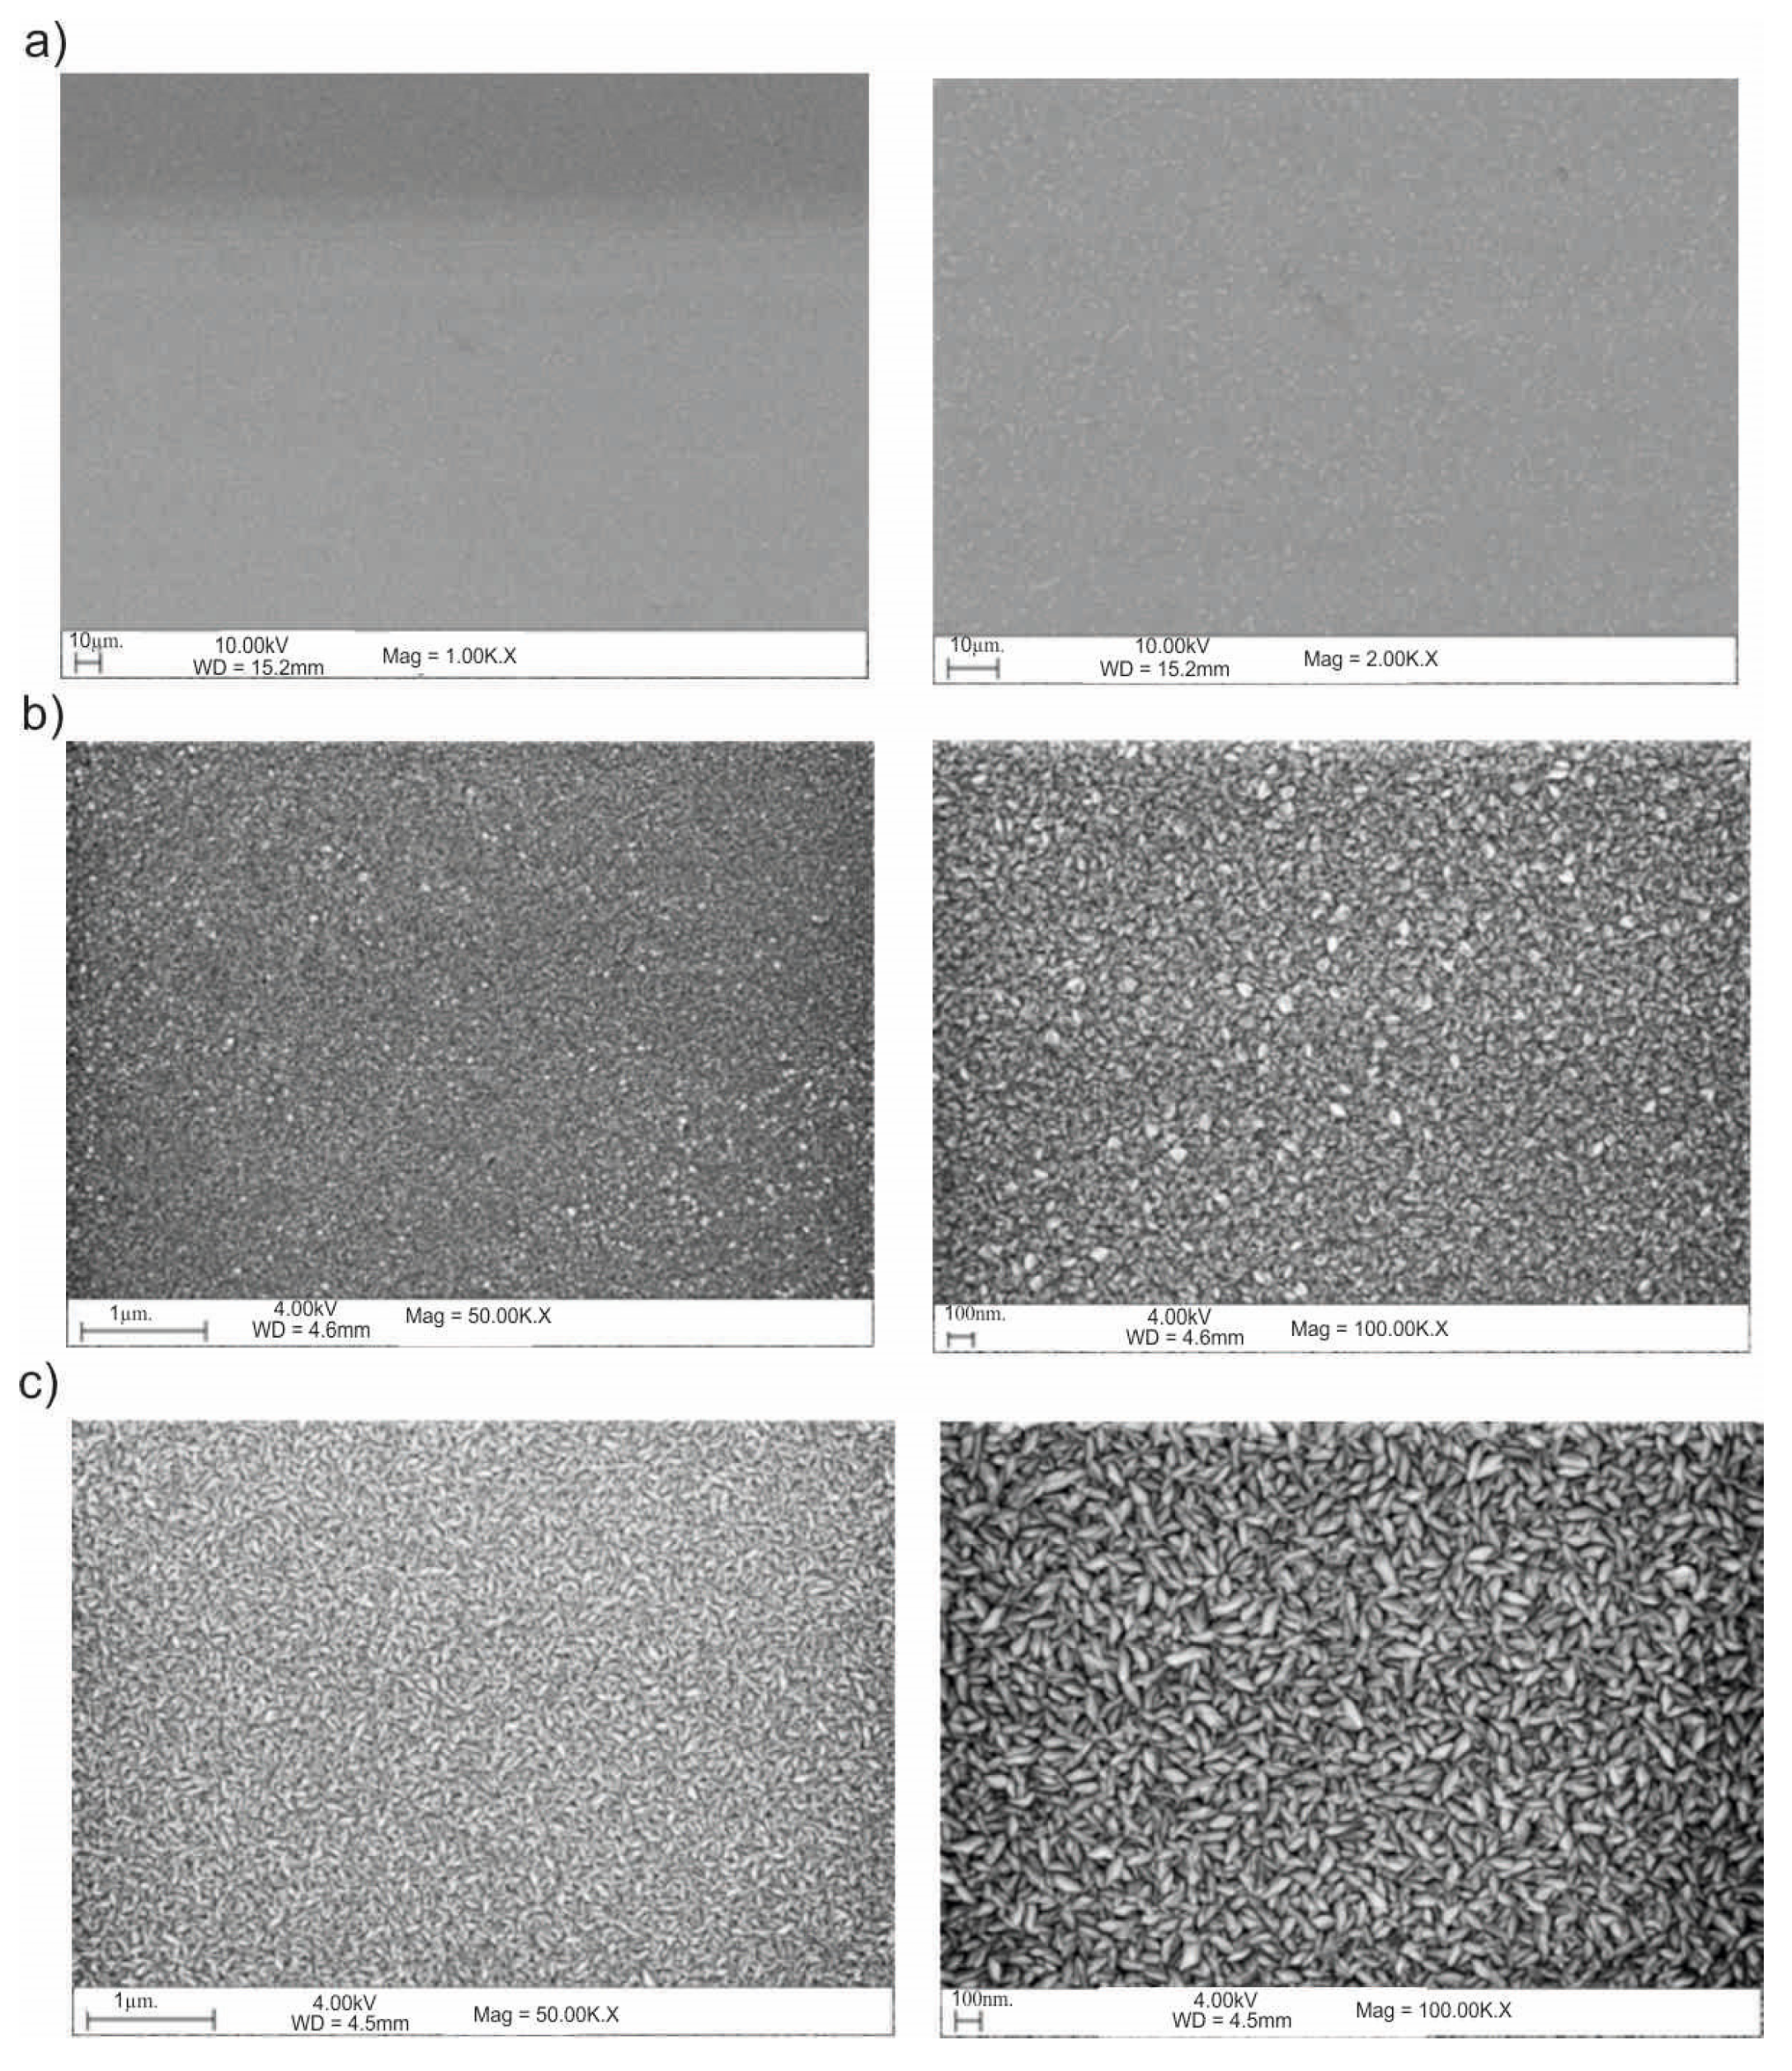
2.5. Scanning Electron Microscope (SEM)
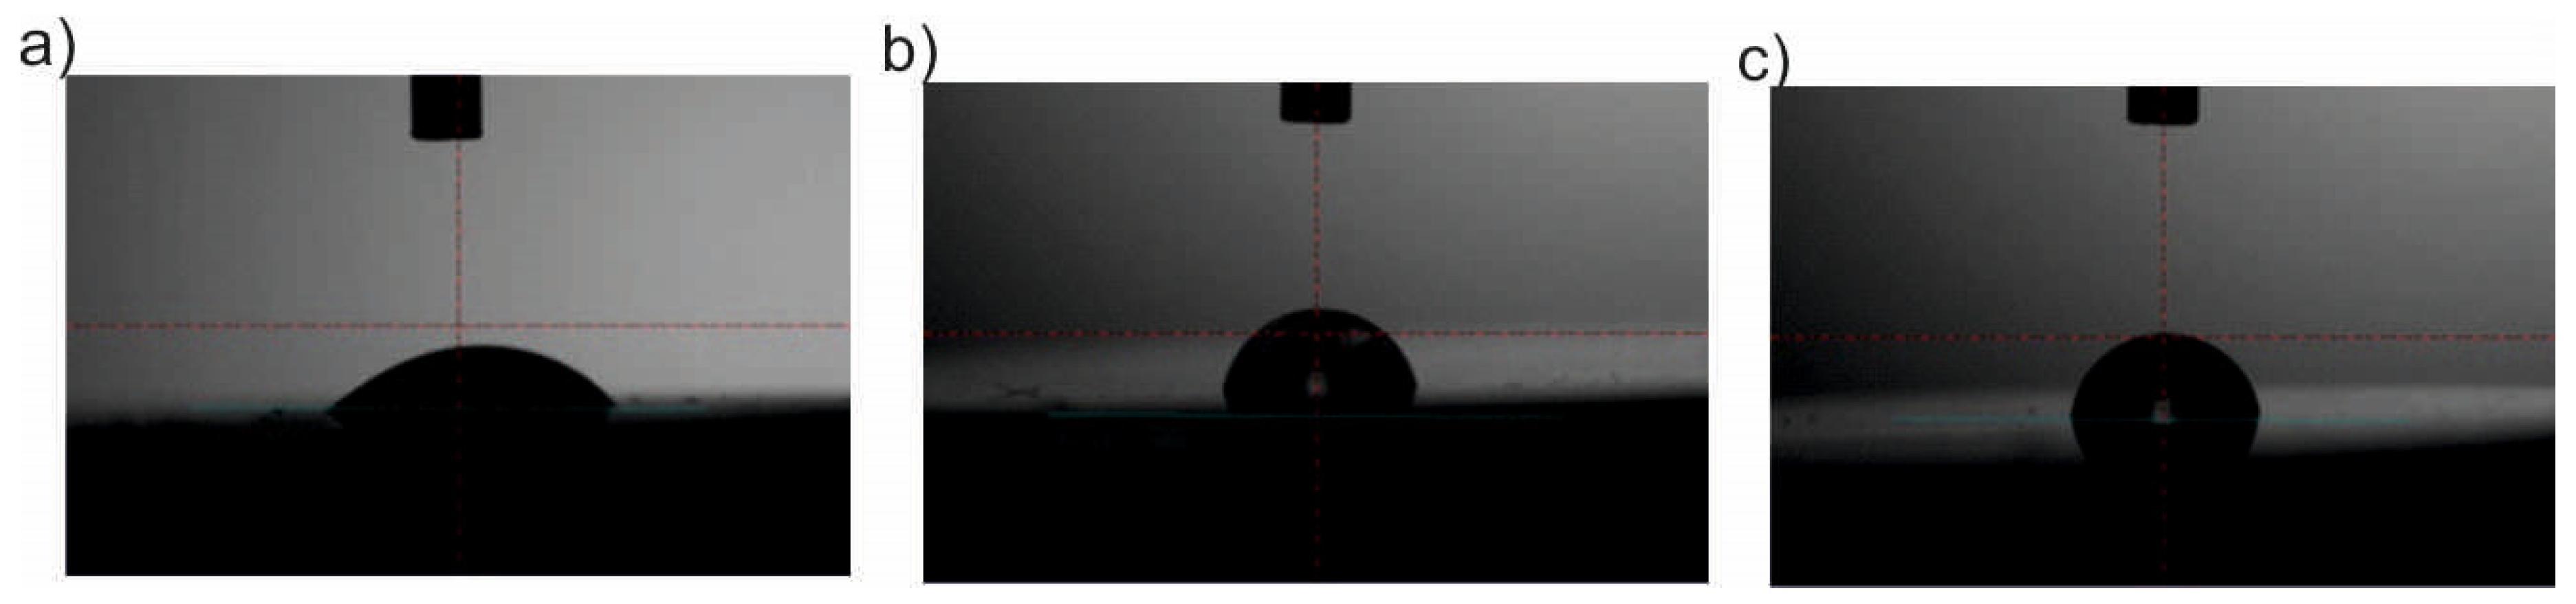
2.6. Wettability
3. Results
3.1. Chemical Composition of the Layer
3.2. Potentiodynamic Test
3.3. Impedance Test
3.4. Scratch Test
3.5. Scanning Electron Microscope (SEM)
3.6. Wettability
4. Discussion
5. Conclusions
Author Contributions
Funding
Conflicts of Interest
References
- El Hadad, A.A.; García-Galván, F.R.; Mezour, M.A.; Hickman, G.J.; Soliman, I.E.; Jiménez-Morales, A.; Barranco, V.; Galván, J.C.; Perry, C.C. Organic-inorganic hybrid coatings containing phosphorus precursors prepared by sol–gel on Ti6Al4V alloy: Electrochemical and in-vitro biocompatibility evaluation. Prog. Org. Coat. 2020, 148, 105834. [Google Scholar] [CrossRef]
- Yu, S.; Li, Z.; Han, L.; Zhao, Y.; Fu, T. Biocompatible MgO Film on Titanium Substrate Prepared by Sol-gel Method. Rare Met. Mater. Eng. 2018, 47, 2663–2667. [Google Scholar]
- Salimon, I.; Temirov, A.; Kubasov, I.; Skryleva, E.; Kislyuk, A.; Turutin, A.; Kiselev, D.; Ilina, T.; Zhukov, R.; Statnik, E.; et al. Characterization of Si-DLC films synthesized by low cost plasma-enhanced chemical vapor deposition. Mater. Today Proc. 2020. In press. [Google Scholar] [CrossRef]
- Song, C.; Liu, M.; Deng, Z.; Niu, S.; Deng, C.; Liao, H. A novel method for in-situ synthesized TiN coatings by plasma spray-physical vapor deposition. Mater. Lett. 2018, 217, 127–130. [Google Scholar] [CrossRef]
- Basiaga, M.; Walke, W.; Staszuk, M.; Kajzer, W.; Kajzer, A.; Nowińska, K. Influence of ALD process parameters on the physical and chemical properties of the surface of vascular stents. Arch. Civ. Mech. Eng. 2017, 17, 32–42. [Google Scholar] [CrossRef]
- Basiaga, M.; Kajzer, W.; Walke, W.; Kajzer, A.; Kaczmarek, M. Evaluation of physicochemical properties of surface modified Ti6Al4V and Ti6Al7Nb alloys used for orthopedic implants. Mater. Sci. Eng. C 2016, 68, 851–860. [Google Scholar] [CrossRef]
- Basiaga, M.; Staszuk, M.; Walke, W.; Opilski, Z. Mechanical properties of atomic layer deposition (ALD) TiO layers on stainless steel substrates. Mater. Werkst. 2016, 47, 512–520. [Google Scholar] [CrossRef]
- Senthil, B.; Devasena, T.; Prakash, B.; Rajasekar, A. Non-cytotoxic effect of green synthesized silver nanoparticles and its antibacterial activity. J. Photochem. Photobiol. B: Biol. 2017, 177, 1–7. [Google Scholar] [CrossRef]
- Baláž, M. Bio-mechanochemical synthesis of silver nanoparticles with antibacterial activity. Adv. Powder Technol. 2017, 28, 3307–3312. [Google Scholar] [CrossRef]
- Kiro, A.; Bajpai, J.; Bajpai, A. Designing of silk and ZnO based antibacterial and noncytotoxic bionanocomposite films and study of their mechanical and UV absorption behawior. J. Mech. Behav. Biomed. Mater. 2017, 65, 281–294. [Google Scholar] [CrossRef]
- Díez-Pascual, A.; Díez-Vicente, A. Antibacterial SnO2 nanorods as efficient fillers of poly(propylenefumarate-co-ethylene glycol) biomaterials. Mater. Sci. Eng. C. 2017, 78, 806–816. [Google Scholar] [CrossRef] [PubMed]
- Frommelt, L. Periprosthetic infection: Bacteria and the interfaces between prosthesis and bone. In Interfaces in Total Hip Arthroplasty; Springer: London, UK, 2000; pp. 153–161. [Google Scholar]
- Rios, A.; Rodriguez, J.M.; Munitiz, V.; Alcatraz, P.; Perez, D.F.; Parrilla, P. Antibiotic prophylaxis in incisional hernia repair using a prosthesis. Hernia 2011, 5, 148–152. [Google Scholar]
- Byeon, J.; Young, K.; Hong, Y.; Hwang, J. Characteristics of electroless copper-deposited activated carbon fibers for antibacterial action and adsorption–desorption of volatile organic compounds. Carbon 2007, 45, 2313–2316. [Google Scholar] [CrossRef]
- Ferraris, M. Antibacterial silver nanocluster/silica composite coatings on stainless steel. Appl. Surf. Sci. 2017, 396, 1546–1555. [Google Scholar] [CrossRef]
- Faraji, M.; Mohaghegh, N.; Abedini, A. Ternary composite of TiO2 nanotubes/Ti plates modified by g-C3N4 and SnO2 with enhanced photocatalytic activity for enhancing antibacterial and photocatalytic activity. J. Photochem. Photobiol. B Biol. 2018, 178, 124–132. [Google Scholar] [CrossRef] [PubMed]
- Marques, S.; Carvalho, I.; Henriques, M.; Polcar, T.; Carvalho, S. PVD-grown antibacterial Ag-TiN films on piezoelectric PVDF substrates for sensor applications. Surf. Coat. Technol. 2015, 281, 117–124. [Google Scholar] [CrossRef] [Green Version]
- Oshida, Y.; Guven, Y. Biocompatible coatings for metallic biomaterials. In Surface Coating and Modification of Metallic Biomaterials; Woodhead Publishing: Cambridge, UK, 2015; Volume 10, pp. 288–343. [Google Scholar]
- ASTM F2129, Standard Test Method for Conducting Cyclic Potentiodynamic Polarization Measurements to Determine the Corrosion Susceptibility of Small Implant Devices; ASTM International: West Conshohocken, PA, USA, 2019; Available online: www.astm.org (accessed on 22 October 2020).
- Xuelei, L.; Huilan, G.; Zhijie, M.; Ming, L.; Dawei, S. In/ex-situ Raman spectra combined with EIS for observing interface reactions between Ni-rich layered oxide cathode and sulfide electrolyte. J. Energy Chem. 2020, 48, 195–202. [Google Scholar]
- Shi, Y.; Cai, N.; Mao, Z. Simulation of EIS spectra and polarization curves based on Ni/YSZ patterned anode elementary reaction models. Int. J. Hydrog. Energy 2012, 37, 1037–1043. [Google Scholar] [CrossRef]
- PN-EN ISO 20502:2016—High Quality Ceramics (Advanced Ceramics, Technical Advanced Ceramics)—Determination of Adhesion of Ceramic Coatings in the Scratch Test; Polish Committee for Standardization: Warszawa, Poland, 2016.
- Domanowska, A.; Korbutowicz, R.; Teterycz, H. Morphology and element composition profiles of alumina films obtained by mixed thermal oxidation of AlN epitaxial layers. Appl. Surf. Sci. 2019, 484, 1234–1243. [Google Scholar] [CrossRef]
- Mohammadi, F.; Nickchi, T.; Attar, M.M.; Alfantazi, A. EIS study of potentiostatically formed passive film on 304 stainless steel. Electrochim. Acta 2011, 56, 8727–8733. [Google Scholar] [CrossRef]


| Number | Temp, °C | Cycles | Ecorr | Eb | Ba | Bc | Rp | icorr |
|---|---|---|---|---|---|---|---|---|
| mV | mV | mV | mV | kΩ⋅cm2 | µA/cm2 | |||
| Sandblasted | ||||||||
| 1 | Initial state | −87 | +1242 | +46.7 | −28 | 0.13 | 55.13 | |
| 2 | 100 | 500 | −184 | +1462 | +48 | −37.8 | 0.15 | 47.01 |
| 3 | 1500 | −167 | - | +45.1 | −42.9 | 0.49 | 14.65 | |
| 4 | 200 | 500 | −90 | +1481 | +49.5 | −37 | 0.07 | 97.73 |
| 5 | 1500 | +3 | +1532 | +47.8 | 37.5 | 0.16 | 43.73 | |
| 6 | 300 | 500 | −132 | +1423 | +45.2 | −40.8 | 0.10 | 70.96 |
| 7 | 1500 | −96 | +1544 | +47.2 | −35.3 | 0.27 | 25.63 | |
| Electropolished | ||||||||
| 1 | Initial state | −211 | +1239 | +43.4 | −43.1 | 0.19 | 37.33 | |
| 2 | 100 | 500 | −71 | +1356 | +48.5 | −37.4 | 0.18 | 39.75 |
| 3 | 1500 | +49 | +1640 | +47.5 | −35.6 | 0.23 | 29.60 | |
| 4 | 200 | 500 | +14 | +1537 | +47.6 | −37.7 | 0.29 | 24.34 |
| 5 | 1500 | −118 | +1637 | +47.8 | −40.5 | 0.29 | 24.93 | |
| 6 | 300 | 500 | +72 | +1523 | +45.4 | −37.5 | 0.37 | 17.95 |
| 7 | 1500 | −46 | +1683 | +44.1 | −39.5 | 0.24 | 29.37 | |
| Samples | Rad, kΩ·cm2 | Cad, µF | CPEad | Rpore, kΩ·cm2 | CPEpore | Rct ,kΩ·cm2 | CPEdl | EOCP, mV | |||
|---|---|---|---|---|---|---|---|---|---|---|---|
| Y0, Ω−1cm−2s−n | n | Y0, Ω−1cm−2s−n | n | Y0, Ω−1cm−2s−n | n | ||||||
| Sandblasted * | - | - | - | - | 7 | - | - | 538 | 0.8050 × 10⁻⁴ | 0.72 | −71 |
| 500_100 | 1 | 6 | - | - | 274 | 0.1348 × 10⁻⁴ | 0.86 | 1252 | 0.8123 × 10⁻⁴ | 0.71 | −79 |
| 1500_100 | 2 | 28 | - | - | 2374 | 0.1578 × 10⁻⁴ | 0.88 | 2852 | 0.8578 × 10⁻⁴ | 0.69 | −81 |
| 500_200 | 5 | 29 | - | - | 1129 | 0.1085 × 10⁻⁴ | 0.79 | 1850 | 0.5144 × 10⁻⁴ | 0.68 | −93 |
| 1500_200 | 25 | 8 | - | - | 1064 | 0.1686 × 10⁻⁴ | 0.91 | 1138 | 0.2906 × 10⁻⁴ | 0.75 | −75 |
| 500_300 | - | - | - | - | 3020 | 0.3840 × 10⁻⁴ | 0.94 | 7460 | 0.2382 × 10⁻⁴ | 0.71 | −18 |
| 1500_300 | - | - | - | - | 3064 | 0.1756 × 10⁻⁴ | 0.93 | 6838 | 0.2226 × 10⁻⁴ | 0.73 | −72 |
| Electropolished | - | - | - | - | 21 | 0.3362 × 10⁻⁴ | 0.83 | 1221 | 0.4306 × 10⁻⁴ | 0.79 | −54 |
| 500_100 | 10 | - | 0.1854 × 10⁻⁴ | 0.76 | 102 | 0.1219 × 10⁻⁴ | 0.69 | 1210 | 0.1372 × 10⁻⁴ | 0.96 | −36 |
| 1500_100 | 16 | - | 0.1890 × 10⁻⁴ | 0.85 | 120 | 0.4740 × 10⁻⁴ | 0.87 | 2566 | 0.1042 × 10⁻⁴ | 0.68 | +102 |
| 500_200 | 14 | - | 0.1702 × 10⁻⁴ | 0.89 | 146 | 0.4922 × 10⁻⁴ | 0.84 | 1904 | 0.1158 × 10⁻⁴ | 0.80 | +74 |
| 1500_200 | 26 | - | 0.3217 × 10⁻⁴ | 0.81 | 355 | 0.3986 × 10⁻⁴ | 0.87 | 2642 | 0.1109 × 10⁻⁴ | 0.83 | +51 |
| 500_300 | 25 | - | 0.1908 × 10⁻⁴ | 0.86 | 281 | 0.3704 × 10⁻⁴ | 0.89 | 2201 | 0.1241 × 10⁻⁴ | 0.84 | +145 |
| 1500_300 | 5 | - | 0.2707 × 10⁻⁴ | 0.84 | 410 | 0.2886 × 10⁻⁴ | 0.91 | 2231 | 0.1228 × 10⁻⁴ | 0.83 | +68 |
| Surface Modification | Failure of the Layer | The Value of Registered Indenter Load Fn, N | |||||
|---|---|---|---|---|---|---|---|
| Temp, °C | Cycles | Measurement 1 | Measurement 2 | Measurement 3 | Average | STD | |
| Sandblasted | |||||||
| 100 | 500 | Complete break Lc2 | 0.94 | 0.91 | 0.99 | 1.08 | ±0.04 |
| 1500 | Complete break Lc2 | 1.24 | 1.20 | 1.22 | 1.57 | ±0.02 | |
| 200 | 500 | Complete break Lc2 | 1.95 | 1.90 | 1.96 | 1.64 | ±0.03 |
| 1500 | Complete break Lc2 | 1.35 | 1.33 | 1.35 | 1.93 | ±0.01 | |
| 300 | 500 | Complete break Lc2 | 2.52 | 2.50 | 2.55 | 2.92 | ±0.02 |
| 1500 | Complete break Lc2 | 3.54 | 3.25 | 3.20 | 3.33 | ±0.18 | |
| Electropolished | |||||||
| 100 | 500 | Complete break Lc2 | 0.22 | 0.25 | 0.19 | 0.13 | ±0.03 |
| 1500 | Complete break Lc2 | 0.04 | 0.06 | 0.06 | 0.13 | ±0.01 | |
| 200 | 500 | Complete break Lc2 | 0.21 | 0.23 | 0.20 | 0.62 | ±0.01 |
| 1500 | Complete break Lc2 | 1.08 | 1.02 | 1.01 | 1.16 | ±0.03 | |
| 300 | 500 | Complete break Lc2 | 1.38 | 1.23 | 1.28 | 1.34 | ±0.07 |
| 1500 | Complete break Lc2 | 1.35 | 1.41 | 1.44 | 1.40 | ±0.04 | |
| Sample | Contact Angle θavr. ° | Polar Component γsp. mJ/m2 | Dispersion Component γsd. mJ/m2 | Surface Energy (SEP) γs. mJ/m2 | |
|---|---|---|---|---|---|
| Distilled water | Diiodomethane | ||||
| Sandblasted | |||||
| initial state | 47.92 ± 5.68 | 55.17 ± 0.4 | 38.17 ± 0.23 | 12.97 ± 0.11 | 51.14 ± 0.33 |
| 500_100 | 98.39 ± 1.02 | 58.42 ± 0.23 | 0.52 ± 0.30 | 30.86 ± 0.28 | 31.39 ± 0.26 |
| 1500_100 | 114.46 ± 2.32 | 55.89 ± 0.79 | 1.52 ± 0.09 | 41.64 ± 0.83 | 43.16 ± 0.93 |
| 500_200 | 101.60 ± 3.37 | 57.14 ± 0.25 | 0.08 ± 0.03 | 33.5 ± 0.98 | 33.59 ± 0.82 |
| 1500_200 | 95.60 ± 1.46 | 57.56 ± 1.02 | 0.63 ± 0.69 | 29.23 ± 0.67 | 30.17 ± 0.59 |
| 500_300 | 100.72 ± 3.13 | 61.26 ± 0.2 | 0.36 ± 0.01 | 29.49 ± 0.18 | 29.86 ± 0.16 |
| 1500_300 | 93.47 ± 3.65 | 55.67 ± 2.07 | 1.4 ± 0.23 | 30.51 ± 1.7 | 31.9 ± 1.46 |
| Electropolished | |||||
| initial state | 38.53 ± 4.82 | 50.97 ± 1.68 | 45.20 ± 1.02 | 13.06 ± 0.85 | 58.26 ± 0.17 |
| 500_100 | 96.52 ± 5.63 | 55.32 ± 1.42 | 0.64 ± 0.11 | 32.38 ± 1.19 | 33.03 ± 1.08 |
| 1500_100 | 108.24 ± 1.77 | 56.45 ± 0.25 | 0.26 ± 0.01 | 37.68 ± 0.23 | 37.95 ± 0.23 |
| 500_200 | 100.75 ± 2.93 | 57.45 ± 0.004 | 0.16 ± 0.01 | 32.79 ± 0.23 | 32.95 ± 0.22 |
| 1500_200 | 101.41 ± 2.46 | 58.39 ± 3.65 | 0.16 ± 0.13 | 32.32 ± 3.16 | 32.49 ± 3.03 |
| 500_300 | 106.74 ± 2.04 | 58.96 ± 1.97 | 0.05 ± 0.03 | 34.60 ± 1.78 | 34.65 ± 1.82 |
| 1500_300 | 102.60 ± 3.05 | 55.01 ± 1.2 | 0.005 ± 0.007 | 36.13 ± 1.41 | 36.14 ± 1.40 |
Publisher’s Note: MDPI stays neutral with regard to jurisdictional claims in published maps and institutional affiliations. |
© 2020 by the authors. Licensee MDPI, Basel, Switzerland. This article is an open access article distributed under the terms and conditions of the Creative Commons Attribution (CC BY) license (http://creativecommons.org/licenses/by/4.0/).
Share and Cite
Basiaga, M.; Walke, W.; Antonowicz, M.; Kajzer, W.; Szewczenko, J.; Domanowska, A.; Michalewicz, A.; Szindler, M.; Staszuk, M.; Czajkowski, M. Impact of Surface Treatment on the Functional Properties Stainless Steel for Biomedical Applications. Materials 2020, 13, 4767. https://doi.org/10.3390/ma13214767
Basiaga M, Walke W, Antonowicz M, Kajzer W, Szewczenko J, Domanowska A, Michalewicz A, Szindler M, Staszuk M, Czajkowski M. Impact of Surface Treatment on the Functional Properties Stainless Steel for Biomedical Applications. Materials. 2020; 13(21):4767. https://doi.org/10.3390/ma13214767
Chicago/Turabian StyleBasiaga, Marcin, Witold Walke, Magdalena Antonowicz, Wojciech Kajzer, Janusz Szewczenko, Alina Domanowska, Anna Michalewicz, Marek Szindler, Marcin Staszuk, and Miłosz Czajkowski. 2020. "Impact of Surface Treatment on the Functional Properties Stainless Steel for Biomedical Applications" Materials 13, no. 21: 4767. https://doi.org/10.3390/ma13214767