Application of Mössbauer Spectroscopy for Identification of Iron-Containing Components in Upper Silesian Topsoil Being under Industrial Anthropopressure

 ,
,
Abstract
:1. Introduction
2. Materials and Methods
3. Results and Discussion
4. Summary
Author Contributions
Funding
Acknowledgments
Conflicts of Interest
References and Note
- Sims, I.; Crane, M.; Johonson, I.; Credland, P. Biomonitoring the environmental impact of atmospheric emission from the Avonmouth zinc smelter, United Kingdon. Ecotoxicology 2009, 18, 961–970. [Google Scholar] [CrossRef]
- Murphy, C.F.; Allen, D.T. Hydrocarbon emissions from industrial release events in the Houston-Galveston area and their impact on ozone formation. Atmos. Environ. 2005, 39, 3785–3789. [Google Scholar] [CrossRef]
- Szumiata, T.; Rachwał, M.; Magiera, T.; Brzózka, K.; Gzik-Szumiata, M.; Gawroński, M.; Górka, B.; Kyzioł-Komisińska, J. Iron-containing phases in metallurgical and coke dust as well as in bog iron ore. Nukleonika 2017, 62, 187–195. [Google Scholar] [CrossRef] [Green Version]
- Kierlik, P.; Hanc-Kuczkowska, A.; Męczyński, R.; Matuła, I.; Dercz, G. Phase composition of urban soils by x-ray diffraction and mössbauer spectroscopy analysis. Arch. Metall. Mater. 2019, 64, 1029–1032. [Google Scholar]
- Rachwał, M.; Magiera, T.; Wawer, M. Coke industry and steel metallurgy as the source of sil contamination by technogenic magnetic particles, heavy metals and polycyclic aromatic hydrocarbons. Chemosphere 2015, 138, 863–873. [Google Scholar] [CrossRef] [PubMed]
- Koukouzas, N.; Hämäläinen, J.; Papanikolaou, A.; Tourunen, T.; Jäntii, T. Mineralogical and elemental composition of fly ash from pilot scale fluidized bed combustion of lignite, bituminous coal, wood chips and their blends. Fuel 2007, 86, 2186–2193. [Google Scholar] [CrossRef]
- Lourenco, A.; Gomes, C. Integration of magnetic measurements, chemical and statistical analysis in characterizing agricultural soils (central Portugal). Environ. Earth Sci. 2016, 75, 968. [Google Scholar] [CrossRef]
- Bućko, M.; Magiera, T.; Johanson, B.; Petrovsky, E.; Pesonen, L. Identification of magnetic particulates in road dust accumulated on roadside snow using magnetic, geochemical and micro-morphological analyses. Environ. Pollut. 2011, 159, 1266–1276. [Google Scholar] [CrossRef] [PubMed]
- Jeleńska, M.; Górka-Kostrubiec, B.; Werner, T.; Kądziałko-Hofmokl, M.; Szczepaniak-Wnuk, I.; Gonet, T.; Szwarczewski, P. Evaluatin of indoor/outdoor urban air pollution by magnetic, chemical and microscopic studies. Atmos. Pollut. Res. 2017, 8, 754–766. [Google Scholar] [CrossRef]
- Magiera, T.; Parzentny, H.; Róg, L.; Chybiorz, R.; Wawer, M. Spatial variation of soil magnetic susceptibility in relation to different emission sources in southern Poland. Geoderma 2015, 255, 94–103. [Google Scholar] [CrossRef]
- Chaparro, M.; Lavornia, J.; Chaparro, M.; Sinito, A. Biomonitors of urban air pollution: Magnetic studies and SEM observations of corticolous foliose and microfoliose lichens and their suitability for magnetic monitoring. Environ. Pollut. 2013, 172, 61–69. [Google Scholar] [CrossRef] [PubMed]
- Ewing, S.; Christensen, J.; Brown, S.; Vancuren, R.; Cliff, S.; Depaolo, D. Pb isotopes as ndicator of the Asian contribution to particulate air pollution in ueban California. Environ. Sci. Technol. 2010, 44, 891–9816. [Google Scholar] [CrossRef] [PubMed] [Green Version]
- Gunindi, M.; Tasdemir, Y. Atmospheric polychlorinated biphentyl (pcb) inputs to coastal city near the marmara sea. Mar. Pollut. Bull. 2011, 215, 427–439. [Google Scholar]
- Jordanova, D.; Goddu, S.; Kotsev, T.; Jordanova, N. Industrial contaminaion of alluvial soils near Fe-Pb mining site revealed by magnetic and geochemical studies. Geoderma 2013, 192, 237–248. [Google Scholar] [CrossRef]
- Gupta, S.; Dubikova, M.; French, D.; Sahajwalla, V. Characterization of the origin and distribution of the minerals and phases in metallurgical cokes. Energy Fuels 2007, 21, 303–313. [Google Scholar] [CrossRef]
- Dziubanek, G.; Spychała, A.; Marchwińska-Wyrwał, E.; Rusin, M.; Hajok, I.; Ćwieląg-Drabek, M.; Piekut, A. Long-term exposure to urban air pollution and the relationship with life expectancy in cohort of 3.5 million people in Silesia. Sci. Total Environ. 2017, 580, 1–8. [Google Scholar] [CrossRef]
- Zawadzki, J.; Fabijańczyk, P.; Magiera, T.; Rachwał, M. Micro-scale spatial correlation of magnetic susceptibility in soil profile in forest located in an industrial area. Geoderma 2015, 249–250, 61–68. [Google Scholar] [CrossRef]
- Łukasik, A.; Gruba, P.; Magiera, T. Application of magnetometry to assess distribution of dust pollution in topsoil of under-crown area of Norway spruce (Picea abies Karst.) and European beech (Fagus sylvatica L.). Catena 2017, 150, 246–255. [Google Scholar] [CrossRef]
- Rachwał, M.; Wawer, M.; Magiera, T.; Steinnes, E. Integration of soil magnetometry and geochemistry for assessment of human health risk from metallurgical slag dumps. Environ. Sci. Pollut. Res. 2017, 24, 26410–26423. [Google Scholar] [CrossRef] [Green Version]
- Wawer, M.; Rachwał, M.; Kowalska, J. Impact of noise barriers on the dispersal of solid pollutants from car emissions and their deposition in soil. Soil Sci. Annu. 2017, 68, 19–26. [Google Scholar] [CrossRef]
- Lecoanet, H.; Leveque, F.; Segura, S. Magnetic susceptibility in environmental applications: Comparison of field probes. Phys. Earth Planet. Inter. 1999, 115, 191–204. [Google Scholar] [CrossRef]
- ISO 21226:2019—International ISO Standard: Soil Quality—Guideline for the Screening of Soil Polluted with Toxic Elements Using Soil Magnetometry, 1st ed.; International Organization for Standardization: Geneva, Switzerland, 2019.
- McAndrew, J. Calibration of a Frantz isodynamic separator and its application to mineral separation. Proc. Aust. Inst. Min. Metall. 1957, 181, 59–73. [Google Scholar]
- PMOS—The specialized program for experimental Mössbauer spectra analysis designed by J. Żukrowski for the needs of University of Silesia employees.
- Stevens, J.G.; Khansanov, A.M.; Miller, J.W.; Pollak, H.; Li, Z. Mössbauer Mineral Handbook, Mössbauer Effect Data Center, 3rd ed.; The University of North Carolina: Asheville, NC, USA, 2005; pp. 1–636. [Google Scholar]
- Hatfield, R.; Maher, B. Fingerprinting upland sediment sources: Particle size specific magnetic linkages between soils, lake sediments and suspended sediments. Earth Surf. Process. Landf. 2009, 34, 1359–1373. [Google Scholar] [CrossRef] [Green Version]
- Oldfield, F.; Hao, Q.; Bloemendal, J.; Gibbs-Eggar, Z.; Patil, S.; Guo, Z. Links between particle size and magnetic grain size: General observations and some implications for Chinese loess studies. Sedimentology 2009, 56, 2091–2106. [Google Scholar] [CrossRef]
- Razik, S.; Dekkers, M.; Dobeneck, T. How environmental magnetism can enhance the interpretational value of grain-size analysis: A time-slice study on sediment export to the NW African margin in Heinrich Stadial and Mid Holocene. Palaeogeogr. Palaeoclimatol. Palaeoecol. 2014, 406, 33–48. [Google Scholar] [CrossRef]
- Brown, G.; Brindley, G.W. X-ray Diffraction Procedures for Clay Mineral Identification. In Crystal Structures of Clay Minerals and their X-Ray Identification; Brindley, G.W., Brown, G., Eds.; Mineralogical Society of Great Britain and Ireland: London, UK, 1980; pp. 305–360. [Google Scholar]
- Kalinowski, B.; Schweda, P. Kinetics of muscovite, phlogopite, and biotite dissolution and alteration at pH 1,4, room temperaturę. Geochim. Cosmochim. Acta 1996, 60, 367–385. [Google Scholar] [CrossRef]
- Bailey, S.W. Structures of Layer Silicates. In Crystal Structures of Clay Minerals and their X-Ray Identification; Brindley, G.W., Brown, G., Eds.; Mineralogical Society of Great Britain and Ireland: London, UK, 1980; pp. 1–124. [Google Scholar]
- Kopcewicz, B.; Kopcewicz, M.; Jelenska, M.; Hasso-Agopsowicz, A. Mössbauer study of chemical transformations in soil samples during thermomagnetic measurements. Hyperfine Interact. 2005, 166, 631–636. [Google Scholar] [CrossRef]
- Banerjee, M.; Verma, N.; Prasad, R. Structural and catalytic properties of Zn1–xCuxFe2O4 nanoparticles. J. Mater. Sci. 2007, 42, 1833–1837. [Google Scholar] [CrossRef]
- Kądziołka-Gaweł, M.; Smolka-Danielowska, D. 57Fe Mössbauer spectroscopy investigations of iron phase cmposition in fluidized beds from the ELCHO power plant in Chorzów, Poland. Nukleonika 2017, 62, 101–107. [Google Scholar] [CrossRef] [Green Version]
- Waanders, F.; Vinken, E.; Mans, A.; Mulaba-Bafubiandi, A. Iron minerals in coal, weathered coal and coal ash—SEM and Mössbauer results. Hyperfine Interact. 2003, 148–149, 21–29. [Google Scholar] [CrossRef]
- Szumiata, T.; Gawroński, M.; Górka, B.; Brzózka, K.; Świetlik, R.; Trojanowska, M.; Strzelecka, M. Chemical, magnetic and Mössbauer effect analysis of road dust from expressway. Nukleonika 2013, 58, 109–122. [Google Scholar]
- Silva, G.; Almeida, F.; Ferreira, A.; Ciminelli, V. Preparation and Application of a Magnetic Composite (Mn3O4/Fe3O4) for Removal of As(III) from Aqueous Solutions. Mater. Res. 2012, 15, 403. [Google Scholar] [CrossRef]
- Omer, M.; Elbadawi, A.; Yassin, O. Synthesis and structural properties of MgFe2O4 ferrite nano-particles. J. Appl. Ind. Sci. 2013, 1, 20–23. [Google Scholar]
- Doriguetto, A.; Fernandes, N.; Persiano, A.; Nunes Filho, E.; Greneche, J.; Fabris, J. Characterization of natural magnetite. Phys. Chem. Miner. 2003, 30, 249–255. [Google Scholar] [CrossRef]

| Topsoil Subsample | Grain Size (mm) | Current Intensity (A) | χ (×10−8 m3/kg) |
|---|---|---|---|
| IA (strongly magnetic) | 0.05–0.1 | 0.2 | 247.6 |
| IIA (strongly magnetic) | 0.25–0.5 | 0.2 | 139.4 |
| IB (weakly magnetic) | 0.05–0.1 | 1.6 | 3.6 |
| IIB (weakly magnetic) | 0.25–0.5 | 1.6 | 4.0 |
| Identified Phase | Topsoil Subsample | ||||
|---|---|---|---|---|---|
| Chemical Formula | Mineral (Symbol) | IA | IIA | IB | IIB |
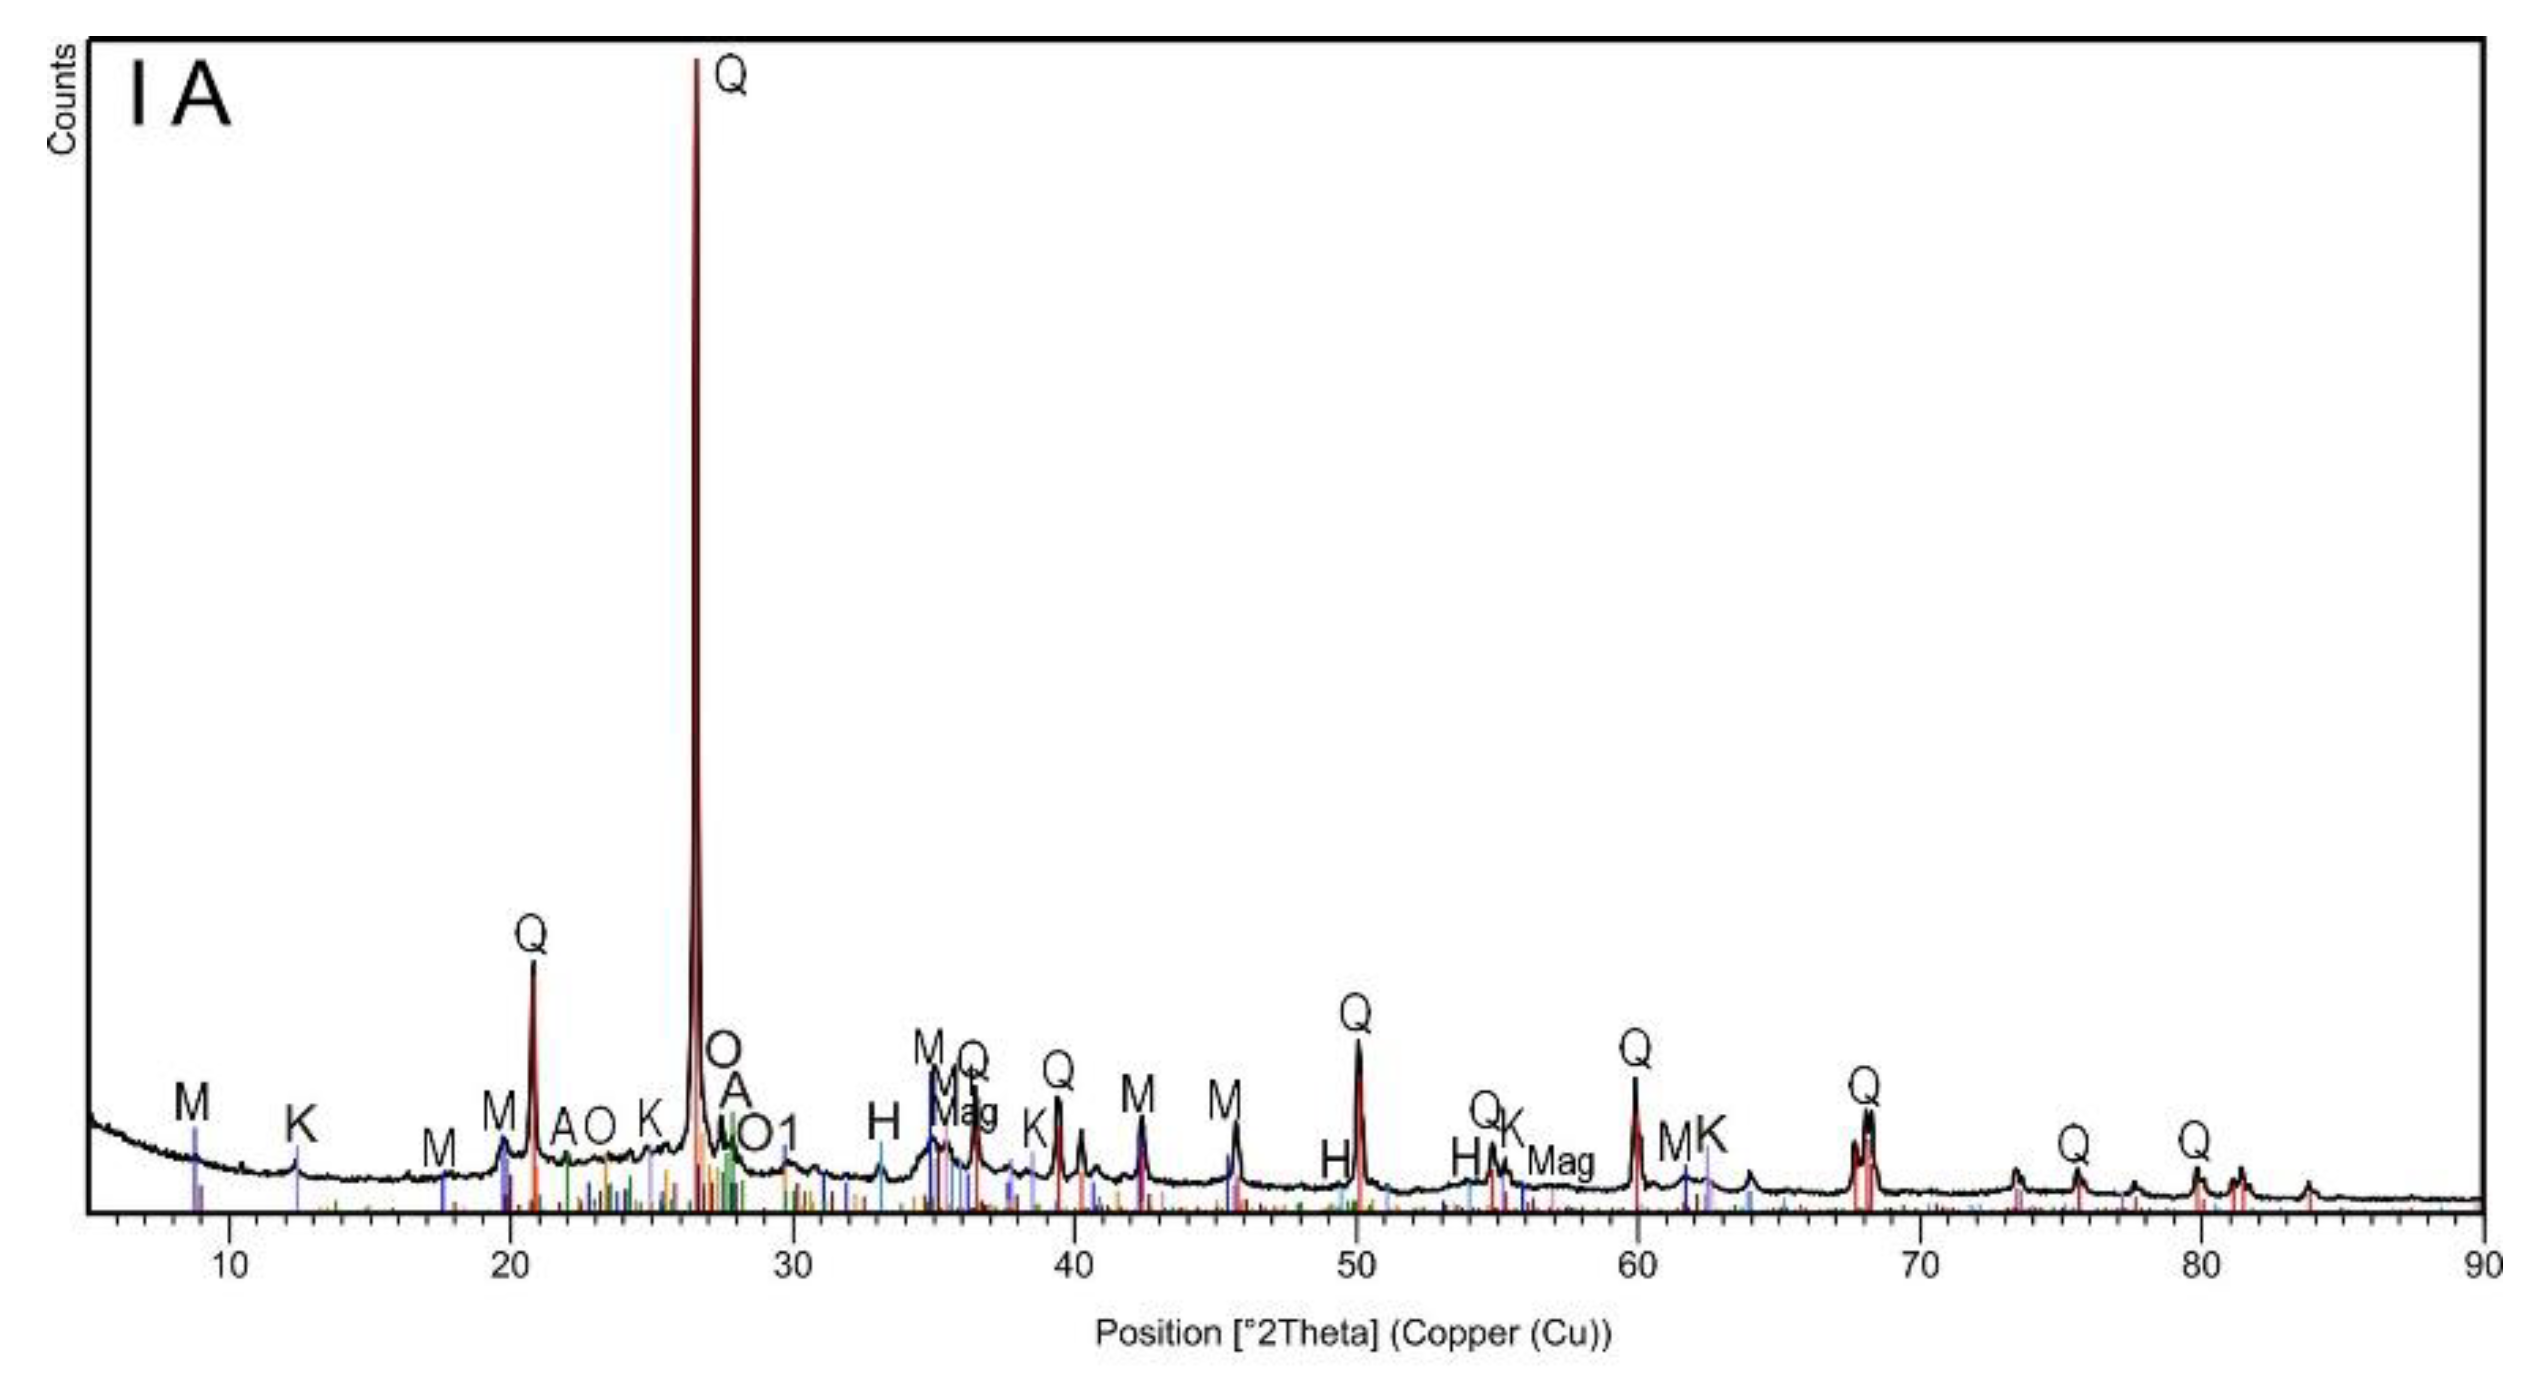
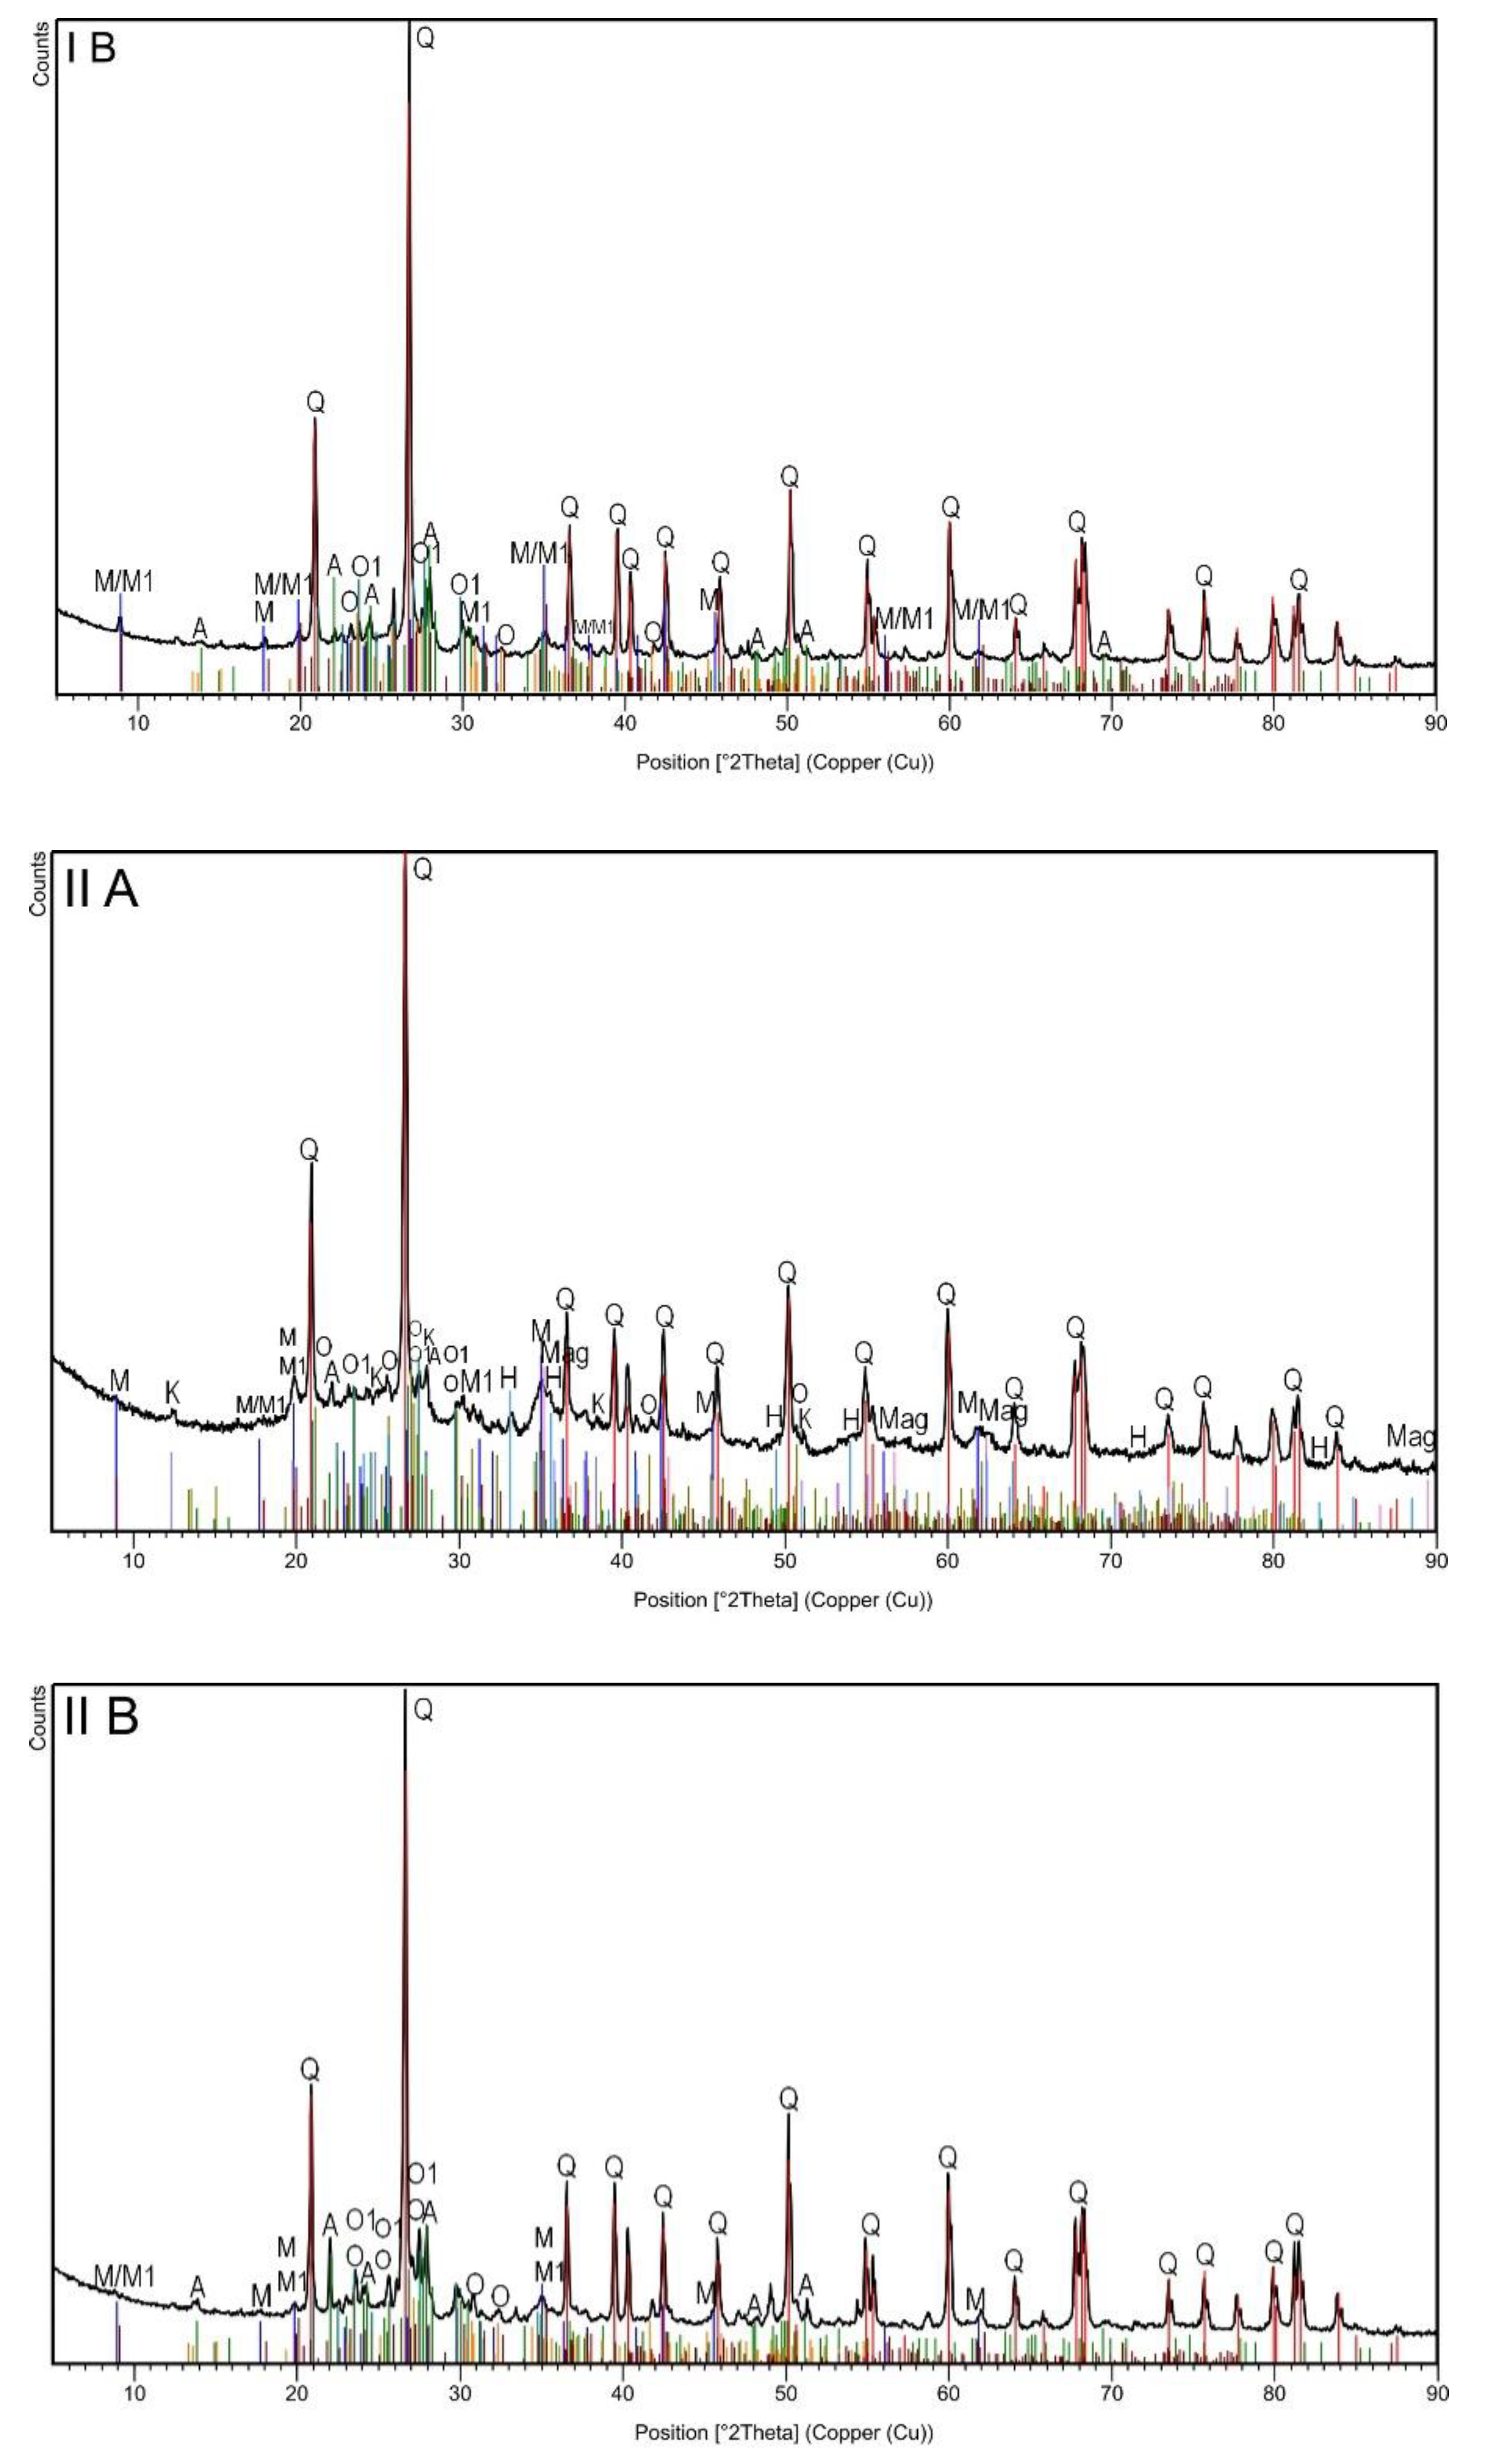
| SiO2 | Quartz (Q) | x | x | x | x |
| H2KAl3(Si04)3 | Muscovite (M) | x | x | x | x |
| K0.60Na0.37Mg0.06Ti0.02Fe0.10Al2.81Si3.03O10(OH)2 | Muscovite -2M1 (M1) | x | x | x | x |
| NaAlSi2O8 | Albite (A) | x | x | x | x |
| Si2 Al2O5(OH)4 | Kaolinite (K) | x | x | ||
| KAlSi3O8 | Orthoclase (O) | x | x | x | x |
| K(Al,Fe)Si2O8 | Orthoclase (O1) | x | x | x | x |
| Fe3O4 | Magnetite (Mag) | x | x | ||
| Fe2O3 | Hematite (H) | x | x | ||
| Subsample | IA | IIA | Iron-Containing Phase | ||||||
|---|---|---|---|---|---|---|---|---|---|
| Component | IS | QS | H | A | IS | QS | H | A | |
| [mm/s] | [mm/s] | [T] | [%] | [mm/s] | [mm/s] | [T] | [%] | ||
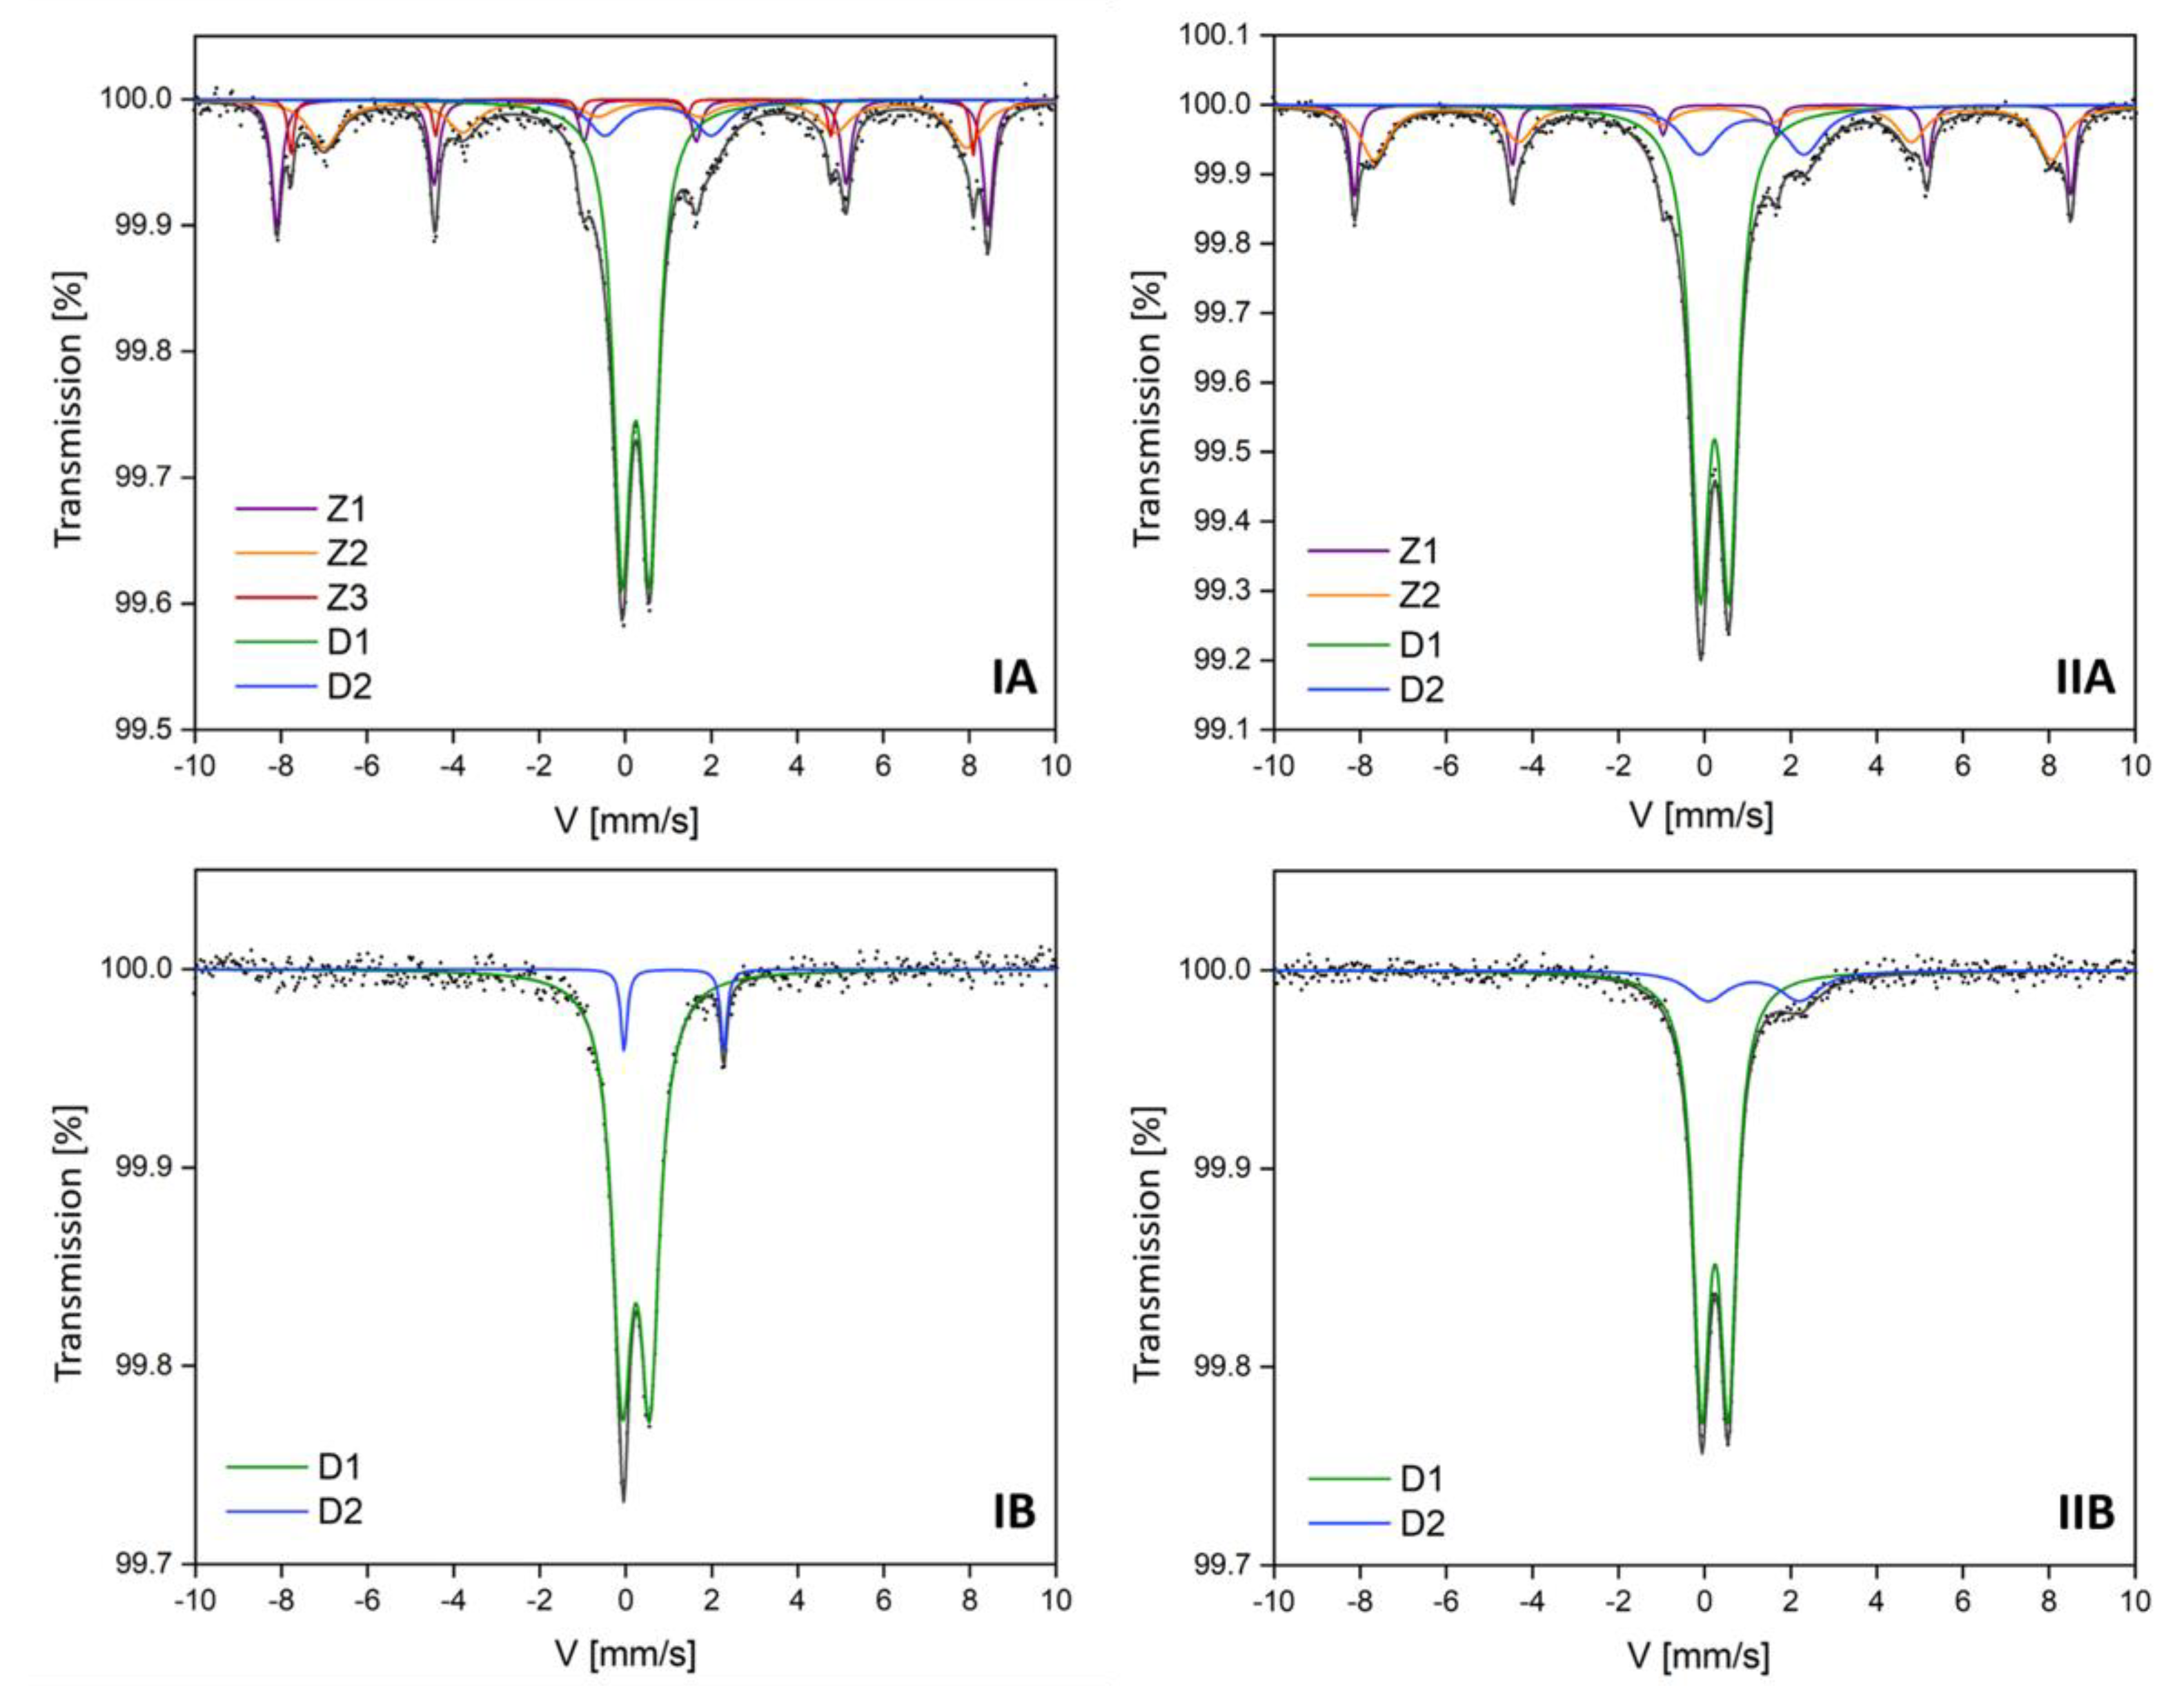
| D1 | 0.35 | 0.64 | 0 | 51 | 0.33 | 0.67 | 0 | 51 | Aluminosilicates with Fe3+ |
| D2 | 0.86 | 2.47 | 0 | 8 | 1.24 | 2.4 | 0 | 14 | Aluminosilicates with Fe2+ |
| Z1 | 0.36 | −0.18 | 51 | 17 | 0.36 | −0.16 | 51 | 19 | Hematite |
| Z2 | 0.61 | −0.08 | 46 | 20 | 0.5 | 0.05 | 46 | 16 | Magnetite |
| Z3 | 0.27 | −0.02 | 49 | 4 | - | - | - | - | |
| Subsample | IB | IIB | Iron-Containing Phase | ||||
|---|---|---|---|---|---|---|---|
| Component | IS | QS | A | IS | QS | A | |
| [mm/s] | [mm/s] | [%] | [mm/s] | [mm/s] | [%] | ||
| D1 | 0.34 | 0.65 | 93 | 0.34 | 0.62 | 85 | Aluminosilicates with Fe3+ |
| D2 | 1.22 | 2.32 | 7 | 1.24 | 2.29 | 15 | Aluminosilicates with Fe2+ |
Publisher’s Note: MDPI stays neutral with regard to jurisdictional claims in published maps and institutional affiliations. |
© 2020 by the authors. Licensee MDPI, Basel, Switzerland. This article is an open access article distributed under the terms and conditions of the Creative Commons Attribution (CC BY) license (http://creativecommons.org/licenses/by/4.0/).
Share and Cite
Kierlik, P.; Hanc-Kuczkowska, A.; Rachwał, M.; Męczyński, R.; Matuła, I. Application of Mössbauer Spectroscopy for Identification of Iron-Containing Components in Upper Silesian Topsoil Being under Industrial Anthropopressure. Materials 2020, 13, 5206. https://doi.org/10.3390/ma13225206
Kierlik P, Hanc-Kuczkowska A, Rachwał M, Męczyński R, Matuła I. Application of Mössbauer Spectroscopy for Identification of Iron-Containing Components in Upper Silesian Topsoil Being under Industrial Anthropopressure. Materials. 2020; 13(22):5206. https://doi.org/10.3390/ma13225206
Chicago/Turabian StyleKierlik, Patrycja, Aneta Hanc-Kuczkowska, Marzena Rachwał, Ryszard Męczyński, and Izabela Matuła. 2020. "Application of Mössbauer Spectroscopy for Identification of Iron-Containing Components in Upper Silesian Topsoil Being under Industrial Anthropopressure" Materials 13, no. 22: 5206. https://doi.org/10.3390/ma13225206