Chemical and Physical Properties of the BLT4 Ultra Capacitor—A Suitable Material for Ultracapacitors


Faculty of Science and Technology, Institute of Materials Engineering, University of Silesia in Katowice, 75 Pułku Piechoty 1a, 41-500 Chorzów, Poland
*
Author to whom correspondence should be addressed.
Materials 2020, 13(3), 659; https://doi.org/10.3390/ma13030659
Submission received: 9 December 2019
/
Revised: 3 January 2020
/
Accepted: 8 January 2020
/
Published: 2 February 2020
(This article belongs to the Special Issue Electroceramic Materials)
Abstract
:This paper describes the properties of a lead-free ceramic material based on barium titanate, designed for the construction of ultracapacitors and sensors used in mechatronic systems. The admixture of lanthanum (La3+) served as a modifier. The ceramic powders were obtained by the solid phase reaction method (conventional method—mixed oxides method—MOM). Technological conditions of the synthesis process were determined on the basis of thermal analysis. The obtained samples are characterized, at room temperature (Tr < TC), by a single-phase tetragonal structure and a P4mm space group. Properly developed large grains (d = 5 µm) contributed to the increase in electric permittivity, the maximum value of which is at the level of εm ≈ 112,000, as well as to a strong decrease in specific resistance in the ferroelectric phase, whereas above the Curie temperature, by creating a potential barrier at their boundaries, there was a a rapid increase in resistivity. The temperature coefficient of resistance of the obtained posistor is 10.53%/K. The electrical properties of the obtained ceramics were examined using impedance spectroscopy. In order to analyze the obtained results, a method of comparing the behavior of the real object and its replacement system in a specific frequency region was used, whereas the Kramer–-Kroning (K–K) test was used to determine the consistency of the measured data. The proper selection of the stoichiometry and synthesis conditions resulted in the creation of an appropriate concentration of donor levels and oxygen gaps, which in turn resulted in a significant increase in the value of electrical permittivity, with small values of the angle of dielectric loss tangent. This fact predisposes the discussed material for certain applications (in the construction of ultracapacitors, among others).
1. Introduction
Barium titanate is a classic example of a perovskite ferroelectric. This material was discovered in the 1940s, but it is currently experiencing a kind of renaissance. BaTiO3 ceramic, not doped and not vacuum-heat treated, is a dielectric. Its resistance is ρ > 1010 Ω cm (for Tr = 20 °C), and when properly doped, synthesized, and sintered, it can be a semiconductor with a resistance equal to ρ = (1 ÷ 102) Ωcm (for Tr = 20 °C) [1]. The strongest changes in conductivity are obtained for BaTiO3 doped with trivalent or pentivalent metals that enter the Ba or Ti subnetwork (Me3+ → Ba, Me5+ → Ti). In place of barium, the following ions may be substituted: Sb3+, Y3+, or lanthanide, and actinide ions (rare earth ions) Sm3+, La3+, Er3+, and Ho3+, and, in titanium ion positions, Ta5+ and Nb5+ ions. These metals are donor centers in BaTiO3. Small amounts of such admixtures (0.1 ÷ 0.3 at.%) cause a change in the conductivity of BaTiO3 by 8 ÷ 10 orders [2,3]. In addition, in the area of ferroelectric phase transition (~120 °C) there is a strong increase in resistivity (3 ÷ 6 orders)—The positive temperature coefficient of resistivity (PTCR) effect. In most cases, the introduction of lanthanide and actinide admixtures in BaTiO3 in excessive amounts or with the use of molar doping allows the procurement of semiconductive materials exhibiting a posistor effect [4].
Doped ceramic materials based on barium titanate, free from lead, undoubtedly have a wide range of application possibilities in the field of the so-called green, environmentally friendly technologies. They find practical applications in classic capacitors, thermistors and varistors [5,6,7,8], and are also used as components for the construction of multi-layer capacitors (multi-layer ceramic capacitor (MLCC)), piezoelectric sensors, and piezoelectric transducers [9,10,11]. Ceramic materials based on barium titanate are also used for the construction of ferroelectric random access memory (FeRAM) [12]. It is impossible not to also mention the integrated microelectronic-electro-mechanical systems (MEMS), in which appropriately modified ceramic material based on the BaTiO3 compound acts as a building material [13].
The literature on the subject reveals that barium titanate is a relatively easily modifiable compound, where one of the most effective additives is lanthanum [14,15,16,17]. Not without significance is its impact on increasing the specific resistance of BaTiO3, as well as a slight temperature dependence of electrical permittivity over a wide temperature range. Barium titanate and lanthanum oxide form solid solutions with each other and are described by the formula Ba1−xLaxTi1−x/4O3. The ions of La3+ lanthanum are introduced into subnet A of the ABO3 perovskite structure, in place of Ba2+ barium ions, acting as a donor dopant.
An additional positive charge is introduced into the sample, together with the lanthanum ions, which causes disruption of the electrical balance. The compensation of excess electrical charge (in order to preserve the electro-neutrality of the crystal lattice) can occur through the creation of cationic vacancies in the subnets A and B of the ABO3 structure (ion compensation) or by introducing an additional electron (electron compensation) [18]. Ion compensation gives a very weak effect and, at room temperature, the material is an insulator. In contrast, electronic compensation is the reason for the increase in conductivity, in which the number of charge carriers equals the charge of the lanthanum ion [16]. Lanthanum barium titanate is an alternative material to other lead-free perovskites such as K0.5Na0.5NbO3 [19], (K0.38Na0.52Li0.04)-(Nb0.86Ta0.1Sb0.04)O2.97 [20,21], and KNbO3 [21]. The BLT4 ceramics presented in the manuscript are characterized by a high value of dielectric permittivity at room temperature as well as at Curie temperature. Such high values of electric permittivity are not found for other representatives of the BLT system obtained by the classical method. The material in question can therefore be an attractive alternative in the construction of ultra-capacitors. Other properties (posistors application, among others) are very important for further application in sensors used in mechatronic systems.
The above-mentioned premises influenced the decision to undertake intensive research on barium titanate modified with lanthanum. As a result of the intensified activities described in earlier publications, ceramics with extremely interesting and previously unheard of application properties were obtained.
2. Sample Preparation
Lanthanum barium titanate (BLT4) was obtained by donor doping of pure BaTiO3 (BT) with La3+ lanthanum ions in amounts of 0.4 mol.%. The starting materials for obtaining BLT4 ceramics by the conventional (oxide) method were compounds for analysis: barium carbonate, BaCO3, lanthanum oxide, La2O3, and titanium (IV), TiO2—from Sigma–Aldrich. The substrates were weighed in a stoichiometric ratio, taking into account the expected chemical reaction:
0.996 BaCO3 + 0.002 La2O3 + 0.999 TiO2 → Ba0.996La0.004Ti0.999O3 + 0.996 CO2↑.
In this way, BLT4 powders with the desired composition were obtained. The prepared material was dry mixed in a porcelain mortar for t = 1 h, and then subjected to wet milling with the addition of C2H5OH ethyl alcohol (99.99%, POCH), in a planetary ball mill for t = 24 h, using zirconium-yttrium balls as grinders.
The synthesis process was carried out at the temperature Ts = 950 °C (during t = 2 h). The next phase of technological work was a three-stage sintering in an air atmosphere. The first two sinterings took place at TI = 1250 °C and TII = 1300 °C, respectively, for 2 h each. The third sintering process was carried out at three different temperatures. The obtained ceramic material was subjected to density, porosity, and water absorption tests (Table 1). Test results indicated that sintering at T3 = 1350 °C best affects the basic parameters of ceramics.
3. Experimental Procedure
The crystalline structure of the investigated ceramics was studied using X-ray diffraction technique (XRD). The measurements were done at room temperature using an X’Pert Pro diffractometer (X‘Pert-Pro, Philips, Amsterdam, The Netherlands) equipped with CuKα1 and α2 radiation (40 kV, 30 mA). Diffraction patterns were measured in step-scan mode in the angular range from 10° to 90° 2θ, with a measuring step of 0.04° and a counting time of 10 s per step. Morphology of the BLT4 ceramics was observed with a scanning electron microscope (SEM) (Hitachi S-4700, Tokio, Japan).
The grain size measurements were performed on the fractured surface of the sintered ceramic samples, which were coated with gold to provide electrical conductivity and to avoid any charging effects. The temperature characteristics of dielectric permittivity and loss factor, as well as impedance data, were measured using an impedance analyzer (HP 4192A, Hewlett-Packard, Palo Alto, CA, USA) in the 20 Hz–2 MHz frequency range. The thermoresistive properties were investigated using a computerized automatic system based on a pikoamperometer (Keithley–6485, Cleveland, OH, USA). The samples intended for electrical measurements had the shape of discs with a diameter of 1 mm and a thickness of 0.5 mm. The properly cut and polished samples were coated with silver electrodes, using a silver paste.
4. Crystal Structure and Microstructure
X-ray diffraction patterns of the investigated materials are presented in Figure 1. The detailed analysis showed that, at room temperature (Tr < TC), the grains of the crystalline phase are single-phase, have a perovskite type structure with tetragonal symmetry (a0 = b0 ≠ c0, α = β = γ = 90°), have a primitive P Bravais unit cell, a 4mm point group, and a P4mm space group. Using the Rietveld method [22], the unit cell parameters were determined based on the X-ray spectra obtained: a0 = 0.3992 nm, c0 = 0.4020 nm, its volume, V, = 64.20 × 10⁻³⁰ m3, and homogeneous tetragonal deformation parameter, δT = 1.0070.
It should also be mentioned that a detailed analysis of diffraction reflections indicates that they are not excessively widened, which indicates low stresses in the crystal structure.
The tested BLT4 ceramic material was also subjected to microstructural analysis. Figure 2 presents SEM images of the microstructure for a magnification of ×10,000 together with X-ray microanalysis (EDS) emission spectra of the obtained BLT4 ceramics.
The appearance of the microstructure indicates that, during the fractures, some cracks occurred through the grains (transcrystalline cracks). The resulting ceramics are characterized by well-shaped large angular grains (d = 5 µm), with a tendency to spiral hexagonal growth. This two-dimensional grain growth mechanism significantly increases a single grain, and consequently increases the strength of the resulting ceramics. The qualitative results of the chemical composition analysis, carried out by the method of X-ray microanalysis, clearly indicate the chemical homogeneity of the samples and the absence of foreign admixtures and impurities. The quantitative analysis of the chemical composition was aimed at determining the degree of compliance of the actual element content with theoretical stoichiometry. The stoichiometric ratio of the starting components was converted into elements: oxygen (O), titanium (Ti), barium (Ba), and lanthanum (La). The difference between the theoretical and experimental chemical composition was ±2 wt.%, which is within the error limits of the method used (Table 2).
In summary, both point and surface EDS analyses performed for BLT4 ceramic samples confirmed the purity, as well as the experimentally assumed qualitative and quantitative composition, of the tested material.
5. Dielectric Properties
The most important characteristic in the study of the dielectric properties of materials is the temperature dependence of electric permittivity (ε), which allows determination of the temperatures of phase transitions, as well as giving information about their type. In turn, the temperature characteristics of the tangent of the angle of dielectric loss (tanδ) allows us to draw conclusions about the loss of the tested material. The ε and tanδ temperature characteristics were measured at several selected frequencies of the measuring field, selected in the range f = (200 ÷ 1000) Hz, in the temperature range (20 ÷ 210) °C (Figure 3).
The obtained material shows a sharp phase transition, taking place at a temperature of TC = 120 °C and is characterized by a gigantic electrical permittivity value, which, at TC temperature, is εmax = 118,764 for the frequency of the measuring field f = 200 Hz. Electrical permittivity at room temperature reaches ~40,000 and is only slightly dependent on the frequency of the measuring field (∆ε = ε200Hz−ε1000Hz = 42,409 − 39,497 = 2912). Frequency dispersion intensifies around the Curie temperature and is ∆ε = ε200Hz − ε1000Hz = 19,624, which constitutes 25% εmax200Hz. The values of dielectric permittivity at room temperature is very high in comparison with the other members of the BLT system. For example, the dielectric permittivity of Ba0.08La0.02TiO3 is smaller than 1000 [23]. Similar values of ε are characteristic for B1−xLaxTiO3 (0.001 ≤ x ≤ 0.005) [24]. The sources of frequency dispersion should be seen in the increasing share of spatial charge in the sample volume and its polarization. It should be remembered that by admixing barium titanate with lanthanum, the trivalent La3+ lanthanum ions are substituted for the divalent Ba2+ barium ions, which results in an imbalance in the crystal lattice. In order to preserve the electrical neutrality of the unit cell, compensation mechanisms are activated, which are involved in creating VTi, VBa, VO vacancies. Literature reports indicate that, for low concentrations of lanthanum, neutrality of the crystal lattice is achieved by generating oxygen vacancies, which confirms the pale blue color of the obtained samples [11,24,25,26].
It is worth noting that the ceramics in question are characterized by low dielectric loss. At room temperature, the tangent of the loss angle is tanδmin ≈ 0.083, and at the phase transition temperature it is tanδmax ≈ 0.197. The low dielectric loss of the ceramic material in question is extremely important from the application point of view.
A single sharp maximum appears on the ε(T) characteristics, while the 1/ε(T) relationship (Figure 4) satisfies the Curie–Weiss law in a wide range of temperatures of the paraelectric phase, starting from the Curie temperature. These facts indicate that the materials in question undergo a sharp phase transition.
Adjusting the above-mentioned Curie–Weiss law to the experimental data allowed us to determine the values of the Curie–Weiss temperature (T0 = 75 °C) and Curie constant (C = 4.20 × 10⁵ °C). In the examined ceramics, the Curie–Weiss temperature is located below the Curie temperature, which is a characteristic feature of ferroelectrics with a sharp phase transition and is characterized by a slight transformation blur. A summary of the basic dielectric parameters of BLT4 ceramics obtained at a measurement field frequency of f = 1 kHz is presented in Table 3.
6. Electrical Properties
The electrical conductivity of ceramics is closely related to the relaxation processes that take place inside it, i.e., in the areas of grains, intergranular boundaries, and electrode areas [27]. The question arises as to what particular role lanthanum plays in creating the conductivity of grains and grain boundaries. An in-depth analysis of the obtained results of impedance spectroscopy measurements will provide the answer to this question. Figure 5 shows the impedance spectra as a function of frequency obtained for several temperatures in the 330–550 °C range.
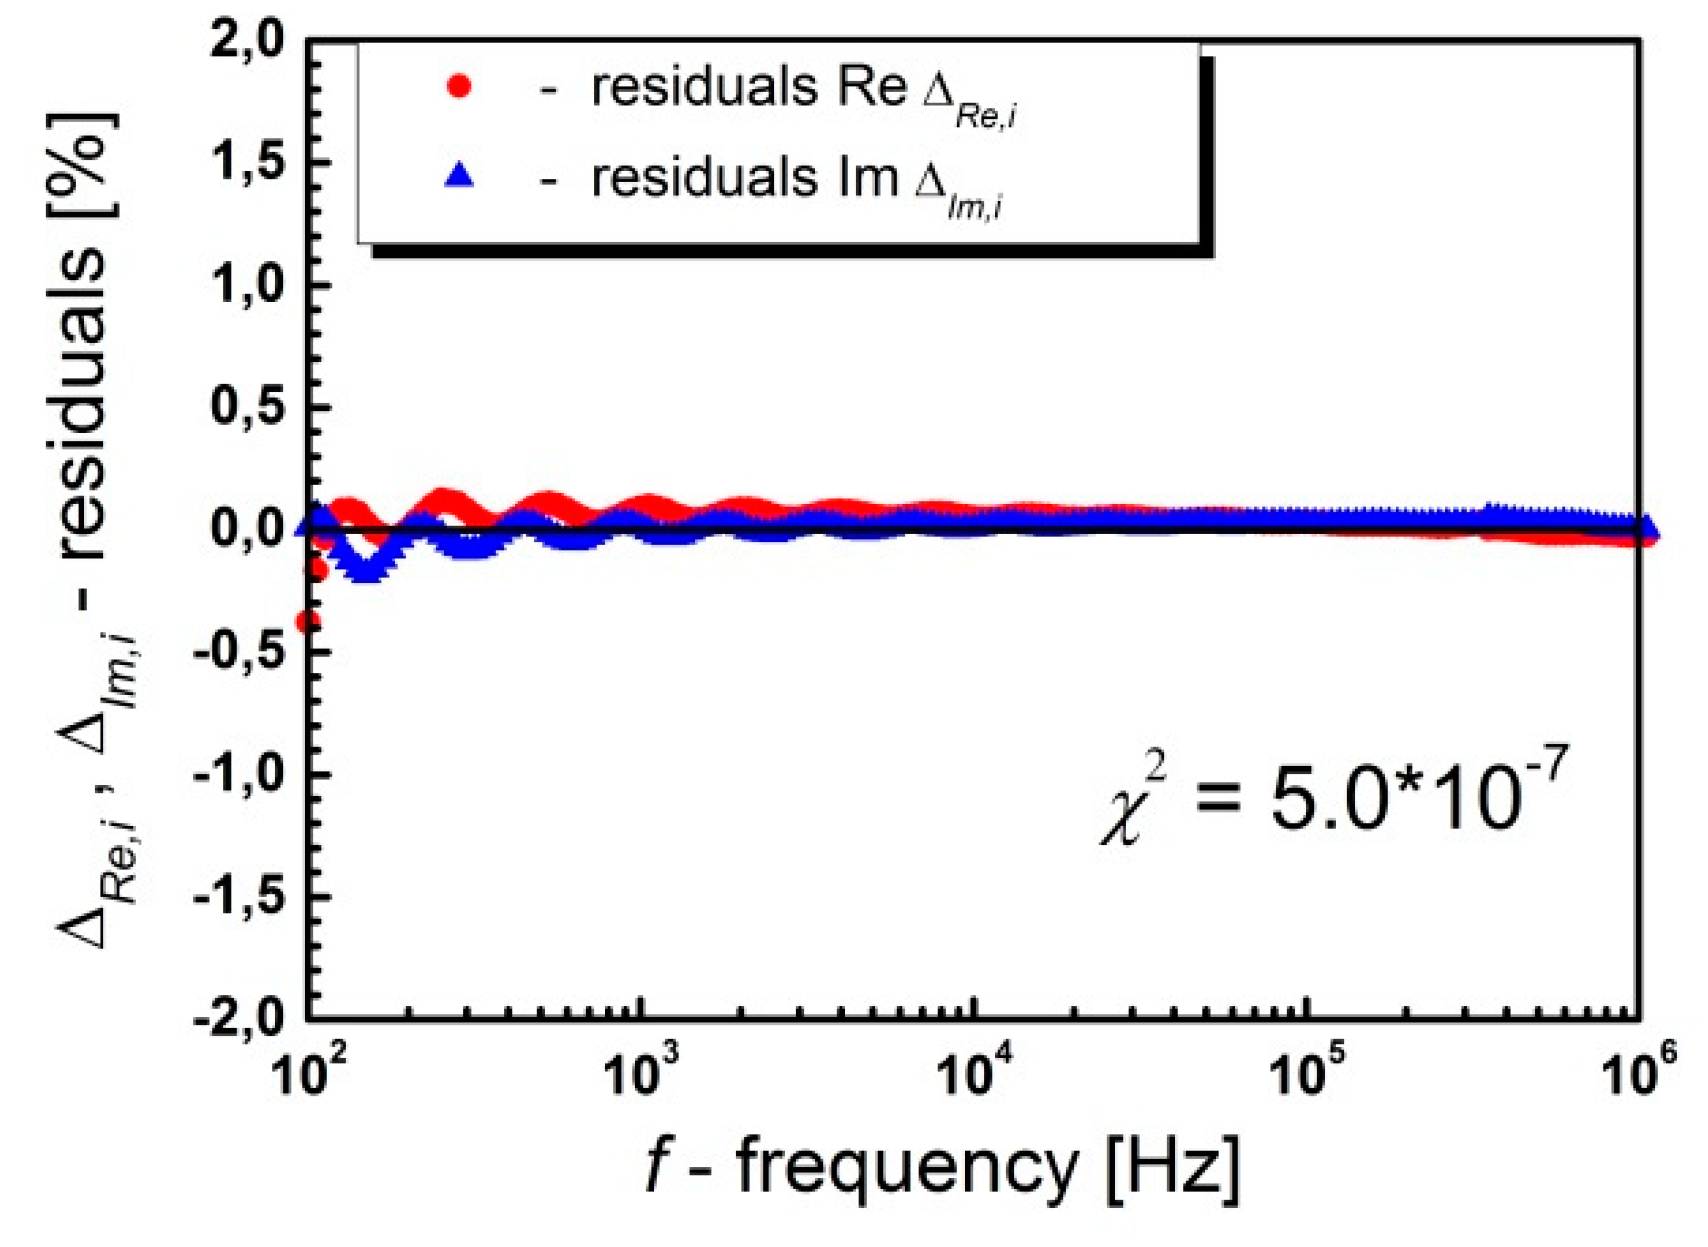
The measuring points, representing the impedance experimental data, are arranged on smooth curves, which allow us to presume the correctness of the measurement. In order to obtain complete certainty as to the consistency of the measurement data, a test was carried out based on the Kramers–Kroning (K–K) equations [28,29,30]. Sample residual spectra showing the frequency relationship of the relative difference between the experimental data and the data obtained as a result of the K–K test for BLT4 ceramics at a temperature of T = 230 °C are shown in Figure 6.
The value of residuals did not exceed 0.5%, and their distribution relative to the frequency axis is random, which clearly suggests that the obtained impedance data are consistent and consistent with the assumed model. They can therefore be subjected to further detailed analysis.
One of the characteristics of Zim(f) of BLT4 ceramics, in the studied temperature range, appears in the low frequency range (10 ÷ 1000) Hz, well outlined local maximum, whose position on the frequency axis shifts to higher values with increasing measurement temperature. The observed changes are more of a change in the slope of the curves than a sharp maximum. In contrast, the relationship, logZre(f), is characterized by rapid changes in almost the entire frequency range studied. In addition, in the case of this ceramic, there are no noticeable large temperature changes in logZre(f) values—it can be said that the characteristics, starting from a frequency of 100 Hz, almost combine into one run for all temperatures tested. Most likely, this behavior is caused by the release of the spatial charge as a result of a change in the potential barrier [31,32].
The next stage in the interpretation of the received impedance spectra was the selection of an electric replacement system that fully describes the phenomena occurring inside the ceramic material.
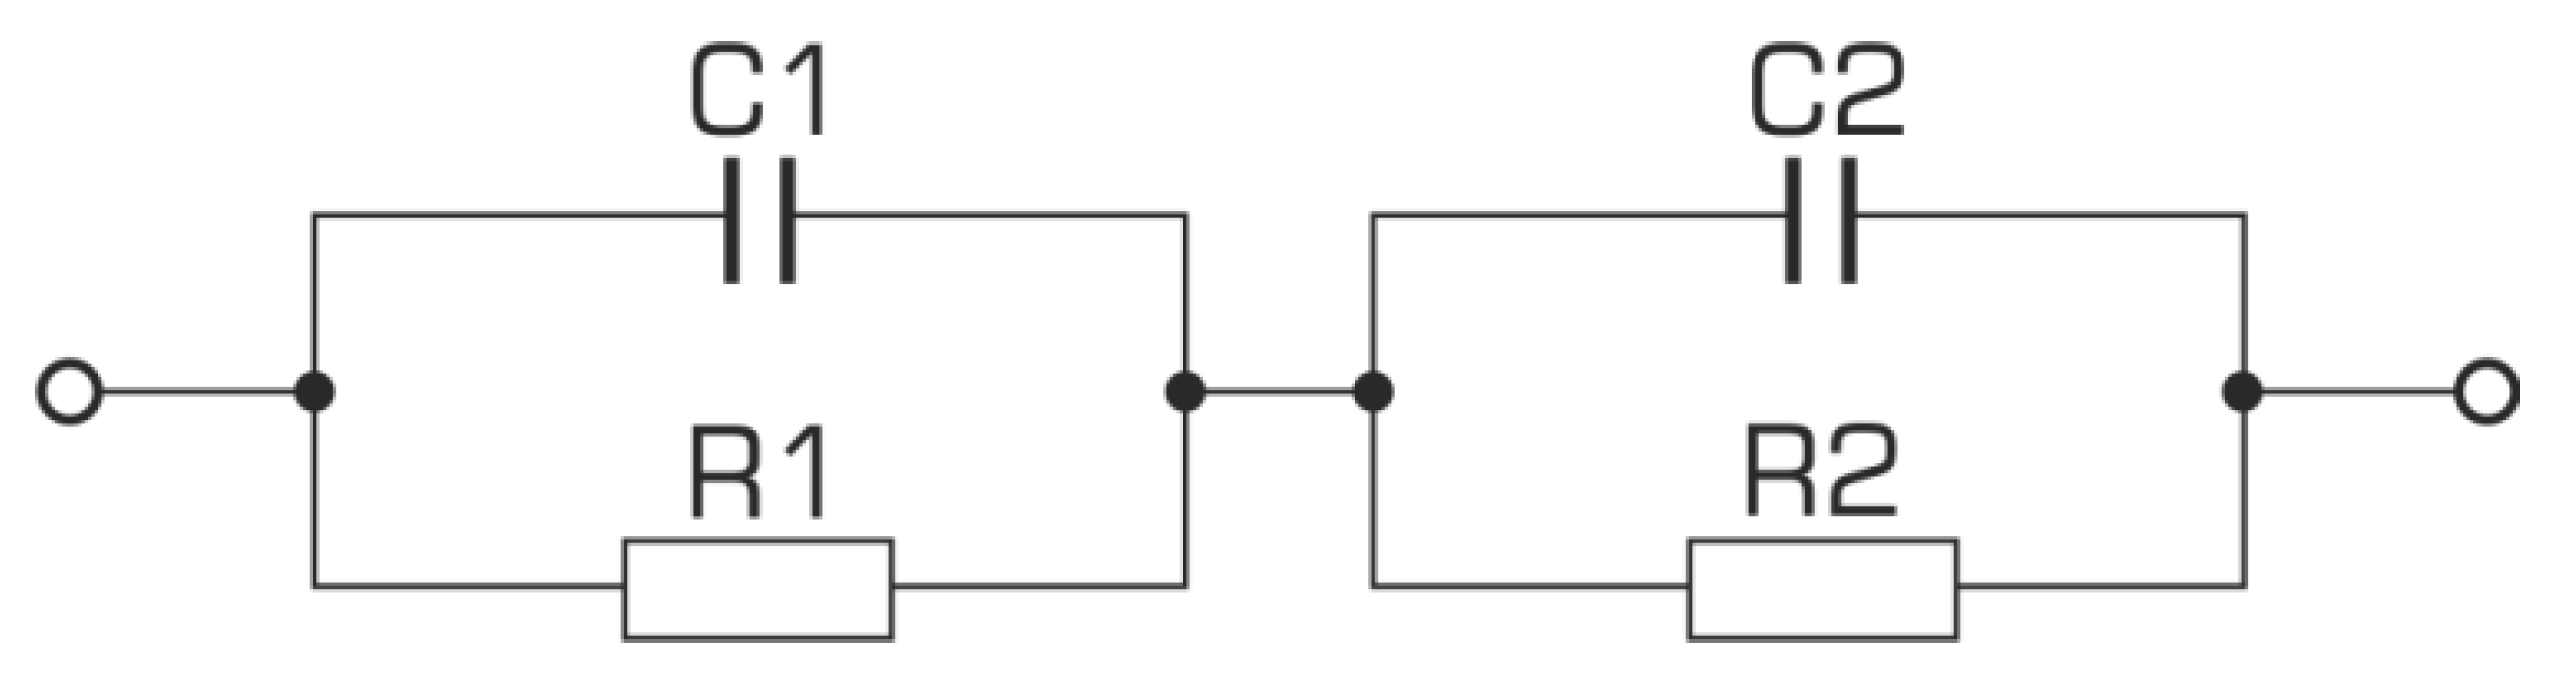
It is known that ionic or mixed conductivity occurs in compounds of the perovskite type structure; both grains and grain boundaries, as well as electrode areas, contribute to the impedance value [33,34]. The complexity of the occurring phenomena makes finding an appropriate replacement system that correctly represents the individual components of the sample difficult. An additional nuisance is the fact that it is possible to find more than one replacement system that correctly simulates the measured electrical response. So the question arises of which of the systems is a correct reflection of the properties of the electrically active areas of the sample that are connected to each other. Presentation of the electrical response of the system on the complex plane obtained as a result of measurements of the so-called Nyquist charts make it much easier to choose the right layout. In an ideal situation, to describe this type of impedance spectra, a substitute system is used, consisting of serially connected RC elements, representing a lossy capacitor, and consisting of capacitors (C) and resistance (R) connected in parallel (Figure 7).
The attempts undertaken to match the discussed system to experimental data did not bring a satisfactory result, which was clearly indicated by the large values of approximation errors of the real and imaginary impedances placed on the fit compatibility graph (Figure 8).
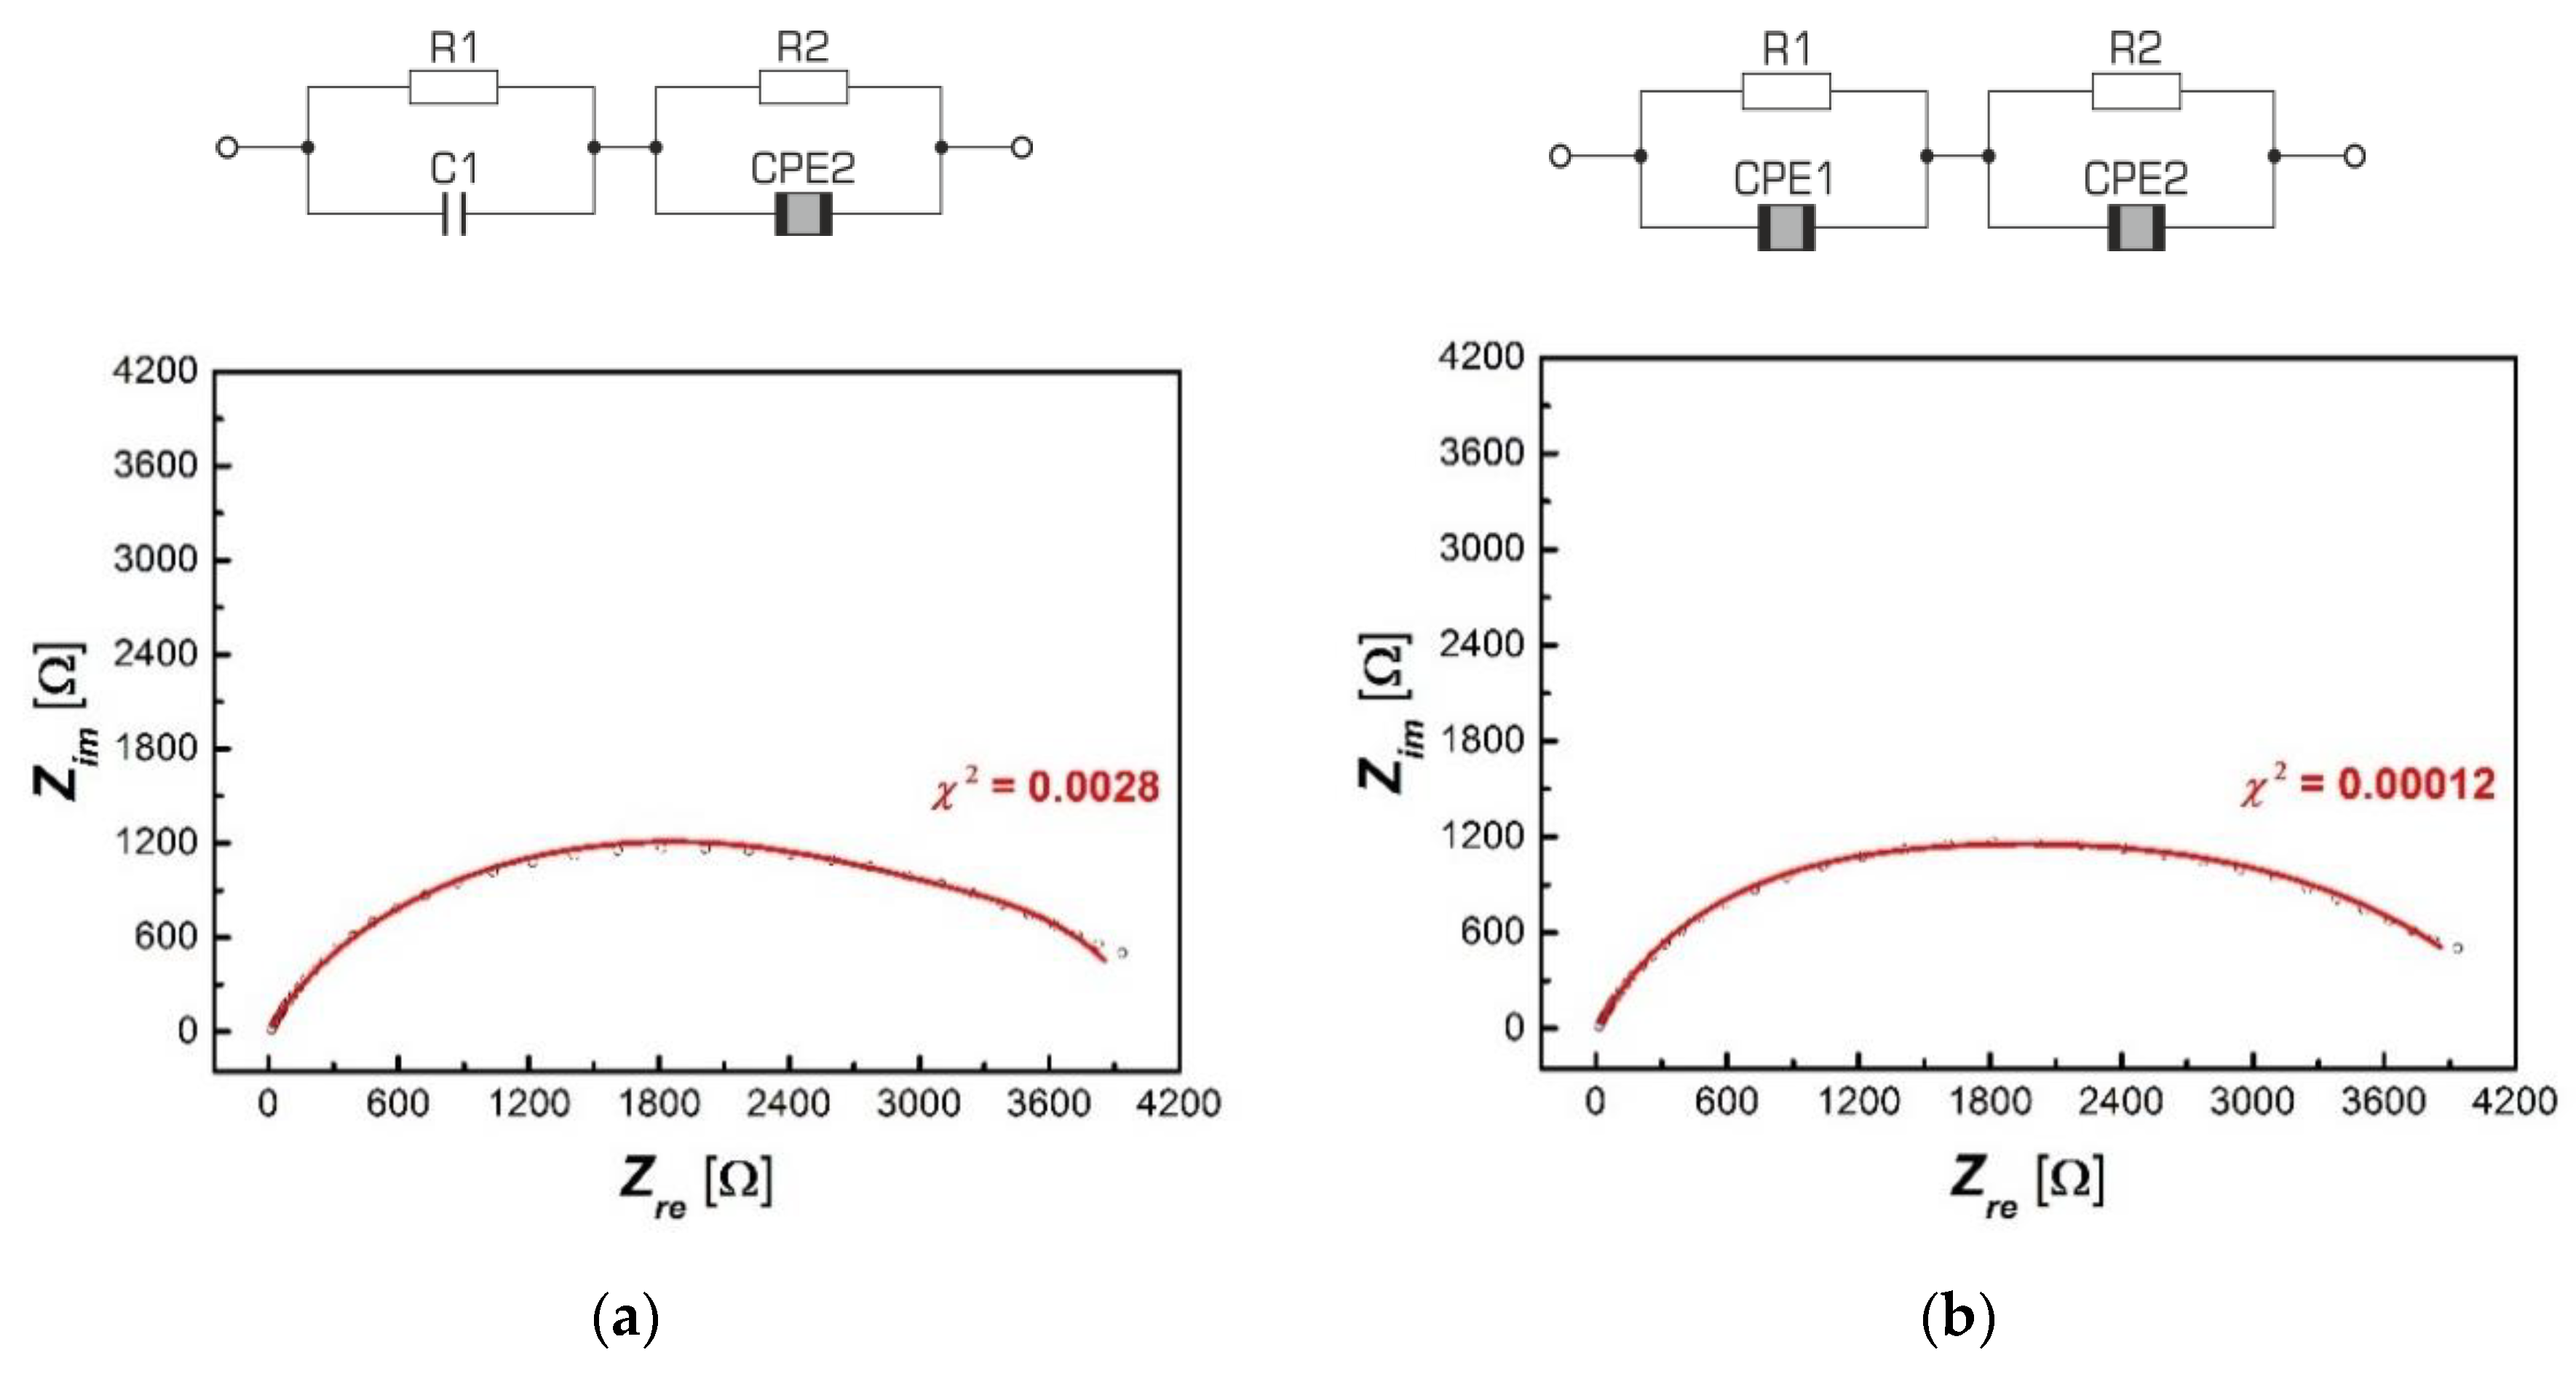
Consequently, the replacement system had to be modified. Based on the literature data on impedance spectrum analysis [35], two circuits were proposed for further testing, slightly different from the original system. The difference was the replacement of one or two capacitive elements with constant-phase elements CPE (Figure 9).
The proposed solutions are often used in the analysis of the electrical response of solids [36]. The use of CPE elements is a common practice, not only in the case of testing the electrical properties of systems based on lanthanum barium titanate [36,37], but also other compounds with crystal structures significantly differing from classic perovskites [38,39].
The discussed modification significantly improved the quality of the fittings obtained for BLT4 ceramics, which is visible in Figure 10, with much better results when using the double CPE element (Figure 10b), which confirms the minimal discrepancy between the measuring points and the matching curves and a smaller value of the numerical parameter matches χ2.
The characteristics of Zim(Zre) take the form of deformed, at times asymmetrical, single semi-circles, and their shape allows us to conclude that the obtained relationships are the result of the imposition of two semi-circles representing the electrical response of grains and grain boundaries. The selected replacement circuits (consisting of two serially connected RC elements, modified with one or two constant phase CPE elements) were used to analyze the impedance data obtained for BLT4 ceramic samples. As a result of the adjustments made, the temperature dependence of the individual parameters of the above-mentioned replacement systems was determined, in particular the resistivity of both RC elements, which—as already mentioned—can be interpreted as the resistivity of grains and grain boundaries. The obtained results indicate that the resistivity of grain boundaries is much higher (RGB = 2741 Ω) than the resistivity of the grains themselves (RG = 149 Ω). For each case, the relation lnRG(1/T) and lnRGB(1/T) was plotted—Figure 11.
The presented relationships can be described by a linear function, which indicates the activation nature of the process and, thus, can be described using the Arrhenius Formula (2):
R = R0exp(−Ea/kT) .X
Based on the expression (2), activation energy of conductivity processes in grains, EG = 0.87 ± 0.02 eV, and grain boundaries, EGB = 0.89 ± 0.01 eV, was determined. The difference between the activation energy value of grains and inter-grain boundaries is small, which indicates no reduction in ion mobility within the grain boundaries.
7. Thermoresistive Properties
The results of tests on direct current electrical conductivity of BLT4 ceramics, obtained at a constant voltage of U = 10 V in the temperature range (20 ÷ 200) °C, are shown in Figure 12, in the form of a specific resistivity (ρ) depending on the temperature (T). In the temperature range 120 °C–170 °C the PTCR effect is visible.
An important factor in the description of the PTCR effect is the value of the temperature resistance coefficient, αT, which is defined as the relative change in resistance related to temperature change and can be calculated for each point on the R(T) curve:
In the range of resistance jump between RPTCmin and RPTCmax, the αT factor can be considered approximately constant, which causes the relationship (4) to take the following form:
Additional posistor parameters, in addition to the basic dependence of the resistance on the temperature and the temperature coefficient of resistance (αT), are also the values of resistance at different temperatures (ρmin and ρmax), the temperature of the beginning of resistance increase (TPTCRmin), and the maximum temperature of resistance (TPTCRmax), thermal-time constants and voltage dependencies, dissipated power factor, and heat capacity of the element [2]. Based on the course of the R(T) function and Formula (4), the basic posistor parameters of BLT4 ceramics were calculated. The obtained values are summarized in Table 4.
The analysis of the above results clearly shows that BaTiO3 ceramic containing 0.4 mol.% lanthanum has properties characteristic for posistors and has a positive temperature coefficient (αT = 10.53%/K) in the temperature range (120 ÷ 170) °C. For comparison, the leading lead-free posistor ceramic based on barium titanate has a αT factor of 21.4%/K [40], and, in the best ceramic posistor, the parameter discussed can have values up to 30%/K [41]. The wide temperature range of the PTCR effect in the obtained materials also deserves to be emphasized.
8. Conclusions
The results of X-ray examinations clearly indicate that, as a result of the technology used, a single-phase material was obtained exhibiting a perovskite-type structure with tetragonal symmetry at room temperature. The appropriate selection of dopant concentration, as well as the technological conditions, resulted in obtaining ceramics characterized by well-shaped large angular grains (d = 5 µm), with a tendency to spiral hexagonal growth. Such shaped grains affect the high quality of ceramics, increasing their mechanical strength. The proper selection of the synthesis conditions resulted in the creation of an appropriate concentration of donor levels and oxygen gaps, which in turn resulted in a significant increase in the value of electrical permittivity, with small values of the angle of dielectric loss tangent. This fact predisposes the discussed material for certain applications (in the construction of ultracapacitors, among others). The appropriate level of material defect also affected the lack of reduction of ion mobility within the grain boundaries and the appearance of posistor properties in the temperature range of 120 ÷ 170 °C.
An additional advantage of the material obtained is that it is an economic and environmentally friendly technology. The discussed ceramic material could be successfully used in innovative electronic components dedicated to applications in modern mechatronic and automatic systems.
Author Contributions
B.W.-D. the main author and originator of the work, carried out thermoresistive measurements and SEM measurements, M.A.-H. carried out and interpretation impedance spectroscopy measurements, T.G. carried out research and interpretation X-ray tests, D.B. carried out review and editing. All authors have read and agreed to the published version of the manuscript.
Funding
The work was partially financed by the Polish Ministry of Science and Higher Education within statutory activity.
Conflicts of Interest
The authors declare no conflict of interest.
References
- Xu, Y. Ferroelectric Materials and their Applications; North-Holland: Amsterdam, The Netherlands, 1991. [Google Scholar]
- Hozer, L. Półprzewodnikowe Materiały Ceramiczne z Aktywnymi Granicami Ziarn; PWN: Warszawa, Poland, 1990. [Google Scholar]
- Mukherjee, N.; Roseman, R. Microstructural Dependence of the Voltage Sensitivity of the PTCR Effect in Donor Doped Barium Titanate. Ferroelectrics 2002, 281, 19–34. [Google Scholar] [CrossRef]
- Busca, G.; Buscaglia, V.; Leoni, M.; Nanni, P. Solid-state and surface spectroscopic characterization of BaTiO3 fine powders. Chem. Mater. 1994, 6, 955–961. [Google Scholar] [CrossRef]
- Ianculescu, A.; Mocanu, Z.V.; Curecheriu, L.P.; Mitoseriu, L.; Padurariu, L.; Trusca, R. Dielectric and tunability properties of La-doped BaTiO3 ceramics. J. Alloys Compd. 2011, 509, 10040–10049. [Google Scholar] [CrossRef]
- Vijatović Petrović, M.M.; Bobić, J.D.; Grigalaitis, R.; Stojanović, B.D.; Banys, J. La-doped and La/Mn-co-doped barium titanate ceramics. Acta Phys. Pol. A 2013, 124, 155–160. [Google Scholar] [CrossRef]
- Wodecka-Dus, B.; Plonska, M.; Czekaj, D. Synthesis, microstructure and the crystalline structure of the barium titanate ceramics doped with lanthanum. Arch. Metall. Mater. 2013, 58, 1305–1308. [Google Scholar] [CrossRef] [Green Version]
- Morrison, F.D.; Sinclair, D.C.; West, A.R. Principles and Applications of Ferroelectrics and Related Materials; Clarendon Press: Oxford, UK, 1977. [Google Scholar]
- Xu, J.B.; Zhai, J.W.; Yao, X. Structure and dielectric nonlinear characteristics of BaTiO3 thin films prepared by low temperature process. J. Alloys Compd. 2009, 467, 567–571. [Google Scholar] [CrossRef]
- Morrison, F.D.; Sinclair, D.C.; Skakle, J.M.; West, A.R. Novel doping mechanism for very-high-permittivity barium titanate ceramics. J. Am. Ceram. Soc. 1998, 81, 1957–1960. [Google Scholar] [CrossRef]
- Morrison, F.D.; Sinclair, D.C.; West, A.R. Electrical and structural characteristics of lanthanum-doped barium titanate ceramics. J. Appl. Phys. 1999, 86, 6355–6366. [Google Scholar] [CrossRef]
- Agneni, A.; Paolozzi, A.; Sgubini, S. Piezoceramic devices modeled as mechanical systems in finite element codes. COST 2001, 4, 591–599. [Google Scholar]
- Makino, H.; Asai, M.; Tajima, S.; Kamiya, N. Piezoresistive ceramic composite for the miniature force-sensor. Commun. Res. Rep. 2002, 37, 67–70. [Google Scholar]
- Puli, V.S.; Li, P.; Adireddy, S.; Chrisey, D.B. Crystal structure, dielectric, ferroelectric and energy storage properties of La-doped BaTiO3 semiconducting ceramics. J. Adv. Dielectr. 2015, 5, 1550027–1550035. [Google Scholar] [CrossRef]
- Caia, W.; Fu, C.; Lin, Z.; Deng, X.; Jiang, W. Influence of Lanthanum on Microstructure and Dielectric Properties of Barium Titanate Ceramics by Solid State Reaction. Adv. Mater. Res. 2012, 412, 275–279. [Google Scholar] [CrossRef]
- Morrison, F.D.; Coats, A.M.; Sinclair, D.C.; West, A.R. Charge Compensation Mechanisms in La-Doped BaTiO3. J. Electroceram. 2001, 6, 219–232. [Google Scholar] [CrossRef]
- Urek, S.; Drofenik, M. PTCR Behaviour of Highly Donor Doped BaTiO3. J. Eur. Ceram. Soc. 1999, 19, 913–916. [Google Scholar] [CrossRef]
- Wodecka-Duś, B.; Lisińska-Czekaj, A.; Czekaj, D. Influence of lanthanum concentration on properties of BLT electroceramics. Key Eng. Mater. 2012, 512–515, 1308–1312. [Google Scholar] [CrossRef]
- Adamczyk-Habrajska, M.; Szafraniak-Wiza, I.; Goryczka, T.; Szalbot, D. Impedance Studiem of K0.5Na0.5NbO3 ceramics prepared from mechanochemically activated powders. Mater. Chem. Phys. 2020, 242, 122451–122460. [Google Scholar] [CrossRef]
- Slodczyk, A.; Gouadec, G.; Colomban, P.; Pham-Thi, M. Stress-modified phase transitions in polarized PMN-PIN-PT, KN and KNL-NTS single crystals/textured ceramics: Thermal expansion and Raman scattering studies. In Proceedings of the 2013 Joint IEEE International Symposium on Applications of Ferroelectric and Workshop on Piezoresponse Force Microscopy (ISAF/PFM), Prague, Czech Republic, 21–25 July 2013; pp. 356–359. [Google Scholar]
- Gouadec, G.; Colomban, P.; Slodczyk, A.; Pham-Thi, M. Stress and temperature driven phase transitions in single crystalline KNbO3 and textured KNL-NTS ceramics: A Raman and thermal expansion study. In Proceedings of the 2014 Joint IEEE International Symposium on the Applications of Ferroelectric, International Workshop on Acoustic Transduction Materials and Devices & Workshop on Piezoresponse Force Microscopy, State College, PA, USA, 12–16 May 2014; pp. 63–66. [Google Scholar]
- Young, R.A. The Rietveld Method; Oxford University Press: Oxford, UK, 1995. [Google Scholar]
- Ganguly, M.; Rout, S.K.; Sinha, T.P.; Sharma, S.K.; Park, H.Y.; Ahn, C.W.; Kim, I.W. Characterization and Rietveld Refinement of A-site deficient Lanthanum doped Barium Titanate. J. Alloys Compd. 2013, 579, 473–484. [Google Scholar] [CrossRef]
- Kuwabara, M.; Matsuda, H.; Kurata, N.; Matsuyama, E. Shift of the Curie point of barium titanate ceramics with sintering temperature. J. Am. Ceram. Soc. 1997, 80, 2590–2596. [Google Scholar] [CrossRef]
- Vijatović Petrović, M.M.; Bobić, J.D.; Ramoska, T.; Banys, J.; Stojanović, B.D. Electrical properties of lanthanum doped barium titanate ceramics. Mater. Charact. 2011, 62, 1000–1006. [Google Scholar] [CrossRef]
- Devi, S.; Jha, A.K. Structural, dielectric and ferroelectric properties of tungsten substituted barium titanate ceramics. Asian J. Chem. 2009, 21, 117–124. [Google Scholar]
- Abrantes, J.C.C.; Labrincha, J.A.; Frade, J.R. An alternative representation of impedance spectra of ceramics. Mater. Res. Bull. 2000, 35, 727–740. [Google Scholar] [CrossRef]
- Boukamp, B.A. Electrochemical impedance spectroscopy in solid state ionics, recent advances. Solid State Ion. 2004, 169, 65–73. [Google Scholar] [CrossRef]
- Boukamp, B.A. A linear Kronig–Kramers transform test for immittance data validation. J. Electrochem. Soc. 1995, 142, 1885–1894. [Google Scholar] [CrossRef]
- Boukamp, B.A. A nonlinear least squares fit procedure for analysis of immittance data of electrochemical systems. Solid State Ion. 1986, 20, 31–44. [Google Scholar] [CrossRef] [Green Version]
- Kumar, A.; Mumari, N.M.; Katiyar, R.S. Investigation of dielectric and electrical behavior in Pb(Fe0.66W0.33)0.50Ti0.50O3 thin films by impedance spectroscopy. J. Alloys Compd. 2009, 469, 433–440. [Google Scholar] [CrossRef]
- Kumari, L.K.; Prasad, K.; Choudhary, R.N.P. Impedance spectroscopy of (Na0.5Bi0.5)(Zr0.25Ti0.75)O3 lead-free ceramic. J. Alloys Compd. 2008, 453, 325–331. [Google Scholar]
- Nocuń, M. Wprowadzenie do Spektroskopii Impedancyjnej w Badaniach Materiałów Ceramicznych; Wydawnictwo Naukowe Akapit: Kraków, Poland, 2003. [Google Scholar]
- Bauerle, J.E. Study of solid electrolyte polarization by a complex admittance method. J. Phys. Chem. Solids 1969, 30, 2657–2670. [Google Scholar] [CrossRef]
- Mancić, D.; Paunović, V.; Vijatović, M.; Stojanović, B.; Zivković, L. Electrical characterization and impedance response of lanthanum doped barium titanate ceramics. Sci. Sinter. 2008, 40, 283–294. [Google Scholar] [CrossRef]
- Lasia, A. Electrochemical Impedance Spectroscopy and It’s Applications. Modern Aspects of Electrochemistry; Kluver Academic/Plenum Publishers: New York, NY, USA, 1999; pp. 143–248. [Google Scholar]
- Mancić, D.; Paunović, V.; Petrusić, Z.; Radmanović, M.; Zivković, L. Application of impedance spectroscopy for electrical characterization of ceramics materials. Electronics 2009, 13, 11–17. [Google Scholar]
- Kathayat, K.; Panigrahi, A.; Pandey, A.; Kar, S. Characterization of electrical behavior of Ba5HoTi3V7O30 ceramic using impedance analysis. J. Mater. Sci. Appl. 2012, 3, 390–397. [Google Scholar]
- Parida, B.N.; Das, P.R.; Padhee, R.; Choudhary, R.N.P. Synthesis and characterization of a tungsten bronze ferroelectric oxide. Adv. Mater. Lett. 2012, 3, 231–238. [Google Scholar] [CrossRef]
- Shimada, T.; Touji, K.; Katsuyama, Y.; Takeda, H.; Shiosaki, T. Lead free PTCR ceramics and its electrical properties. J. Eur. Ceram. Soc. 2007, 27, 3877–3882. [Google Scholar] [CrossRef]
- Kainz, G. Ceramic PTC Thermistors for Protection of Electronic Circuits; Simens Matsushita Components: Munich, Germany, 1998. [Google Scholar]
Figure 1.
(a) X-ray diffraction pattern of BLT4 ceramics. (b) magnification of 112/221 peak; (c) magnification of 202/220 peak.
Figure 1.
(a) X-ray diffraction pattern of BLT4 ceramics. (b) magnification of 112/221 peak; (c) magnification of 202/220 peak.

Figure 2.
SEM images of fractures (a) and EDS emission spectrum (b) of BLT4 ceramics.

Figure 3.
Temperature dependence of electric permittivity (a) and tangent of the dielectric loss angle (b) on the temperature and frequency of the measuring field for BLT4 ceramics.
Figure 3.
Temperature dependence of electric permittivity (a) and tangent of the dielectric loss angle (b) on the temperature and frequency of the measuring field for BLT4 ceramics.

Figure 4.
Inverse relative electrical permittivity from temperature for BLT4 ceramics.

Figure 5.
Frequency dependence of the impedance of the imaginary part, Zim, (a) and the real part, Zre, (b) on the frequency, f, at different temperatures of BLT4 ceramics.
Figure 5.
Frequency dependence of the impedance of the imaginary part, Zim, (a) and the real part, Zre, (b) on the frequency, f, at different temperatures of BLT4 ceramics.

Figure 6.
Residual spectrum (residuals) showing the frequency relationship of the relative difference between the experimental data and the data obtained as a result of the K-K test at T = 230 °C for BLT4 ceramics.
Figure 6.
Residual spectrum (residuals) showing the frequency relationship of the relative difference between the experimental data and the data obtained as a result of the K-K test at T = 230 °C for BLT4 ceramics.

Figure 7.
Electric equivalent RC system.

Figure 8.
Frequency relationship of approximation errors of the real part and the imaginary impedance of BLT 4 ceramics, calculated at T = 377 °C.
Figure 8.
Frequency relationship of approximation errors of the real part and the imaginary impedance of BLT 4 ceramics, calculated at T = 377 °C.

Figure 9.
RC electric equivalent systems with fixed constant-phase elements CPE: With single element CPE (a) and with double element CPE (b).
Figure 9.
RC electric equivalent systems with fixed constant-phase elements CPE: With single element CPE (a) and with double element CPE (b).

Figure 10.
Graphs of the dependence of the imaginary part of impedance (Zim) on its real part (Zre) together with the matching spectrum for selected electric replacement models obtained at T = 455 °C; for a system with a single CPE (a) and for a system with a double CPE (b).
Figure 10.
Graphs of the dependence of the imaginary part of impedance (Zim) on its real part (Zre) together with the matching spectrum for selected electric replacement models obtained at T = 455 °C; for a system with a single CPE (a) and for a system with a double CPE (b).

Figure 11.
Dependence of the natural logarithm of the grain (a) and grain boundary (b) values calculated on the basis of impedance spectra as a function of temperature inverse of BLT4 ceramics.
Figure 11.
Dependence of the natural logarithm of the grain (a) and grain boundary (b) values calculated on the basis of impedance spectra as a function of temperature inverse of BLT4 ceramics.

Figure 12.
Temperature dependence of resistivity for BLT4 ceramics.


Table 1.
Comparison of actual density (ρexp), water absorption (N), and porosity (P) of lanthanum barium titanate (BLT4) ceramics depending on the third sintering temperature (TIII).
Table 1.
Comparison of actual density (ρexp), water absorption (N), and porosity (P) of lanthanum barium titanate (BLT4) ceramics depending on the third sintering temperature (TIII).
| Parameter | Values | ||
|---|---|---|---|
| TIII [°C] | 1325 | 1350 | 1400 |
| ρexp [kg/m3] | 5173 | 5633 | 5062 |
| P [%] | 4.7 | 2.4 | 6.6 |
| N [%] | 0.82 | 0.52 | 1.35 |
Table 2.
Theoretical and experimental percentages of BLT4 ceramic elements.
| Element | Marked Content of Elements from EDS [wt.%] | Theoretical Content of Elements [wt.%] | Difference of Determined Value in Relation to the Theoretical [wt.%] |
|---|---|---|---|
| O | 20.0 | 20.6 | 0.6 |
| Ti | 19.3 | 20.5 | 1.2 |
| Ba | 60.6 | 58.6 | 2.0 |
| La | 0.1 | 0.2 | 0.1 |
Table 3.
Values of dielectric parameters of BLT4 ceramics for the frequency of the measuring field f = 1 kHz.
Table 3.
Values of dielectric parameters of BLT4 ceramics for the frequency of the measuring field f = 1 kHz.
| Parameter | TC [°C] | T0 [°C] | C [°C] | ε in Tr | εmax | tanδ in Tr | tanδ in TC |
|---|---|---|---|---|---|---|---|
| BLT4 | 120 | 75 | 4.20 × 10⁵ | 39,497 | 99,140 | 0.083 | 0.197 |
Table 4.
Values of posistor parameters of BLT4 ceramics.
| Parameter | TC [°C] | ρmin [Ω∙m] | ρmax [Ω∙m] | ΔTPTCR [°C] | αT [%/K] |
|---|---|---|---|---|---|
| BLT4 | 120 | 9.71 × 10³ | 1.94 × 10⁴ | 120–170 | 10.53 |
© 2020 by the authors. Licensee MDPI, Basel, Switzerland. This article is an open access article distributed under the terms and conditions of the Creative Commons Attribution (CC BY) license (http://creativecommons.org/licenses/by/4.0/).
Share and Cite
MDPI and ACS Style
Wodecka-Duś, B.; Adamczyk-Habrajska, M.; Goryczka, T.; Bochenek, D. Chemical and Physical Properties of the BLT4 Ultra Capacitor—A Suitable Material for Ultracapacitors. Materials 2020, 13, 659. https://doi.org/10.3390/ma13030659
AMA Style
Wodecka-Duś B, Adamczyk-Habrajska M, Goryczka T, Bochenek D. Chemical and Physical Properties of the BLT4 Ultra Capacitor—A Suitable Material for Ultracapacitors. Materials. 2020; 13(3):659. https://doi.org/10.3390/ma13030659
Chicago/Turabian StyleWodecka-Duś, B., M. Adamczyk-Habrajska, T. Goryczka, and D. Bochenek. 2020. "Chemical and Physical Properties of the BLT4 Ultra Capacitor—A Suitable Material for Ultracapacitors" Materials 13, no. 3: 659. https://doi.org/10.3390/ma13030659
Note that from the first issue of 2016, this journal uses article numbers instead of page numbers. See further details here.