Two sets of experiments were conducted to study the reduction behaviour of iron oxide and slag formation. For this purpose, the off-gas composition, produced iron, slag, RD, , and reduction rate were studied.
3.1. Off-Gas and Produced Iron
Argon as an inert gas left the reactor without any reaction, and hydrogen reacted with the iron oxides, namely Fe
2O
3, Fe
3O
4, and FeO, to form H
2O. The off-gas composition during the pre-melting step consisted of Ar, CO, and CO
2, and in the reduction step, H
2, Ar, CO, CO
2, and H
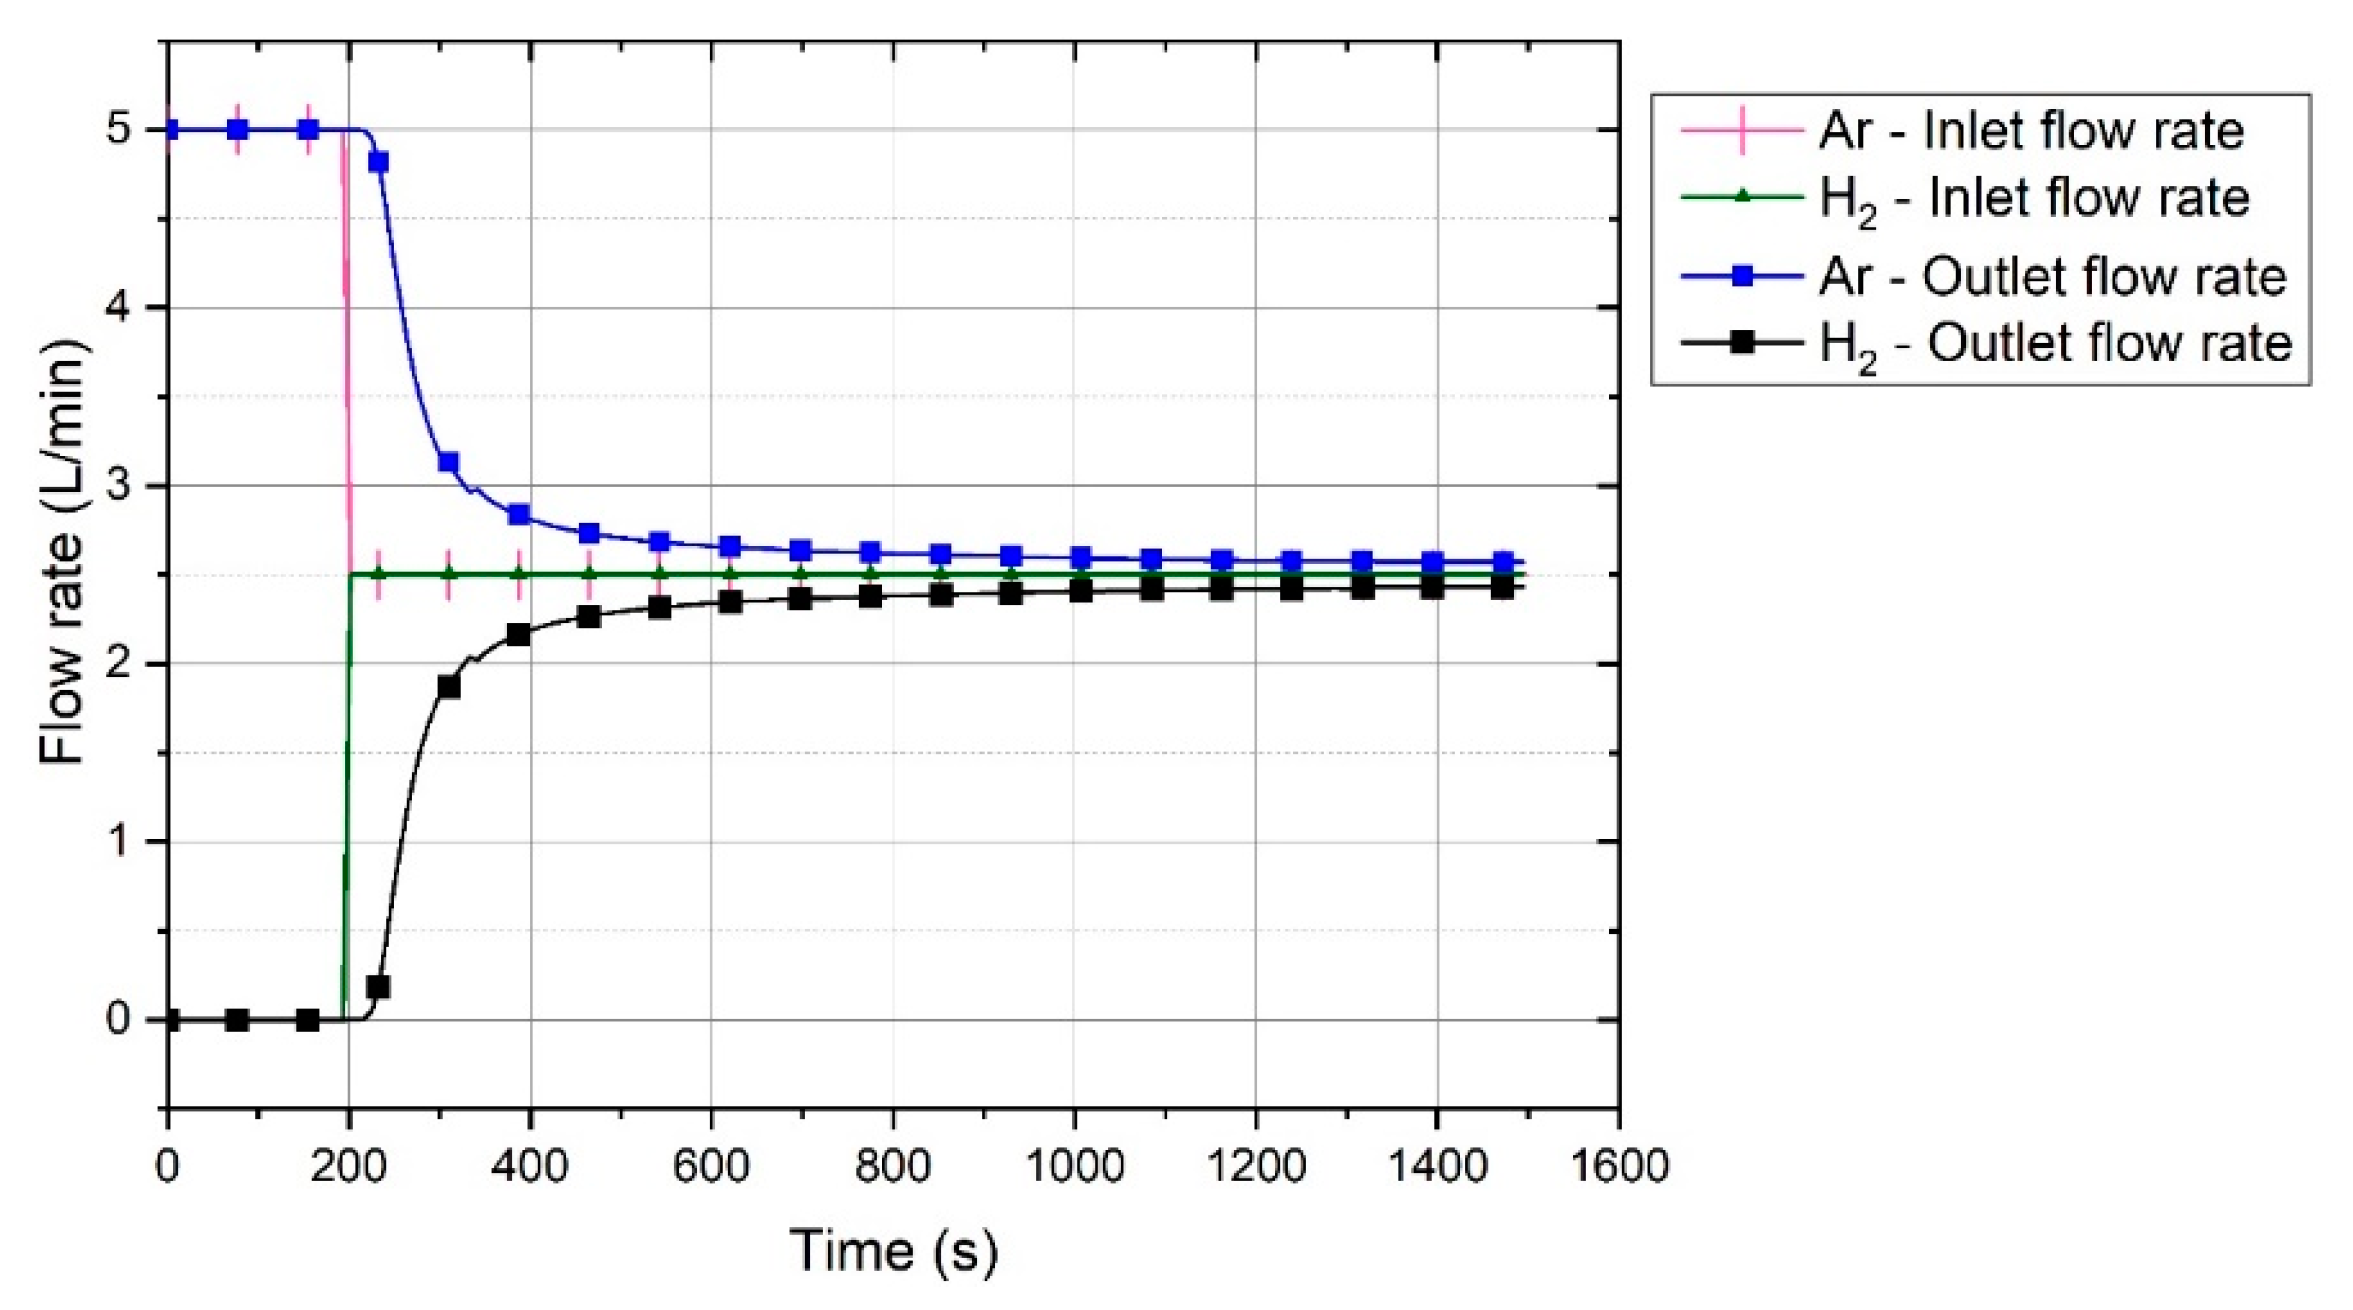
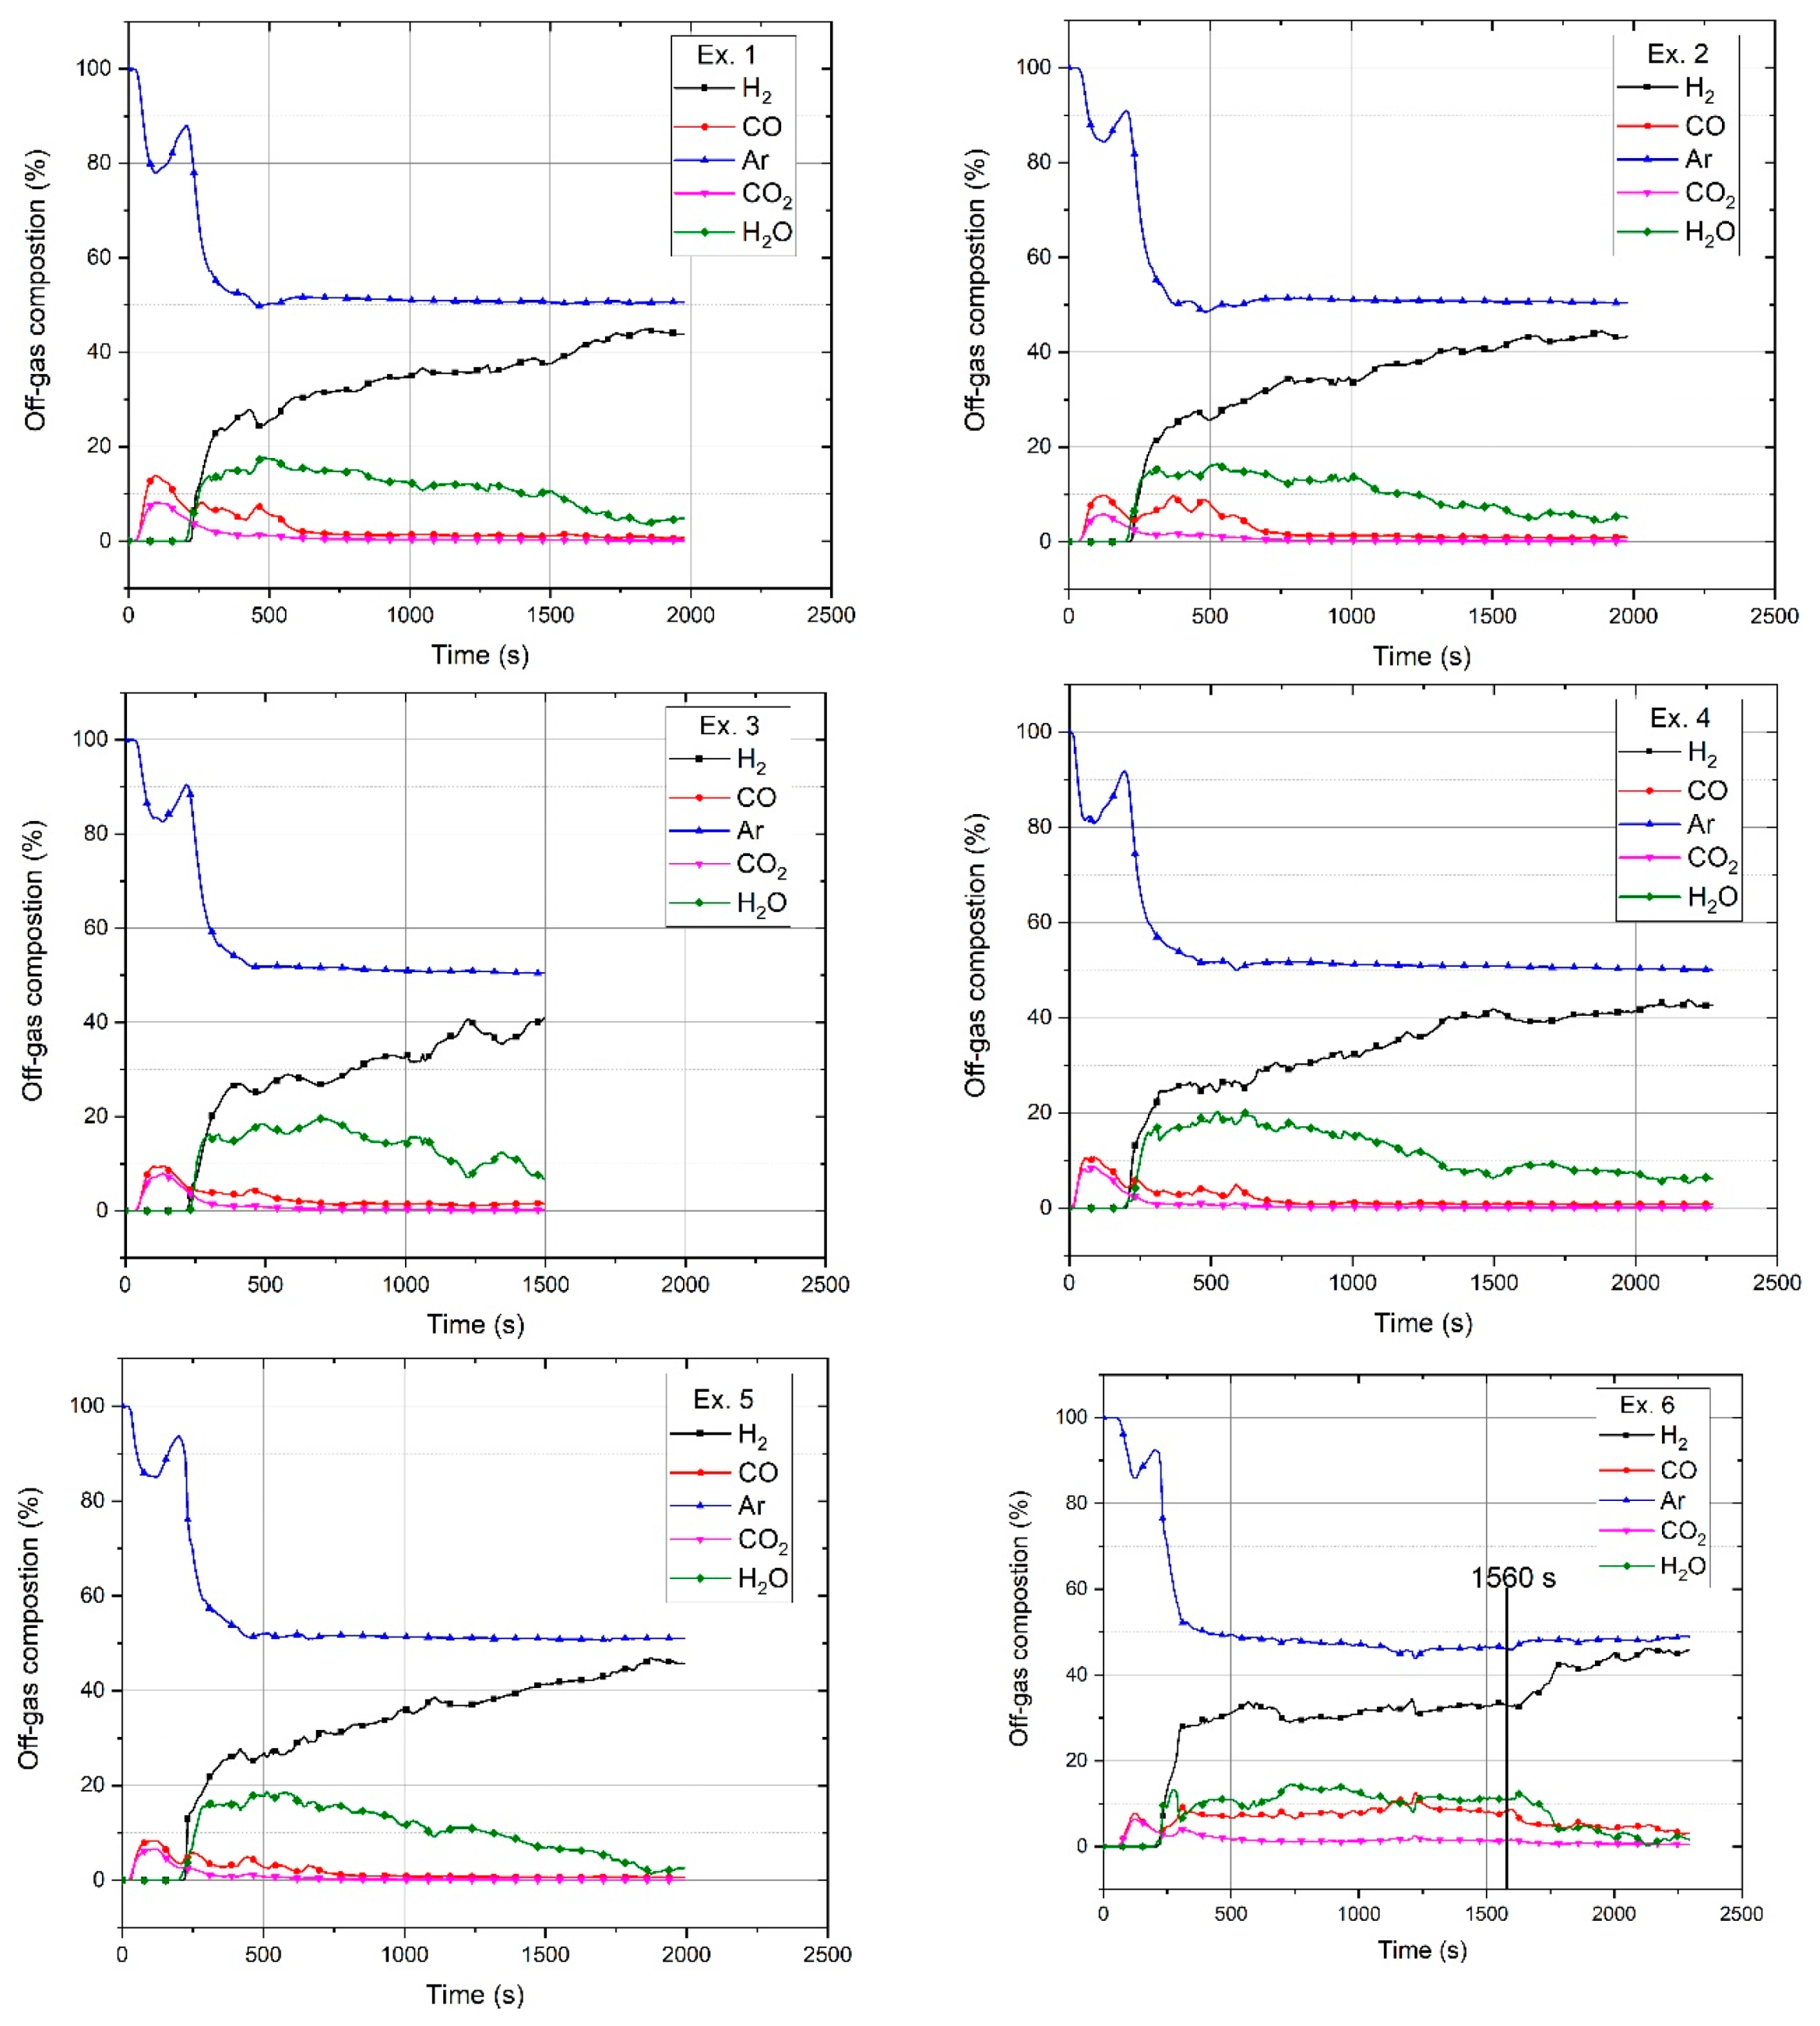
2O. The produced water vapour was condensed in the off-gas cleaning system and was therefore not measured by the MS. Hence, the amount of water vapour was calculated and added to the composition graph of each test run. Every mole of hydrogen produced one mole of water; therefore, the amount of produced water vapour was the difference between the outlet hydrogen shown by MS and the reference diagram within a certain time period. The chemical compositions of the off-gas for the six experiments are shown in
Figure 6.
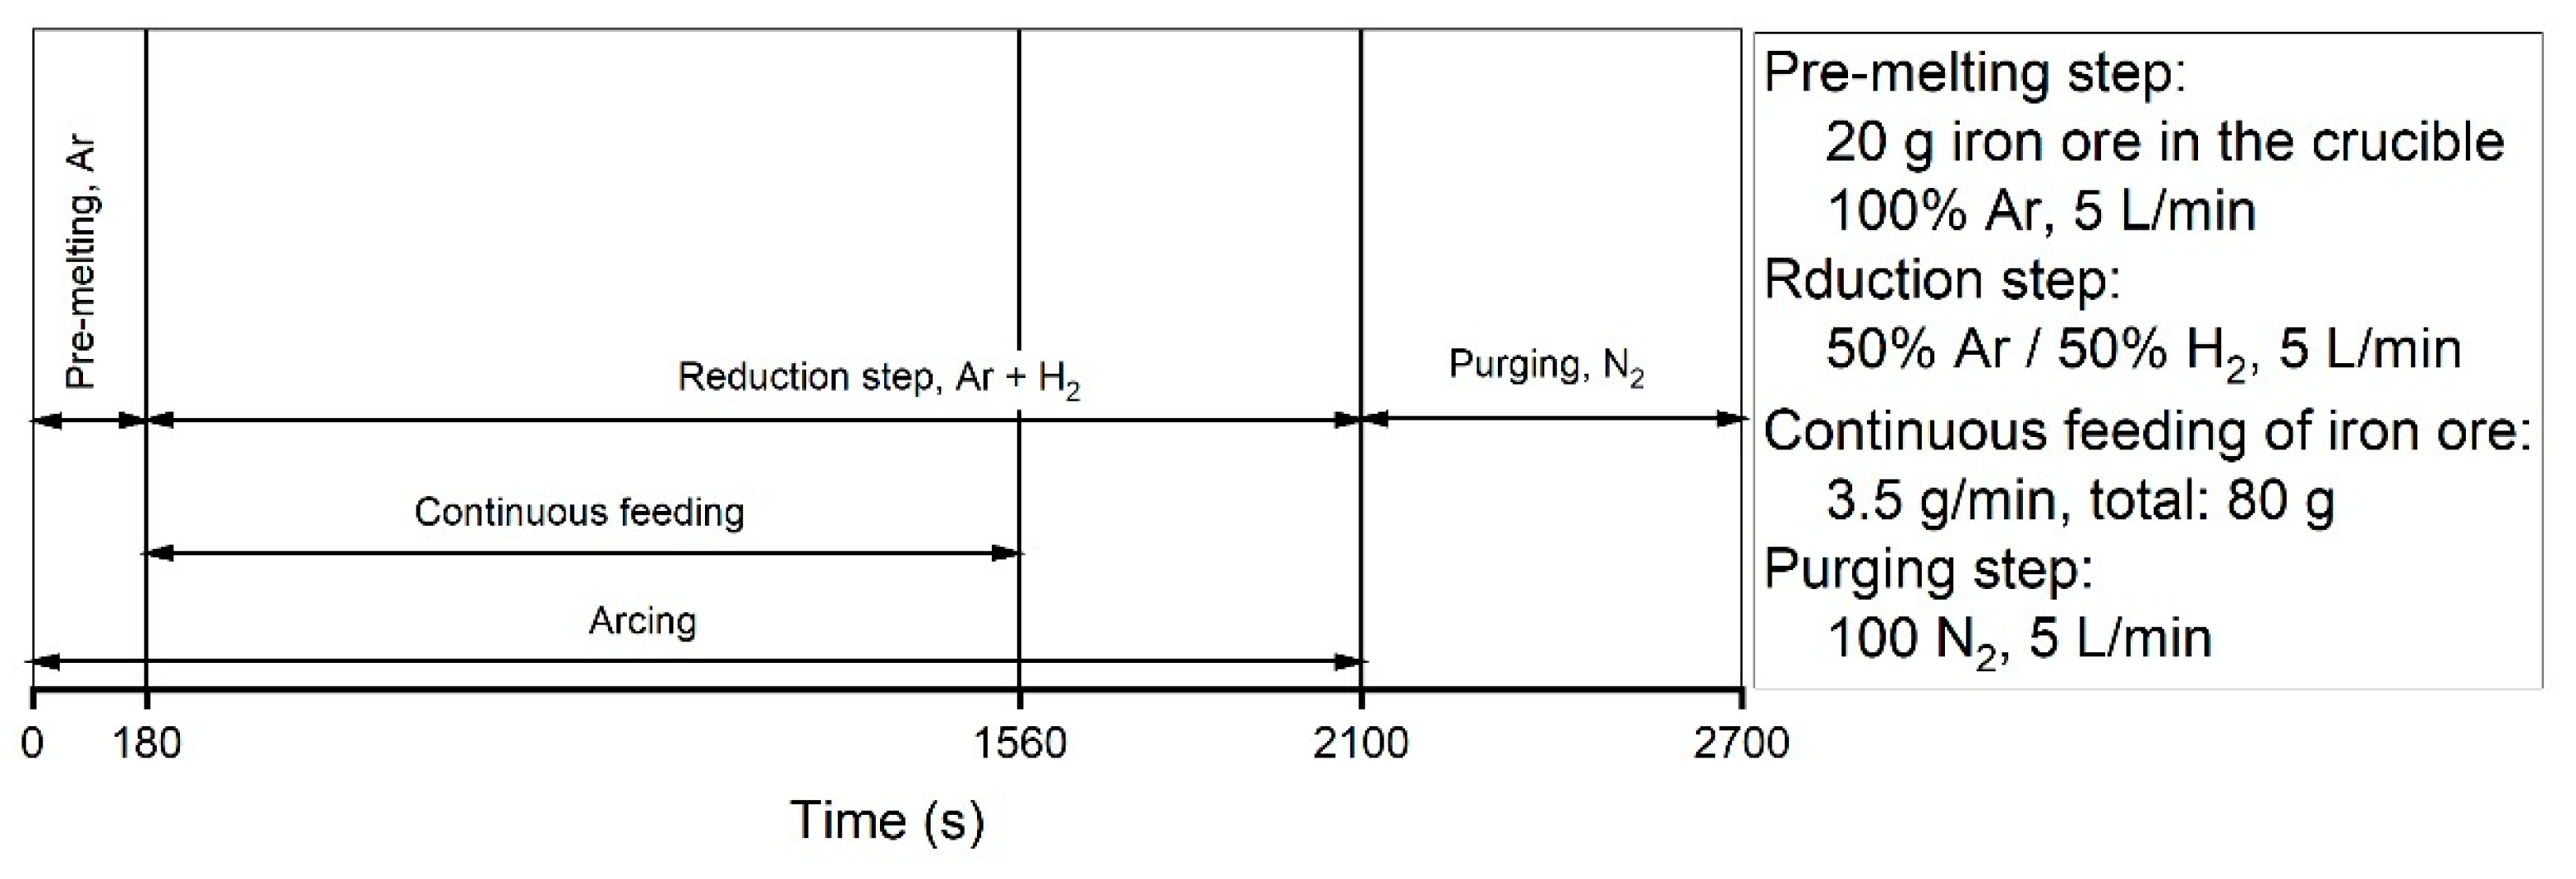
Before starting the test runs, all the oxygen in the system was purged out by the injection of argon into the reactor. Therefore, at the start of the pre-melting step, only argon was inside the reactor. Upon the start of arcing and during the pre-melting step, 5 L/min of argon was injected into the reactor for 180 s. Carbon from HGE was introduced into the reduction reactions. Carbon reduced iron oxide and formed CO and CO
2. A possible reason for the introduction of a high amount of carbon into the melt at the beginning of the process was that the HGE was cold and a thermal shock could cause a high erosion of the HGE and create a peak of CO and CO
2 in the pre-melting step. With the formation of CO and CO
2, the percentage of argon decreased. Then, the reduction process was carried out with an injection of a mixture containing 50% Ar–50% H
2 at a total flow rate of 5 L/min. The trends of the gas compositions of all the experiments were similar except for Ex. 6, in which iron oxide was continuously charged into the reactor. The amount of H
2O at the beginning of the experiments was high, and then, it decreased because of a decrease in the reduction rate. Ex. 6 had a different trend in terms of the H
2 and H
2O amounts, which is discussed in
Section 3.2. The CO and CO
2 produced by Ex. 6 was higher than that of the other experiments; the reasons for this are discussed at the end of this section. At 1560 s, continuous feeding was stopped, and the amount of CO and CO
2 decreased.
Ex. 3 was stopped at 1500 s upon reaching the temperature limit of the transformer of the power supply. To achieve a high degree of reduction and to study the reduction behaviour, the system was optimised and the operation time of Exs. 1, 2 and 5 was extended to 1980 s; Exs. 4 and 6 were carried out in 2220 s.
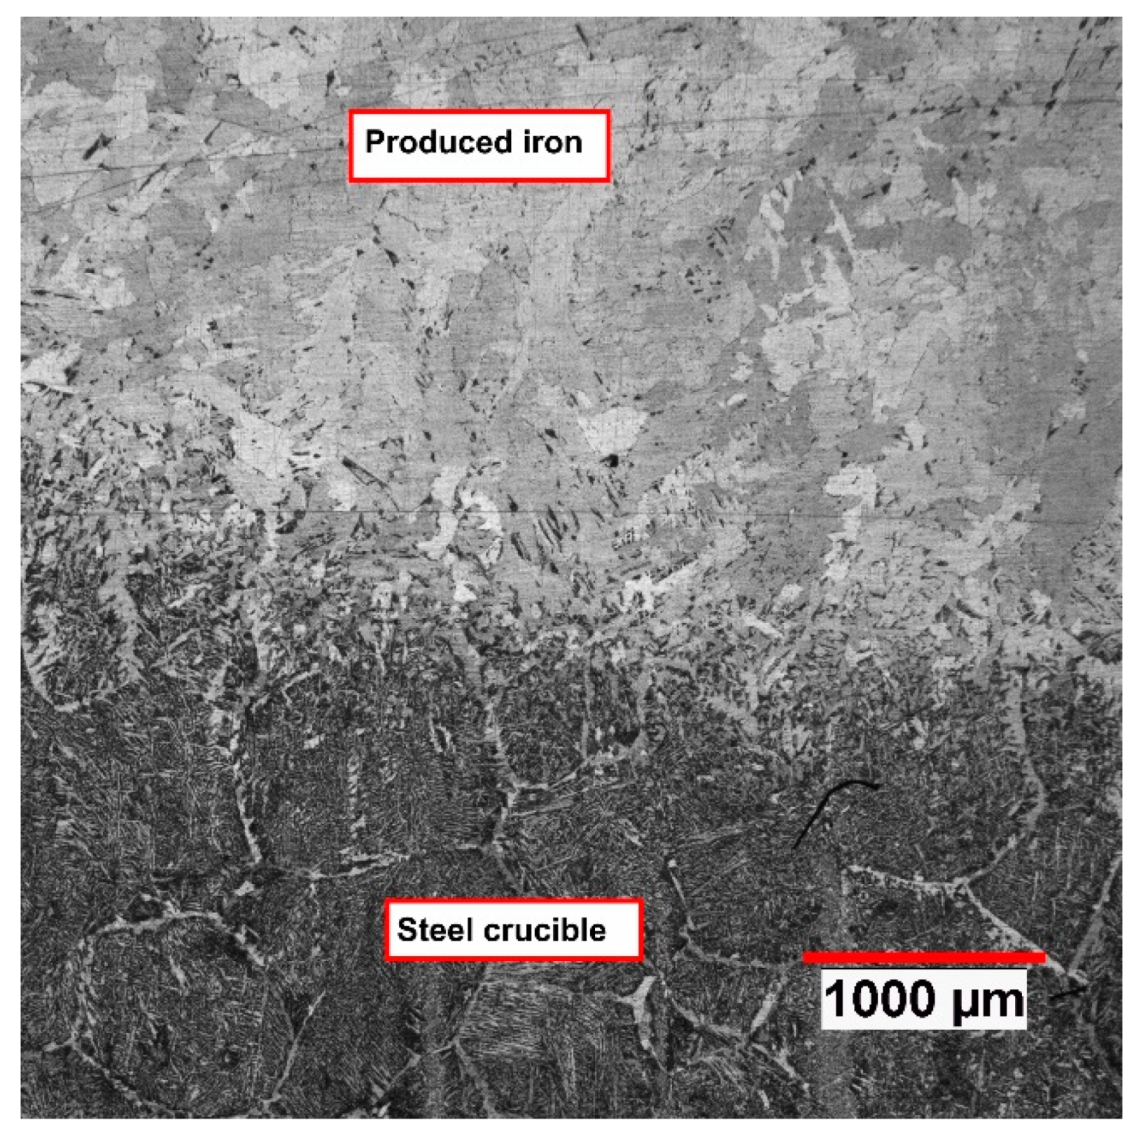
Carbon contributed to the reduction processes to reduce iron oxides from three sources, namely the ignition pin, steel crucible, and HGE. During the reduction process, the ignition pin was completely melted, and the steel crucible melted partially. The partially melted section of the crucible got mixed with the produced iron and the pin material. To calculate the amount of carbon that entered into the melt from the crucible, the microstructure of the middle cross-section of the crucible was assessed using an optical microscope.
Figure 7 shows a cross-section of the crucible after the reduction operation.
Figure 7 shows the weld interface and the fusion depth. The ferritic microstructure of the fusion phase illustrates a low carbon content. Nevertheless, the chemical composition of the produced iron was analysed and is presented in
Table 6.
The chemical composition shows that the carbon concentration is low; therefore, it means that carbon has reduced the iron oxide and formed CO or CO2. The melted section of the steel crucible for each test run was observed by optical microscopy, and then, the weight was estimated according to the fusion depth. Finally, the amount of carbon contributed to the reduction reactions by the steel crucible was calculated by the multiplication of the weight of the melted section and the carbon concentration. The other source of carbon was the HGE. Iron oxide fines during the continuous feeding stuck on the inner surface of the electrode and were reduced by carbon. This case was more obvious during the continuous feeding of iron ore. Moreover, the eroded particles from the HGE were introduced into the melt. Furthermore, the plasma arc caused the formation of iron oxide spatters, which stuck on the tip of the electrode and got reduced by the carbon material of the HGE.
In the pre-melting step, only argon was injected into the plasma reactor. Therefore, Ar, CO, and CO2 were the gaseous products. The amounts of produced CO and CO2 and their ratio were approximately in the same range for all the test runs except Ex. 6. For conducting Ex. 6, 20 g of the premixed powder was charged to the crucible; then, after switching the operation from the pre-melting to the reduction step, the continuous feeding of the powder was started. Therefore, the low amount of iron oxide inside the crucible led to a decrease in the CO and CO2 amounts at the beginning of the operation in comparison to the other experiments. However, the amounts of CO and CO2 emitted during the continuous feeding were higher than those of the other experiments. The possible reasons could be as follows:
sticking of fines on the inner surface of HGE and the direct reduction of hematite with carbon,
wear of the inner section of the HGE by the inflight particles of the powder, and/or
generation of more slag droplets on the tip of the electrode because of entering particles of iron ore to the melt.
It is clearly shown in
Figure 6 that after continuous feeding was stopped at 1560 s, the amounts of CO and CO
2 decreased. The total carbon in the off-gas was calculated using its chemical composition from MS. However, to define the carbon source, the mass balance of the HGE, ignition pin, and steel crucible was carried out. The HGE was weighed before and after each test run to calculate the loss of weight. Because the ignition pin was completely melted, the total carbon content was introduced into the melt.
Table 7 shows the amount of carbon contributed to the reduction reactions by different sources for all the experiments (in grams).
The maximum amount of carbon from the HGE was contributed to the reductions observed in Ex. 6, in which the materials were continuously fed to the crucible. The melted section of the crucible differed from experiment to experiment.
3.2. Degree of Hydrogen Utilisation
The
value was calculated by Equation (1) using the chemical composition of the off-gas and the reference diagram. The
values for the six experiments are shown in
Figure 8.
At the beginning of the reduction process (190–280 s) of Exs. 1 to 6, of all the experiments was high, and then, it decreased because a small amount of hydrogen was inside the reactor and there was a possibility of the reduction of a liquid pool of iron oxide. Therefore, a large portion of hydrogen could reduce iron oxide and form water. During the operation, iron oxide was reduced and its amount decreased, which caused a decrease in . There was no considerable difference between the values of these experiments. However, it seems that Ex. 3 with a basicity of 2.9, the highest basicity, had the highest value most of the time. Please note that the generation of the arc between the HGE and the crucible, instead of between the HGE and the iron oxide, decreased the volume of the molten iron oxide, which led to a decrease in .
Ex. 6 exhibited a different behaviour. First, as in the other experiments, was high, and then, after 230 s of operation, it decreased considerably. The reason could be the transfer of the arc toward the outer surface of the steel crucible, because the bath was at the usage of 20 g of ore, which was too small to keep the arc in place. Therefore, a large volume of the steel crucible was empty. Thereafter, gradually increased because of the continuous feeding of the material. During the continuous feeding, remained approximately constant until the continuous feeding of the ore was stopped (at 1560 s). After the termination of feeding, decreased significantly.
3.3. Degree of Reduction (RD)
The degree of reduction by H
2 and H
2/CO was studied, and the results are discussed in this section.
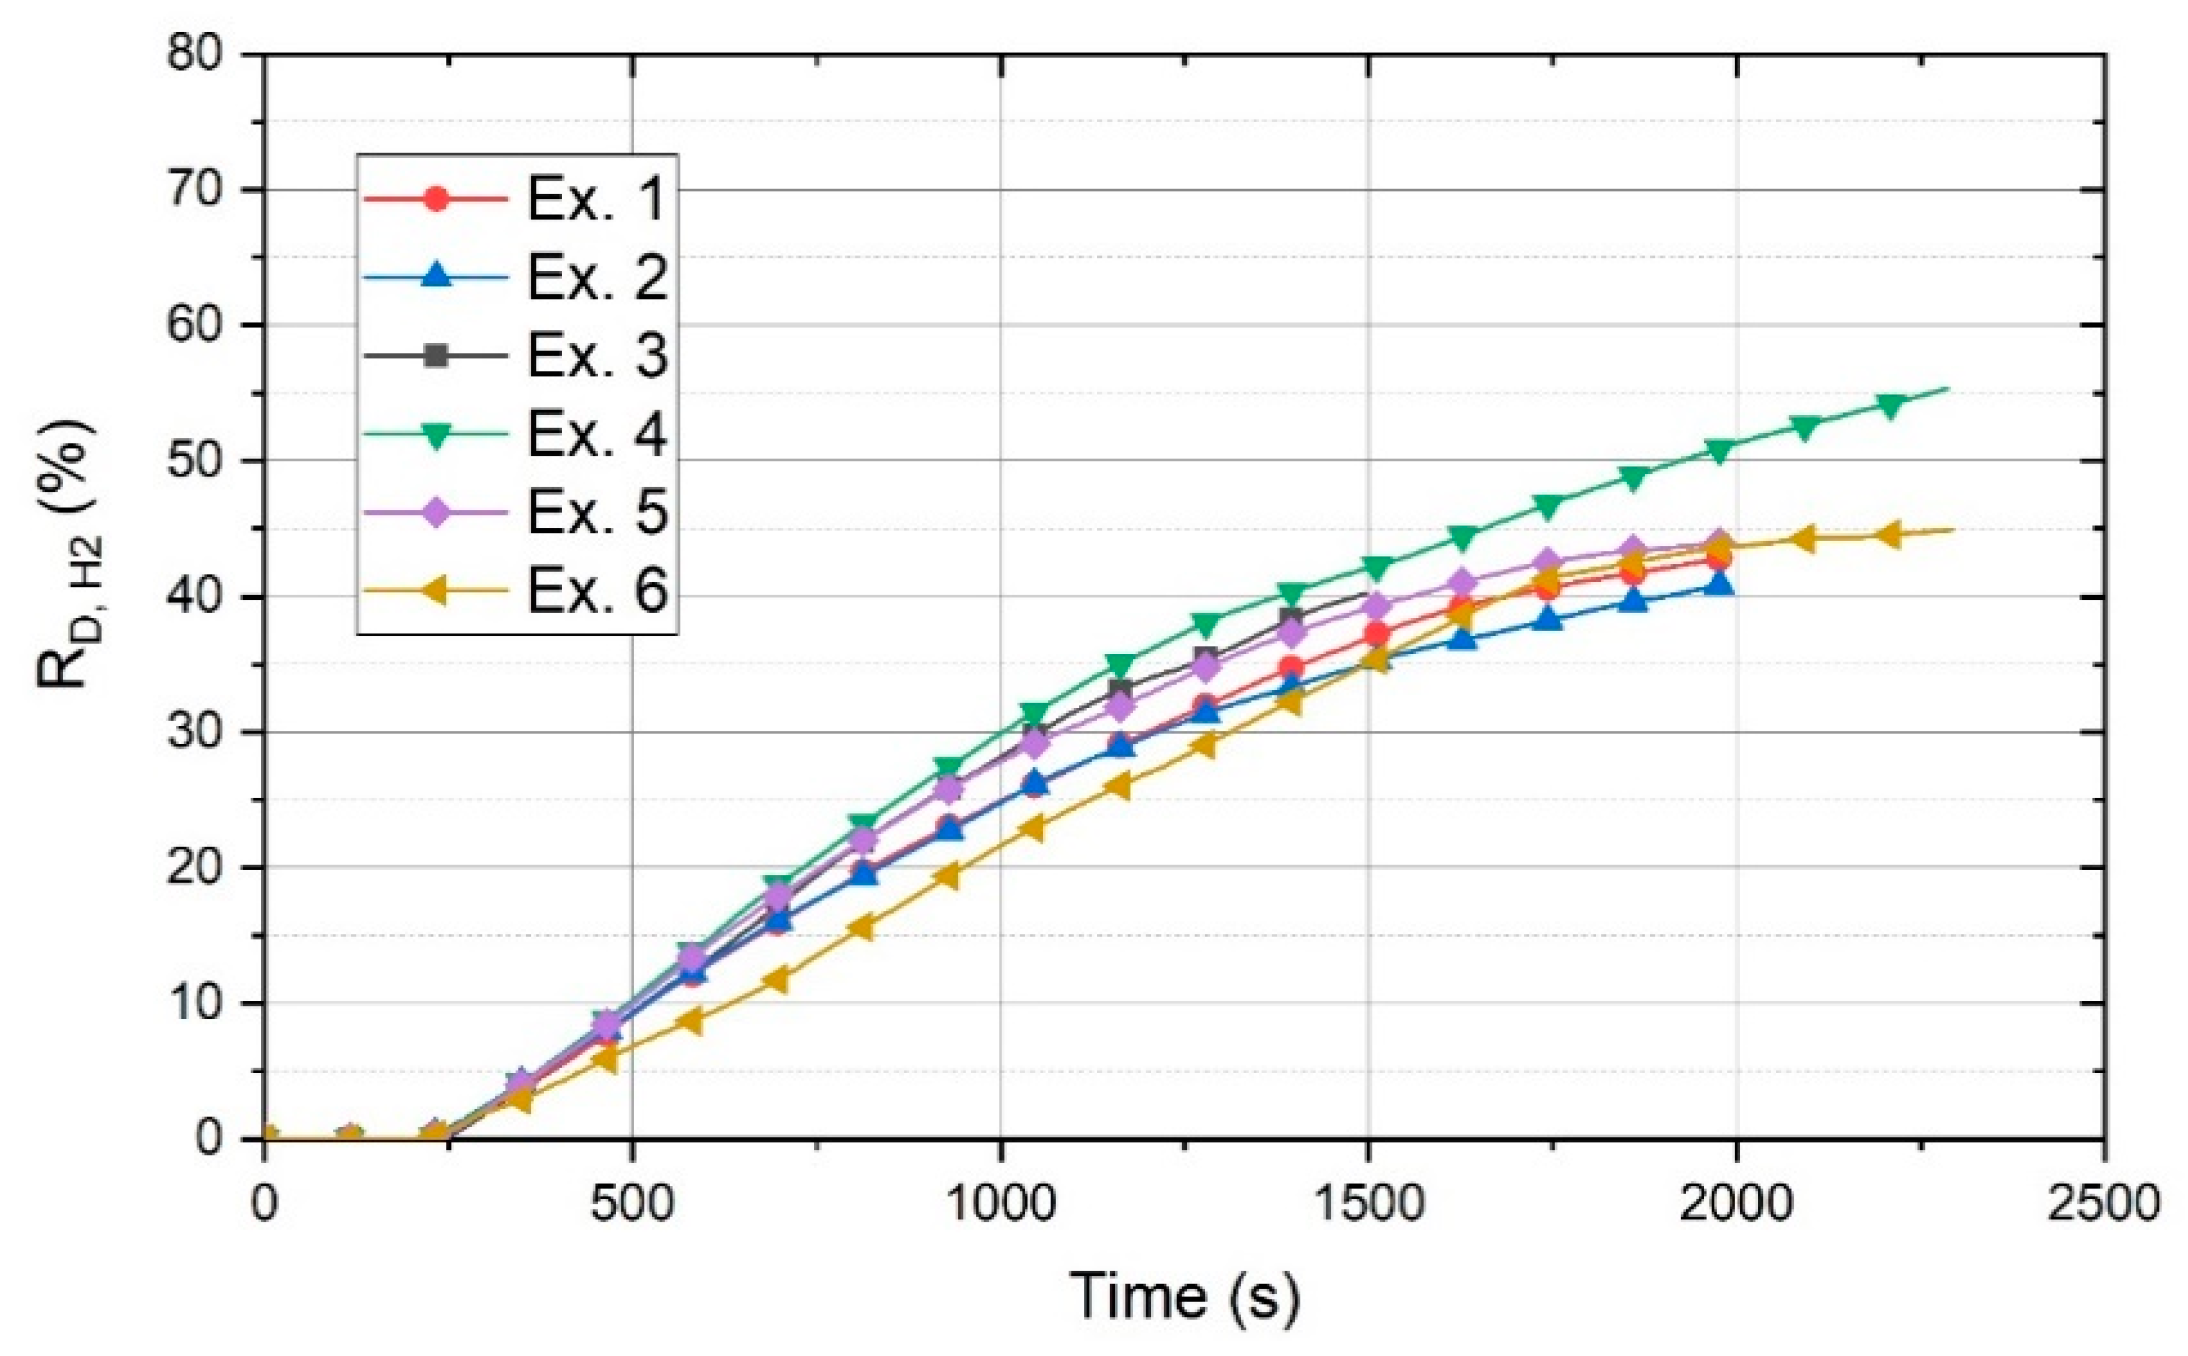
Figure 9 shows the degree of reduction of 100 g of powder by hydrogen (R
D,H2) for all the experiments.
The figure shows that the basicity of 2.3 is the best value to reach the highest RD. Exs. 1 and 2 with a basicity of 0 and 0.8, respectively, exhibited the minimum amount of RD. However, after 1250 s, Ex. 1 had better conditions in terms of RD. The RD values of Exs. 3 and 5 with a basicity of 1.6 and 2.9, respectively, were approximately in the same range.
The R
D value of Ex. 6, regarding 100 g of the charged material, was in the average range of the other experiments. In this diagram, R
D for Ex. 6 was calculated on the basis of the total material (100 g) and not only the charged material, because for the batch-charged experiments, all of the materials were not in the liquid state during the operation. However, R
D for Ex. 6 gradually increased to reach the values of the other experiments by the passage of the operation time. The continuous material feeding provided better conditions for the reduction processes, because, for a batch charge, the arc could be generated between the HGE and on the surface of the previously reduced section. In contrast, the continuous material feeding provided iron oxides for the reduction. The real R
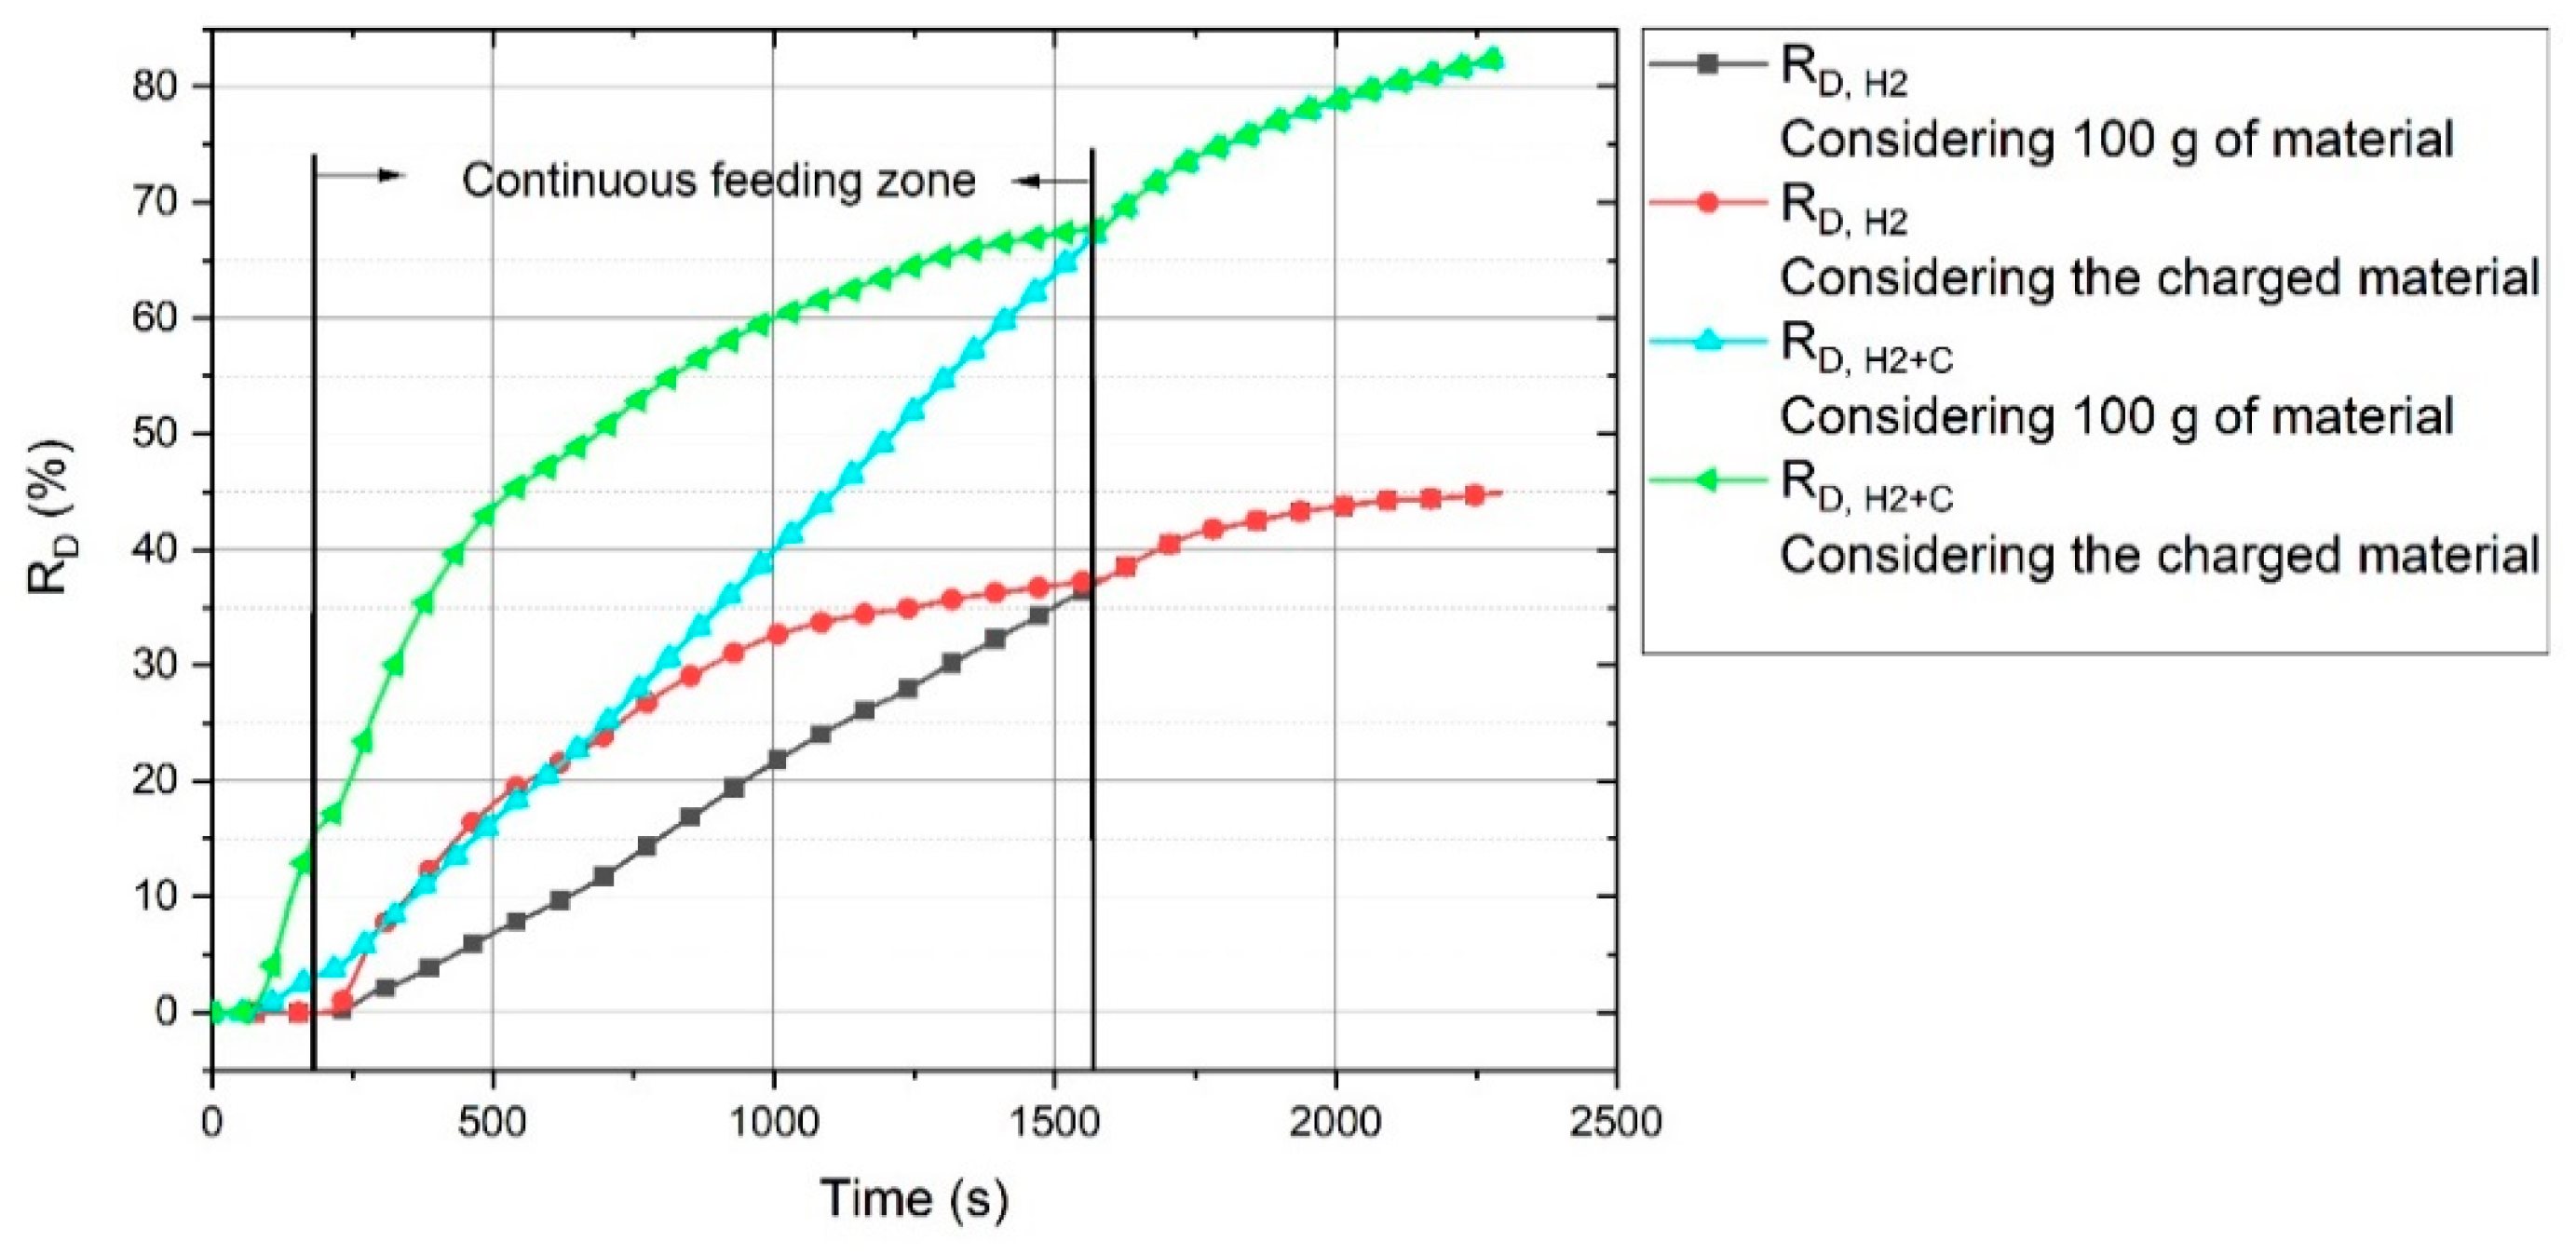
D,H2 and R
D,H2+C values of Ex. 6 in consideration of the total and only the charged material were calculated, and the corresponding graph is shown in
Figure 10.
The black line shows the RD,H2 value considering 100 g of the material. It shows that at the beginning of the reduction process, the real reduction degree was high, and then, upon the termination of continuous feeding, they became equal.
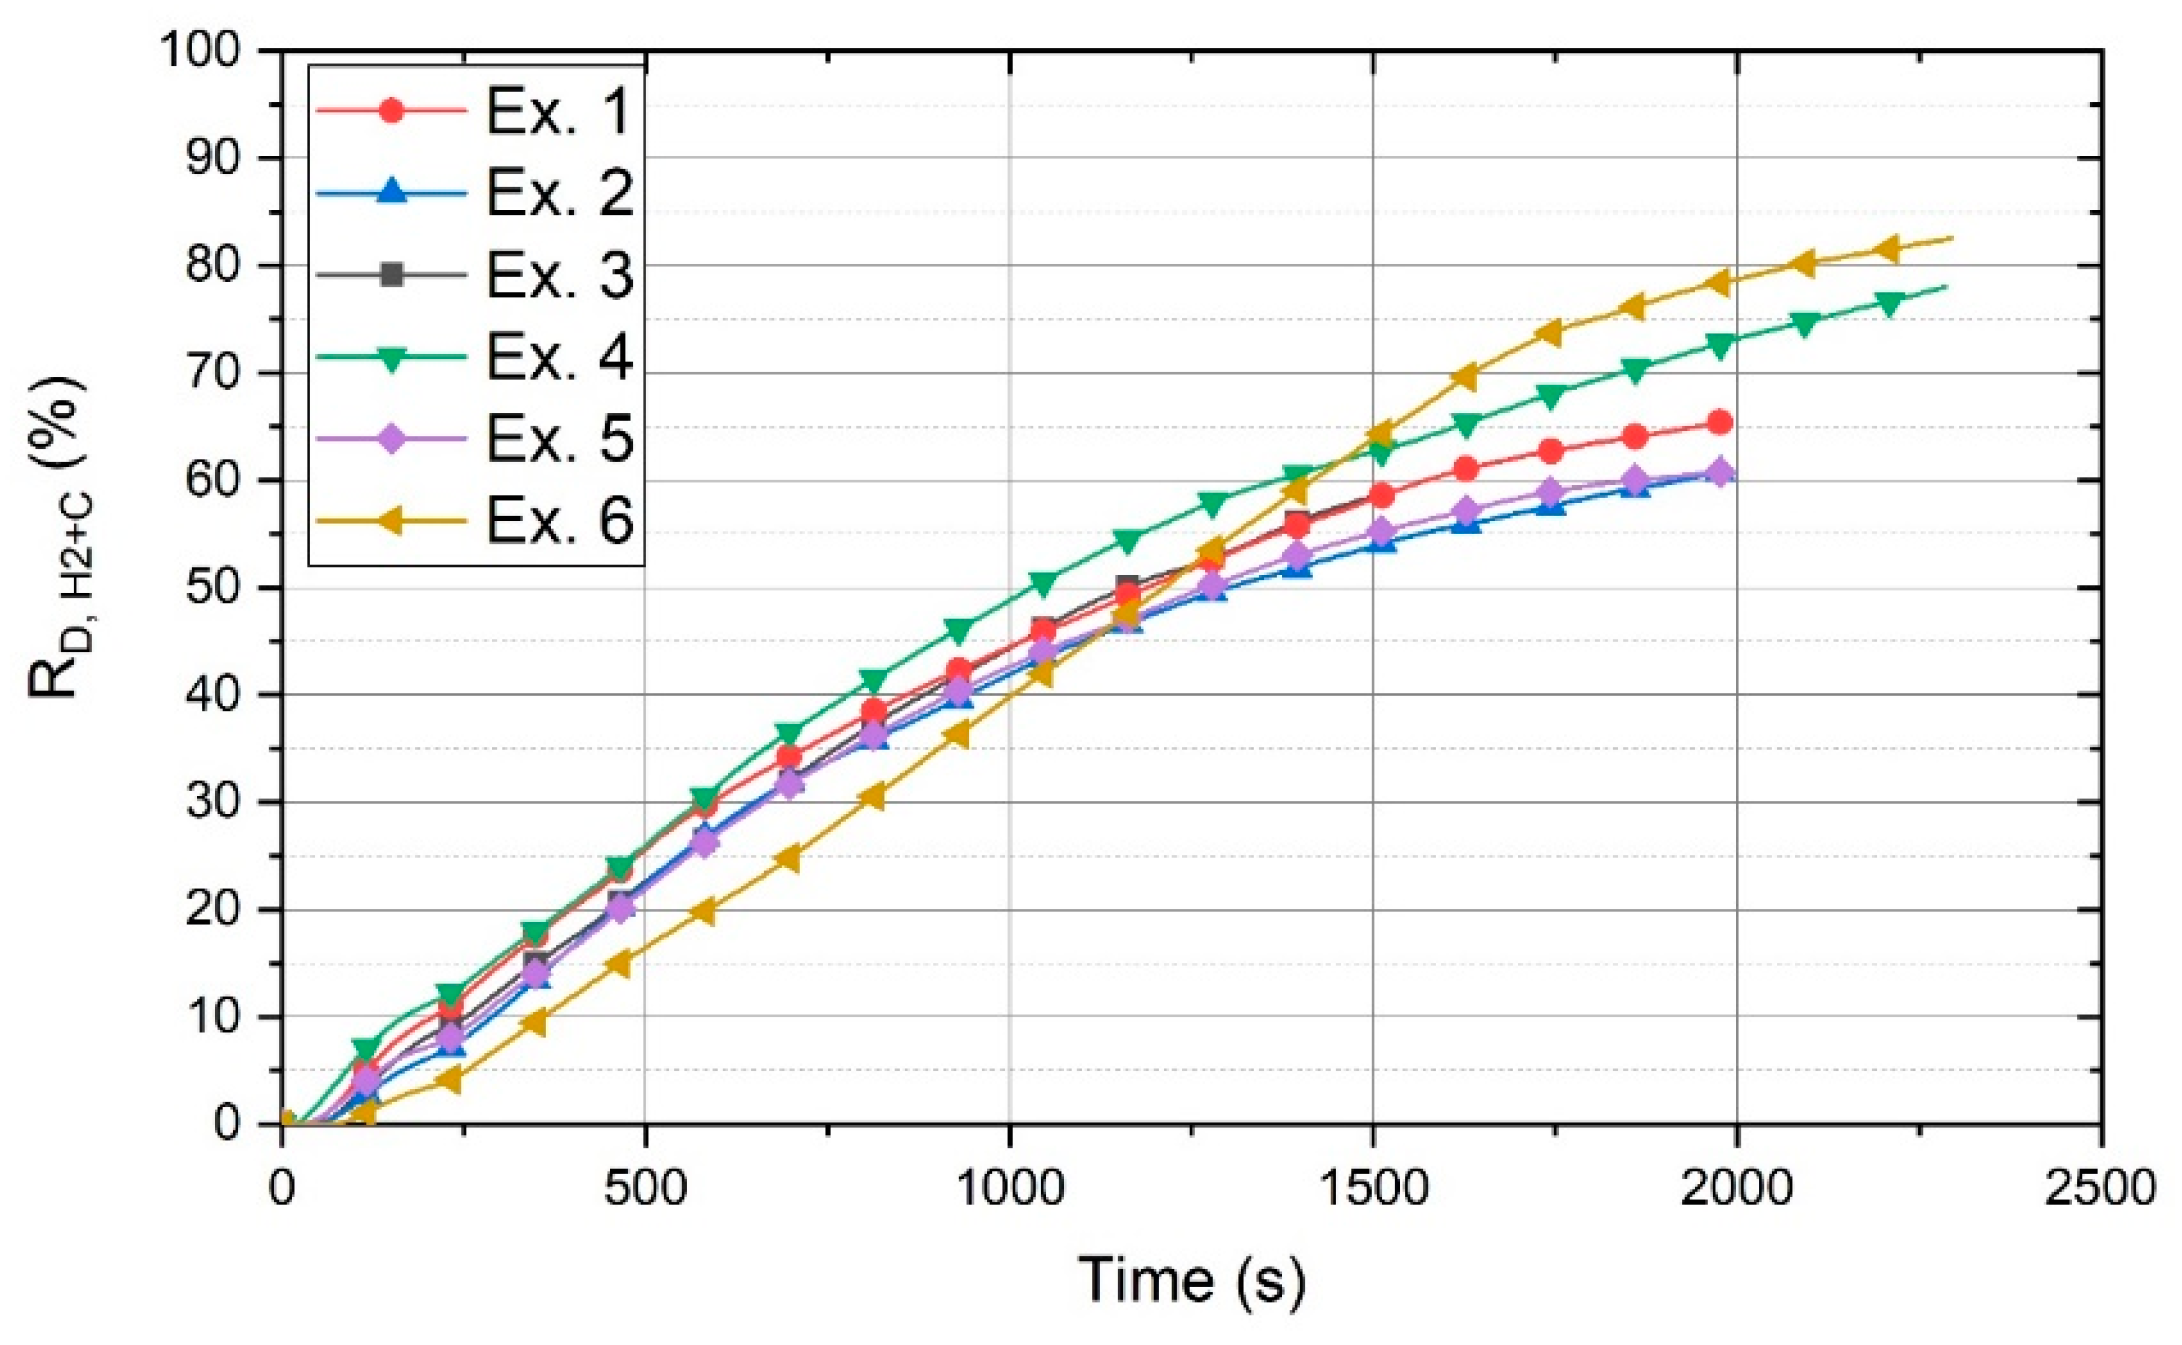
The contribution of carbon to the reduction processes is shown in
Figure 11. This figure shows the total degree of reduction (R
D,H2+C) of each experiment, which is the sum of the degree of reduction by carbon (R
D,C) and hydrogen (R
D,H2).
The amount of carbon contributed to the reduction of iron oxides was approximately in the same range for the experiments with different basicities. Hence, the degree of reduction of each experiment increased uniformly. In contrast, the degree of reduction of Ex. 6 increased considerably. After 1500 s, the total degree of reduction of Ex. 6 was greater than that of the other experiments.
To rule out the contribution of carbon to the reduction reactions, a tungsten electrode could be used instead of the HGE. Badr [
15] conducted a set of experiments by using a tungsten electrode to compare the reduction rate of hematite using hydrogen thermal plasma with HGE. He subtracted the oxygen reduced by carbon from the HGE and then reported that the reduction rates of iron oxide by a tungsten electrode and the HGE were in good agreement.
3.5. Produced Iron and Slag
The mass and energy balance were carried out to calculate the weight and the chemical composition of the slags. The chemical composition of each slag was calculated by using the R
D value of each experiment and the chemical composition of the samples (mixtures of iron ore and lime) and off-gas.
Table 8 shows the values of the main parameters of the products and the co-products of each experiment for the operation time of 1495 s.
Hematite was reduced to Fe and FeO, wherein the former was considered to be the produced iron and the latter was a part of the slag. In 1495 s, the maximum amount of metallisation, which is the ratio of the produced iron to the total iron, was 46 wt.% for Ex. 4 with a basicity of 2.3, and the minimum metallisation belonged to Ex. 2 with a basicity of 0.8. However, the MD value of Ex. 4 was calculated using Equation (7) as a function of RD, whose result was 44 wt.%. The calculation of MD is theoretically correct if the iron oxide inside the slag would be only FeO and not Fe2O3. However, inside the steel crucible after each test run, there was no reduced or even melted ore. Hence, there was a deviation of less than 3% between the MD values obtained by the two methods.
of Ex. 6, which was 24.23 wt.%, was less than that of all the other experiments. Nevertheless, the metallisation was 47.64 wt.%, which was higher than that of all the other experiments.
To assess the efficiency of the process at longer times, the operation time of some experiments was extended up to 1975 s.
Table 9 shows the calculated results of the main reduction parameters.
The produced iron and metallisation increased by an increase in the operation time. The difference between the metallisation of Ex. 6 in 1495 s and 1975 s was considerably higher than that of the other experiments because of the continuous feeding of the iron ore to the crucible, which caused the iron oxides in the reduction zone to be reduced. This interpretation can be exemplified for a low decrease in for Ex. 6. This illustrated that in a continuous process of HPSR, the reduction rate can be kept constant.
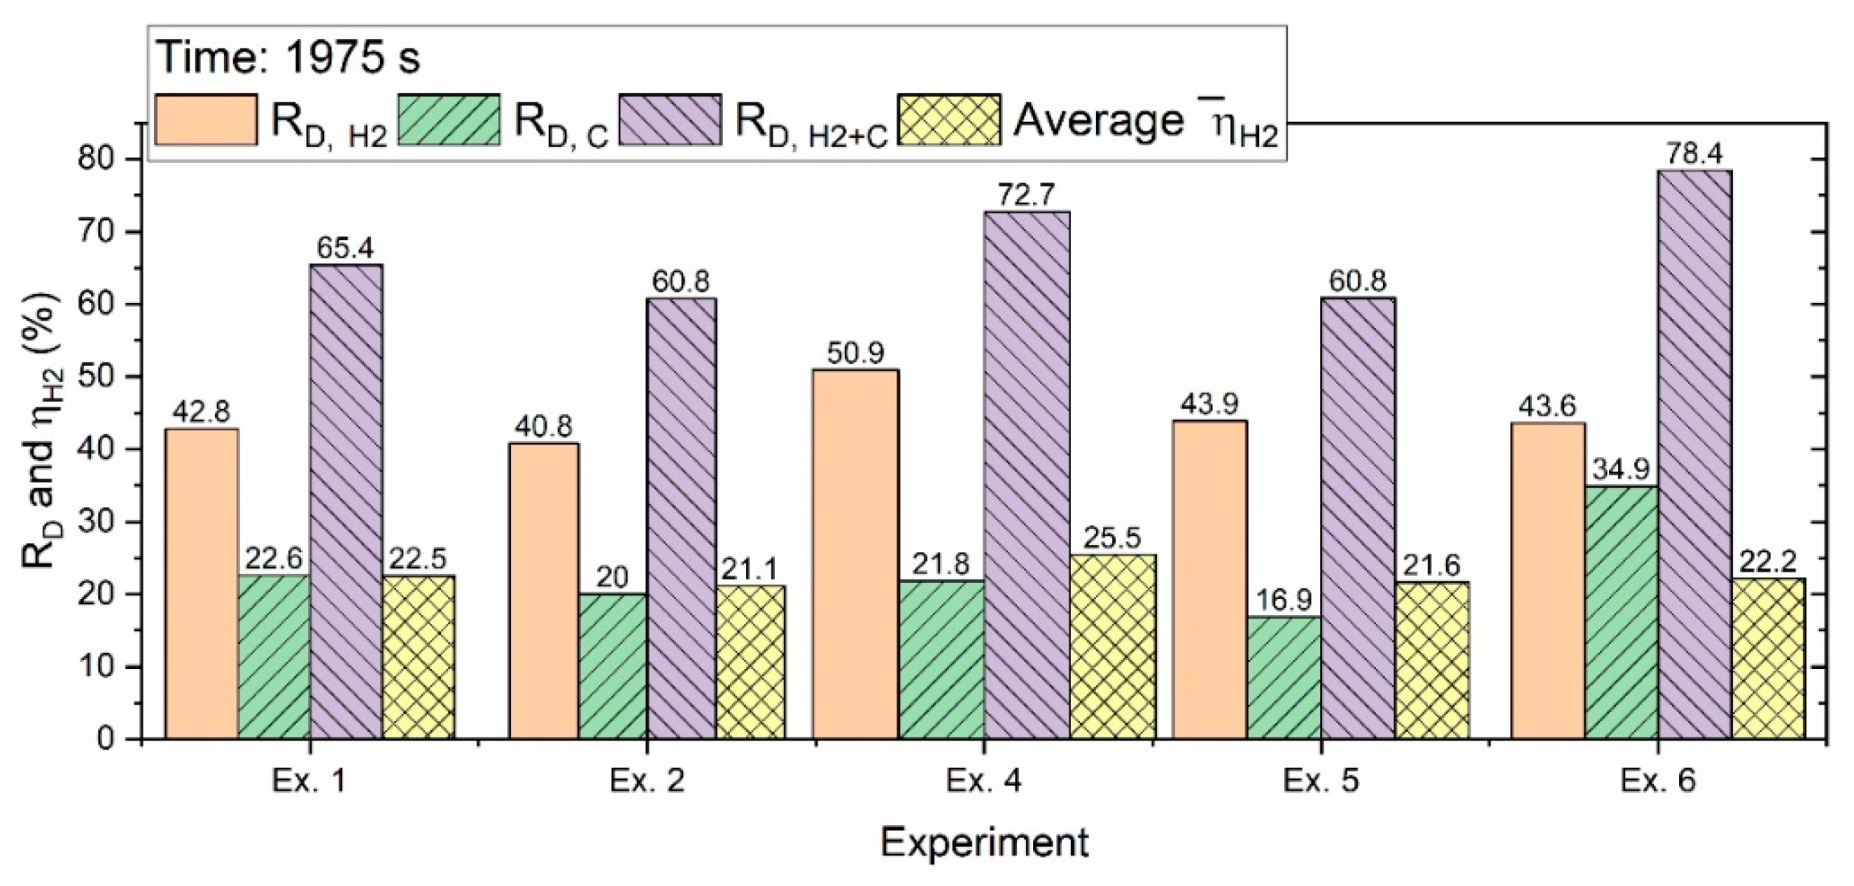
R
D,H2 in 1975 s was in every case more than 40%, while R
D,H2+C could reach 78% with the contribution of carbon to the reduction processes. The erosion rate of HGE and the amount of CO
2-emissions per ton of the produced liquid metal were presented in the previous work [
33].
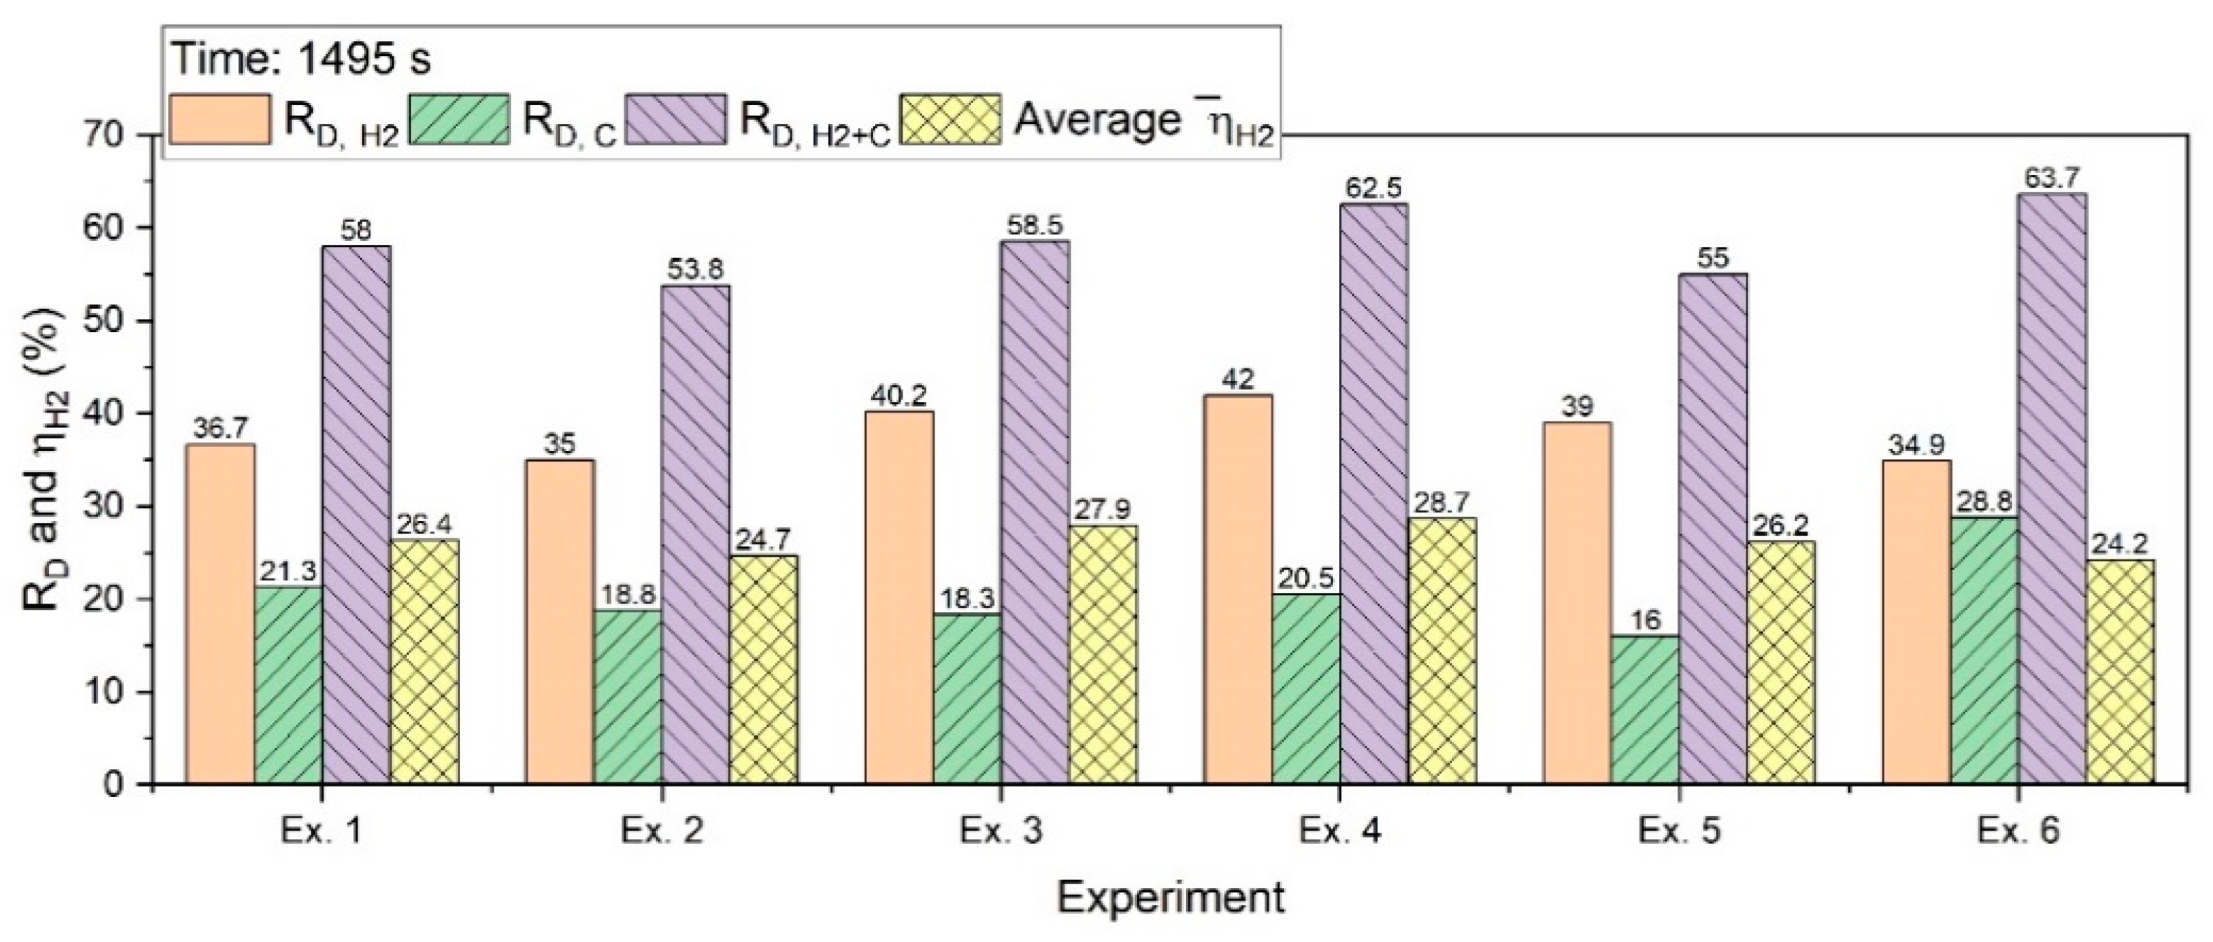
Figure 13 shows R
D,H2, R
D,C, R
D,H2+C, and
for an operation of 1495 s.
R
D,C for the batch charging experiments was in the range between 15% and 22%; however, for the continuous feeding of iron ore, it was 28.8%. The reasons for this have already been explained in
Section 3.1. R
D,H2+C was between 53% and 64%; Ex. 4 with a basicity of 2.3 had the highest degree among the batch experiments. A high contribution of carbon in the reduction process caused an increase in the total reduction degree for Ex. 6.
The
value for the experiments of the batch charge in 1495 s was more than 25%; then, with the extension of the experiments, it decreased.
Figure 14 shows the R
D value calculated in 1975 s.
With the extension of the experiments, the degrees of reduction increased. However, the decreased because of a decrease in the reduction rate over the time of the operation.
3.6. Slag
The weight of the slag for each case is mentioned in
Table 8 and
Table 9. To calculate the chemical composition of the slag, mass and energy balance were carried out, as it was not possible by the calculations to define the amount of Fe
2O
3 and FeO because Fe could be present in the slag in both the forms. Therefore, the phase stability was studied by FactSage
TM 7.2 (Thermfact/CRCT (Montreal, Canada) at equilibrium in the same range of the reduction zone temperature. For instance, the slag composition of Ex. 5 was calculated for an operation time of 1975 s and is presented in
Table 10.
The composition and the morphology of the slags of Exs. 5 and 6 were studied by SEM. At the end of the experiments, a layer of slag covered the produced iron, and the morphology and the chemical compositions of both sides were studied.
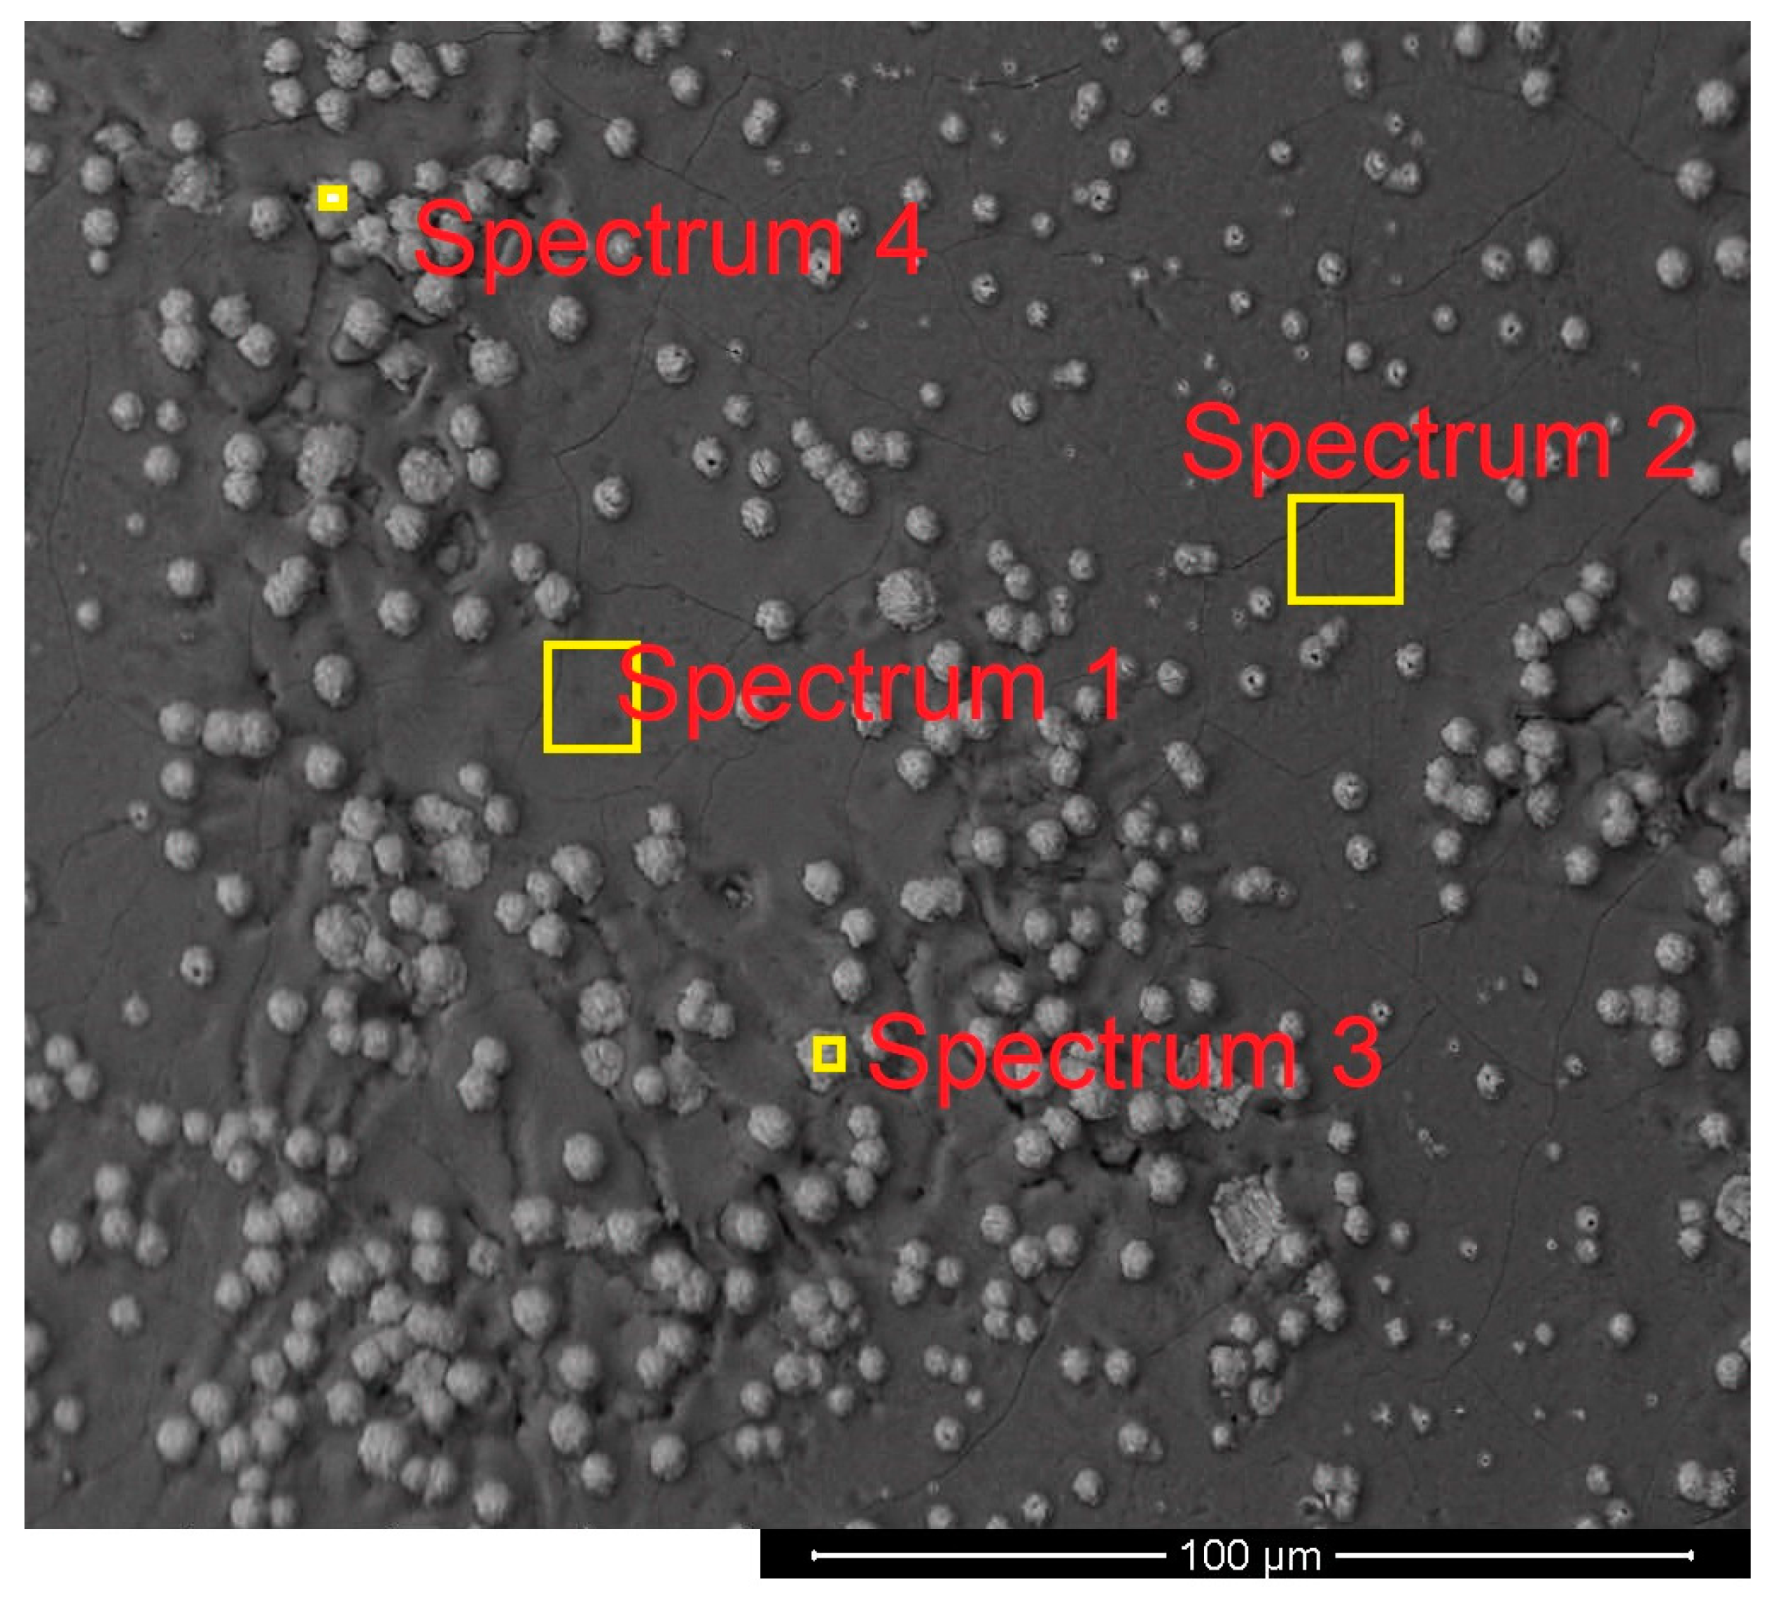
Figure 15 shows the morphology and the locations of the spectra on the upper side of the slag layer of Ex. 5.
It mainly consisted of white balls, which are iron ore particles, in a matrix of slag. The distribution of the ore particles was not uniform.
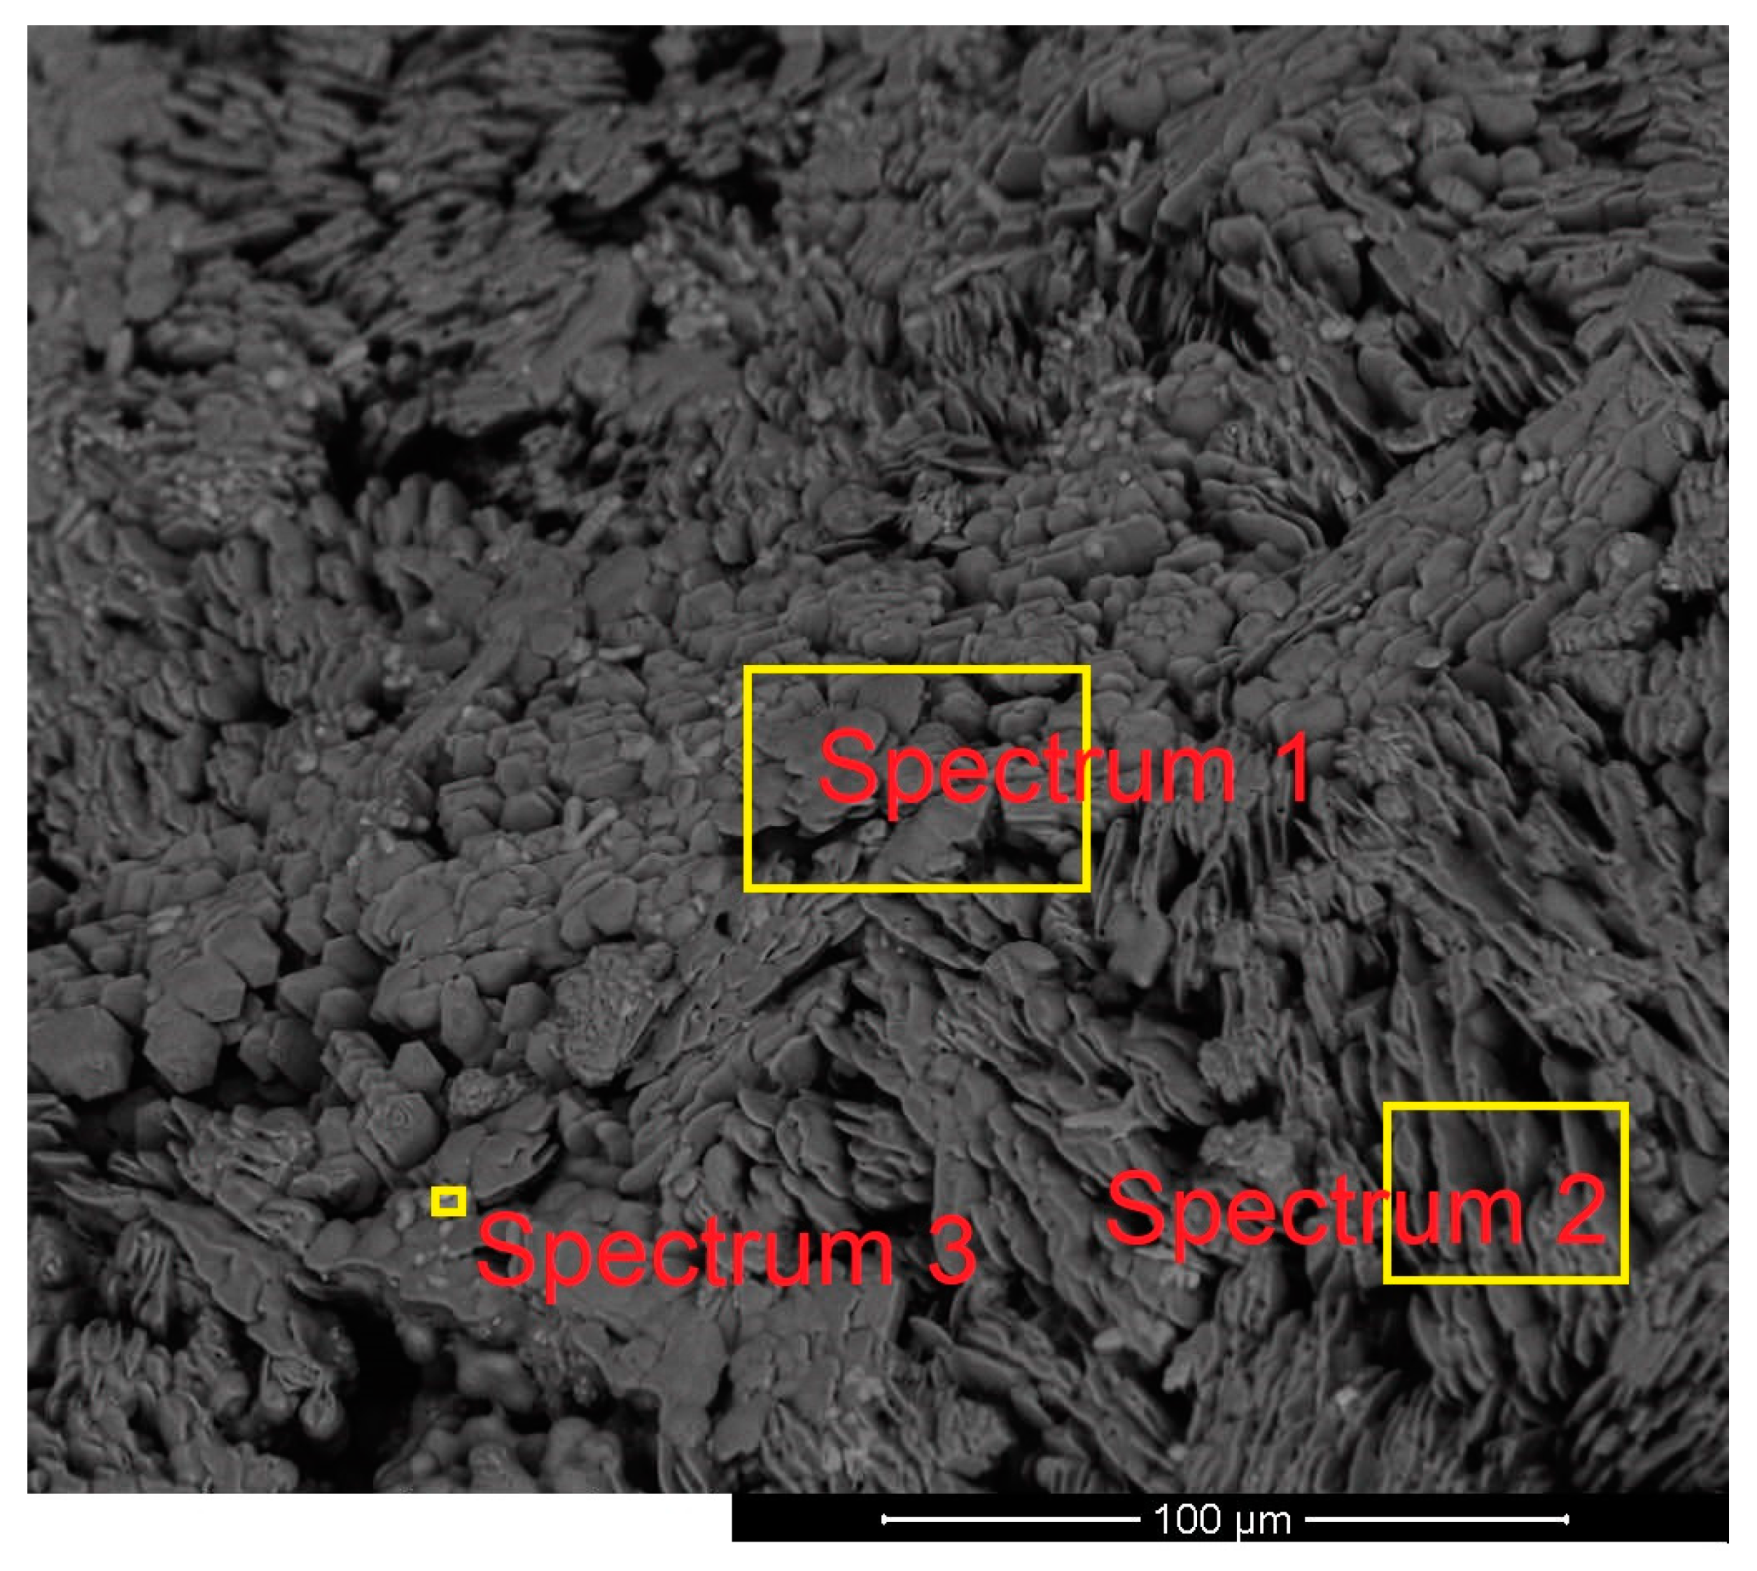
Furthermore, the lower side of the slag layer was assessed in terms of its morphology and chemical composition.
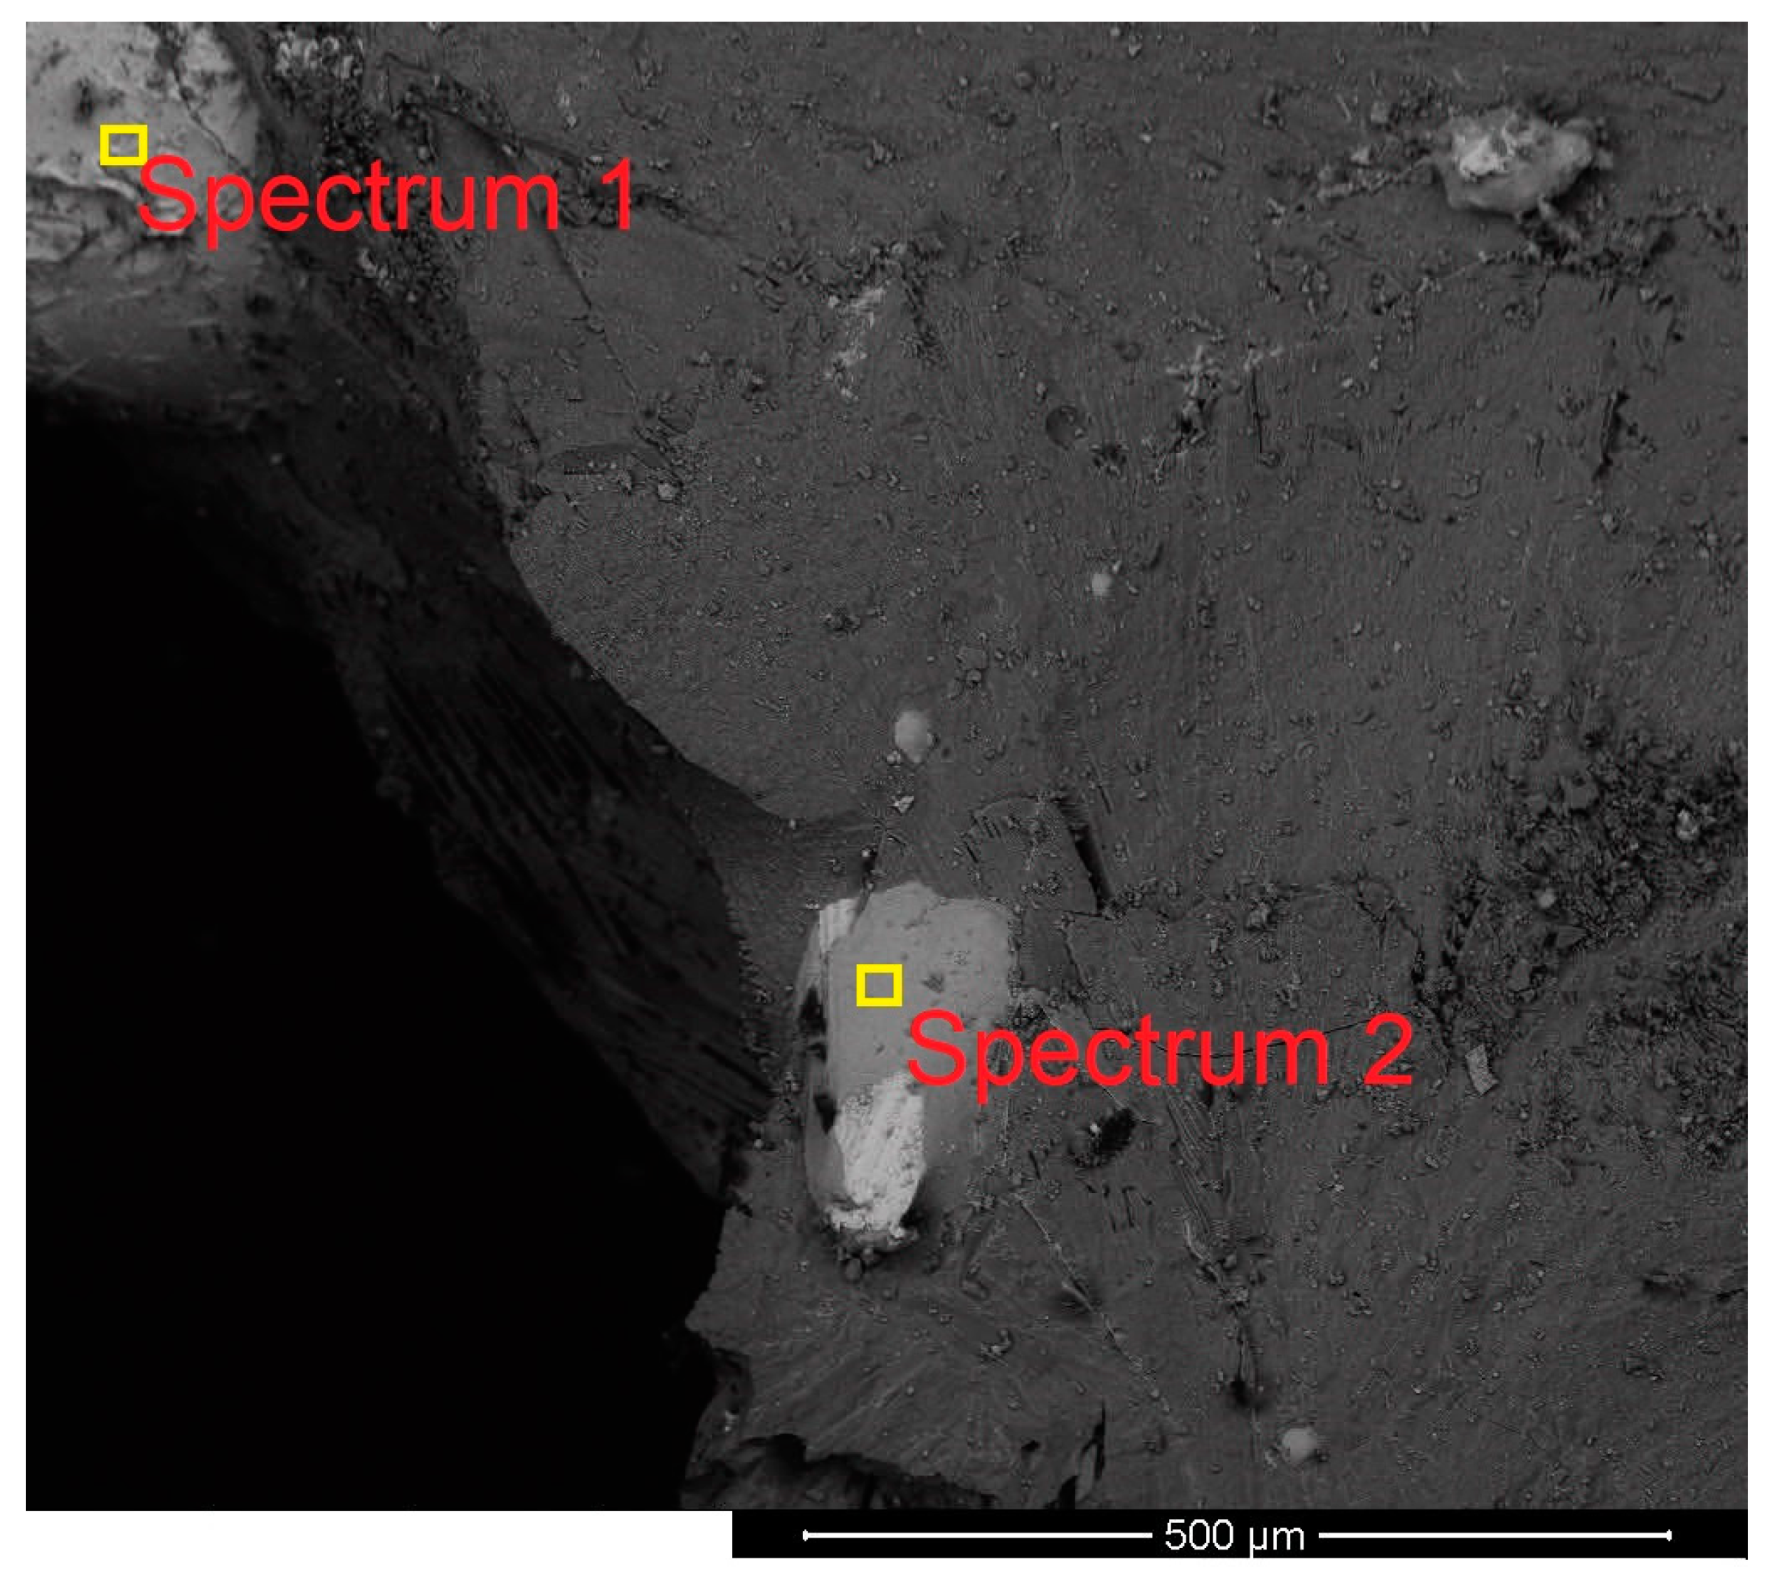
Figure 16 shows the microstructure of the lower side of the slag with the locations of the spectra.
On the lower side of the slag, the iron oxide particles were not observed. This means that iron oxide particles were melted and mixed with slag before reaching the lower side of the slag.
Figure 17 shows a section of slag of Ex. 6 with some droplets of the produced iron.
It shows that the iron oxide particles during continuous feeding were reduced and formed iron droplets in a matrix of slag. The droplets were grown to be heavier to leave the slag layer to penetrate into the melt.
The composition of the slags was measured at different locations by means of EDX, and the corresponding results are presented in
Table 11.
Spectra 1 and 2 of
Figure 15 and 1, 2, and 3 of
Figure 16 show a difference between the composition of the lower side and the upper side. On the lower side, the amount of iron oxides was less than that of the upper side because of the reduction process. The amounts of Mg and Mn on the lower side were higher than those of the other side. To check the results of EDX, a sample of slag from Ex. 5 was analysed by using X-ray fluorescence (XRF), and the corresponding results are shown in
Table 12.
Nevertheless, Fe could exist in the form of Fe2+ or Fe3+ in the slag; this is mentioned in the table as Fe2+ because by XRF, it was not possible to define the amounts of Fe2+ and Fe3+.
There was a large difference between the calculated chemical composition of the slag (
Table 10) and the results of XRF (
Table 12). The real composition of the slag showed that the basicity of the slag was lower than that expected. The basicity should have been 2.9; however, it was 1.6 according to
Table 12. The main reason was the entry of the material from the refractory to the melt. Sodium silicate was used as a binder for the application of the refractory lining. Therefore, the melting of the refractory material and mixing with slags increased the amount of SiO
2, which was why the real basicity was lower. The other point for the deviation of the real composition of the slag was the high reduction degree of iron oxide. Because slag was not homogenised, the iron oxide particles exposed to the reduction agent and plasma arc were reduced and the rest buried by the partially melted material in the steel crucible could not be reduced. This led to the production of a non-homogenised slag in the crucible. Therefore, to achieve the best conditions for the reduction process, the material inside the crucible should be completely melted. However, in the laboratory-scale facility, it was not possible to keep the material in the liquid phase during the operation, because of the use of a low-power furnace and cooling the system with water. Therefore, the achievement of a high degree of reduction was not possible with the laboratory-scale facility.
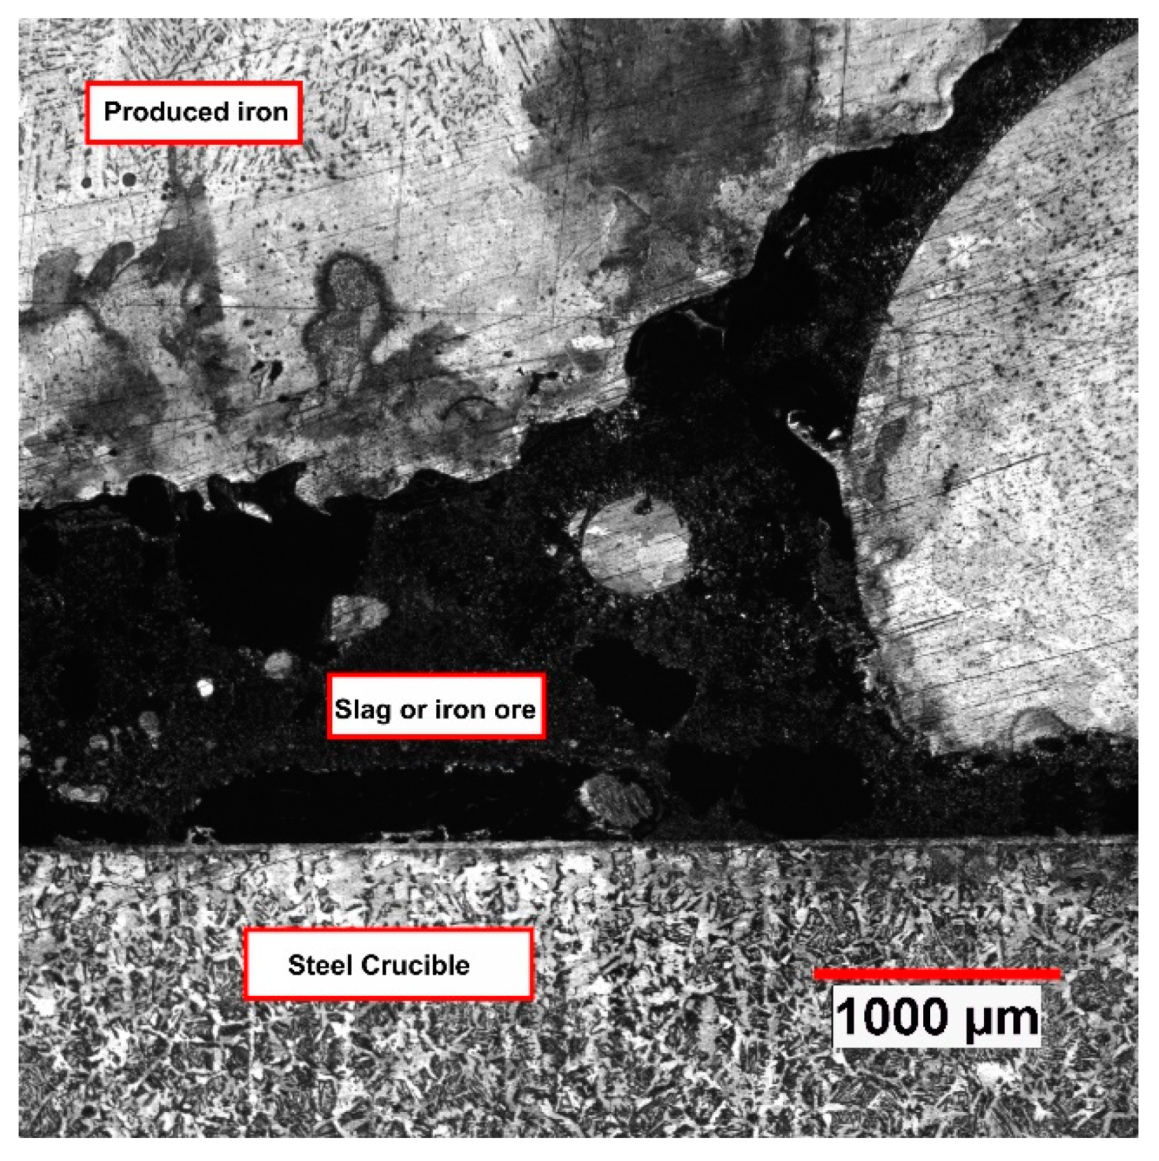
Figure 18 shows the slag or iron oxide buried by the produced iron.
The figure shows a mass of slag or non-reduced iron oxide buried under a layer of produced iron. Therefore, even with the extension of the operation time, the chance of reducing this section of material was low.
The composition of the slag in
Table 12 shows that the FeO content in the slag was less than 7%. This means that it was feasible to achieve a high degree of reduction in this process if the material could be melted and contacted with the reducing agent.
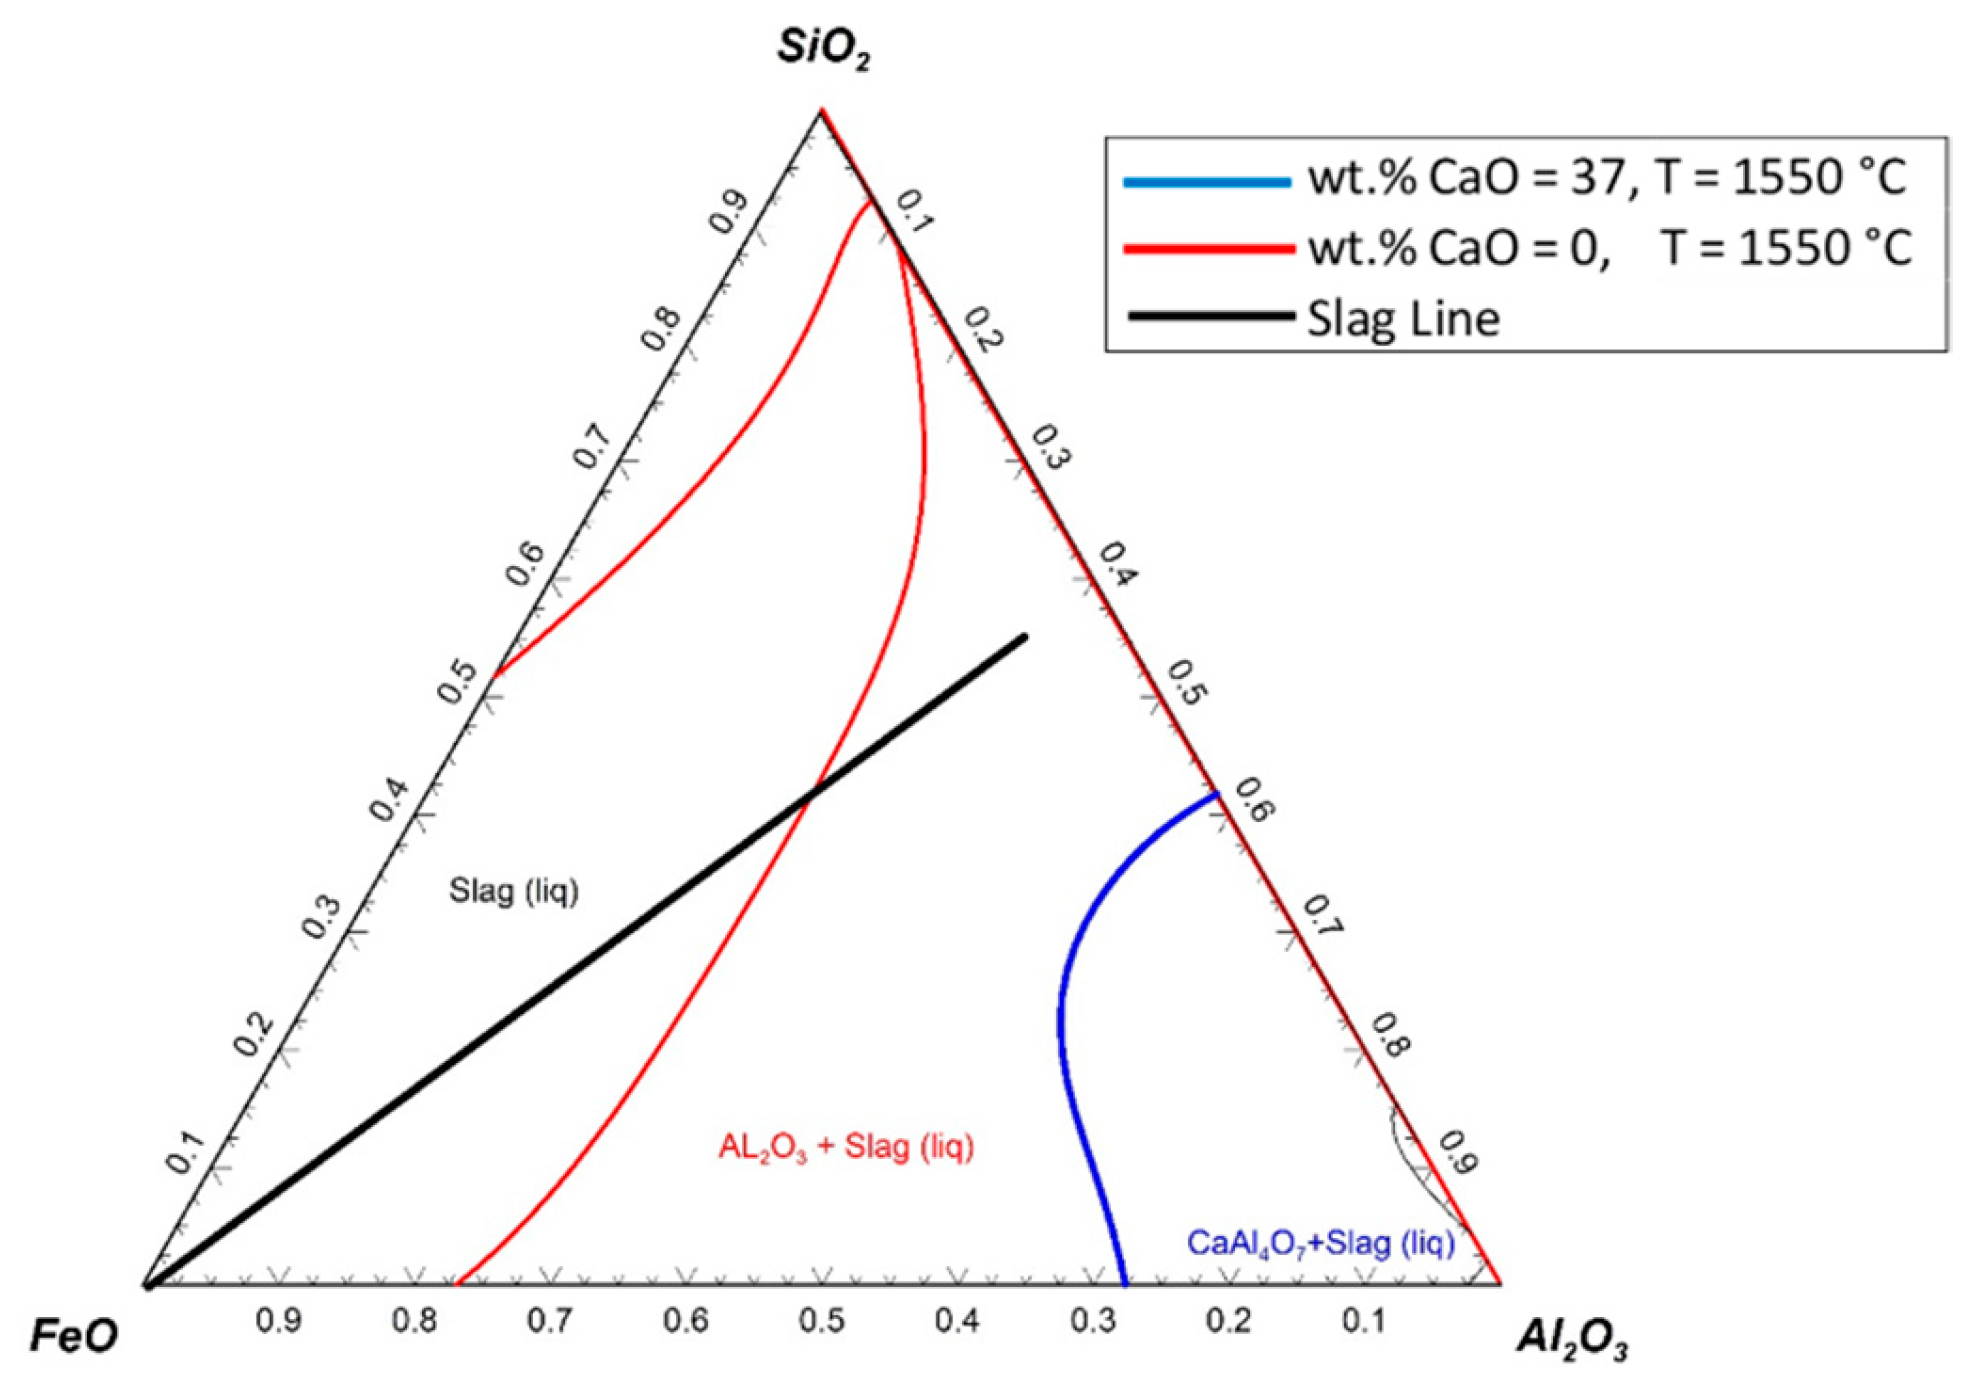
According to the composition of iron ore and lime, it was expected to produce a slag with a higher content of Al2O3 than that of MgO. However, due to the introduction of MgO from the refractory lining, the amount of MgO in the slag was higher than that of Al2O3. To analyse the liquidus temperature of the slag, two ternary systems, SiO2–FeO–Al2O3 and SiO2–FeO–MgO, with the additions of CaO were studied using FactSageTM 7.2. The maximum calculated basicity was 2.9 for Ex. 5; however, the chemical composition of the slag showed that it decreased to 1.6 due to the mixing of the refractory lining material with the melt. During the reduction process, the CaO amount in the slag continuously increased due to the decrease in the iron oxide.
A set of calculations was carried out to assess the possible solidifications of the SiO
2–FeO–Al
2O
3 system for the slags with 0% and 37% of CaO at 1550 °C. The results are shown in
Figure 19.
The presumptive slag line shows the changes in the slag composition during the reduction process. Nevertheless, the slag line was assumed to be a straight line; it could have different paths according to the melting and the reduction process. At the beginning of the reduction process, the FeO content in the slag was high, and then, because of the reduction process, it decreased. The red line shows the liquidus temperature of the slag without any addition of CaO. The solid particles could be formed if the FeO content decreased to less than 30%. The blue line shows the liquidus temperature of the slag with 37 wt.% CaO; therefore, the graph was normalised to 100% for the other components of the slag (SiO2–FeO–Al2O3). The slag line did not cross the line of the chart where 37 wt.% of CaO was added to the slag at 1550 °C; the slag always stayed in the liquid state. Hence, the reduction rate could be improved.
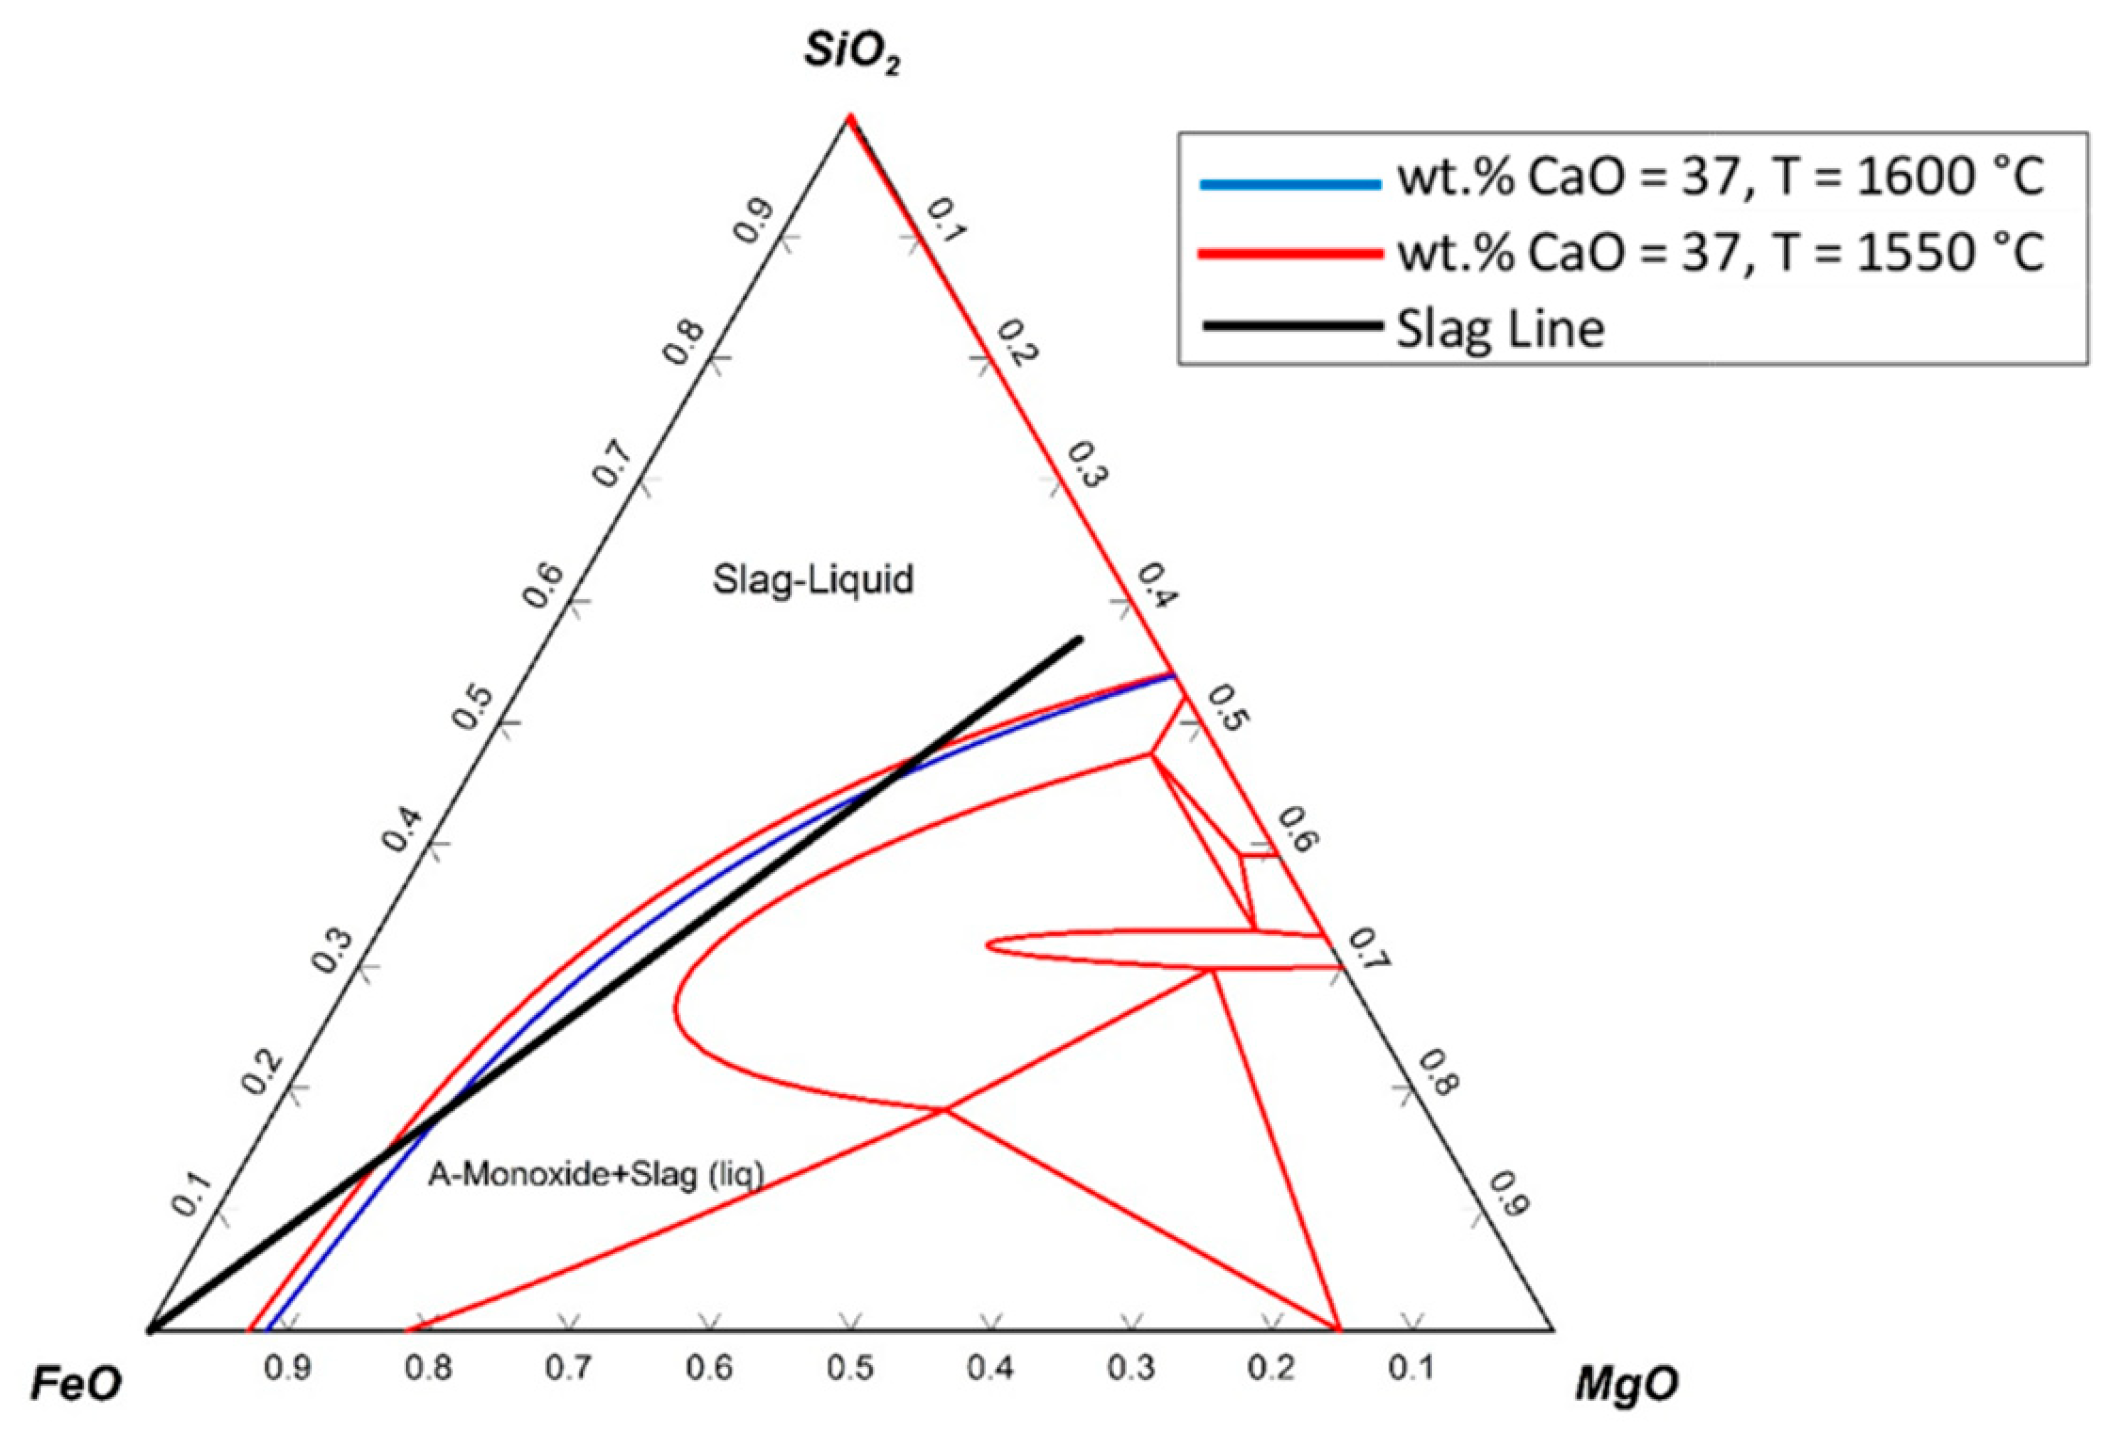
The ternary system of SiO
2–FeO–MgO with an addition of 37 wt.% CaO is shown in
Figure 20.
The ternary phase diagram was drawn at 1550 °C, and only one line (blue line) was added to the diagram, which was the liquidus line of the diagram at 1600 °C. The slag line crossed the liquidus line, which implied that during the reduction process, solid particles existed in the slag. Therefore, to melt the slag completely, the temperature had to be increased.
Furthermore, the SiO
2–FeO–MgO system with no addition of CaO is shown in
Figure 21.
In this system, the slag line was located in the liquid slag. However, with a decrease in the FeO content to less than below 10%, the solid particles of SiO2 might be formed.
With a comparison of these three ternary diagrams, it can be suggested that the SiO2–FeO–Al2O3 system with the addition of CaO was appropriate for the operations, as in this system, there was no solid component in the slag phase at 1550 °C. Furthermore, preventing the entrance of refractory materials to the melt can improve the reduction process. One solution is the use of high-alumina refractories such as spinel- instead of magnesia-based refractories.


