Structural Properties and Water Uptake of SrTi1−xFexO3−x/2−δ
by
 , , , and
Tadeusz Miruszewski
, 
Kacper Dzierzgowski
,
Piotr Winiarz
*,
Sebastian Wachowski
,
Aleksandra Mielewczyk-Gryń
and
Maria Gazda
Department of Solid State Physics, Faculty of Applied Physics and Mathematics, Gdańsk University of Technology, Narutowicza 11/12, 80-233 Gdańsk, Poland
*
Author to whom correspondence should be addressed.
Materials 2020, 13(4), 965; https://doi.org/10.3390/ma13040965
Submission received: 14 January 2020
/
Revised: 14 February 2020
/
Accepted: 19 February 2020
/
Published: 21 February 2020
(This article belongs to the Section Materials Chemistry)
Abstract
:In this work, Fe-doped strontium titanate SrTi1−xFexO3−x/2−δ, for x = 0–1 (STFx), has been fabricated and studied. The structure and microstructure analysis showed that the Fe amount in SrTi1−xFexO3−x/2−δ has a great influence on the lattice parameter and microstructure, including the porosity and grain size. Oxygen nonstoichiometry studies performed by thermogravimetry at different atmospheres showed that the Fe-rich compositions (x > 0.3) exhibit higher oxygen vacancies concentration of the order of magnitude 1022–1023 cm−3. The proton uptake investigations have been done using thermogravimetry in wet conditions, and the results showed that the compositions with x < 0.5 exhibit hydrogenation redox reactions. Proton concentration at 400 °C depends on the Fe content and was estimated to be 1.0 × 10⁻² mol/mol for SrTi0.9Fe0.1O2.95 and 1.8 × 10⁻⁵ mol/mol for SrTi0.5Fe0.5O2.75. Above 20 mol% of iron content, a significant drop of proton molar concentrations at 400 °C was observed. This is related to the stronger overlapping of Fe and O orbitals after reaching the percolation level of approximately 30 mol% of the iron in SrTi1−xFexO3−x/2−δ. The relation between the proton concentration and Fe dopant content has been discussed in relation to the B-site average electronegativity, oxygen nonstoichiometry, and electronic structure.
1. Introduction
In recent years, mixed ionic–electronic conductors (MIECs) with relatively high electronic and ionic transfer numbers have attracted much attention. Especially perovskite-type oxides (ABO3) are considered as promising compounds. Their ability to stabilize higher oxidation states of B-site transition metal cations while maintaining the perovskite-type structure at high defect concentration makes them good candidates for use as electrodes in a solid-oxide fuel cells (SOFCs) [1], membranes [2], sensors [3] or other electrochemical devices [4].
Strontium titanate (SrTiO3−δ-STO) and strontium ferrite (SrFeO3−δ-SFO) have been attracting attention thanks to their unique charge transport properties and stability in different oxygen partial pressure ranges. Strontium titanate is a wide-gap semiconductor (Eg = 3.2 eV at T = 0 K) with low catalytic activity [5]; however, its electronic and/or ionic conductivity may be modified by aliovalent doping. Donor dopant introduced into SrTiO3, i.a. Y3+ [6], La3+ [7] or Prn+ [8] on the Sr2+ or Nb5+ on theTi4+ [9,10] site, is compensated by the formation of cation vacancies and electrons in the conduction band [11]. On the other hand, the presence of acceptor dopants (Fen+ [12,13,14], Cr3+ [15], Sc3+ [16], Al3+ [17], Con+ [18]) leads to forming either ionized oxygen vacancies or electron holes. Therefore, a proper selection of the doping strategy enables tuning of the concentration of ionic and electronic charge carriers. Moreover, SrTiO3 has good chemical stability at a wide oxygen partial pressure range [19], which makes the material feasible in many applications in electrochemical devices.
Strontium ferrite (SrFeO3−δ) is a mixed ionic–electronic conductor that exhibits metallic-type conduction with high electrical conductivity and high oxygen ionic conductivity at oxidizing atmosphere (electronic and ionic conductivities are approximately 103 S/cm and 0.2 S/cm at 850 °C in the air, respectively) [20]. Iron cations in this material are in a mixed-valence state (in a range from +3 to +4), which corresponds to the oxygen nonstoichiometry [21,22]. In contrast to SrTiO3, this material is unstable under low pO2, where the tetravalent iron cations reduce to the trivalent form (Fe3+), which leads to the long-range ordering of oxygen vacancies. In this case, the composition changes to SrFeO2.5 and the structure changes from cubic perovskite to orthorhombic brownmillerite [21,23]. In applications, it is not favorable, because the phase transition is associated with an oxygen ionic conductivity decrease as well as the mobility and concentration of holes [24].
The SrTi1−xFexO3−δ, the solid solution of SrTiO3 and SrFeO3 in the range of 0 < x < 1, was first reported in 1968 by Brixner [25] and represents a model of the mixed ionic–electronic conductor. In the SrTi1−xFexO3−x/2−δ family of materials, oxygen ionic and electronic conductivities depend on the iron content [13,26]. Starting from the compositions with low iron content, it has been found that when titanium tetravalent cations in SrTiO3 are substituted by a trivalent iron, compensation occurs through oxygen vacancies in the oxygen sublattice, which influences the electronic properties of the material.
Only a few reports have been published concerning the hydration, hydrogenation, and proton conductivity of strontium titanate, strontium ferrite, and solid solutions so far. In 2002, Wideroe et al. [27] analyzed the proton conduction by the EMF (Electromotorical Force Method) and water uptake in Al-doped SrTiO3 by thermogravimetric measurements. They concluded that this material exhibits an uptake of neutral hydrogen at high temperature and low oxygen partial pressure. The first theoretical analysis of hydration, electronic structure, and proton transport in A-doped Sr2Fe1.5Mo0.5O6−δ (SFMO) perovskites was reported by Muñoz-García et al. [28]. They found that the K-doped SFMO is a promising oxygen ion-, proton-, and hole-conducting oxide material (so-called triple conducting oxide). The proton concentration in various perovskite-related structures containing iron or other transition metals were studied by several authors [29,30,31,32,33,34,35,36]. For example, Han et al. reported a significant proton concentration level of around 0.13 per unit cell in Sr and Fe co-doped LaScO3 [37], which is comparable with that reported for Y-doped barium zirconate [38]. A significant water uptake that was mostly related to the hydration process was observed in doped BaFeO3 materials. In 2017, Zohourian et al. [34] reported a proton concentration of around 0.11 per unit cell for Ba0.85La0.15Fe0.8Zn0.2O3 composition, which is actually one of the highest values reported for mixed conductors with high electron transfer numbers. Most of the reports show that the proton uptake occurs by OH● incorporation (hydration), H2 incorporation (hydrogenation), or by a combination of the two processes [33,34].
In this work, SrTi1−xFexO3−x/2−δ oxides with different content of Fe3+ (0 ≤ x ≤ 1) were synthesized and evaluated in dry and wet atmospheres. The main effort was devoted to the studies of structure, microstructure, water uptake, and proton concentration in these materials.
2. Materials and Methods
2.1. Synthesis Protocol
The SrTi1−xFexO3−x/2−δ samples with x = 0; 0.1; 0.2; 0.3; 0.4; 0.5; 0.6; 0.8; and 1 (in further text, these are denoted as STFx), were synthesized by a conventional two-step solid-state synthesis. Stoichiometric amounts of the SrCO3, TiO2, and Fe2O3 powders (all precursors with >99.9% purity) were mixed together in an agate mortar for 45 min. The mixed powders were uniaxially pressed into cuboidal pellets with an approximate size of 1 mm × 10 mm × 12 mm with a pressure of 200 MPa. In the first step of heat treatment, the pellets were heated at 1000 °C in the air for 12 h. In the next step, they were crushed, ground for 30 min, and repelletized using 300 MPa pressure, and sintered at a temperature between 1200 and 1400 °C for 24 h, depending on the composition. It has to be underlined that different sintering temperatures were checked for every sample in order to obtain single-phase materials. After that, the optimal temperature was chosen and listed in Table 1. The optimal sintering temperatures, as well as the measured densities and open porosities of the obtained pellets, are shown in Table 1.
2.2. Structural and Microstructural Characterization
In order to determine the structural properties of the obtained materials, a Phillips X’Pert Pro diffractometer (XRD) (Almelo, The Netherlands) with CuKα (1.540 Å) was used. The measurements were carried out in the 10–120° range under 40 kV and 40 mA, at room temperature in air. Unit cell parameters were determined by Rietveld refinements in FullProf Suite software (3.0, June 2015) [39]. As an initial point of the analysis, unit cell parameters of the SrTiO3 structure (space group no. 221, Pm-3m) were used.
The microstructure of the sintered pellets surfaces/cross-sections was examined on an FEI Quanta FEG 250 Scanning Electron Microscope (SEM) (Waltham, MA, USA). The SEM images were collected using an Everhart–Thornley Detector (ETD) detector for secondary electrons in a high vacuum at 20 kV acceleration voltage. The analysis of materials composition by Energy Dispersive X-Ray Spectroscopy (EDS) was performed using the EDAX ApolloX SDD spectrometer (Mahwah, NJ, USA). The density and porosity of the pellets were determined using the Archimedes method with kerosene as a liquid medium.
2.3. Thermogravimetric Analysis
Thermogravimetric analysis (TGA) (Burlington, MA, USA) was performed to determine the oxygen nonstoichiometry and water uptake of SrTi1−xFexO3−δ. The analysis was conducted on a Netzsch Jupiter® 449 F1 both in dry and wet atmospheres. Two dry atmospheres were applied: dry air (pO2 ≈ 0.20 atm., pH2O ≈ 3 × 10⁻⁵ atm., estimated for RH = 80% and T = 25 °C in ProgasMix FC software (v 0.7.1)) and dry nitrogen (pO2 ≈ 2 × 10⁻⁶ atm., pH2O ≈ 3 × 10⁻⁵ atm.). In order to introduce water into the atmosphere, a gas mixer equipped with wetting and drying stages was used. Before each measurement, a blank run for baseline correction was carried out in both atmospheres separately. Prior to TGA tests, the samples were annealed in 1100 °C in the air for 10 h with a heating rate of 3 °C/min and quenched; for measurements, the pellets were ground.
To determine the oxygen vacancies concentration and oxidation enthalpy, the sample mass change was recorded in dry synthetic air and dry nitrogen in the temperature range of 40–1000 °C. Assuming that the recorded mass difference between the initial mass recorded at temperature T0 and the mass at temperature T, , is related to the oxygen loss only, the temperature evolution of the oxygen nonstoichiometry Δδ(T)ns (molar oxygen vacancies concentration) as well as a volumetric concentration of oxygen vacancies related to the oxygen nonstoichiometry, , may be calculated according to the following relation:
where µs and µo are sample and atomic oxygen molar masses, respectively.
To determine the water uptake of SrTi1−xFexO3−x/2−δ, a series of TG analyses with switches between dry and wet air were performed. First, the sample was heated to 800 °C and held at this temperature for 180 min in dry air in order to remove adsorbed water and carbon dioxide from the surface. Next, the sample was cooled to 400 °C in dry air. After two hours, the dry air was switched into the humidified one (pH2O ≈ 2.3 × 10⁻² atm.); then, after an additional 2 h, the wet air was switched back into the dry air. The difference between the masses recorded in the dry and wet air at 400 °C (ΔmH2O) allowed us to estimate the molar protonic defects concentration . Equation (5) gives the relations between ΔmH2O and hydrogen in the case of hydrogenation as a predominant process of forming protonic defects.
where µs is a molar mass of the sample and µH2 is a molar mass of molecular hydrogen, whereas ms is the mass of the sample in dry air before the switch into the wet air.
3. Results
3.1. Structure and Microstructure of SrTi1−xFexO3−x/2−δ
The X-ray diffractograms obtained for SrTi1−xFexO3−x/2−δ samples are shown in Figure 1. All the observed diffraction reflections correspond to the cubic perovskite phase, which means that within the sensitivity of the XRD method, the samples in the wide iron content range are single-phase solid solutions of strontium titanate and ferrite. For Fe-rich compounds, this indicates that the substitution of Fe4+ by Ti4+/3+ cations in SrFeO3 stabilizes the perovskite cubic phase even for low Ti contents [40]. It was observed also in [25].
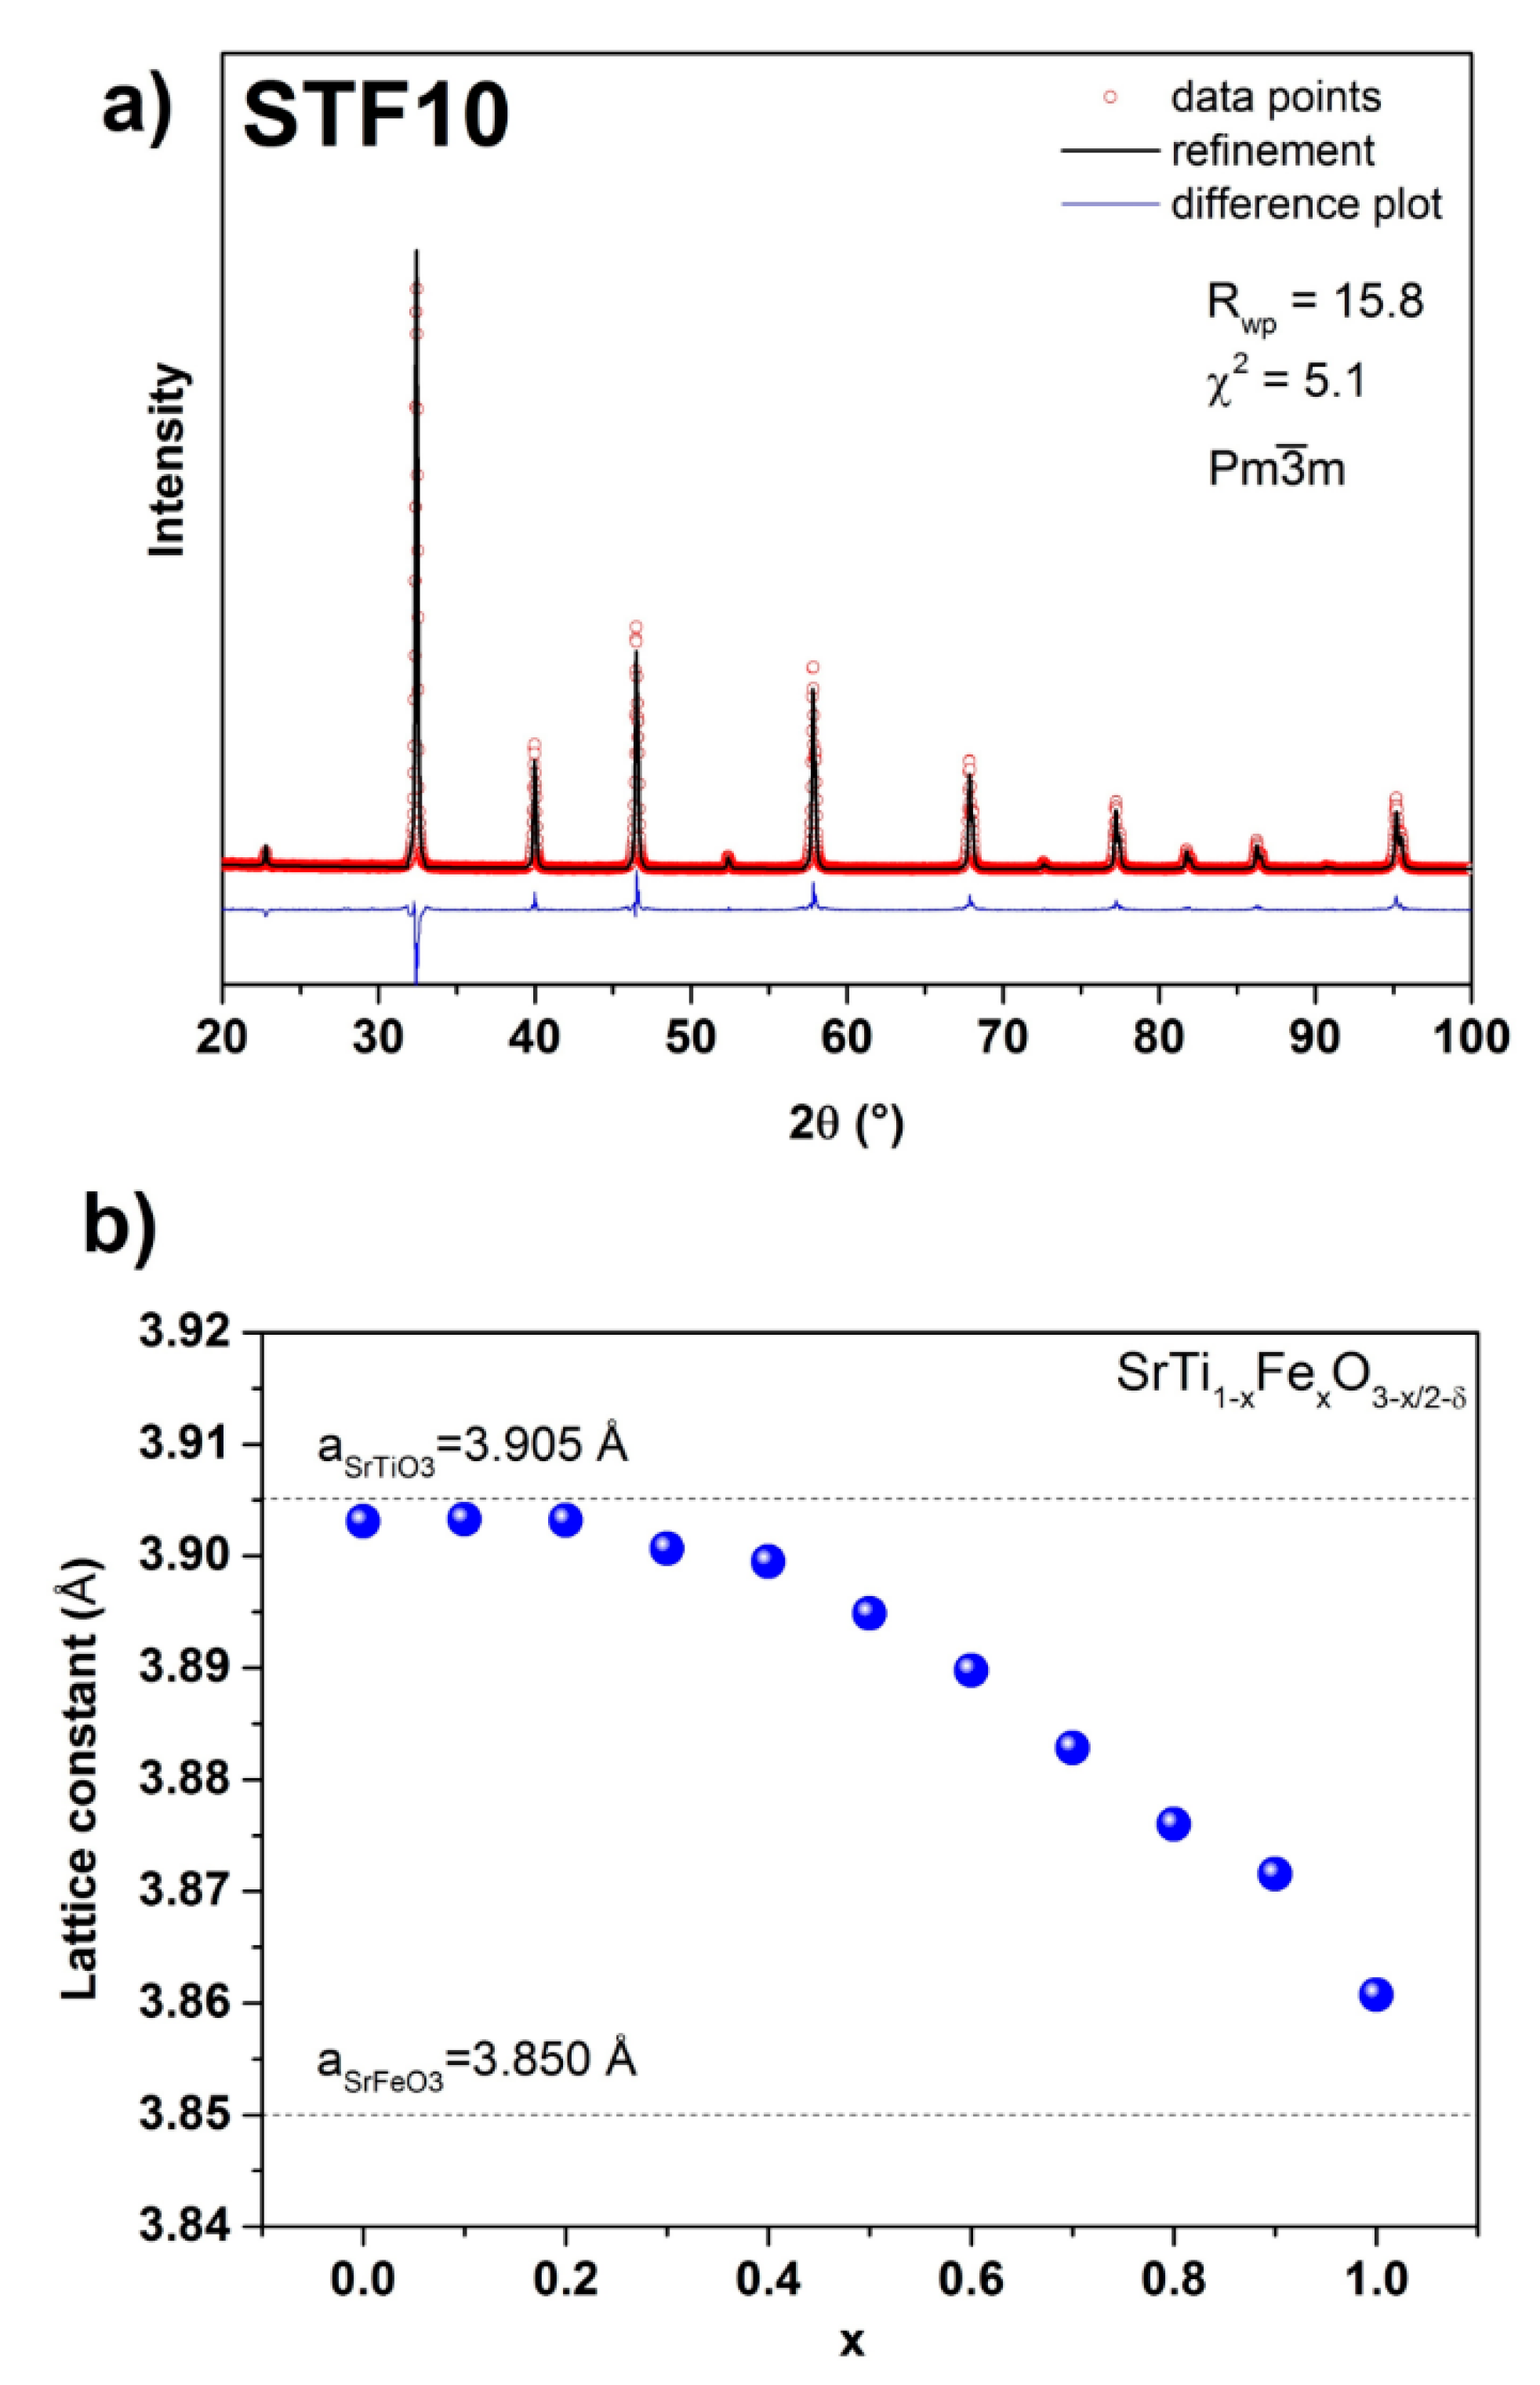
The Rietveld refinements of the obtained RT diffractograms were carried out the model of a cubic perovskite structure with a Pm-3m space group. The exemplary results of the Rietveld profile obtained for SrTi0.9Fe0.1O2.95−δ and the difference plot are shown in Figure 2a. The calculated values of unit cell parameters as a function of Fe content are presented in Figure 2b. The unit cell parameter remains constant until x ≈ 0.2, whereas for x > 0.2, it decreases with the increasing iron content. A similar tendency was observed by Vračar et al. [41] and Ghaffari et al. [42]. A quasi-linear dependence of the unit cell parameters on iron content, which follows Vegard’s rule, is caused by the difference between the ionic radius of six-fold coordinated Ti4+ cation (0.605 Å) and Fe4+ (0.585 Å) [43]. The substitution of Ti4+ with smaller Fe4+ affects the unit cell parameters indirectly, i.e. through its influence on the O2− size, which occurs for x ≥ 0.15 [41]. This explains why Vegard’s rule is not observed in the samples with low iron content. Moreover, other factors also possibly influencing the oxygen sublattice such as grain size or different applied sintering temperatures may affect observed unit cell parameters. On the other hand, these factors, as introducing oxygen nonstoichiometry, are expected to cause the deviation from the linear dependence of unit cell parameter on x [41]. So, we considered the iron content in the SrTi1−xFexO3−x/2−δ solid solutions as a major factor influencing the unit cell parameters. Another structural characteristic that may influence the properties of SrTi1−xFexO3−x/2−δ is the possible lattice distortion caused by Ti substitution with Fe. Indeed, Vračar et al. [41] found that the EXAFS (Extended X-Ray Absorption Fine Structure) analysis showed the presence of different Ti-O and Fe-O distances in the same sample. This local lattice strain does not bring about a unit cell distortion: in the whole range of x, the Pm-3m space group appropriately describes the lattice.
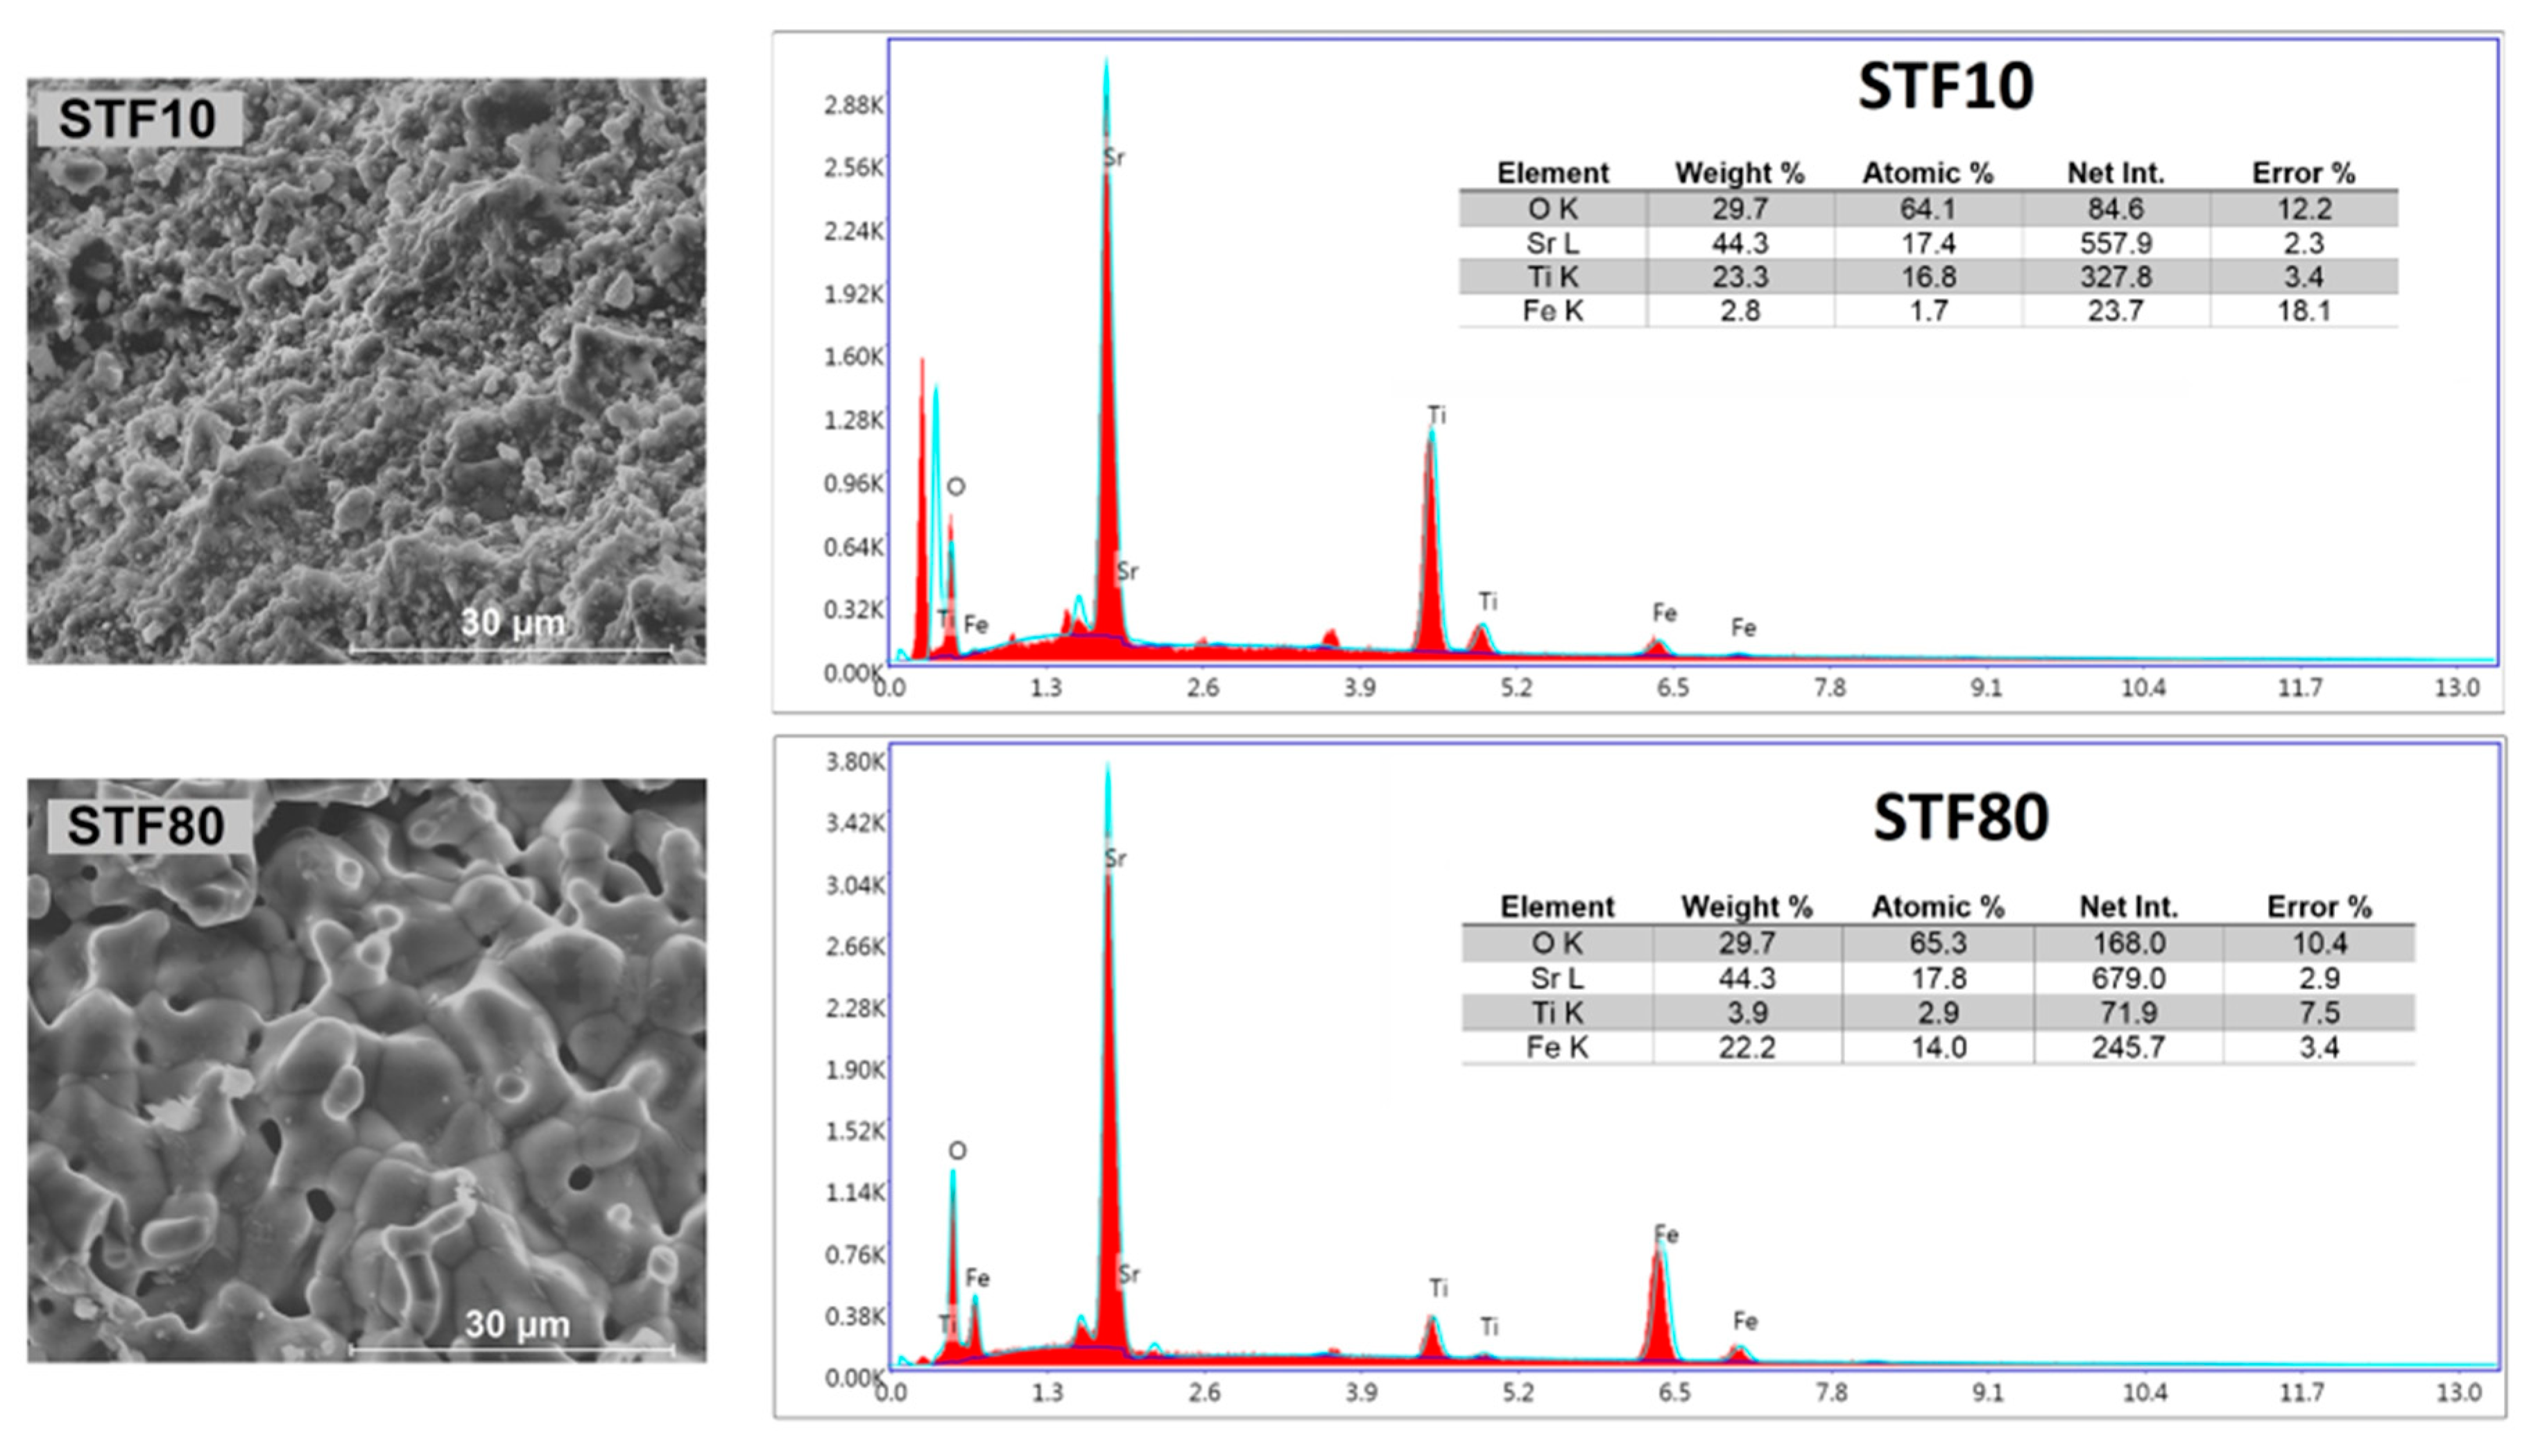
Figure 3 shows exemplary SEM images, as well as EDX spectra for SrTi0.9Fe0.1O2.95−δ and SrTi0.2Fe0.8O2.6−δ samples. All the investigated samples were porous, and the grain size differed as a function of iron content. The estimated grain sizes were between 0.5 and 14 µm, and the average value grew with increasing iron content. This may be caused by the faster diffusion of cations and oxygen during the synthesis in samples with larger Fe content. The Fe/Ti ratios, within an SEM-EDS measurement uncertainty of approximately 5%, are similar to the nominal values for two samples ((Fe/Ti)nominal = 0.11; (Fe/Ti)exp = 0.10 for STF10 and (Ti/Fe)nominal = 0.25; (Ti/Fe)exp = 0.21 for STF80).
3.2. Oxygen Nonstoichiometry
The temperature dependence of mass loss as a function of temperature (200–1000 °C) in dry nitrogen and dry air atmospheres, collected by TG, is presented in Figure 4. Since the oxygen vacancies and electronic holes are predominant defects, the recorded mass change is related to the release of oxygen. The qualitative analysis of the plots obtained for particular samples reveals the following characteristic features: (1) The mass in dry nitrogen (Figure 5a) decreases monotonically with increasing temperature, whereas in the air (Figure 5b) in some temperature ranges, the mass is almost constant or even slightly increases. (2) In all cases, the rate of mass change depends on temperature. (3) The value of the total oxygen loss is higher in the samples with higher iron content.
From the defect chemistry point of view, the heating of SrTi1−xFexO3−x/2−δ in different atmospheres leads to the thermal generation of intrinsic defects, i.e., anion Frenkel defects, and equilibration of the oxygen content in the oxide with the partial oxygen pressure in the atmosphere. The former process is not observed in the TG results, since it does not change the oxygen stoichiometry, whereas the latter causes either oxygen deficiency (δ > 0) or excess (δ < 0), depending on the temperature and the oxygen pressure. As a result of the thermal history of the sample, a small “frozen-in” oxygen deficiency exists in the SrTi1−xFexO3−x/2−δ oxides, which explains the small increase of oxygen content observed in the air at a temperature below approximately 500 °C. As could be expected, in the nitrogen atmosphere, only a depletion in oxygen occurs. The influence of the iron content on the rate of the mass change, the temperature onset of the mass change, as well as the maximum value of the mass change is related to the enthalpy of reduction and the chemical diffusion coefficient of oxygen in the SrTi1−xFexO3−x/2−δ materials. It was reported that the reduction enthalpy is lower in the samples containing more iron [44], whereas the oxygen chemical diffusion coefficient is around two orders of magnitude higher in SrFeO3 than in SrTiO3 [45,46]. So, increasing the iron content causes an increase of both the rate of reduction reaction and the oxygen diffusion rate out of the oxide. Apart from the influence on the total oxygen nonstoichiometry, the diffusion constant strongly influences the temperature range at which a change in the oxygen release kinetics is different. Below some characteristic temperature (for example, 685 °C for STF20 or 550 °C for STF30 at dry nitrogen), probably only the oxygen release from the surface of the sample may be expected, whereas above this temperature, a combination of the releasing processes of oxygen may occur. A similar behavior was observed by Park et al. [47] for La-donor doped STF material and by Stevenson et al. in a (La,Sr)(Co,Fe)O3 system [48].
The data shown in Figure 4 allow estimating the total concentration of oxygen vacancies. As it was shown by e.g., Rothschild et al. [12] and Steinsvik et al. [14], in the whole range of iron content, iron prefers a +3 valence state in an oxidizing atmosphere; that is, the formula is the most suitable to describe the STFx system. Therefore, Fe3+ is an acceptor dopant that is compensated predominantly by oxygen vacancies [12,25,49].
This can be expressed by Equation (3):
A total molar oxygen vacancies concentration was calculated from Formula (4):
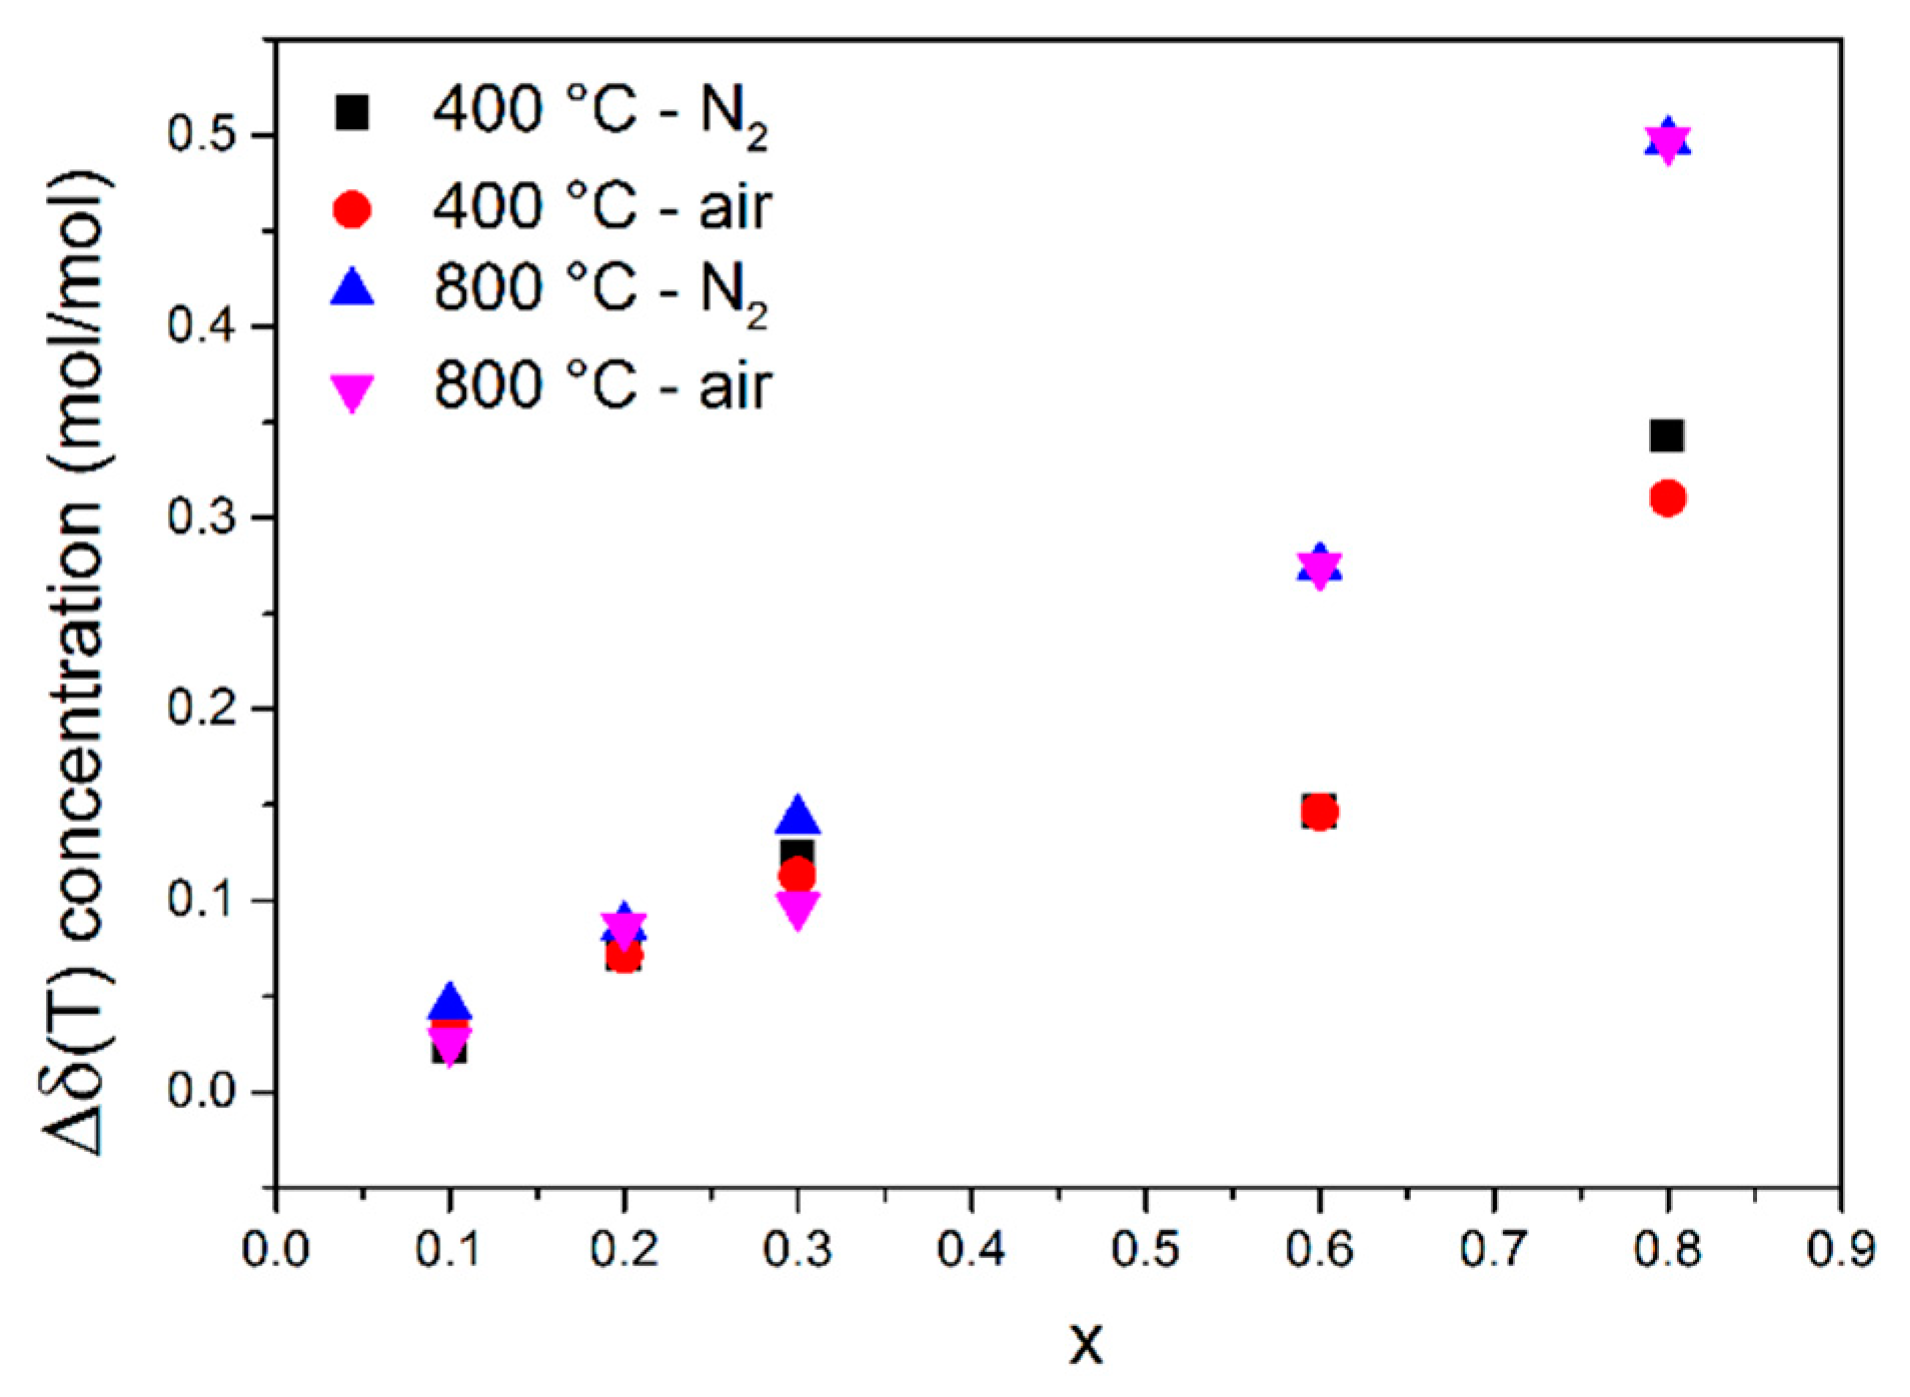
where is the molar oxygen vacancies concentration related to the oxygen nonstoichiometry, and denotes a molar acceptor dopant concentration. Figure 5 shows the obtained results as a function of iron content at two temperatures.
It can be seen that the increase of Fe content in the samples leads to an increase in a total molar oxygen vacancy concentration. In order to compare the obtained results to the values given in the literature, the volumetric total oxygen vacancies concentration was calculated. For this purpose, the suitable formula was used (Equation (5)):
where Vel is the volume occupied by one SrTi1−xFexO3−x/2−δ formula unit, which in this case is the unit cell volume. The unit cell volume determined by XRD data at room temperature corrected on the basis of linear thermal expansion coefficient of pure and undoped SrTiO3 ( [50]) was used for calculations in the case of all the investigated compositions. The isotropic conditions were assumed, meaning that the volumetric thermal expansion coefficient is three times larger than the linear one. The obtained values are in the range of 5.7 × 10²¹ to 1.1 × 1023 cm−3 depending on the temperature and composition and are in reasonably good agreement in comparison to the previously reported values by Rotschild et al. [12] (2.0 × 1021 cm−3 for STF50 at 900 °C).
3.3. Water Uptake and Proton Concentration Analysis
The formation of protonic defects in oxides may proceed through either hydration (Equation (6)) or hydrogenation (Equation (7)) processes. In the case of air atmosphere, these reactions can be expressed as:
Generally speaking, the domination of a chemical reaction is mainly determined by a Gibbs free energy difference of reagents and products. This parameter is strongly correlated with a defect concentration. Thus, further analysis will be continued with respect to the defects concentration. The hydration requires the presence of the oxygen vacancies, whereas the hydrogenation requires the presence of holes. Equation (6) describes the hydration reaction, which means the incorporation of water by an acid–base reaction. This dominates when the concentration of oxygen vacancies is higher than that of electron holes 2. In the case of the reaction shown in Equation (7), it is basically a reaction in which water uptake is simultaneous with electronic carriers consumption. It dominates especially for materials with a relatively high concentration of electrons/holes −2. In the Fe3+-doped SrTiO3 system, an electroneutrality condition in the dry atmosphere can be described as:
where p denotes the electron holes concentration, denotes the volumetric strontium vacancy concentration, and is the volumetric oxygen vacancy concentration related to the oxygen nonstoichiometry. In the temperature range studied in this work (25–1000 °C), the concentration of strontium vacancies may be assumed as negligible in comparison to p or , because the formation energy of strontium vacancies (20.915 eV [51]) is much higher than that of redox enthalpy of oxygen (4.1–5.8 eV, depending on the iron content [12]). In the air, in acceptor-doped SrTiO3, the concentration of oxygen vacancies is much lower than that of electronic holes. For example, at 400 °C in air, in STF30, the molar oxygen vacancy concentration that is determined experimentally equals 0.002, while the hole molar concentration p calculated from the electroneutrality condition is as high as 0.296. The same calculations were performed for all the samples, and the obtained values showed that electronic holes are the majority defects. Thus, hydrogenation was assumed to be a predominant reaction. This is in line with findings by other researchers in similar systems [30,52,53,54].
Figure 6a presents water uptake measurements performed by TG. As can be seen, in all samples, before the switch from wet to dry, no significant mass change was observed, which indicates that the materials were equilibrated at a certain pO2 and temperature. As Figure 6 shows, introducing the water vapor into the atmosphere resulted in an increase in the mass of the samples. The mass change was observed immediately after the switch and then was followed by a slower process. After switching back the pH2O into the low values (dry conditions), again, a rapid mass loss was observed, but the final value in the dry gas was different from that at the initial state before the switch to wet. Such behavior suggests that in the wet atmosphere at the beginning, a much faster hydration process (Equation (6)) occurs, and then after a while, the much slower hydrogenation process (Equation (7)) takes place during the measurement. On the basis of the mass change during the switch from dry to wet conditions, a molar proton concentration was calculated for each sample under the assumption that hydrogenation is a predominant reaction of water uptake (see Equation (7)).
The proton concentration as a function of iron content presented for all compositions at 400 °C and for two chosen compositions (STF30 and STF40) at 300 °C is shown in Figure 6b. The obtained values at 400 °C are between 1.8 × 10⁻⁵ and 1.0 × 10⁻² mol/mol and depend on the iron content. The values obtained at 300 °C are slightly higher—equal to 1.5 × 10⁻⁴ mol/mol for STF30 and 9.0 × 10⁻⁵ mol/mol for STF40, which is expected behavior in relation to the thermodynamic of protonation in oxides [55,56]. The highest concentration of protons measured at 400 °C—1.0 × 10⁻² mol/mol—were obtained for the SrTi0.9Fe0.1O2.95 sample, whereas the lowest is noted for the SrTi0.5Fe0.5O2.75 composition and was equal to 1.8 × 10⁻⁵ mol/mol. For comparison, the value reported for Y-doped BaZrO3 is of the order of 10−1 at 400 °C, which is around one order of magnitude higher than in SrTi0.9Fe0.1O2.95. On the other hand, the obtained value for STF10 material at 400 °C is comparable with that reported for Ca-doped LaNbO4 [57].
Figure 6b shows that a molar proton concentration decreases with the increasing iron content in materials, whereas a characteristic and significant drop is observed above x = 0.2. As can be seen, the molar proton concentration in STF10 and STF20 is around two orders of magnitude lower than that in STF30. This is interesting, because when the iron content increases, the oxygen vacancies concentration also increases. In typical proton conductors, the increasing oxygen vacancy concentration promotes the water uptake and the proton concentration. Since the observations clearly show that in SrTiO3−δ-based materials the situation is opposite (Figure 6b), other factors than oxygen vacancy concentration should be taken into consideration. This also supports the hypothesis that hydrogenation, instead of typical acid–base hydration, is predominant in the analyzed materials.
Iron in strontium titanate occupies B-sites, so that the analysis of the iron influence on the chemical nature of this site may help explain the observed properties. One of the factors that is known to be very important in the case of analysis of the hydration or hydrogenation of oxide is the basicity of cations [52,58]. Generally speaking, a higher basicity leads to more negative hydration/hydrogenation Gibbs energy ΔGhydr, which is favorable for proton uptake in oxides. Since the basicity is related to electronegativity, we analyzed the results using the Pauling electronegativity scale. B-site Pauling electronegativity was calculated for all compositions by the formula:
where x denotes the iron content in materials; while and are electronegativities of titanium and iron, respectively [59]. The substitution of Fe in the Ti site decreases the basicity of the system because Fe is more electronegative in comparison to Ti. Therefore, as shown in Figure 7, molar proton concentration decreases with increasing B-site Pauling electronegativity—that is, with decreasing basicity. Increasing the electronegativity of (Ti1−xFex) may be also viewed in terms of the ionicity of the bonds between Ti(Fe) and O in BO6 octahedra. The lowering of proton uptake with increasing Fe content may be also related to the increased covalency of Ti(Fe)–O bonds.
As it was mentioned, above the 20 mol% of iron substitution, a significant drop of proton molar concentrations was observed. Similar behavior can be seen in Figure 7a,b where the molar proton concentration was presented as a function of B-site electronegativity and oxygen vacancies concentration. As can be seen in Figure 4, the reduction of the samples with more than 20 mol% of iron is significant, and this may have an influence on the protonation. In mixed conducting oxides, the water uptake is related to the electronic structure and the amount of redox active cations. The protonation is strongly related to the concentration of delocalized electrons, as well as to the electron–oxygen vacancies interaction. These may lead to the lower hydration/hydrogenation [34,52,53]. In the case of the materials analyzed in this work, SrTi1−xFexO3−x/2−δ, the solid solution–electronic structure varies as a function of the Ti/Fe ratio. The valence band in STFx is mainly dominated by O 2p orbitals, whereas the conduction band is related to the Ti/Fe 3d orbitals. A redox state Fe4+/Fe3+ lies near the top of the valence band, and for higher Fe content, the width of this band increases, and the band starts to overlap of the electronic states of the O 2p states [60]. For low Fe concentrations, the hybridization of electronic iron orbitals and the other orbitals that are derived from Ti, O, and Sr is not strong, and then the orbitals do not significantly overlap [13]. This implies that there is no significant interaction between the electrons and oxygen vacancies, which would be detrimental for the water uptake, as was shown in [30]. That is why a relatively high proton concentration values for low Fe-content samples (STF10 and STF20) was noticed. Moreover, only a slight difference between the proton concentrations calculated for STF10 and STF20 can be seen. At an intermediate Fe-dopant concentration level (about 30–35%), which is very close to the percolation level in a doped STF system [61], the overlapping of the Fe and O orbitals may start to play an important role and may decrease the water uptake [30]. Moreover, in the case of approximately 35 mol% of Fe content, an interesting balance between the band-gap energy Eg and reduction enthalpy ΔHred (directly related to the oxygen vacancies concentration) takes place and leads to the close to zero activation energy for a conduction mechanism (Ea = Eg − ΔHred/2) [13]. Below 35 mol%, the contribution from the concentration of charge carriers determines the temperature dependence of conductivity. When the concentration of iron exceeds approximately 35 mol%, the temperature dependence of the mobility of delocalized electrons from Fe cations is dominant [12,13]. Thus, this characteristic x = 0.3 point may explain a step decrease of the molar proton concentration between the STF20 and STF30 samples as well as a drop of a lattice parameter and a change of reduction kinetic for x > 0.2 (see Figure 2b and Figure 4b, respectively). At a higher concentration level (let’s say above 35 mol%), the overlapping of the electronic orbitals of oxygen and iron is significant, so the further increasing of the Fe content should lead to the low protons concentration and rather insignificant changes of this parameter. This also well agrees with the data shown in Figure 7.
As was shown in [12], the stronger overlap of Fe and O orbitals leading to valence band broadening as well as bandgap narrowing leads also to the weaker tendency to hydrogenation. According to this, we believe that the increasing electronegativity and orbitals overlapping of (Ti1−xFex) accompanying increasing x values is the main reason for the observed lower proton concentration in samples with higher Fe content.
4. Conclusions
The structure, microstructure, and water uptake were analyzed in a SrTi1−xFexO3−x/2−δ cubic perovskite system synthesized by the conventional solid-state synthesis in a wide range of iron content (x = 0–1). The relation between the structure i.e., lattice parameter and composition, was analyzed, and it was found that this parameter changes nonlinearly with the Fe content in the sample. The microstructure of materials was checked by SEM. For the studied materials, different porosities and grain sizes (0.5–14 µm depending on the sample) were observed.
The oxygen nonstoichiometry, which is a crucial parameter needed to analyze and explain water incorporation in materials, was measured by TG at two atmospheres—dry air and dry nitrogen. The results showed that an oxygen vacancy concentration depends on the Fe amount, and this concentration increases for Fe-rich compositions. The determined values were in a range of 1021–1023 cm−3, which seems to be rational for such a group of acceptor-doped SrTiO3 materials. The water uptake of SrTi1−xFexO3−x/2−δ was observed by using thermogravimetric studies. The collected mass changes allowed calculating the proton concentration. The values calculated per unit cell formula were found to be between 10−5 and 10−2 orders of magnitude, depending on the Fe/Ti ratio.
The relation between the materials’ stoichiometry (Fe/Ti ratio), oxygen vacancy concentration, and molar proton concentration in the studied samples were discussed. It was found that the increase of iron content leads to a significant decrease in molar proton concentration. It was also found and clearly indicates that not only an oxygen vacancy concentration but also factors such as the structure distortions, covalency of transition metal–oxygen bonds, as well as electron affinity of the chemical species present in materials play a major role in analyzing and explaining water uptake in Fe-doped SrTiO3 materials.
Author Contributions
Conceptualization, T.M.; methodology, T.M.; validation, S.W.; formal analysis, M.G.; investigation, P.W., A.M.-G., and K.D.; writing—original draft preparation, T.M.; writing—review and editing, T.M. and M.G.; supervision, M.G.; funding acquisition, M.G. All authors have read and agreed to the published version of the manuscript.
Funding
This research was funded by the National Science Centre, grant number 2016/23/B/ST5/02137 and The APC was funded by Gdańsk University of Technology.
Conflicts of Interest
The authors declare no conflict of interest. The funders had no role in the design of the study; in the collection, analyses, or interpretation of data; in the writing of the manuscript, or in the decision to publish the results.
References
- Skinner, S.J.; Kilner, J.A. Oxygen ion conductors. Mater. Today 2003, 6, 30–37. [Google Scholar] [CrossRef]
- Boivin, J.C.; Mairesse, G. Recent Material Developments in Fast Oxide Ion Conductors. Chem. Mater. 1998, 10, 2870–2888. [Google Scholar] [CrossRef]
- Rahman, I.Z.; Raza, M.A.; Rahman, M.A. Perovskite Based Anode Materials for Solid Oxide Fuel Cell Application: A Review. Adv. Mater. Res. 2012, 445, 497–502. [Google Scholar] [CrossRef]
- Moure, C.; Peña, O. Recent Advances in Perovskites: Processing and Properties. Prog. Solid State Chem. 2015, 43, 123–148. [Google Scholar] [CrossRef]
- Balachandran, U.; Eror, N.G. Electrical conductivity in strontium titanate. J. Solid State Chem. 1981, 39, 351–359. [Google Scholar] [CrossRef]
- Hui, S.; Petric, A. Electrical conductivity of yttrium-doped SrTiO3: Influence of transition metal additives. Mater. Res. Bull. 2002, 37, 1215–1231. [Google Scholar] [CrossRef]
- Li, X.; Zhao, H.; Zhou, X.; Xu, N.; Xie, Z.; Chen, N. Electrical conductivity and structural stability of La-doped SrTiO3 with A-site deficiency as anode materials for solid oxide fuel cells. Int. J. Hydrogen Energy 2010, 35, 7913–7918. [Google Scholar] [CrossRef]
- Kamecki, B.; Miruszewski, T.; Karczewski, J. Structural and electrical transport properties of Pr-doped SrTi0.93Co0.07O3−δ a novel SOEC fuel electrode materials. J. Electroceram. 2019, 42, 31–40. [Google Scholar] [CrossRef] [Green Version]
- Bochentyn, B.; Karczewski, J.; Miruszewski, T.; Krupa, A.; Gazda, M.; Jasinski, P.; Kusz, B. Donor-substituted SrTi1+xO3−δ anodes for SOFC. Solid State Ion. 2012, 225, 118–123. [Google Scholar] [CrossRef]
- Blennow, P.; Hagen, A.; Hansen, K.K.; Wallenberg, L.R.; Mogensen, M. Defect and electrical transport properties of Nb-doped SrTiO3. Solid State Ion. 2008, 179, 2047–2058. [Google Scholar] [CrossRef]
- Tufte, O.N.; Chapman, P.W. Electron Mobility in Semiconducting Strontium Titanate. Phys. Rev. 1967, 155, 796–802. [Google Scholar] [CrossRef]
- Rothschild, A.; Menesklou, W.; Tuller, H.L.; Ivers-Tiffée, E. Electronic structure, defect chemistry, and transport properties of SrTi1−xFexO3−y solid solutions. Chem. Mater. 2006, 18, 3651–3659. [Google Scholar] [CrossRef]
- Rothschild, A.; Litzelman, S.J.; Tuller, H.L.; Menesklou, W.; Schneider, T.; Ivers-Tiffée, E. Temperature-independent resistive oxygen sensors based on SrTi1−xFexO3−δ solid solutions. Sens. Actuators B Chem. 2005, 108, 223–230. [Google Scholar] [CrossRef]
- Steinsvik, S.; Bugge, R.; Gjønnes, J.; Taftø, J.; Norby, T. The defect structure of SrTi1−xFexO3−y (x = 0–0.8) investigated by electrical conductivity measurements and electron energy loss spectroscopy (EELS). J. Phys. Chem. Solids 1997, 58, 969–976. [Google Scholar] [CrossRef]
- Maldonado, F.; Maza, L.; Stashans, A. Electronic properties of Cr-, B-doped and codoped SrTiO3. J. Phys. Chem. Solids 2017, 100, 1–8. [Google Scholar] [CrossRef]
- Li, X.; Zhao, H.; Gao, F.; Chen, N.; Xu, N. La and Sc co-doped SrTiO3 as novel anode materials for solid oxide fuel cells. Electrochem. Commun. 2008, 10, 1567–1570. [Google Scholar] [CrossRef]
- Shin, C.J.; Yoo, H.I. Al-doped SrTiO3: Part II, unusual thermodynamic factor and chemical diffusivity. Solid State Ion. 2007, 178, 1089–1094. [Google Scholar] [CrossRef]
- Echeverri, E.; Arnache, O. Structural and impedance analysis of Co-doped SrTiO3 perovskite. J. Phys. Conf. Ser. 2016, 687, 012040. [Google Scholar] [CrossRef] [Green Version]
- Yoo, K.B.; Park, B.H.; Choi, G.M. Stability and performance of SOFC with SrTiO3-based anode in CH4 fuel. Solid State Ion. 2012, 225, 104–107. [Google Scholar] [CrossRef]
- Vashuk, V.V.; Kokhanovskii, L.V.; Yushkevich, I.I. Electrical conductivity and oxygen stoichiometry of SrFeO3-δ. Inorg. Mater. 2000, 36, 79–83. [Google Scholar] [CrossRef]
- Hodges, J.P.; Short, S.; Jorgensen, J.D.; Xiong, X.; Dabrowski, B.; Mini, S.M.; Kimball, C.W. Evolution of Oxygen-Vacancy Ordered Crystal Structures in the Perovskite Series SrnFenO3n−1 (n=2, 4, 8, and ∞), and the Relationship to Electronic and Magnetic Properties. J. Solid State Chem. 2000, 151, 190–209. [Google Scholar] [CrossRef]
- Bocquet, A.E.; Fujimori, A.; Mizokawa, T.; Saitoh, T.; Namatame, H.; Suga, S.; Kimizuka, N.; Takeda, Y.; Takano, M. Electronic structure of SrFe4+O3 and related Fe perovskite oxides. Phys. Rev. B 1992, 45, 1561–1570. [Google Scholar] [CrossRef] [PubMed]
- Patrakeev, M.V.; Leonidov, I.A.; Kozhevnikov, V.L.; Kharton, V.V. Ion–electron transport in strontium ferrites: Relationships with structural features and stability. Solid State Sci. 2004, 6, 907–913. [Google Scholar] [CrossRef]
- Simner, S.P.; Shelton, J.P.; Anderson, M.D.; Stevenson, J.W. Interaction between La(Sr)FeO3 SOFC cathode and YSZ electrolyte. Solid State Ion. 2003, 161, 11–18. [Google Scholar] [CrossRef]
- Brixner, L.H. Preparation and properties of the SrTi1−xFexO3−x2/Ox2 system. Mater. Res. Bull. 1968, 3, 299–308. [Google Scholar] [CrossRef]
- Jung, W. Environmental Science Activity of SrTi1−xFexO3 Surfaces. Energy Environ. Sci. 2012, 5, 7979–7988. [Google Scholar] [CrossRef]
- Widerøe, M.; Münch, W.; Larring, Y.; Norby, T. Proton and apparent hydride ion conduction in Al-substituted SrTiO3. Solid State Ion. 2002, 154–155, 669–677. [Google Scholar] [CrossRef]
- Muñoz-García, A.B.; Pavone, M. First-Principles Design of New Electrodes for Proton-Conducting Solid-Oxide Electrochemical Cells: A-Site Doped Sr2Fe1.5Mo0.5O6-δ Perovskite. Chem. Mater. 2016, 28, 490–500. [Google Scholar] [CrossRef]
- Ricote, S.; Almansoori, A.; Sanders, M.; Tong, J.; Duan, C.; Nikodemski, S.; Hayre, R.O.; Shang, M. Readily processed protonic ceramic fuel cells with high performance at low temperatures. Science 2015, 349, 1321–1326. [Google Scholar] [CrossRef]
- Poetzsch, D.; Merkle, R.; Maier, J. Proton uptake in the H+-SOFC cathode material Ba0.5Sr0.5Fe0.8Zn0.2O3-δ: Transition from hydration to hydrogenation with increasing oxygen partial pressure. Faraday Discuss. 2015, 182, 129–143. [Google Scholar] [CrossRef]
- Yu, J.H.; Lee, J.S.; Maier, J. Water incorporation in oxides: A moving boundary problem. Solid State Ion. 2010, 181, 154–162. [Google Scholar] [CrossRef]
- Skubida, W.; Niemczyk, A.; Zheng, K.; Liu, X.; Świeczek, K. Crystal Structure, Hydration, and Two-Fold/Single-Fold Diffusion Kinetics in Proton-Conducting Ba0.9La0.1Zr0.25Sn0.25In0.5O3−a Oxide. Crystals 2018, 8, 136. [Google Scholar] [CrossRef] [Green Version]
- Poetzsch, D.; Merkle, R.; Maier, J. Stoichiometry variation in materials with three mobile carriers-Thermodynamics and transport kinetics exemplifi ed for protons, oxygen vacancies, and holes. Adv. Funct. Mater. 2015, 25, 1542–1557. [Google Scholar] [CrossRef]
- Zohourian, R.; Merkle, R.; Raimondi, G.; Maier, J. Mixed-Conducting Perovskites as Cathode Materials for Protonic Ceramic Fuel Cells: Understanding the Trends in Proton Uptake. Adv. Funct. Mater. 2018, 28, 1801241. [Google Scholar] [CrossRef]
- Fan, L.; Su, P.C. Layer-structured LiNi0.8Co0.2O2: A new triple (H+/O2-/e-) conducting cathode for low temperature proton conducting solid oxide fuel cells. J. Power Sources 2016, 306, 369–377. [Google Scholar] [CrossRef]
- Strandbakke, R.; Cherepanov, V.A.; Zuev, A.Y.; Tsvetkov, D.S.; Argirusis, C.; Sourkouni, G.; Prünte, S.; Norby, T. Gd-and Pr-based double perovskite cobaltites as oxygen electrodes for proton ceramic fuel cells and electrolyser cells. Solid State Ion. 2015, 278, 120–132. [Google Scholar] [CrossRef]
- Han, D.; Okumura, Y.; Nose, Y.; Uda, T. Synthesis of La1−XSrxSc1−yFeyO3−δ (LSSF) and measurement of water content in LSSF, LSCF and LSC hydrated in wet artificial air at 300 °C. Solid State Ion. 2010, 181, 1601–1606. [Google Scholar] [CrossRef]
- Yamazaki, Y.; Babilo, P.; Haile, S.M. Defect Chemistry of Yttrium-Doped Barium Zirconate: A Thermodynamic Analysis of Water Uptake. Chem. Mater. 2008, 20, 6352–6357. [Google Scholar] [CrossRef]
- Rodríguez-Carvajal, J. Recent advances in magnetic structure determination by neutron powder diffraction. Phys. B Condens. Matter. 1993, 192, 55–69. [Google Scholar] [CrossRef]
- Falcón, H.; Barbero, J.A.; Alonso, J.A.; Martínez-Lope, M.J.; Fierro, J.L.G. SrFeO3-δ perovskite oxides: Chemical features and performance for methane combustion. Chem. Mater. 2002, 14, 2325–2333. [Google Scholar] [CrossRef]
- Vračar, M.; Kuzmin, A.; Merkle, R.; Purans, J.; Kotomin, E.A.; Maier, J.; Mathon, O. Jahn-Teller distortion around Fe4+ in Sr (FexTi1−x) O3−δ from x-ray absorption spectroscopy, x-ray diffraction, and vibrational spectroscopy. Phys. Rev. B Condens. Matter Mater. Phys. 2007, 76, 174107. [Google Scholar] [CrossRef]
- Ghaffari, M.; Liu, T.; Huang, H.; Tan, O.K.; Shannon, M. Investigation of local structure effect and X-ray absorption characteristics (EXAFS) of Fe (Ti) K-edge on photocatalyst properties of SrTi(1−x)FexO(3−δ). Mater. Chem. Phys. 2012, 136, 347–357. [Google Scholar] [CrossRef]
- Shannon, R.D. Revised Effective Ionic Radii and Systematic Studies of Interatomie Distances in Halides and Chaleogenides. Acta Cryst. 1976, 32, 751–767. [Google Scholar] [CrossRef]
- Kuhn, M.; Kim, J.J.; Bishop, S.R.; Tuller, H.L. Oxygen nonstoichiometry and defect chemistry of perovskite-structured BaxSr1−xTi1−yFeyO3−y/2+δ solid solutions. Chem. Mater. 2013, 25, 2970–2975. [Google Scholar] [CrossRef]
- Holt, A.; Norby, T.; Glenne, R. Defects and transport in SrFe1−xCOxO3−δ. Ionics (Kiel) 1999, 5, 434–443. [Google Scholar] [CrossRef]
- Pasierb, P.; Komornicki, S.; Rekas, M. Comparison of the chemical diffusion of undoped and Nb-doped SrTiO3. J. Phys. Chem. Solids 1999, 60, 1835–1844. [Google Scholar] [CrossRef]
- Park, C.Y.; Jacobson, A.J. Electrical Conductivity and Oxygen Nonstoichiometry of La0.2Sr0.8Fe0.55Ti0.45O3−δ. J. Electrochem. Soc. 2005, 152, J65. [Google Scholar] [CrossRef]
- Stevenson, J.W. Electrochemical Properties of Mixed Conducting Perovskites La1−xMxCo1−yFeyO3−δ (M = Sr, Ba, Ca). J. Electrochem. Soc. 2006, 143, 2722. [Google Scholar] [CrossRef]
- Sendilkumar, A.; Raju, K.C.J.; Babu, P.D.; Srinath, S. Positive temperature coefficient of resistance of tetragonal Ti4+ doped nano SrFeO3−d. J. Alloys Compd. 2013, 561, 174–179. [Google Scholar] [CrossRef]
- de Ligny, D.; Richet, P. High-temperature heat capacity and thermal expansion of and perovskites of SrTiO3 and SrZrO3 perovskites. Phys. Rev. B Condens. Matter Mater. Phys. 1996, 53, 3013–3022. [Google Scholar] [CrossRef]
- Crawford, J.; Jacobs, P. Point Defect Energies for Strontium Titanate: A Pair-Potentials Study. J. Solid State Chem. 1999, 144, 423–429. [Google Scholar] [CrossRef]
- Zohourian, R.; Merkle, R.; Maier, J. Proton uptake into the protonic cathode material BaCo0.4Fe0.4Zr0.2O3-δ and comparison to protonic electrolyte materials. Solid State Ion. 2017, 299, 64–69. [Google Scholar] [CrossRef]
- Zohourian, R. Mixed-Conducting Perovskites as Cathodes in Protonic Ceramic Fuel Cells: Defect Chemistry and Transport Properties. Ph.D. Thesis, Max Planck Institute for Solid State Research, Stuttgart, Germany, 2018. [Google Scholar]
- Yang, L.; Liu, Z.; Wang, S.; Choi, Y.; Zuo, C.; Liu, M. A mixed proton, oxygen ion, and electron conducting cathode for SOFCs based on oxide proton conductors. J. Power Sources 2010, 195, 471–474. [Google Scholar] [CrossRef]
- Norby, T. Proton Conductivity in Perovskite Oxides. In Perovskite Oxide Solid Oxide Fuel Cells; Ishihara, T., Ed.; Springer: Boston, MA, USA, 2009; pp. 217–241. [Google Scholar] [CrossRef]
- Norby, T.; Larring, Y. Concentration and transport of protons in oxides. Curr. Opin. Solid State Mater. Sci. 1997, 2, 593–599. [Google Scholar] [CrossRef]
- Mielewczyk-Gryń, A.; Wachowski, S.; Prześniak-Welenc, M.; Dzierzgowski, K.; Regoutz, A.; Payne, D.J.; Gazda, M. Water uptake analysis of acceptor-doped lanthanum orthoniobates. J. Therm. Anal. Calorim. 2019, 6, 225–232. [Google Scholar] [CrossRef] [Green Version]
- Norby, T.; Widerøe, M.; Glöckner, R.; Larring, Y. Hydrogen in oxides. Dalt. Trans. 2004, 3012–3018. [Google Scholar] [CrossRef]
- Pauling, L. The Nature of the Chemical Bond and the Structure of Molecules and Crystals: An Introduction to Modern Structural Chemistry; Cornell University Press: Ithaca, NY, USA, 1960. [Google Scholar]
- van Benthem, K.; Elsasser, C.; French, R.H. Bulk electronic structure of Experiment and theory. J. Appl. Phys. 2011, 90, 6156–6164. [Google Scholar] [CrossRef] [Green Version]
- Miruszewski, T.; Gdaniec, P.; Rosiński, W.; Karczewski, J.; Bochentyn, B.; Kusz, B. Structure and electrical properties of Y, Fe-based perovskite mixed conducting composites fabricated by a modi fi ed polymer precursor method. Solid State Sci. 2017, 70, 41–46. [Google Scholar] [CrossRef]
Figure 1.
XRD patterns obtained for SrTi1−xFexO3−x/2−δ solid solutions.
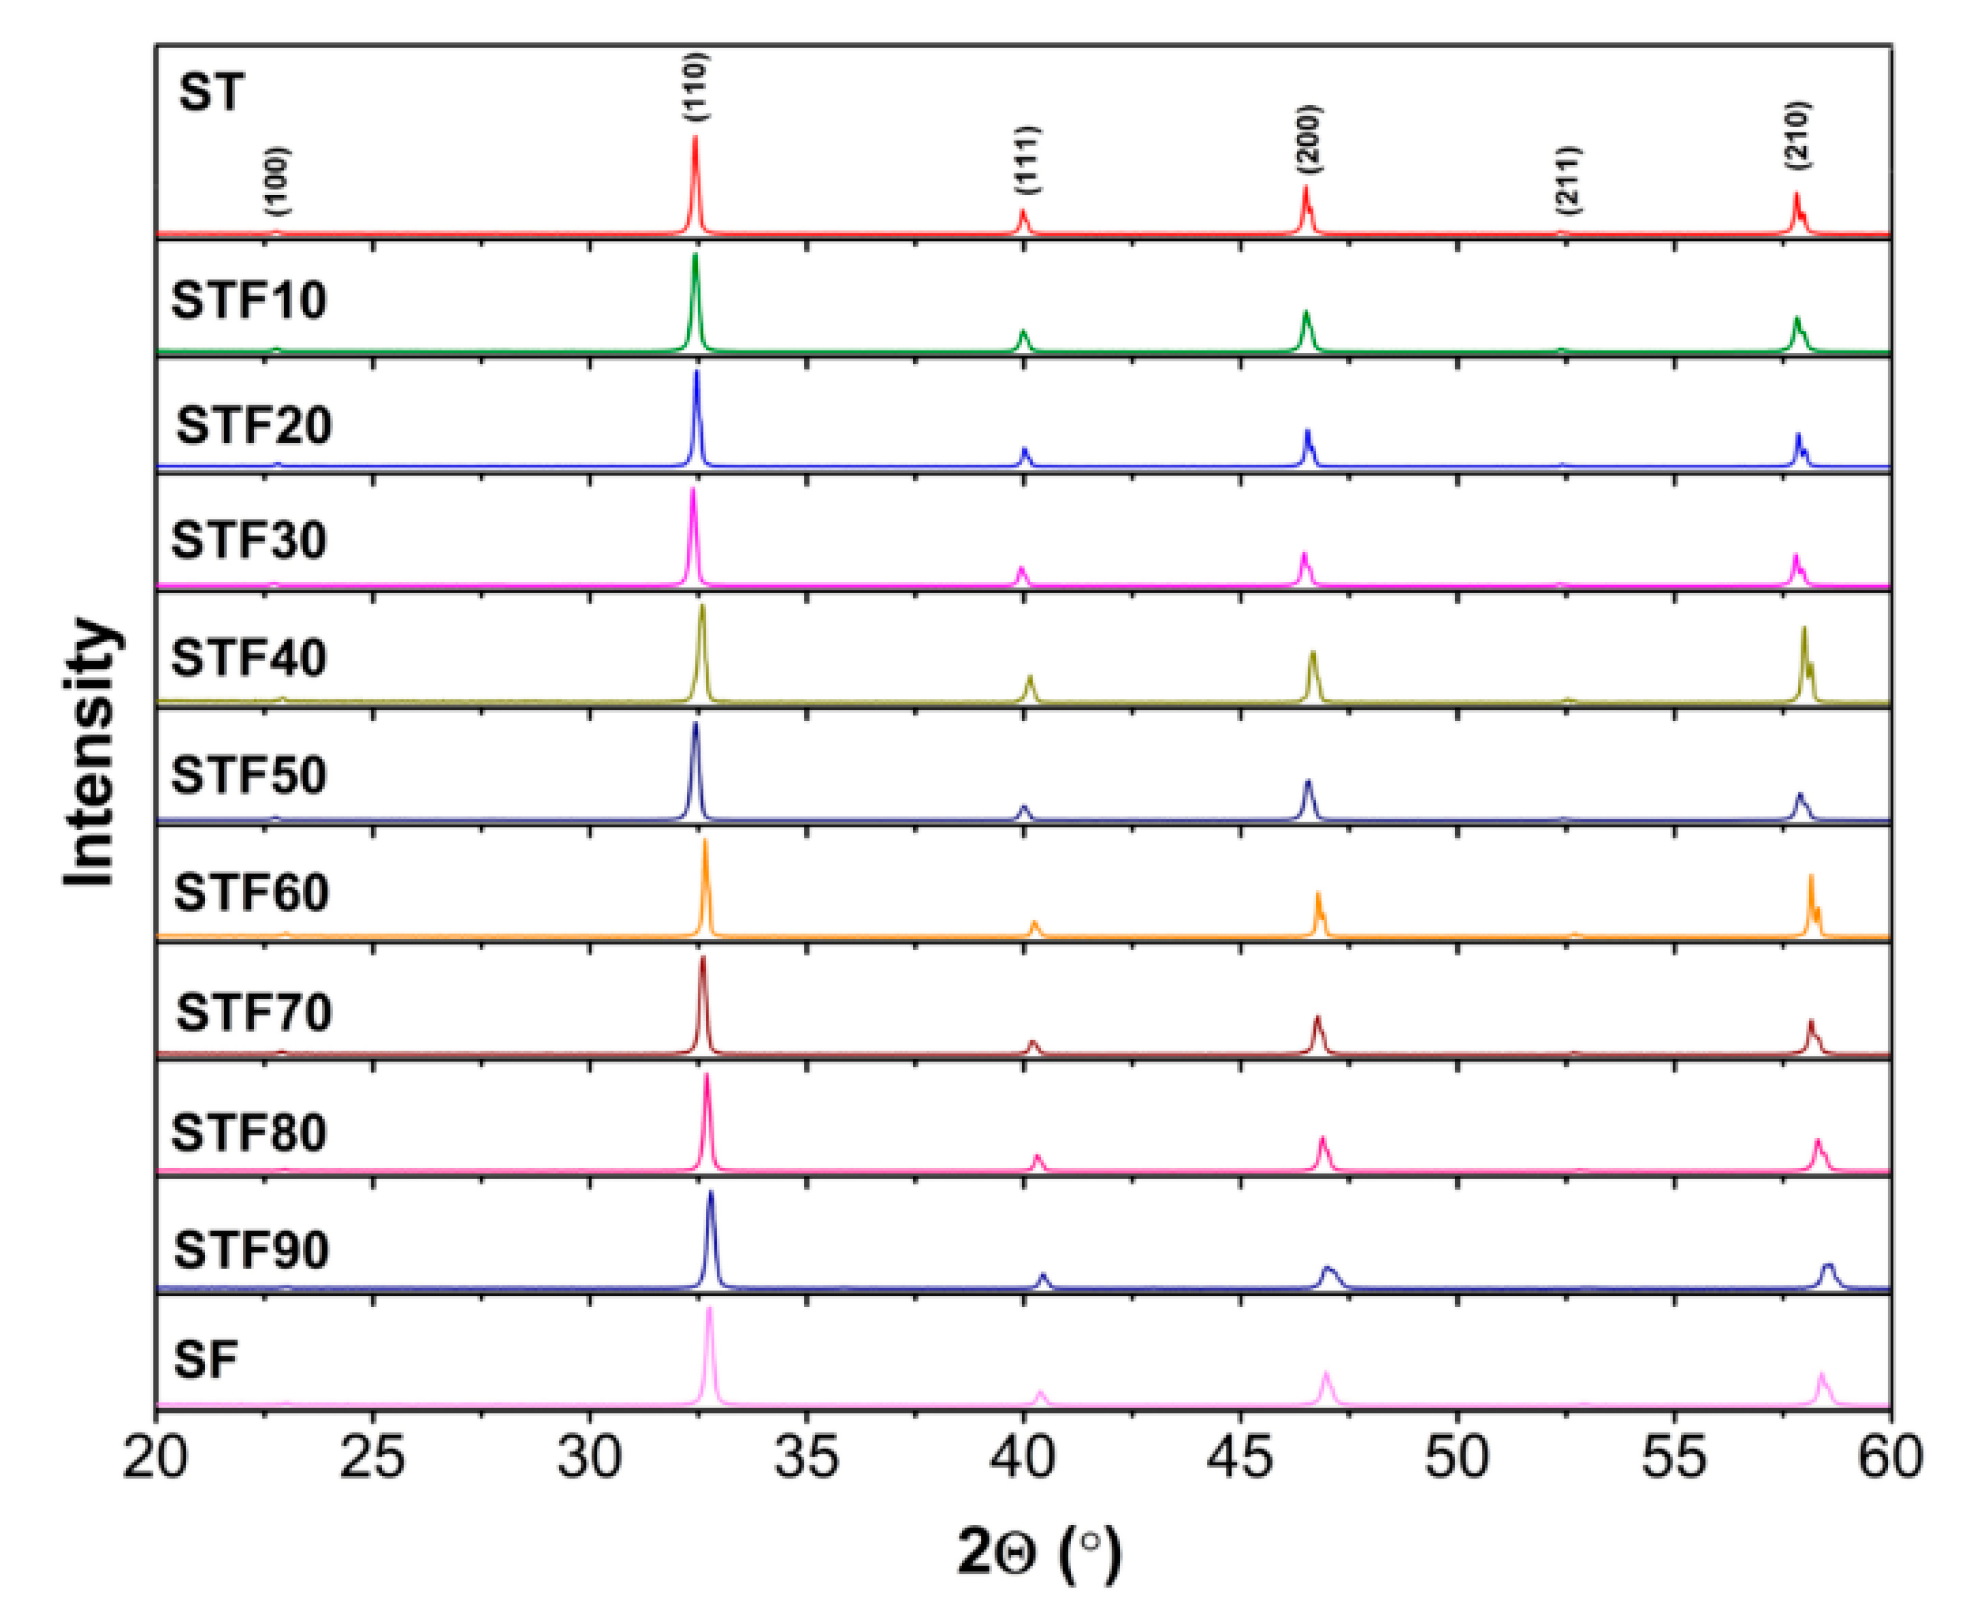
Figure 2.
(a) Rietveld refinement profile for the SrTi0.9Fe0.1O2.95−δ sample; (b) unit cell parameter as a function of iron content (x) in SrTi1−xFexO3−x/2−δ. Calculated values for SrTiO3 and SrFeO3 are shown as dashed horizontal lines.
Figure 2.
(a) Rietveld refinement profile for the SrTi0.9Fe0.1O2.95−δ sample; (b) unit cell parameter as a function of iron content (x) in SrTi1−xFexO3−x/2−δ. Calculated values for SrTiO3 and SrFeO3 are shown as dashed horizontal lines.
Figure 3.
SEM micrographs and EDX spectra results of cross-sections of SrTi1−xFexO3−x/2−δ for x = 0.1 and 0.8.
Figure 3.
SEM micrographs and EDX spectra results of cross-sections of SrTi1−xFexO3−x/2−δ for x = 0.1 and 0.8.

Figure 4.
Mass loss in SrTi1−xFexO3−x/2−δ as a function of temperature measured by thermogravimetric analysis (TGA) in dry nitrogen (a) and dry air (b). The heating rate for both atmospheres was 2 °C/min.
Figure 4.
Mass loss in SrTi1−xFexO3−x/2−δ as a function of temperature measured by thermogravimetric analysis (TGA) in dry nitrogen (a) and dry air (b). The heating rate for both atmospheres was 2 °C/min.

Figure 5.
Total molar oxygen vacancy concentration as a function of iron content in SrTi1−xFexO3−x/2−δ samples collected for two chosen temperatures: −400 and 800 °C.
Figure 5.
Total molar oxygen vacancy concentration as a function of iron content in SrTi1−xFexO3−x/2−δ samples collected for two chosen temperatures: −400 and 800 °C.
Figure 6.
(a) Mass change recorded at the isothermal switch at 400 °C between dry (pH2O ≈ 3 × 10⁻⁵ atm.) and humidified air (pH2O = 0.023 atm.); (b) proton concentration at 400 °C and 300 °C versus iron content in SrTi1−xFexO3−x/2−δ.
Figure 6.
(a) Mass change recorded at the isothermal switch at 400 °C between dry (pH2O ≈ 3 × 10⁻⁵ atm.) and humidified air (pH2O = 0.023 atm.); (b) proton concentration at 400 °C and 300 °C versus iron content in SrTi1−xFexO3−x/2−δ.
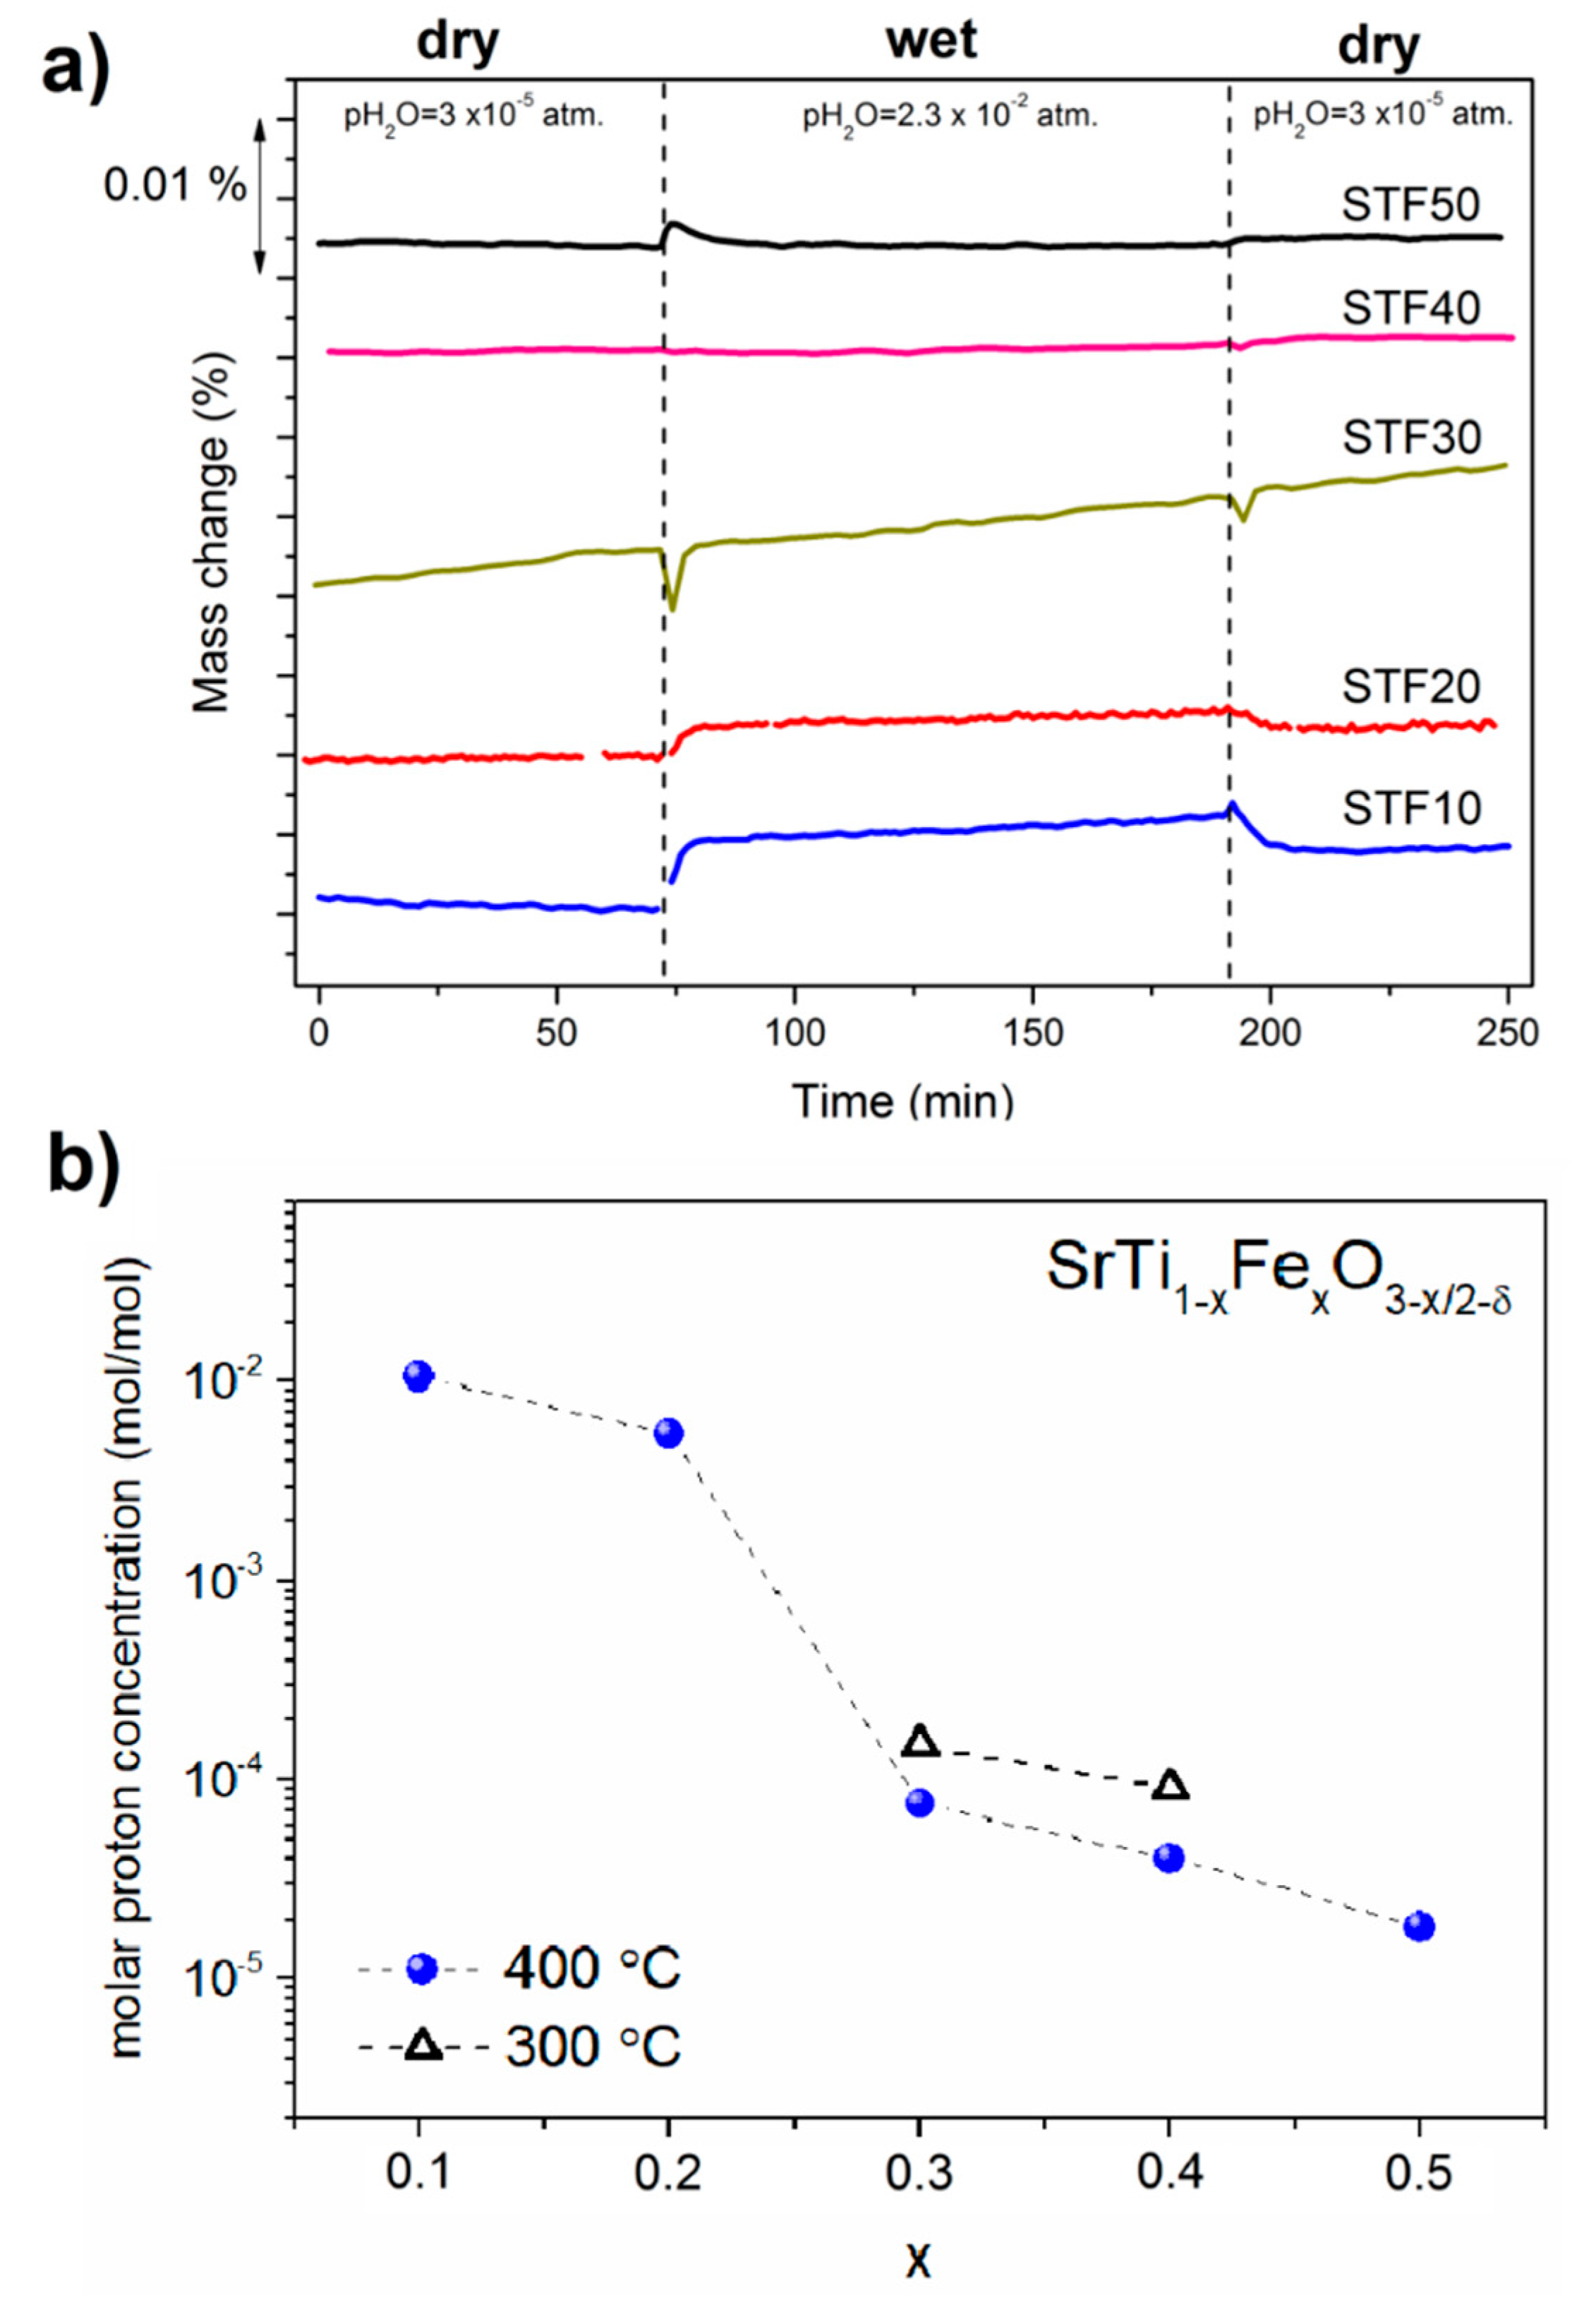
Figure 7.
(a) Proton concentration at 400 °C plotted versus B-site Pauling electronegativity; (b) total oxygen vacancy concentration measured at 400 °C in air.
Figure 7.
(a) Proton concentration at 400 °C plotted versus B-site Pauling electronegativity; (b) total oxygen vacancy concentration measured at 400 °C in air.


Table 1.
The SrTi1−xFexO3−x/2−δ samples’ compositions, sintering temperature, densities, and porosities.
Table 1.
The SrTi1−xFexO3−x/2−δ samples’ compositions, sintering temperature, densities, and porosities.
| Sample | Sintering Temperature (°C) | Density (g cm−3) | Relative Density (%) |
|---|---|---|---|
| SrTiO3 (ST) | 1400 | 4.57 | 89 |
| SrTi0.9Fe0.1O2.95 (STF10) | 1400 | 4.49 | 87 |
| SrTi0.8Fe0.2O2.9 (STF20) | 1400 | 4.81 | 92 |
| SrTi0.7Fe0.3O2.85 (STF30) | 1400 | 4.78 | 92 |
| SrTi0.6Fe0.4O2.8 (STF40) | 1300 | 3.53 | 67 |
| SrTi0.5Fe0.5O2.75 (STF50) | 1200 | 4.16 | 79 |
| SrTi0.4Fe0.6O2.7 (STF60) | 1200 | 4.45 | 84 |
| SrTi0.3Fe0.7O2.65 (STF70) | 1200 | 4.70 | 88 |
| SrTi0.2Fe0.8O2.6 (STF80) | 1200 | 4.12 | 76 |
| SrTi0.1Fe0.9O2.55 (STF90) | 1200 | 4.71 | 86 |
| SrFeO3 (SF) | 1200 | 4.70 | 85 |
© 2020 by the authors. Licensee MDPI, Basel, Switzerland. This article is an open access article distributed under the terms and conditions of the Creative Commons Attribution (CC BY) license (http://creativecommons.org/licenses/by/4.0/).
Share and Cite
MDPI and ACS Style
Miruszewski, T.; Dzierzgowski, K.; Winiarz, P.; Wachowski, S.; Mielewczyk-Gryń, A.; Gazda, M. Structural Properties and Water Uptake of SrTi1−xFexO3−x/2−δ. Materials 2020, 13, 965. https://doi.org/10.3390/ma13040965
AMA Style
Miruszewski T, Dzierzgowski K, Winiarz P, Wachowski S, Mielewczyk-Gryń A, Gazda M. Structural Properties and Water Uptake of SrTi1−xFexO3−x/2−δ. Materials. 2020; 13(4):965. https://doi.org/10.3390/ma13040965
Chicago/Turabian StyleMiruszewski, Tadeusz, Kacper Dzierzgowski, Piotr Winiarz, Sebastian Wachowski, Aleksandra Mielewczyk-Gryń, and Maria Gazda. 2020. "Structural Properties and Water Uptake of SrTi1−xFexO3−x/2−δ" Materials 13, no. 4: 965. https://doi.org/10.3390/ma13040965
Note that from the first issue of 2016, this journal uses article numbers instead of page numbers. See further details here.