Influence of Cu Content on Structure and Magnetic Properties in Fe86-xCuxB14 Alloys

 , , ,
, , , 
Abstract
:1. Introduction
2. Materials and Methods
3. Results
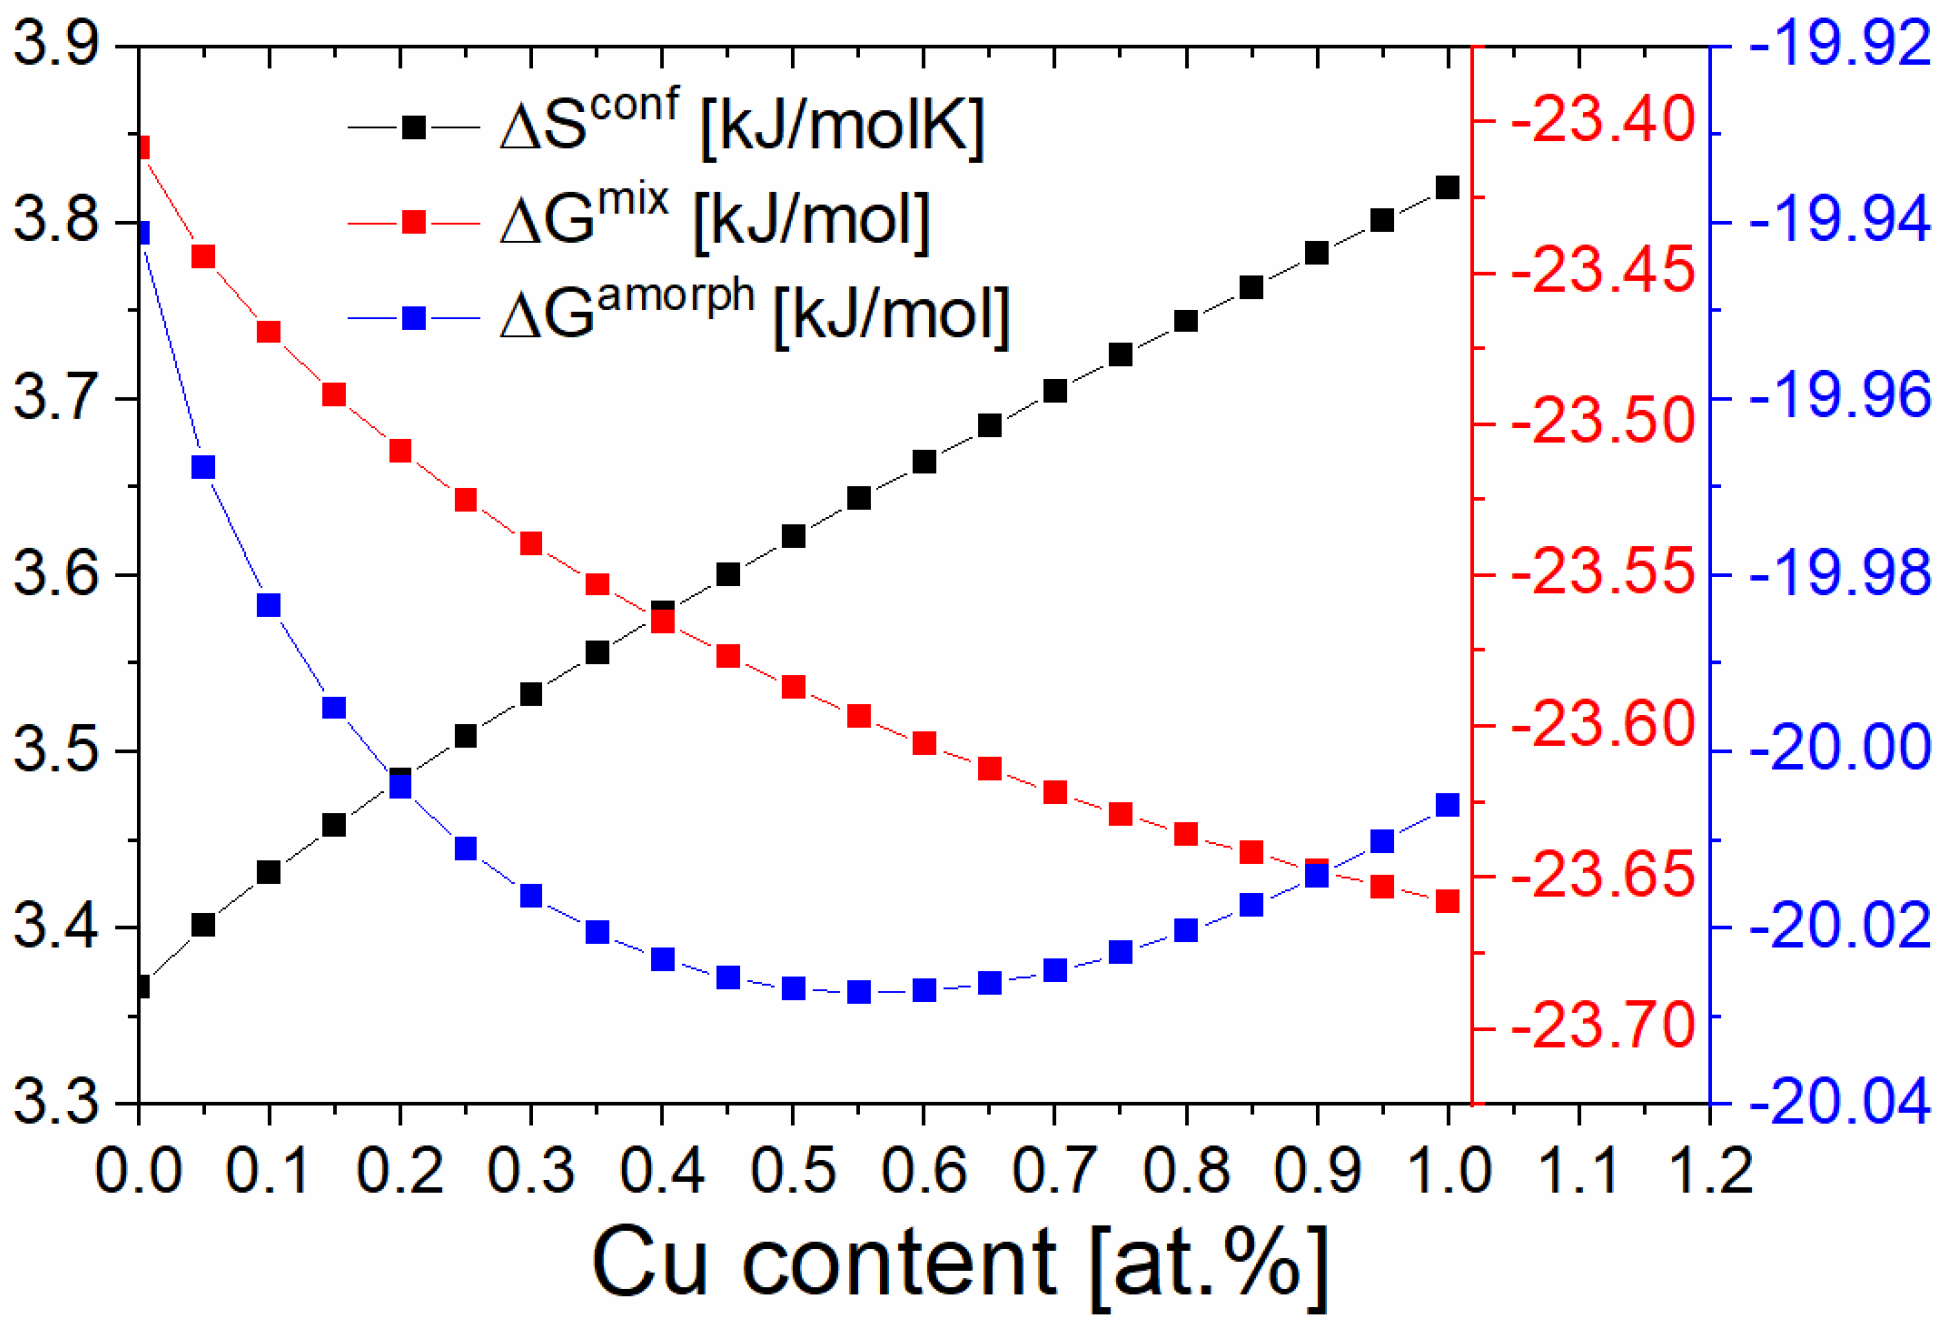
3.1. Thermodynamics Calculations
3.2. Study of as-Spun Materials
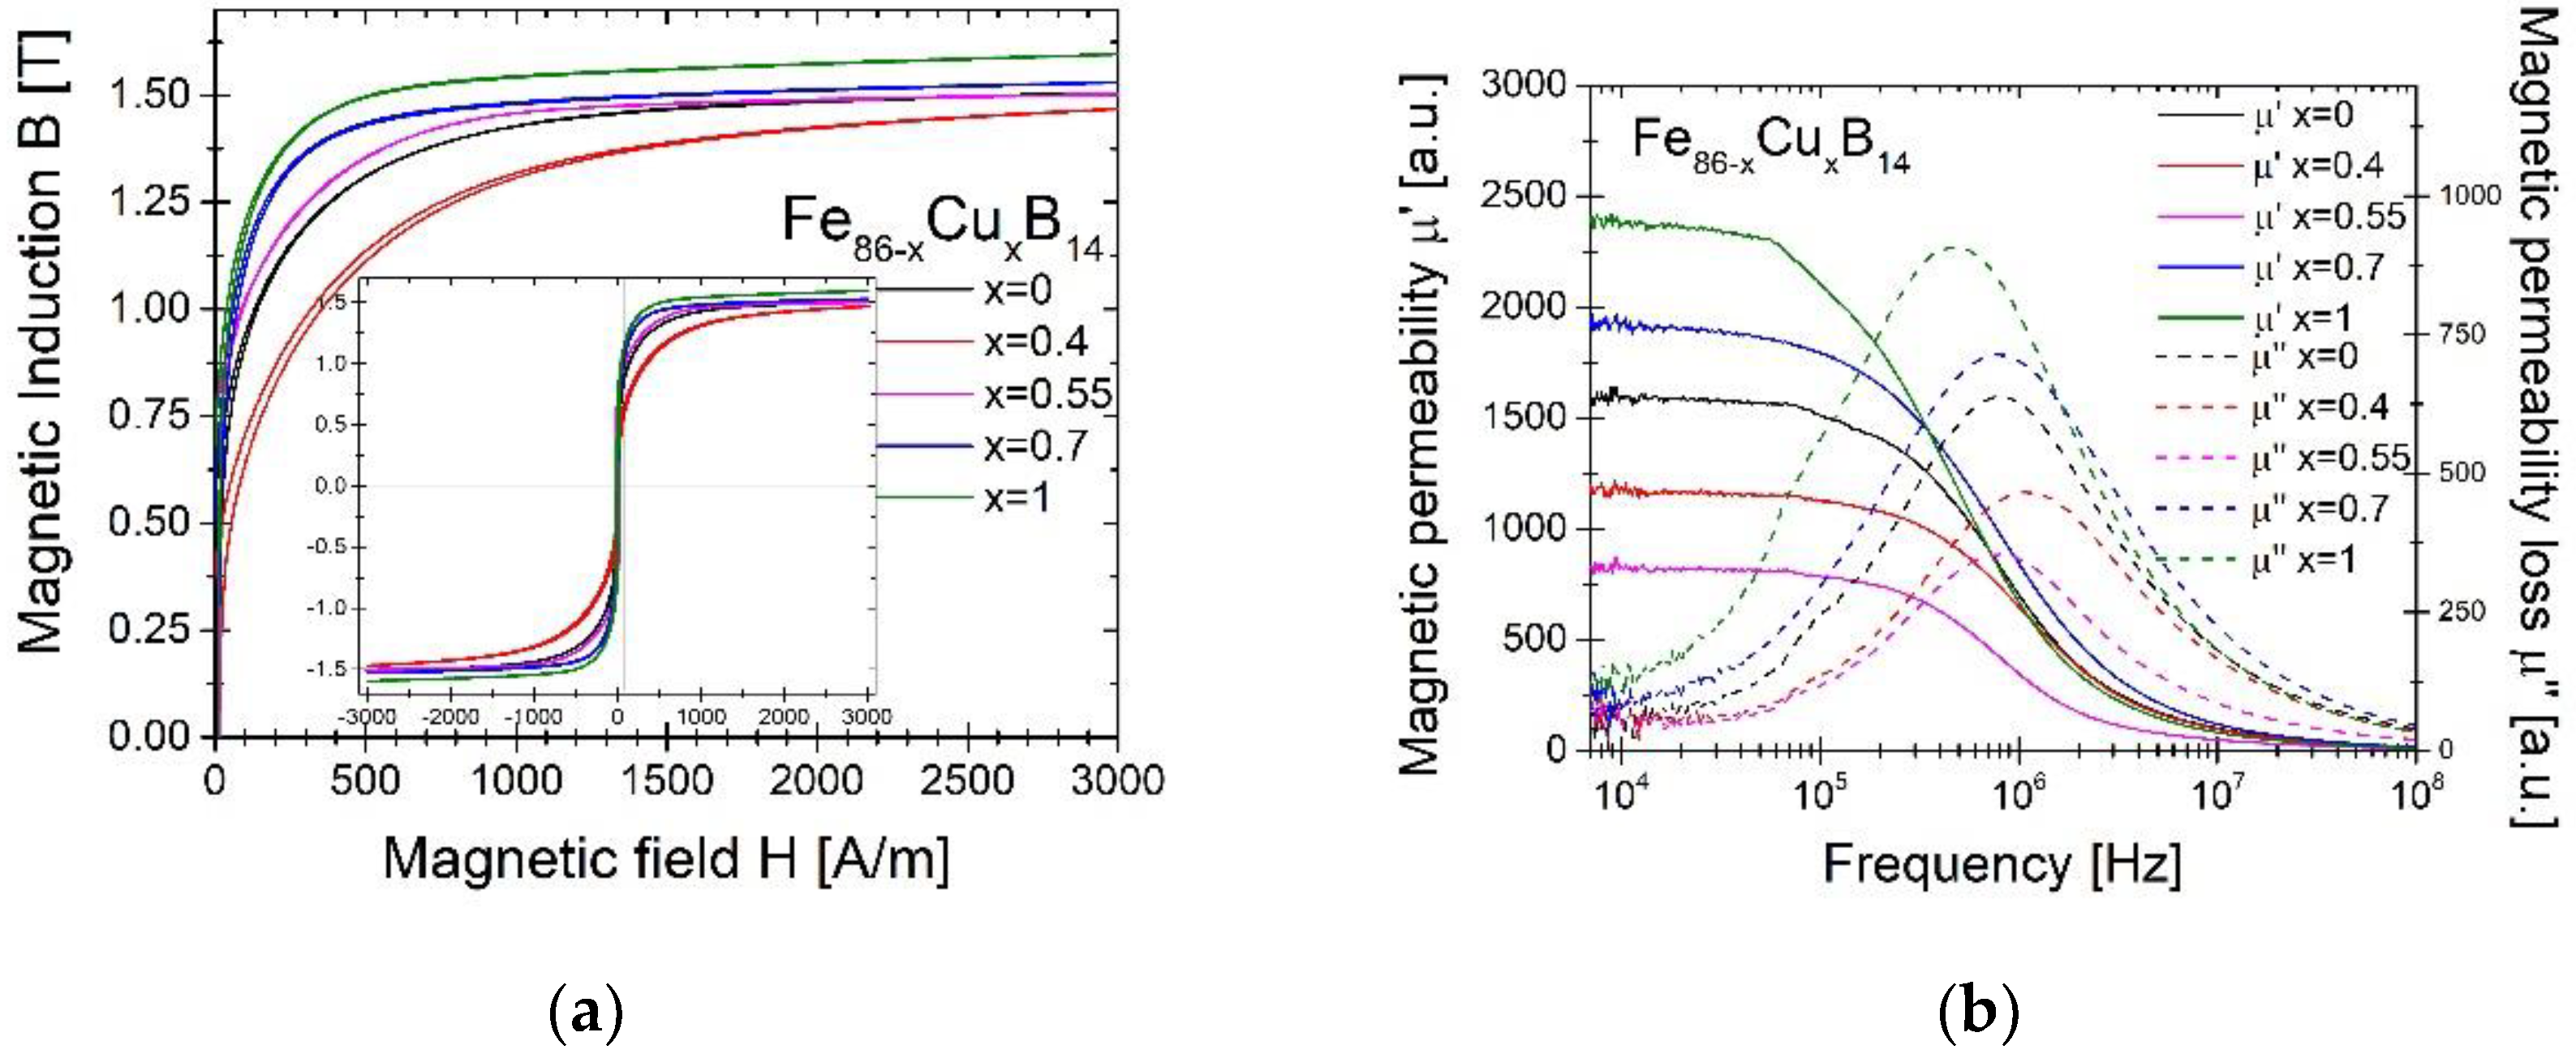
3.3. Magnetic Properties
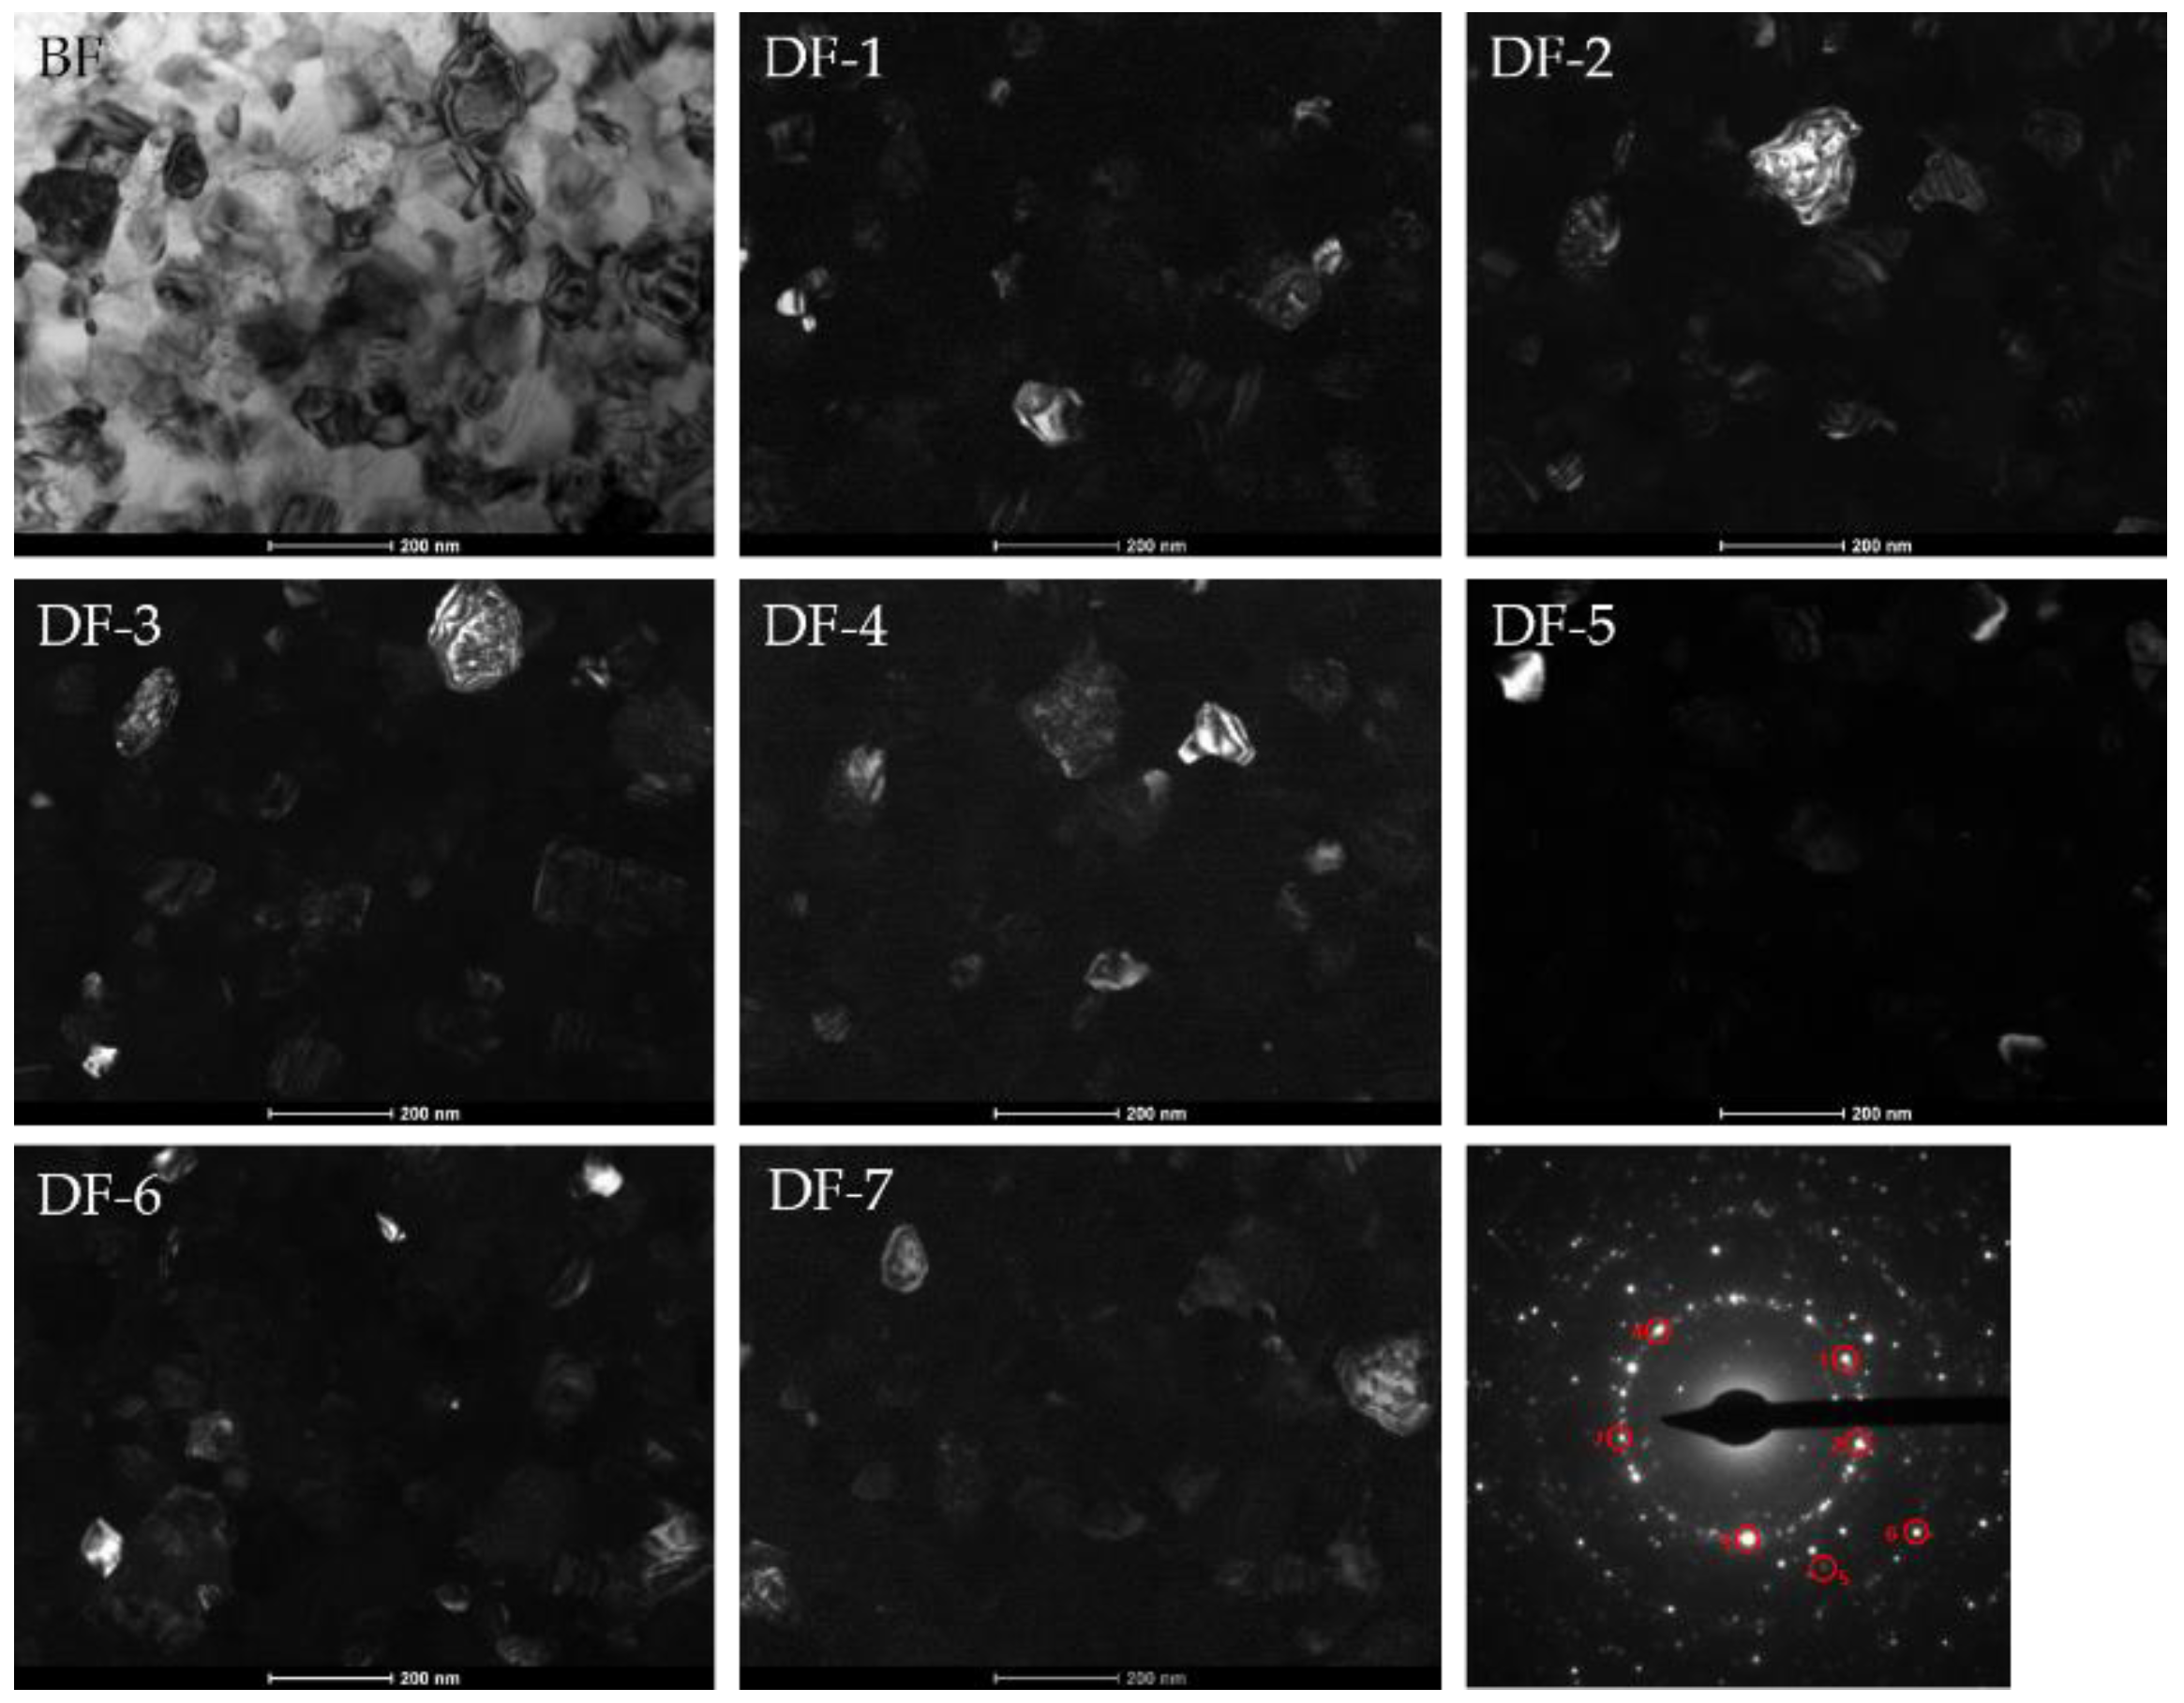
3.4. Structure after Annealing
3.5. Discussion
4. Conclusions
Author Contributions
Funding
Conflicts of Interest
References
- Li, H.; Lu, Z.; Wang, S.; Wu, Y.; Lu, Z. Fe-based bulk metallic glasses: Glass formation, fabrication, properties and applications. Prog. Mater. Sci. 2019, 103, 235–318. [Google Scholar] [CrossRef]
- Geng, Y.; Wang, Y.; Qiang, J.; Zhang, G.; Dong, C.; Häussler, P. Composition formulas of Fe–B binary amorphous alloys. J. Noncryst. Solids 2016, 432, 453–458. [Google Scholar] [CrossRef]
- Dębski, A.; Dębski, R.; Gasior, W. New Features of Entall Database: Comparison of Experimental and Model Formation Enthalpies/ Nowe Funkcje Bazy Danych Entall: Porównanie Doświadczalnych I Modelowych Entalpii Tworzenia. Arch. Met. Mater. 2014, 59, 1337–1343. [Google Scholar] [CrossRef]
- Lashgari, H.; Chu, D.; Xie, S.; Sun, H.; Ferry, M.; Li, S. Composition dependence of the microstructure and soft magnetic properties of Fe-based amorphous/nanocrystalline alloys: A review study. J. Noncryst. Solids 2014, 391, 61–82. [Google Scholar] [CrossRef]
- Liu, T.; Wang, A.; Zhao, C.; Yue, S.; Wang, X.; Liu, C.T. Compositional design and crystallization mechanism of High B s nanocrystalline alloys. Mater. Res. Bull. 2019, 112, 323–330. [Google Scholar] [CrossRef]
- Zang, B.; Parsons, R.; Onodera, K.; Kishimoto, H.; Kato, A.; Liu, A.; Suzuki, K. Effect of heating rate during primary crystallization on soft magnetic properties of melt-spun Fe-B alloys. Scr. Mater. 2017, 132, 68–72. [Google Scholar] [CrossRef]
- Suzuki, K.; Parsons, R.; Zang, B.; Onodera, K.; Kishimoto, H.; Shoji, T.; Kato, A. Nanocrystalline soft magnetic materials from binary alloy precursors with high saturation magnetization. AIP Adv. 2019, 9, 035311. [Google Scholar] [CrossRef]
- Parsons, R.; Zang, B.; Onodera, K.; Kishimoto, H.; Shoji, T.; Kato, A.; Suzuki, K. Nano-crystallisation and magnetic softening in Fe-B binary alloys induced by ultra-rapid heating. J. Phys. D Appl. Phys. 2018, 51, 415001. [Google Scholar] [CrossRef]
- Suzuki, K.; Parsons, R.; Zang, B.; Onodera, K.; Kishimoto, H.; Shoji, T.; Kato, A. Nano-crystallization of amorphous alloys by ultra-rapid annealing: An effective approach to magnetic softening. J. Alloy. Compd. 2018, 735, 613–618. [Google Scholar] [CrossRef]
- Jiao, Z.; Li, H.; Gao, J.; Wu, Y.; Lu, Z. Effects of alloying elements on glass formation, mechanical and soft-magnetic properties of Fe-based metallic glasses. Intermetallics 2011, 19, 1502–1508. [Google Scholar] [CrossRef]
- Dou, L.; Liu, H.; Hou, L.; Xue, L.; Yang, W.; Zhao, Y.; Chang, C.; Shen, B. Effects of Cu substitution for Fe on the glass-forming ability and soft magnetic properties for Fe-based bulk metallic glasses. J. Magn. Magn. Mater. 2014, 358, 23–26. [Google Scholar] [CrossRef]
- Liu, Q.; Mo, J.; Liu, H.; Xue, L.; Hou, L.; Yang, W.; Dou, L.; Shen, B.; Dou, L. Effects of Cu substitution for Nb on magnetic properties of Fe-based bulk metallic glasses. J. Noncryst. Solids 2016, 443, 108–111. [Google Scholar] [CrossRef]
- Yang, W.; Liu, H.; Fan, X.; Xue, L.; Dun, C.; Shen, B. Enhanced glass forming ability of Fe-based amorphous alloys with minor Cu addition. J. Noncryst. Solids 2015, 419, 65–68. [Google Scholar] [CrossRef]
- Takeuchi, A.; Inoue, A. Classification of Bulk Metallic Glasses by Atomic Size Difference, Heat of Mixing and Period of Constituent Elements and Its Application to Characterization of the Main Alloying Element. Mater. Trans. 2005, 46, 2817–2829. [Google Scholar] [CrossRef] [Green Version]
- Radoń, A.; Babilas, R.; Włodarczyk, P.; Zackiewicz, P.; Łukowiec, D.; Polak, M.; Kądziołka-Gaweł, M.; Kolano-Burian, A.; Hawełek, Ł. Influence of copper addition and heat treatment parameters on nanocrystallization process of Fe-Co-Mo-B-Si amorphous ribbons with high saturation magnetization about 1.6 T. J. Magn. Magn. Mater. 2020, 496, 165951. [Google Scholar] [CrossRef]
- Radoń, A.; Włodarczyk, P.; Hawełek, Ł.; Kadziołka-Gaweł, M.; Gębara, P.; Nowosielski, R.; Babilas, R. Thermodynamic approach for determining chemical composition of Fe-Co based amorphous alloys with high thermal stability and glass forming ability. J. Alloy. Compd. 2018, 763, 141–152. [Google Scholar] [CrossRef]
- Kong, L.; Gao, Y.; Song, T.; Wang, G.; Zhai, Q. Non-isothermal crystallization kinetics of FeZrB amorphous alloy. Thermochim. Acta 2011, 522, 166–172. [Google Scholar] [CrossRef]
- Augis, J.A.; Bennett, J.E. Calculation of the Avrami parameters for heterogeneous solid state reactions using a modification of the Kissinger method. J. Therm. Anal. Calorim. 1978, 13, 283–292. [Google Scholar] [CrossRef]
- Shahri, F.; Beitollahi, A.; Shabestari, S.; Kamali, S. Effects of heat treatment on the structure and magnetic properties of Al-Ge addedFe73.5−xSi13.5B9Nb3Cualloys. Phys. Rev. B 2007, 76, 024434. [Google Scholar] [CrossRef]
- Goldfarb, I.; Kaplan, W.D.; Ariely, S.; Bamberger, M. Fault-induced polytypism in (Cr, Fe)2B. Philos. Mag. A 1995, 72, 963–979. [Google Scholar] [CrossRef]


| Alloy | Tonset (°C) | Tx1 (°C) | Tx2 (°C) | dTx (°C) |
|---|---|---|---|---|
| Fe86B14 | 382.4 | 405.9 | 493.8 | 87.9 |
| Fe85.6Cu0.4B14 | 391.6 | 412.4 | 501.3 | 88.9 |
| Fe85.45Cu0.55B14 | 380.9 | 405.1 | 492.9 | 87.8 |
| Fe85.3Cu0.7B14 | 390.4 | 407.9 | 494.1 | 86.2 |
| Fe85Cu1B14 | 391.5 | 406.8 | 493.9 | 87.1 |
| Alloy | Error (kJ/mol) | |
|---|---|---|
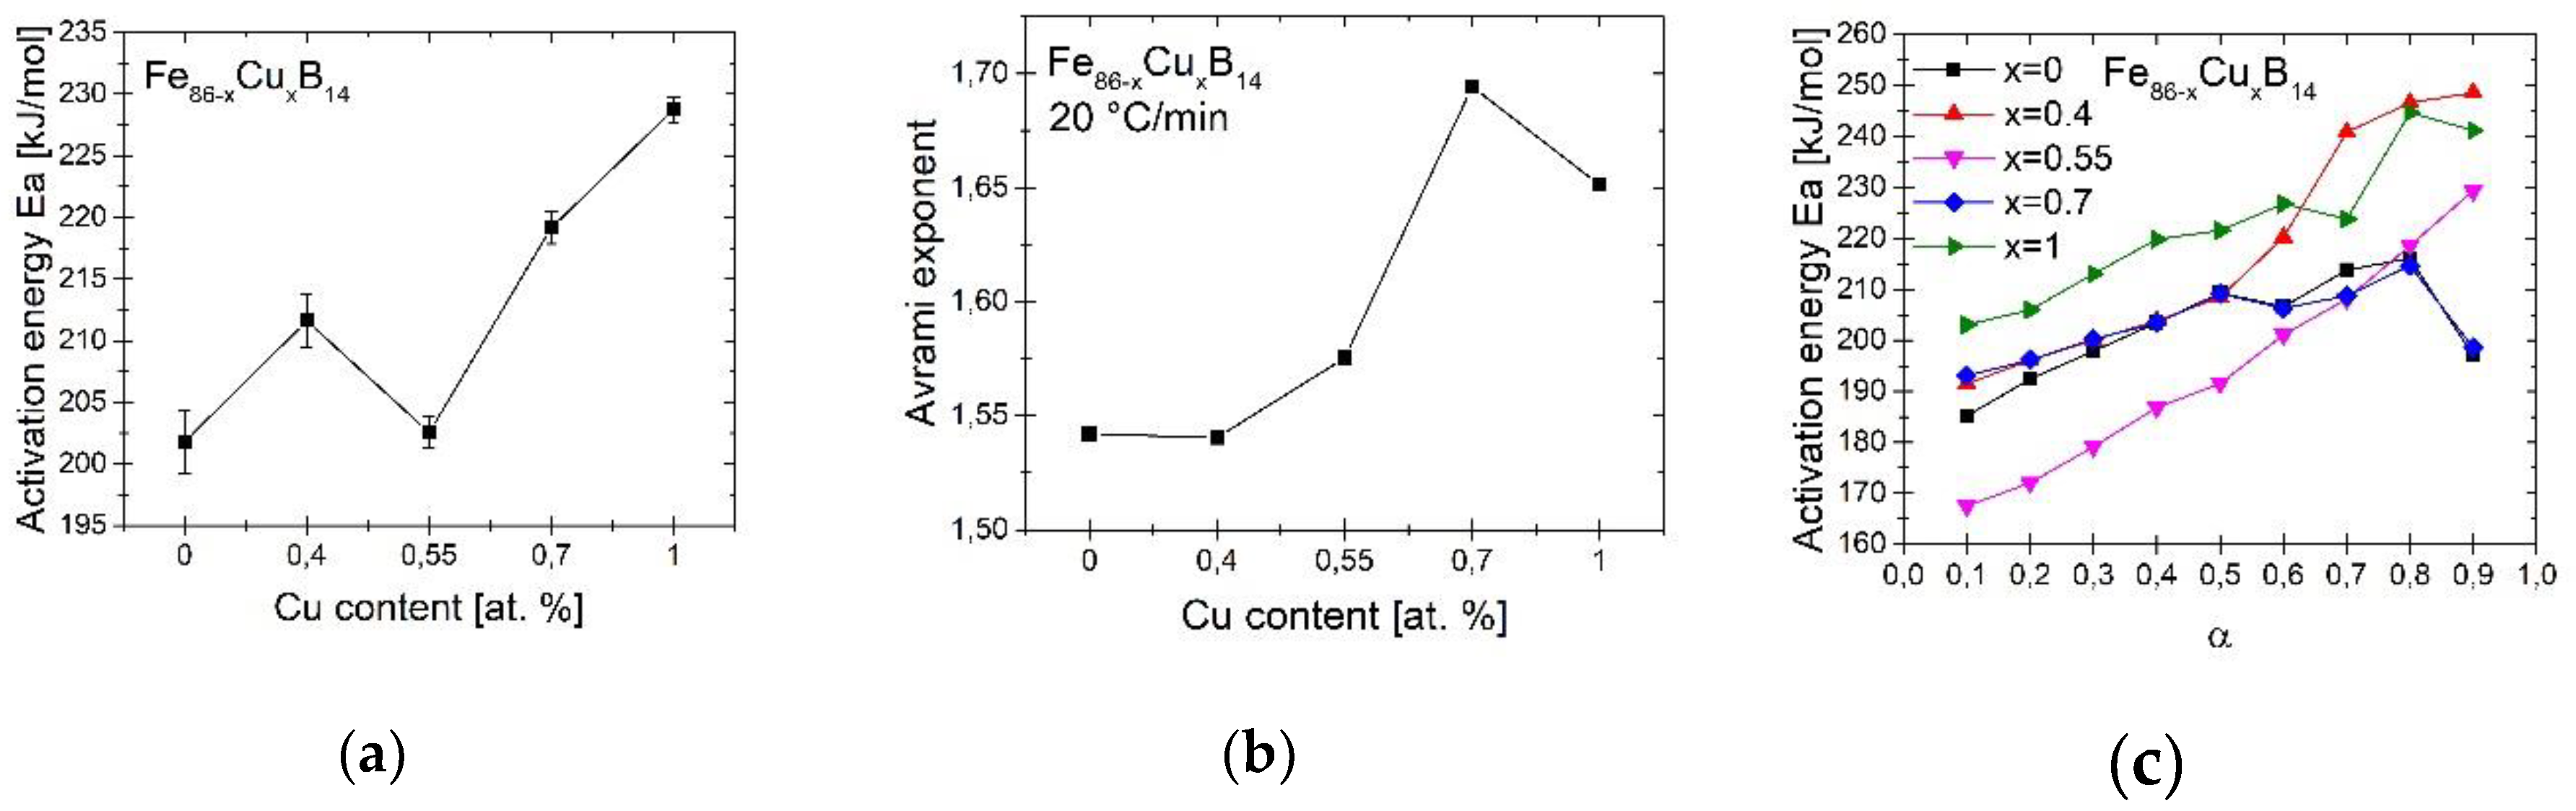
| Fe86B14 | 201.8 | 2.57 |
| Fe85.6Cu0.4B14 | 211.6 | 2.12 |
| Fe85.45Cu0.55B14 | 202.56 | 1.28 |
| Fe85.3Cu0.7B14 | 219.15 | 1.3 |
| Fe85Cu1B14 | 228.74 | 1.01 |
| Alloy | Ta (°C) | P10/50 (W/kg) | Bs (T) | Hc (A/m) |
|---|---|---|---|---|
| Fe86B14 | 290 | 0.19 | 1.51 | 12.4 |
| Fe85.6Cu0.4B14 | 280 | 0.25 | 1.47 | 13.1 |
| Fe85.45Cu0.55B14 | 280 | 0.21 | 1.5 | 13.1 |
| Fe85.3Cu0.7B14 | 290 | 0.13 | 1.53 | 9.71 |
| Fe85Cu1B14 | 300 | 0.14 | 1.6 | 9.91 |
© 2020 by the authors. Licensee MDPI, Basel, Switzerland. This article is an open access article distributed under the terms and conditions of the Creative Commons Attribution (CC BY) license (http://creativecommons.org/licenses/by/4.0/).
Share and Cite
Warski, T.; Wlodarczyk, P.; Polak, M.; Zackiewicz, P.; Radon, A.; Wojcik, A.; Szlezynger, M.; Kolano-Burian, A.; Hawelek, L. Influence of Cu Content on Structure and Magnetic Properties in Fe86-xCuxB14 Alloys. Materials 2020, 13, 1451. https://doi.org/10.3390/ma13061451
Warski T, Wlodarczyk P, Polak M, Zackiewicz P, Radon A, Wojcik A, Szlezynger M, Kolano-Burian A, Hawelek L. Influence of Cu Content on Structure and Magnetic Properties in Fe86-xCuxB14 Alloys. Materials. 2020; 13(6):1451. https://doi.org/10.3390/ma13061451
Chicago/Turabian StyleWarski, Tymon, Patryk Wlodarczyk, Marcin Polak, Przemyslaw Zackiewicz, Adrian Radon, Anna Wojcik, Maciej Szlezynger, Aleksandra Kolano-Burian, and Lukasz Hawelek. 2020. "Influence of Cu Content on Structure and Magnetic Properties in Fe86-xCuxB14 Alloys" Materials 13, no. 6: 1451. https://doi.org/10.3390/ma13061451