On the Microstructure and Properties of Nb-12Ti-18Si-6Ta-2.5W-1Hf (at.%) Silicide-Based Alloys with Ge and Sn Additions


Department of Materials Science and Engineering, Sir Robert Hadfield Building, The University of Sheffield, Mappin Street, Sheffield S1 3JD, UK
*
Author to whom correspondence should be addressed.
Materials 2020, 13(7), 1778; https://doi.org/10.3390/ma13071778
Submission received: 27 February 2020
/
Revised: 6 April 2020
/
Accepted: 7 April 2020
/
Published: 10 April 2020
Abstract
:In this paper two Nb-silicide-based alloys with nominal compositions (at.%) Nb-12Ti-18Si-6Ta-2.5W-1Hf-2Sn-2Ge (JZ1) and Nb-12Ti-18Si-6Ta-2.5W-1Hf-5Sn-5Ge (JZ2) were studied. The alloys were designed using the alloy design methodology NICE to meet specific research objectives. The cast microstructures of both alloys were sensitive to solidification conditions. There was macro-segregation of Si in JZ1 and JZ2. In both alloys the βNb5Si3 was the primary phase and the Nbss was stable. The A15-Nb3X (X = Ge,Si,Sn) was stable only in JZ2. The Nbss+βNb5Si3 eutectic in both alloys was not stable as was the Nb3Si silicide that formed only in JZ1. At 800 °C both alloys followed linear oxidation kinetics and were vulnerable to pesting. At 1200 °C both alloys exhibited parabolic oxidation kinetics in the early stages and linear kinetics at longer times. The adhesion of the scale that formed on JZ2 at 1200 °C and consisted of Nb and Ti-rich oxides, silica and HfO2 was better than that of JZ1. The microstructure of JZ2 was contaminated by oxygen to a depth of about 200 μm. There was no Ge or Sn present in the scale. The substrate below the scale was richer in Ge and Sn where the NbGe2, Nb5(Si1-xGex)3, W-rich Nb5(Si1-xGex)3, and A15-Nb3X compounds (X = Ge,Si,Sn) were formed in JZ2. The better oxidation behavior of JZ2 compared with JZ1 correlated well with the decrease in VEC and increase in δ parameter values, in agreement with NICE. For both alloys the experimental data for Si macrosegregation, vol.% Nbss, chemical composition of Nbss and Nb5Si3, and weight gains at 800 and 1200 °C was compared with the calculations (predictions) of NICE. The agreement was very good. The calculated creep rates of both alloys at 1200 °C and 170 MPa were lower than that of the Ni-based superalloy CMSX-4 for the same conditions but higher than 10−7 s−1.
1. Introduction
Ni-based superalloys, which are currently the metallic materials of choice for the hottest parts in state-of-the-art gas turbine engines, operate at temperatures greater than 90% of their melting temperatures assisted by cooling and coatings systems that cause loss of thermal efficiency [1]. These materials have reached their upper temperature limit, which is imposed by the melting point of Ni. New metallic materials with good long-term microstructural stability and load-bearing capabilities at higher turbine entry temperatures are needed to enable future aero-engines to meet performance and emission targets [1,2]. Nb-silicide-based alloys, also known as Nb-silicide in situ composites, are strong contenders owing to their lower densities, significantly higher solidus temperatures, attractive creep and strength properties at high temperatures, and significantly better oxidation resistance compared with conventional Nb alloys. Like the Ni-based superalloys, they are dependent on specific simple, transition (TM) and refractory (RM) metal and metalloid element alloying additions to give a balance of properties [3,4,5,6]. Other candidate metallic materials are Mo-silicide-based alloys. The latter and engineering ceramics or ultra-high temperature ceramics are not considered in this paper. Since 2010, refractory metal high entropy alloys (RHEA) or complex concentrated alloys (RCCA) or multi-principal element alloys (RMPEA) also have been considered as alternative metallic materials for the “beyond the Ni-superalloys” era [7]. The terms CCA or MPEA were proposed and are nowadays used for alloys that do not meet the “accepted” “standard definition” of high entropy alloys (HEA), namely “HEAs are alloys with many principal elements with the concentration of each element being between 35 and 5 at.%” [7,8]. Examples of RCCAs or RMPEAs are the alloys NbTiV2Zr [9], Al0.5CrNbTi2V0.5 [10], Al2Nb3TaTi3Zr [8], AlCrMoSi0.05TaTi [11] and Al9.2Cr5.7Hf0.5Mo1.3Nb47Ti25V9.5W0.8 [12]. Some Nb-silicide-based alloys also satisfy the standard definition of HEA [13].
The microstructures of Nb-silicide-based alloys consist of alloyed bcc Nb solid solution(s) (Nbss) and intermetallics [13,14] and references within. The latter include tetragonal M5Si3 and M3Si silicides, hexagonal M5Si3 silicides (M = TM,RM), C14 Laves and A15 phases [13]. The former can be Ti-rich Nbss, Si-free Nbss and “normal” Nbss [13] (see next section). Refractory metals confer solid solution strengthening to Nb solid solution [15,16,17,18] and are essential additions for achieving high temperature strength and creep property goals in Nb-silicide-based alloys [4,13,18]. Some Si-free Nbss in the latter also satisfy the accepted definition of HEA [14]. The strengthening effect of W in Nb is greater than those of Mo or Ta [15,16]. Nb-silicide alloy development research has studied the effects of Mo and/or W on the microstructure and high temperature strength [4,18,19,20]. Only a small number of papers has considered the effects of Ta addition [13] and to our knowledge there is no data for Nb-silicide-based alloys with Ta and W additions. Phases in RHEA/RCCA/RMPEA are one (or sometimes two) bcc (RM)ss, and Laves and/or M5Si3 silicide(s) [8]. In this paper we refer to these materials as RCCAs.
Many elements contribute to improving the oxidation resistance of Nb-silicide-based alloys. These include Al, B, Ce, Cr, Ge, Fe, Hf, Mo, Si, Sn, and Ti [3,5,13,21,22,23] and references within. Pest oxidation at intermediate temperatures (600–900 °C) is suppressed by the synergy of Al, Cr, Si, and Ti with B, Ge, or Sn [3,13]. Spallation of oxide scales formed at high temperatures is a common phenomenon [22,24,25,26]. However, scale spallation was prevented in a Nb-silicide-based alloy when Ge and Sn were added simultaneously with Al, Cr, Hf, Si, and Ti [27]. To date, alloy development has not discovered Nb-silicide-based alloys that meet both creep and oxidation property goals [13,23] and references within. Nb-silicide-based alloys, like the Ni-based superalloys, will require environmental coating system(s) yet should have inherent oxidation resistance to survive in case of coating failure [23]. Elements in RCCAs are the group IV, V, and VI TMs and RMs and sometimes there are additions of Al and/or Si (and Co or Ni). The same elements are used as additions in Nb-silicide-based alloys [13] with the exception of Ta, V, or Zr that have been used less frequently and Co and Ni that have not been used at all.
Toughness at room temperature, oxidation in the pest regime (600–900 °C) and at high temperatures (≥1000 °C), and creep at T ≥ 1050 °C and stress (σ) in the range 50 to 300 MPa have been evaluated for Nb-silicide-based alloys [2,3,4,5,13,18,19,20,21,22,23,24,25,26,27,28,29] and references within. Properties of the key phases in the latter alloys have also been measured [13] and references within and the effects of alloying on properties of Nb5Si3 have been studied [13] and references within. In contrast, creep properties and pest oxidation of RCCAs have not been studied [8]. Yield strength of RCCAs has been measured in compression tests at room temperature and 1000 °C, very few RCCAs have been tested in tension tests at room temperature, few RCCAs were tested in compression at 1200 °C and only two RCCAs have been tested at 1400 and 1600 °C [8]. The oxidation of RCCAs has been reported mainly at 1000 °C with few studies covering higher temperatures (1100, 1300 °C) and even fewer studies at lower temperatures [8]. The lack of oxidation studies of RCCAs in the pest regime is noticeable.
Contamination by interstitial elements is a serious issue in refractory metal alloys [15,16,17]. The contamination of phases by oxygen in Nb-silicide-based alloys in the bulk and below the scale has been studied systematically in our group, for example see [26,27]. There is a noticeable lack of studies for the contamination of phases by oxygen in RCCAs. The significance of interstitial contamination for the mechanical properties of RCCAs has been highlighted in [8].
Refractory metal additions are essential for the creep and high temperature strength of Nb-silicide-based alloys [4,13,18] and references within. Creep resistant Nb-silicide-based alloys should not suffer from pest oxidation and scale spallation. Could these aims be achieved in alloys with simultaneous additions of RMs, Ge, and Sn? The motivation of the research presented in this paper was to provide answers to this question. In this paper we study how the simultaneous addition of Ta, W, Hf, Ge, and Sn affects the microstructure and oxidation of two Nb-silicide-based alloys without Al and Cr. The structure of the paper is as follows. First, the design and selection of the alloys using the alloy design methodology NICE [13] is discussed. The experimental details are followed by the results for the as-cast and heat-treated microstructures and the isothermal oxidation of the alloys at 800 and 1200 °C. The discussion considers first the Si macrosegregation in the alloys, then their solidification and heat-treated microstructures, and this is followed by discussion of their oxidation. Predicted microstructures and properties using NICE [13] are compared with the experimental data.
2. Alloy Design and Selection
Nb-silicide-based alloys can be separated in three groups, depending on alloying additions and “targeted property” [6]. Alloys with transition/refractory metal additions meet (are close to) the creep property goal, which is “the creep strength should be greater than 170 MPa at a creep rate of 2 × 10⁻⁸ s−1 at 1200 °C” (the creep goal assumes alloy density of 7 g/cm3) [13,28], and occupy a particular area in the Δχ or VEC versus δ maps [6]. In the latter, the “basis” alloy YG8 has nominal composition Nb-18Si-5Hf-5Mo-3W [30]. For this alloy the alloy design methodology NICE [13] gives creep rate έ = 4.8 10−8 s−1 at T = 1200 °C and σ = 170 MPa and experiments gave έ = 10−7 s−1 at T = 1200 °C and σ = 200 MPa.
At 1200 °C and 200 MPa, polycrystalline Nb-silicide-based alloys with nominal compositions Nb-18Si-xRM-5Hf and Nb-zTi-18Si-xRM-yHf (RM=Mo,Ta,W, x = 2,3,5, y = 1,5, z = 8,11) [30,31] (i) lie in the area B in the Figure 1 in [6], and (ii) have experimental creep rates in the range 1.1 × 10⁻⁶ to 1.1 × 10⁻⁸ s−1, compared with creep rates in the range 10−6 to 4.4 × 10⁻⁸ s−1 predicted by NICE [13] for T = 1200 °C and σ = 170 MPa. At 1200 °C, the experimental creep rates of the single crystal CMSX-4 Ni-based superalloy are 2 × 10⁻⁶ s−1 and 6.3 × 10⁻⁵ s−1, respectively at 100 and 150 MPa. To our knowledge, CMSX-4 is not used under the above conditions.
In synergy with Al and/or Cr, Sn or Ge improve the oxidation resistance of Nb-silicide-based alloys in the pest oxidation regime when added individually [3,13,24,25,26] and in the pest regime and at higher temperatures when added simultaneously [3,27]. There is no data about (i) the microstructure and (ii) the oxidation of Nb-silicide-based alloys in which Ge and Sn are added simultaneously with TMs and RMs but without Al and Cr additions. Two objectives of the research presented in this paper are to elucidate (i) and (ii).
In Nb-silicide-based alloys three types of bcc Nb solid solution can form, namely “normal” Nbss, Ti-rich Nbss, and Nbss with no Si (i.e., Si-free Nbss, see above) [14]. The latter is observed in alloys with Mo, Ta, or W additions [14,30,31] but is stable only when Mo or Mo and W are present in the alloy [30,31]. In the Nb solid solution the partitioning of Ti is opposite to that of Mo or W, meaning Ti-rich Nbss tends to be poor in Mo or W and vice versa [31]. There is no data (iii) about the partitioning of Ti, Ta, and Mo or W in the Nb solid solution and (iv) about the type(s) of Nb solid solution(s) that is(are) stable in Nb-silicide-based alloys with simultaneous addition of RMs, Sn, and Ge. Two additional objectives of this paper are to study (iii) and (iv).
We used the alloy design methodology NICE [13] to select two Nb-Ti-Si-Ta-W-Hf-Ge-Sn silicide-based alloys. The starting point of alloy design was the target for creep rate έ = 10−7 s−1 at T = 1200 °C and σ = 170 MPa [13]. Alloy compositions were selected as described in [13] with specific constraints about alloying additions. The latter were as follows: the alloys should
(a) Lie in maps of the parameters δ, Δχ, and VEC in the area of Nb-silicide-based alloys with TM and/or RM additions that meet or are close to the creep property goal (see above);
(b) Be free of Al and Cr (because of objectives (i) and (ii));
(c) Have lower density than state-of-the-art Ni-based superalloys (ρ ≈ 9 g/cm3 for 3rd generation, ρ ≈ 8.64 to 8.95 g/cm3 for 2nd generation [1]) and lower than the density of single-phase bcc solid solution Al and Cr-free RCCAs with Ta additions (ρ ≈ 8.96 to 13.6 g/cm3 [8]);
(d) Have Ta and W additions with Ta/W = 2.4, which is higher than the ratio in RCCAs studied to date (Ta/W ≤ 1 [8]) and to keep low the DBTT (owing to the strong negative effect of W compared with Ta [16]);
(e) Ti and Hf additions with Ti/Hf = 12, which is higher than the ratio in RCCAs studied to date (Ti/Hf ≤ 3 [8]) and to keep low the DBTT [16];
(f) Sn/Ge = 1 and (g) Sn concentrations of 2 or 5 at.%.
As regards the above constraints, the (a), (d), and (e) were related to the creep target and data about creep in [4,13] and references within, the (b), (d), (e), and (g) were linked with (c) and the aim to have specific strengths higher than Ni-based superalloys, and the (b), (f), and (g) were linked with oxidation resistance. The choice of Sn concentrations, and thus constraints (f) and (g), was also “guided” by literature about the effect of Sn or Ge on the oxidation behavior of Nb-silicide-based alloys [3,13,24,25,26,27].
The nominal compositions (at.%) of the selected alloys were Nb-12Ti-18Si-6Ta-2.5W-1Hf-2Sn-2Ge (alloy JZ1) and Nb-12Ti-18Si-6Ta-2.5W-1Hf-5Sn-5Ge (alloy JZ2). In addition to the objectives (i) to (iv) that were given above, other objectives of the research presented in this paper were to compare (v) the predicted by NICE [13] creep rates for the actual compositions of the alloys JZ1 and JZ2 with the target one (see above), and (vi) the predicted by NICE [13] composition and vol.% of the Nbss in each alloy with the actual compositions and volume fractions of the solid solution. Related with the objective (ii), we also wish to compare (vii) with that predicted by NICE [13] and measure the weight gains after isothermal oxidation at 800 and 1200 °C for the actual compositions of the alloys JZ1 and JZ2. Objectives specific to solidification processing were (ix) to find out whether the alloys JZ1 and JZ2 could be prepared using arc melting, owing to them having alloying additions with a very wide range of melting temperatures (TmSn = 232 °C, TmGe = 937 °C, TmSi = 1412 °C, TmTi = 1667 °C, TmHf = 2227 °C, TmNb = 2467 °C, TmTa = 2980 °C and TmW = 3400 °C) and (x) to compare that predicted by NICE [13] macrosegregation of Si (MACSi) with the measured MACSi in each alloy.
3. Experimental
The two alloys were produced from high-purity elements (better than 99.99 wt.%) using arc melting under an argon atmosphere in a water-cooled copper crucible with a non-consumable tungsten electrode. Each alloy was melted five times to ensure as much as possible chemical homogeneity and cooled in the water-cooled copper crucible. Control of alloy composition proved very difficult owing to the loss by evaporation of elements with low melting points. Elemental losses were compensated by increasing the weight of each element that was lost. After many attempts, the “best” two alloys with composition as close as possible to the nominal ones were selected for further study. These are the alloys reported in this paper. The alloys were richer and poorer respectively in Si and Sn compared with the nominal compositions (see next section).
The alloy buttons were sectioned to produce specimens containing the top, bulk, and bottom areas of the button (bottom refers to the side facing the water-cooled copper crucible during melting) in order to fully characterize their as-cast microstructures and in particular to find out if there were different microstructures in the parts of the buttons that solidified under high cooling rates. The specimens were mounted in Bakelite, ground using 120, 400, 800, and 1200 grit papers, and polished to 1 surface finish using 6, 3, and 1 diamond pastes.
There were no peaks associated with the melting in each alloy up to 1600 °C, the highest temperature used in differential scanning calorimetry (DSC) experiments (data not shown). Specimens for heat treatment were cut from the bulk of the buttons, wrapped in Ta foil, placed in an alumina crucible, and heat treated at 1500 °C for 100 h in a tube furnace under a flow of argon. These conditions are the same with the highest temperature and longest time used in research on Nb-silicide-based alloys [30,31]. Titanium sponge was used at the entrance of the argon flow as the oxygen getter. The specimens were furnace cooled.
A Siemens D5000 X-ray diffractometer (HiltonBrooks Ltd., Crew, UK) with monochromatic CuK radiation ( = 1.540562 Å) was used to identify the phases in as-cast and heat-treated specimens. Phase identification was done by matching the characteristic peaks in the XRD diffractogram with PDF (powder diffraction file) data using the ICDD PDF-4+ (International Centre Diffraction Data, Newton Square, PA, USA) and Sieve+ software.
The microstructures of the alloys were observed using scanning electron microscopy (SEM) with backscattered electron (BSE) imaging and energy dispersive X-ray spectrometry (EDS). The latter was used to determine the chemical composition of each alloy and the phases in its microstructure. Inspect F SEM, JEOL 6400 SEM (JEOL Ltd., Tokyo, Japan) and Philips XL 30S FEG SEM instruments (ThermoFisher Scientific, Hillsboro, OR, USA) were used to study the microstructures. Chemical compositions of large areas from the top, bulk, and bottom of the buttons and of constituent phases were analyzed using JEOL 6400 SEM and Philips XL 30S FEG SEM instruments under a voltage of 20 kV. For the EDS, specimens of high purity Nb, Ti, Si, Hf, Ta, W, Ge, Sn, and Al2O3 that were polished to 1 μm finish were used as standards. Calibration of the EDS detector (Oxford Instruments, High Wycombe, UK) was done using a specimen of pure Co and was repeated every hour during analysis. A minimum of five EDS analyses of large areas and phases were performed. Only phases with size larger than 5 were analyzed. The chemical analysis data is given with the average, minimum, and maximum values and standard deviation. Area fractions of Nbss were calculated using the software Image-Pro with images of microstructures taken in the SEM in BSE imaging mode.
Thermogravimetric (TG) analysis was used to study the isothermal oxidation of the alloys at 800 °C and 1200 °C for 100 h. For the oxidation experiments, cubic samples of 3 × 3 × 3 mm3 were cut from the as-cast alloys and their sides were ground to 1200 grit. The dimensions of each specimen were measured using a micrometer and the surface area was calculated. Each specimen was placed in a small alumina crucible and its oxidation was studied in a NETZSCH STA 449 F3 thermal analyzer (NETZSCH GmbH, Selb, Germany). The rate of 3 °C per minute was applied in both heating and cooling. The oxidized samples were cold mounted and polished. Inspect F SEM and Philips XL 30S FEG SEM instruments were used to study the microstructures from the oxide scale to the bulk. The density of the alloys was measured using an AccuPyc II 1340 gas pycnometer.
4. Results
4.1. Alloy JZ1
The actual composition of the as-cast alloy (JZ1-AC) was 55Nb-11.6Ti-22.5Si-5.3Ta-1.7W-0.9Hf-1.2Sn-1.8Ge. This was the average of all the large area analyses taken from the top, bulk, and bottom of the button. There was macrosegregation of Si, the concentration of which was in the range 19 at.% to 24.6 at.%. The XRD and EDS data (Figure 1 and Table 1) confirmed the Nb5Si3, Nb3Si, Nbss, and HfO2 phases in the microstructure of JZ1-AC. The Nb5Si3 existed in both the βNb5Si3 and αNb5Si3 structures (Figure 1). The Nb3Si silicide was observed only in the bottom of the button.
The typical microstructures are shown in Figure 2. They did not differ in the top and bulk of the button, and consisted of irregular large Nb5Si3 grains surrounded by fine Nb5Si3 + Nbss eutectic and Nbss and a small vol.% of HfO2 (Figure 2a). The vol.% of the Nbss in the top was lower than in the bulk (Table 2). Tungsten and Sn partitioned to the Nbss, Ge to the Nb5Si3 and Ta to both phases. The areas exhibiting darker contrast in the Nb5Si3 and Nbss were rich in Ti and had lower concentrations of Ta and W and higher contents of Sn, Ge (only for Nb5Si3), and Hf, compared with the “normal” Nb5Si3 and Nbss. In the Nb5Si3 and Ti-rich Nb5Si3, the sums of the Si + Sn + Ge concentrations were 39.1 at.% and 37.9 at.%, respectively. The average composition of the Nb5Si3 + Nbss eutectic was 58.8Nb-10.8Ti-18.2Si-6.2Ta-2.8W-0.7Hf-1.3Sn-1.2Ge with Si + Sn + Ge = 20.7 at.%.
The microstructure in the bottom of the button contained only of Nb5Si3 and Nbss without the Nb5Si3 + Nbss eutectic (Figure 2c). The vol.% of Nbss in the bottom was the same as in the bulk (Table 2). There was a small region in the bottom of the button where the Nb3Si was present, surrounded by Nb5Si3 + Nbss lamellar microstructure and Nbss (Figure 2d–f). The average composition of this area was 56Nb-11.8Ti-21.2Si-5.6Ta-1.8W-1Hf-1.3Sn-1.3Ge with Sn/Ge = 1, slightly poorer in Si and Ge and richer in Ta and Sn, compared with the rest of the button. Unlike the Nb5Si3, in the Nb3Si the concentrations of Ta and W were relatively high, respectively at 6.5 at.% and 1.5 at.%, and the Sn solubility was very low.
The average composition of the alloy after the heat treatment (JZ1-HT) was 55Nb-12Ti-22.4Si-5.2Ta-1.6W-0.8Hf-1.2Sn-1.8Ge. There was still Si inhomogeneity in the microstructure. The microstructure consisted of Nb5Si3, Nbss, HfO2, and Ti oxide (Figure 3a, Table 1). According to the XRD data (Figure 1b), the Nb5Si3 existed in both the αNb5Si3 and βNb5Si3 forms with more peaks corresponding to the former. There were no peaks corresponding to the Nb3Si. EDS showed there was no Ti-rich Nbss, whereas Ti-rich Nb5Si3 was still present. The vol.% of the Nbss had not changed after the heat treatment (Table 2).
Compared with the JZ1-AC, there were slight changes in the concentration of Si, Ta, W, Sn, and Ge in the Nbss and the concentration of Hf in the Nbss was reduced to zero owing to the consumption of Hf to form HfO2. The Ta + W content in the Nbss was reduced to 12.0 at.%. The composition of the Nb5Si3 was essentially unchanged and there was no W in the Ti-rich Nb5Si3. Titanium oxide had formed just below the surface of the specimen because of the contamination of the latter by oxygen during the heat treatment.
4.2. Alloy JZ2
The actual composition of the as-cast alloy (JZ2-AC) was 50.5Nb-11.8Ti-21.5Si-5.2Ta-2.0W-1Hf-2.8Sn-5.2Ge. This was the average of all the analyses taken from the top, bulk, and bottom of the button. There was macrosegregation of Si with the Si content in the range of 18.8 to 23.7 at.%. The XRD and EDS data (Figure 4 and Table 3) confirmed the Nb5Si3, Nbss, A15 compounds and HfO2. Both the βNb5Si3 and αNb5Si3 were present in the diffractogram with more peaks of the former. The A15 compound was observed only in the bottom of the button.
The microstructure is shown in Figure 5. In the top and bulk of the button the primary Nb5Si3 was surrounded by Nb5Si3 + Nbss eutectic, Nbss and HfO2. The average composition of the eutectic was 53.2Nb-13.5Ti-15.6Si-5.9Ta-3W-3.4Sn-4.3Ge-1.1Hf with Si + Ge + Sn = 23.3 at.%. Compared with JZ1-AC, the eutectic was richer in Ti and poorer in Si. In the bottom there were A15, finer Nb5Si3 and Nbss and no eutectic and Nb3Si. The top right hand corner of Figure 5c shows the change from the bottom microstructure to that in the bulk. The partitioning of elements between the Nbss and the Nb5Si3 was the same as in JZ1-AC. Titanium-rich Nbss and Nb5Si3 grains were observed in the top and bulk but no Ti-rich Nbss was formed in the bottom of the button. The enrichment of Ti in the solid solution and the silicide “pushed out” the Ta and W and drew in the Sn in the Nbss and the Sn, Ge, and Hf in the Nb5Si3. In the Nbss and Ti-rich Nbss, the Ta + W content was 15.8 at.% and 12.0 at.%, respectively, the latter significantly higher compared with the alloy JZ1-AC (7.3 at.%). The Si + Sn + Ge concentration in the “normal” and Ti-rich Nb5Si3 were 39.5 at.% and 38.7 at.%. The vol.% of the Nbss in the bottom was lower than those in the top and bulk (Table 2), owing to the presence of A15. The latter exhibited darker contrast than the Nbss in BSE images. The Si + Sn + Ge and Ta + W contents in the A15 were 19.2 at.% and 6.9 at.%, respectively.
The average composition of the alloy after the heat treatment (JZ2-HT) was 51Nb-12Ti-21.1Si-5.4Ta-2.1W-0.8Hf-2.7Sn-4.9Ge. Chemical inhomogeneity of Si was still present. The typical microstructure is shown in Figure 3b. The XRD and EDS data (Figure 4b and Table 3) confirmed the presence of A15, Nbss, Nb5Si3, and TiO2. The eutectic microstructure was not stable and the Nb5Si3 existed with both the β and α structures with fewer peaks corresponding to the former (Figure 4b).
In the Nbss the Si solubility was high (3.5 at.%) and the Sn concentration had decreased to 2.2 at.%. The concentrations of Ta and W in the Nbss had increased and the Ta + W content was 17.5 at.%, higher than that in JZ1-HT (12.0 at.%). Ti-rich Nb5Si3 was still observed and there were Ti-rich sub-grain boundaries in the Nb5Si3. The latter also were observed in the αNb5Si3 in heat-treated small buttons of the alloy CM1 (=Nb-8.3Ti-21.1Si-5.4Mo-4W-0.7Hf) in [31]. The chemical compositions of the Nb5Si3 and the A15 compounds did not change significantly after the heat treatment. Hafnium in the Nbss and the A15, and W in the Ti-rich Nb5Si3 were undetectable. Titanium oxide formed below the surface after the heat treatment.
4.3. Oxidation
4.3.1. Oxidation at 800 °C
The TG data of the alloys are shown in Figure 6a,b and the specimens after the oxidation experiments are shown in Figure 7a,b. Both alloys were susceptible to pest oxidation. The weight gains of the alloys JZ1 and JZ2 after 100 h were 33.6 mg/cm2 and 28.9 mg/cm2, respectively (Table 4). The weight gains of both alloys increased gradually up to about 40 h. At about 56 and 54 h from the start of the experiment the alloys JZ1 and JZ2, respectively, showed an abrupt drop in weight gain, after which the weight increased linearly at a similar rate as that from the start of the experiment to about 40 h. The oxidation of both alloys followed linear kinetics with similar oxidation rates (Table 4). Typically, a sudden weight loss may be due to the scale spalling and falling from the crucible/balance so that a large weight loss is detected.
4.3.2. Oxidation at 1200 °C
The TG data of the alloys is shown in Figure 6c,d and the specimens are shown in Figure 7c,d. The oxidation of both alloys exhibited parabolic kinetics in the initial stage of oxidation, followed by linear kinetics (Table 4). The weight gain of the alloy JZ1 was 91.3 mg/cm2 and there was spallation of its oxide scale. The weight gain of the alloy JZ2 was lower (71.4 mg/cm2) and the adherence of its scale was better. Because of the latter, only the cross section of the alloy JZ2 was studied.
A cross section of the alloy JZ2 is shown in Figure 8a. There were three regions, namely the oxide scale, diffusion zone, and bulk. Pores and cracks were observed in the scale. The diffusion zone consisted of two different microstructures, which are marked as diffusion zone 1 and diffusion zone 2 in Figure 8a.
Table 5 gives the compositions of three oxides that were formed in the scale, namely Nb-rich oxide (grey contrast phase), Ti-rich oxide (darker grey contrast phase), and HfO2 (white contrast phase). Silica was also present in the scale. It appeared as a black phase and had the same contrast with pores and cracks. No Ge and Sn were detected in the scale. The microstructure in the bulk was similar to that of the cast alloy and included the A15 compound. The Ti-rich Nb5Si3 silicide and A15 compound were leaner in Si, the former was richer in Ti and the Nbss was leaner in Sn, compared with JZ2-AC and JZ2-HT.
The Nbss, Nb5Si3, A15, HfO2, and Ti oxides were present in the diffusion zone 2. The TiO2 exhibited black contrast and was formed adjacent to the Nb5Si3 and inside the Nbss and A15, where the Ti concentrations were reduced by 4.8 and 2.4 at.%, respectively, compared with the bulk, owing to the consumption of Ti to form the oxide. This indicated the contamination of the microstructure by oxygen to the depth of diffusion zone 2 below the scale (about 200 μm). The phases in the diffusion zone 1 were the Nb5(Si1-x,Gex)3, NbGe2, and HfO2. There were W-rich areas in the former compound. The tI32-W5Si3-type Nb5Ge3 and the NbGe2 are stable compounds in the Nb-Ge binary system. The former is isomorphous with βNb5Si3. Thus, the Nb5(Si1-x,Gex)3 and the W-rich areas of the compound that formed in the diffusion zone 1, most likely were silicides of the W5Si3-type. The formation of Nb5(Si1-x,Gex)3 in the diffusion zone is in agreement with [27].
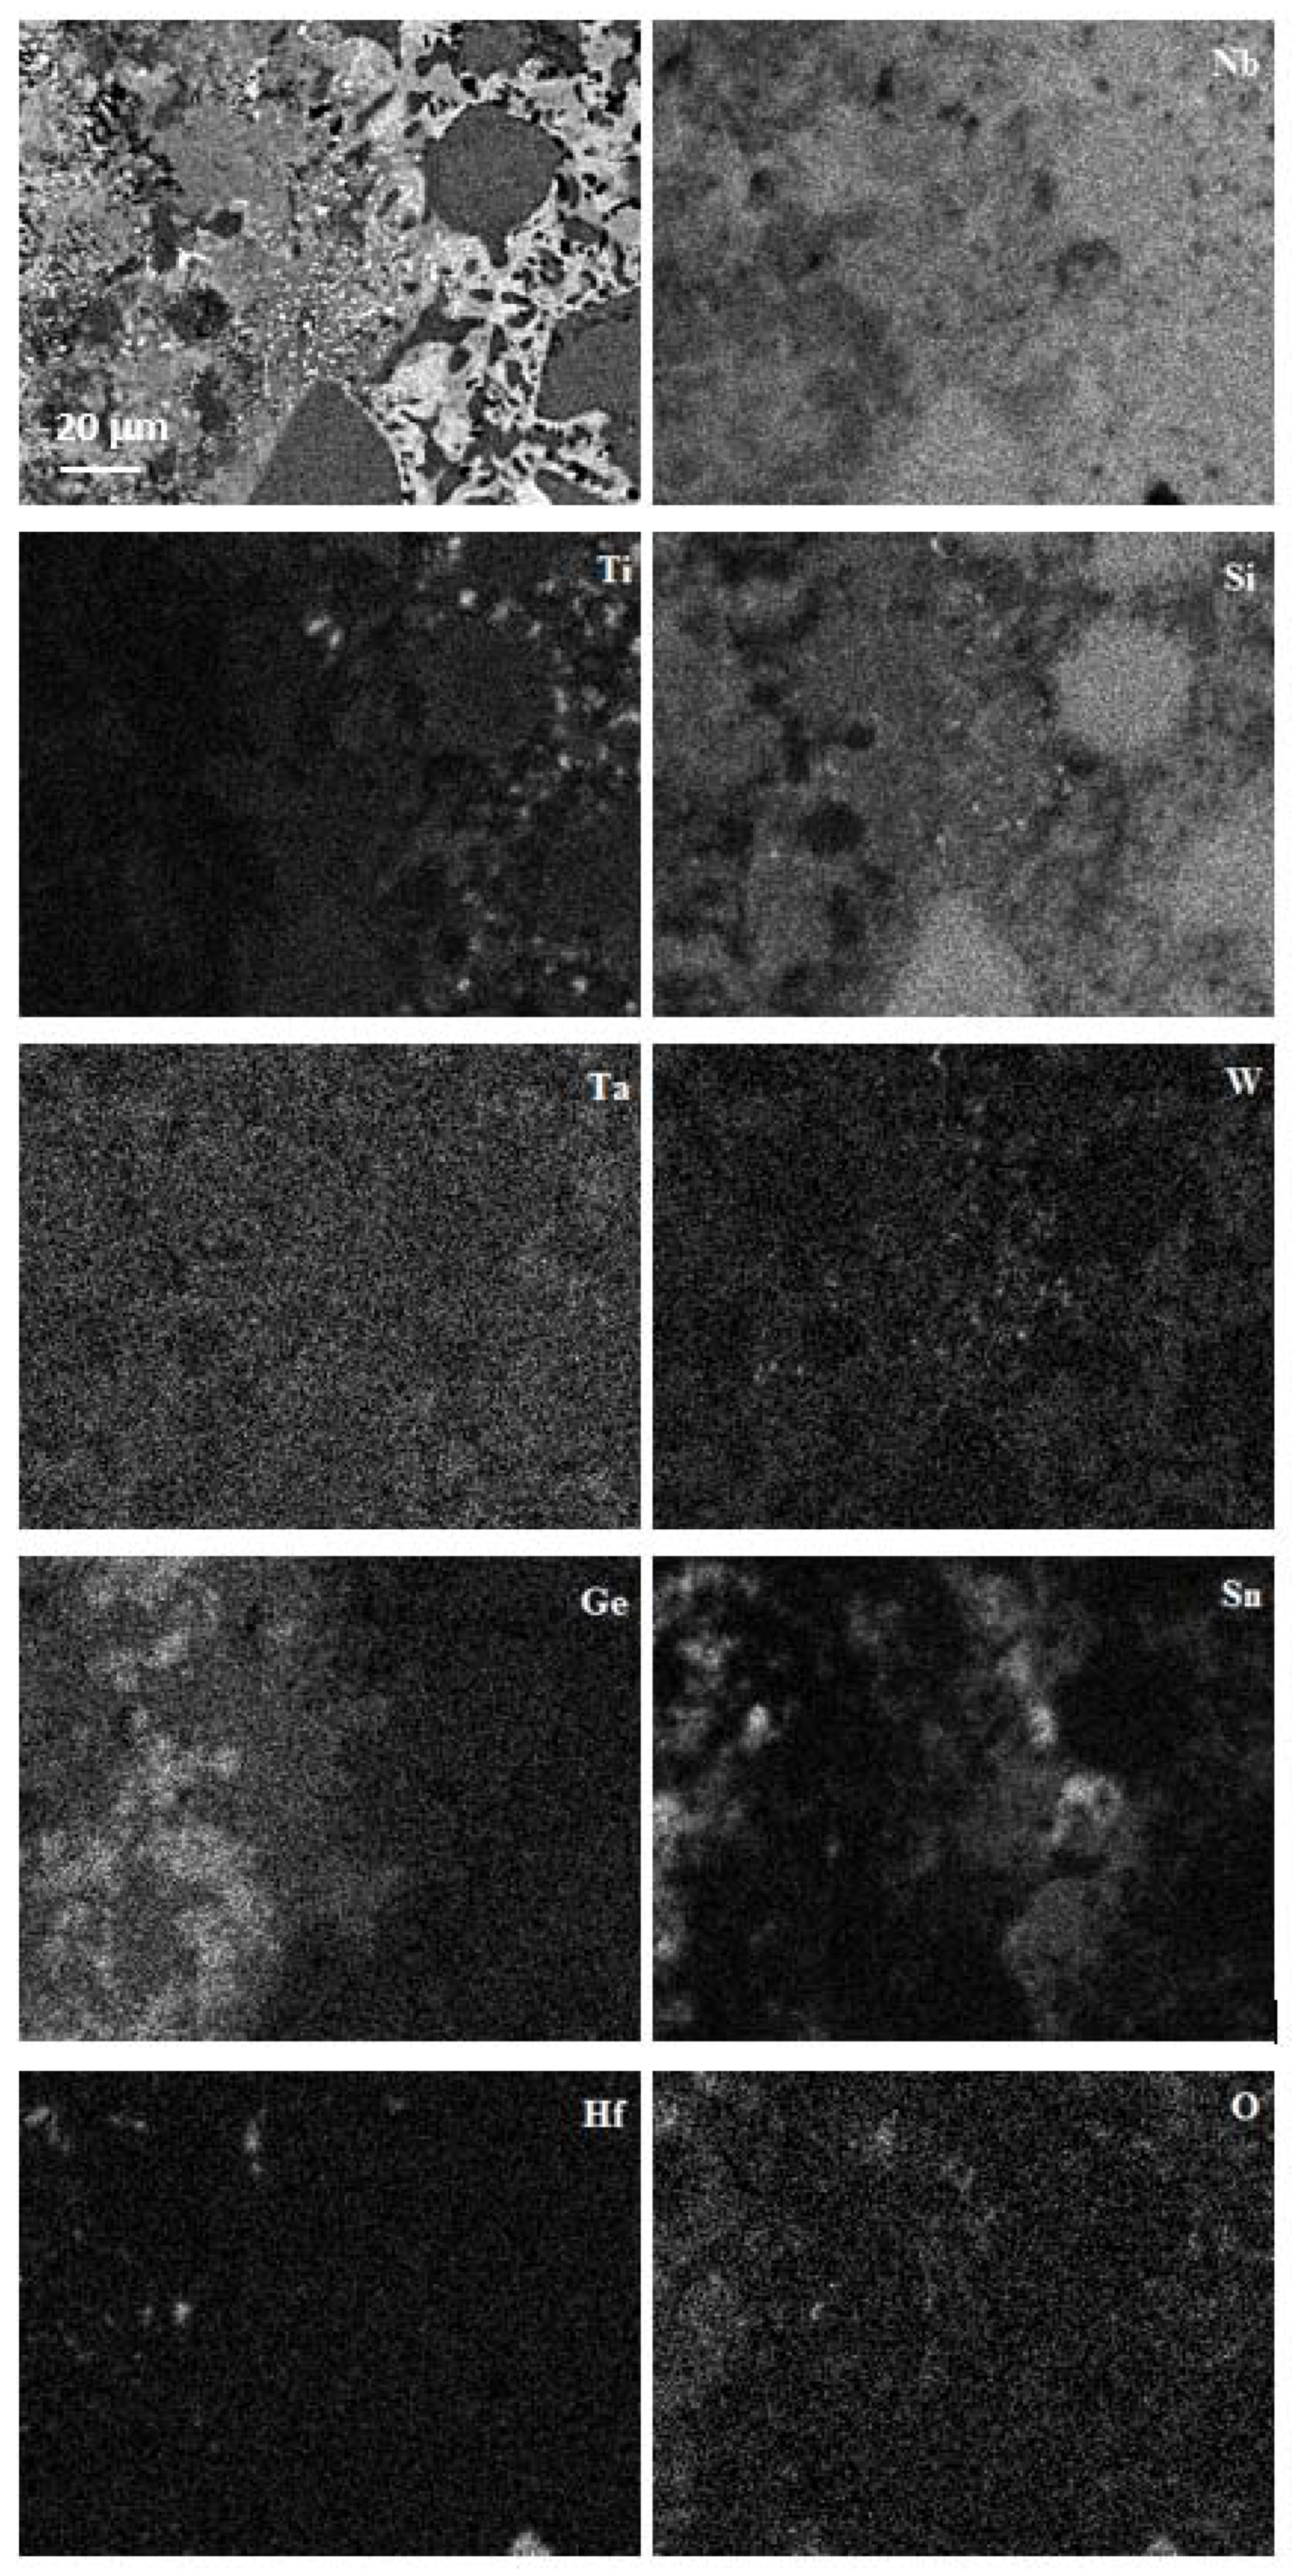
A continuous layer exhibiting bright contrast that separates the diffusion zone 1 in two parts should be noticed in Figure 8a. The chemical analysis data and the X-ray maps in Figure 9 showed that the layer was rich in Sn and lean in other elements and oxygen. The layer had some regions of dark contrast, which were rich in Ge (Figure 9). In the regions near the interface between the diffusion zones 1 and 2, a high volume fraction of particles of white contrast were dispersed in the Nbss, A15, and Nb5(Si1-x,Gex)3 (Figure 8d). These particles were too small for the chemical analysis but X-ray maps suggested that some were rich in W (Figure 9), most likely W-rich solid solution. The maps in Figure 9 also confirmed the enrichment in Ge and Sn toward the surface of the oxidized specimen.
5. Discussion
5.1. Densities
The densities of both alloys (Table 2) met the constraint (c) (see Section 2), were lower than the upper density value of TM HEA (9 g/cm3 [8]) and multiphase RCCAs with/out Al, Cr, or Si (8.6 g/cm3 [8]) and were also lower than (a) the densities of the alloys YG4 (Nb-18Si-5Hf-3Ta-2Mo), YG5 (Nb-20Si-5Mo-3W), and YG8 (Nb-20Si-5Hf-5Mo-3W) [31] (respectively 8.38, 8.63, and 8.67 g/cm3) and (b) the target density (ρ = 9 g/cm3) of Nb-silicide-based alloys with RM additions and with strength of 450 MPa at 1500 °C [18]. However, the densities of JZ1 and JZ2 were higher than those (i) of the Al and/or Cr containing JG series of alloys with/out Mo, Hf, or Sn (6.55 ≤ ρ ≤ 7.68 g/cm3), (ii) of the Al and/or Cr containing KZ series of alloys with/out Ta (6.55 ≤ ρ ≤ 7.15 g/cm3), (iii) of the Ge containing ZF series of alloys with/out Al and/or Cr or Hf additions (6.14 ≤ ρ ≤ 7.99 g/cm3).
5.2. Macrosegregation
Macrosegregation of Si (MACSi) existed in both alloys. The latter is defined as MACSi = CmaxSi − CminSi where CmaxSi and C minSi, respectively are the maximum and minimum Si concentrations in the cast alloy [26,27]. The MACSi values were 5.6 and 4.9 at.% for the alloys JZ1 and KZ2, respectively. In Nb-silicide-based alloys, the increase of MACSi has been correlated with the increase and decrease of specific alloy parameters [26,27] and such trends have been confirmed in Nb-silicide-based alloys with a wide range of alloying additions and concentrations [26,27]. To our knowledge, there is no data about the macrosegregation of Si in Nb-silicide-based alloys with Ta or W, and Ge or Sn as alloying elements that would allow studying the parameter trends for the alloys JZ1 and JZ2.
5.3. Microstructures
In both alloys the primary phase was the βNb5Si3. In the alloy JZ1, as the primary silicide formed the surrounding melt became rich in Sn, Ta, Ti, and W owing to the partitioning of these solutes. In this melt the Nbss and the Nbss + βNb5Si3 eutectic formed, and Nbss halos formed around the primary βNb5Si3 grains. Some Nbss halos surrounded the primary βNb5Si3 completely (Figure 2a). Halo formation results from the competitive growth of eutectic phases in the solidification of a melt of off-eutectic composition. In the eutectic in JZ1, the Si + Ge + Sn content was 20.7 at.%, which is close to the composition of the metastable Nbss + βNb5Si3 eutectic in the Nb-Si binary [32] and falls within the range of Nbss + βNb5Si3 eutectic compositions in Nb-silicide-based alloys [13] and references within.
Both βNb5Si3 and αNb5Si3 were present in JZ1-AC (Figure 1a). The αNb5Si3 can form on cooling from the βNb5Si3 or from the Nb3Si via a eutectoid transformation [31,33]. Solute additions (i) stabilize the βNb5Si3 [13,31], (ii) promote the βNb5Si3 → αNb5Si3 transformation, and (iii) stabilize or destabilize the tetragonal Nb3Si [13]. We can understand these effects by considering the crystal structures of M5Si3 and M3Si silicides and the stability of the latter in Nb-Si-TM/RM ternaries.
In the top and bulk of JZ1-AC, the Si concentration was in the range 20.4 to 24.4 at.% and 21.2 to 23 at.%, respectively (Table 1). Thus, in both cases and according to the Nb-Si binary phase diagram the primary phase should be the βNb5Si3. The Nb3Si would form via L + βNb5Si3 → Nb3Si and then αNb5Si3 from βNb5Si3 + Nb3Si → αNb5Si3 and Nb3Si → Nbss + αNb5Si3. In the top and bulk of the button of JZ1-AC, no evidence was found for Nb3Si, and microstructures resulting from these phase transformations.
The solutes Ta and Ti form tetragonal M3Si silicides that have the same crystal structure as Nb3Si (tP32, prototype Ti3P) and that are stable at room temperature, and thus would be expected to encourage the formation of the latter. The solutes Hf and W do not form M3Si silicides and thus would be expected to have the opposite effect. Furthermore, Sn suppresses the tetragonal Nb3Si on its own or with Ti [26], or Hf [34], meaning that Sn has a very strong effect on the stability of the tetragonal Nb3Si. Germanium could also have the same effect, which was compromised when it was added to a Nb-silicide-based alloy with Ti. The solute elements Ge, Ta, W form tetragonal 5-3 silicides that have the same crystal structure as the βNb5Si3 (tI32, D8m, prototype W5Si3) [35], and thus would be expected to stabilize the latter but Sn promotes the βNb5Si3 → αNb5Si3 transformation on its own or with Ti. The solute elements Sn and W promote the Nbss + Nb5Si3 eutectic in ternary Nb-Si-X alloys [20]. In the case of W, the Nbss + Nb3Si eutectic is suppressed and replaced by the Nbss + βNb5Si3 eutectic when W ≥ 3 at.% in the ternary alloy [20].
It is suggested that in the top and bulk of JZ1-AC the solidification path was L → L + βNb5Si3 → βNb5Si3 + (Nbss + βNb5Si3)eutectic with the tetragonal Nb3Si suppressed for the reasons discussed above. The formation of αNb5Si3 in these parts of the button occurred during solid state cooling and was promoted by Sn [31,34].
Disagreements about the Si content of different phases, and temperatures of phase equilibria in the Nb-Si binary system have been highlighted by David et al. [36]. For example, the temperature and composition of the liquid (i) for the L → Nb + Nb3Si eutectic transformation have been reported to be respectively in the ranges 1912 to 1938 °C and 15.3 to 18.7 at.% Si and (ii) for the L + βNb5Si3 → Nb3Si peritectic transformation to be respectively in the ranges 1968 to 1997 °C and 17 to 21.1 at.% Si. In the bottom of the button of JZ1-AC the Si concentration was in the range 19 to 24.6 at.%. Considering the available Nb-Si binary phase diagrams, for Si concentrations of the melt between the compositions of the liquid for the above eutectic and peritectic transformations the solidification path should be L → L + Nb3Si → Nb3Si + (Nbss + Nb3Si)eutectic → (Nbss + Nb3Si)eutectic + (Nbss + αNb5Si3)eutectoid and for Si concentrations exceeding the composition of the liquid for the above peritectic transformation the solidification path should be L + βNb5Si3 → Nb3Si and then Nb5Si3 should form from the peritectoid transformation βNb5Si3 + Nb3Si → αNb5Si3 and the eutectoid transformation Nb3Si → Nbss + αNb5Si3.
In the microstructure in the bottom of the button of JZ1-AC there was no evidence of either of the above solidification paths. Instead, the microstructure was (a) either a mixture of coarse Nbss and Nb5Si3 (Figure 2c) with a transition to the βNb5Si3 + (Nbss + βNb5Si3)eutectic bulk microstructure (Figure 2b), or (b) a mixture of Nbss, Nb5Si3, and Nb3Si (Figure 2d,e,f) (which was not observed in JZ2-AC), with a transition to the bulk microstructure, i.e., βNb5Si3 + (Nbss + βNb5Si3)eutectic (Figure 2d, notice scarce Nbss halos around the Nb5Si3 in the βNb5Si3 + (Nbss + βNb5Si3)eutectic microstructure in this figure) and there was evidence of the transformation Nb3Si → (Nbss + αNb5Si3)eutectoid, see Figure 2f. The dominant microstructure was the mixture of coarse Nbss and Nb5Si3 followed by a transition to the βNb5Si3 + (Nbss + βNb5Si3)eutectic bulk microstructure, see Figure 2b,c.
In as-cast Nb-Si-Ge ternary alloys the microstructure that formed in contact with the water-cooled crucible consisted of a mixture of Nbss and Nb5Si3, like the microstructure in Figure 2c, and there was a transition of the latter (anomalous eutectic) to regular eutectic to Nb5Si3 + (Nbss + Nb5Si3)eutectic (as shown in Figure 2b) further away from the water-cooled side toward the bulk of the button. The “width” of the former zone (mixture of Nbss and Nb5Si3) increased with Ge content in the alloy. The microstructures seen in Figure 2c,d were attributed to the addition of Ge in the alloy JZ1.
In cast Nb-silicide-based alloys prepared using arc melting, different zones and/or transitions are observed in the microstructures that are formed from the undercooled melt that was in contact with the water-cooled copper crucible [26]. A eutectic that exhibits a transition from anomalous to regular eutectic with decreasing melt undercooling (ΔTmelt) usually consists of a solid solution with an intermetallic. The coarse microstructure in the bottom of JZ1-AC (Figure 2c) consisted of the solid solution Nbss and the Nb5Si3 intermetallic. These phases have different crystal structures and the Nb5Si3 has higher entropy of fusion (ΔSf = 14.55 J/mol K) than Nbss (ΔSf = 9.45 J/mol K). High ΔSf signifies flat (facetted, sharp) S/L interface and thus kinetic undercooling is required for growth of the interface. In other words, the Nb5Si3 would require kinetic undercooling to grow. In unconstrained solidification of eutectic melts (as is the case of solidification in a water-cooled copper crucible) a transition from purely anomalous eutectic to a mixture of regular and anomalous eutectic to regular eutectic has been reported with decreasing melt undercooling [37].
It is suggested that in the bottom of the button of JZ1-AC the undercooling of the melt was ΔTmelt > ΔTcritical, with ΔTcritical ≈ 0.25ΔTmax, where ΔTcritical and ΔTmax are respectively the critical undercooling for the formation of anomalous eutectic and the maximum undercooling achievable in the eutectic system [38]. The condition ΔTmelt > ΔTcritical meant different growth rates for the Nbss and Nb5Si3, with the former growing faster, owing to its low ΔSf, which signifies diffuse (rough) S/L interface than the latter with higher ΔSf (see above). This caused decoupled growth of the two phases of the eutectic and led to the anomalous microstructure in the bottom. As the latter grew the released latent heat of solidification increased the temperature of the melt ahead of the S/L interface which led to lower growth rates and eventually coupled growth between the two phases became possible and resulted in the formation of the regular eutectic.
A microstructure consisting of three phases (Nbss, Nb3Si, Nb5Si3) was seen in parts of the bottom of the JZ1-AC, see Figure 2d,e, where the volume fraction of the Nb3Si was higher than the other two phases. This microstructure could be a ternary eutectic consisting of the aforementioned phases. In parts of this three phase microstructure the Nb3Si had transformed, as shown in Figure 2f, and the morphological characteristics of the transformation are typical of the eutectoid transformation Nb3Si → Nbss + αNb5Si3. Some of the Nb5Si3 that was detected by XRD must be attributed to this phase transformation.
In the Nb-Si binary system the Nb3Si can form as the primary phase when the Si content of the melt is greater than the eutectic composition (see above and [36]). In the bottom of the button of JZ1-AC where the Nb3Si was observed, the lowest Si concentration was 19 at.% (Table 1). However, the Nb3Si did not form in the bottom of JZ2-AC where the lowest Si concentration was 18.8 at.%, essentially the same with JZ1 (Table 3). This difference was attributed to the higher Sn concentration in the alloy JZ2, compared with the alloy JZ1, and the strong destabilizing effect of Sn on the tetragonal Nb3Si (see above). The Nb3Si formed in the bottom of JZ1 because of the Si content of the melt that solidified in contact with the water-cooled crucible (see above) and because the chemical composition of the microstructure shown in Figure 2e,f was essentially the same as that of the bottom of JZ1-AC but with Ge/Sn = 1 (see Section 4.1) instead of Ge/Sn = 1.6 (Table 1). This would suggest that at low Sn contents in the alloy, the Ge, which can destabilize the tetragonal Nb3Si but not as effectively as Sn, is required to “help” the Sn suppress the tetragonal Nb3Si.
The Figure 2b shows a transition from a Nbss and Nb5Si3 coarse microstructure to the Nb5Si3 + (Nbss + Nb5Si3)eutectic microstructure, in other words it shows that the latter “grew” from the former. It is suggested that in the parts of the bottom of the button where the tetragonal Nb3Si had formed, this transition occurred when the growth of Nb3Si was destabilized by high Sn concentration in the melt ahead of the ternary eutectic/melt interface (Sn has negligible solubility in Nb3Si and low solubility in Nb5Si3, see Table 1, thus the solidification of the ternary was accompanied by partitioning of Sn in the melt) so that only Nbss and Nb5Si3 could form, and then under the condition ΔTmelt > ΔTcritical the two phases (Nbss and Nb5Si3) grew, as discussed above.
The microstructure in the top and bulk of the button of JZ2-AC was formed with the same solidification path as discussed above for the top and bulk of JZ1-AC. The finer scale of the eutectic in the top and bulk of the alloy JZ2 compared with the alloy JZ1 (Figure 2a and Figure 5a) was attributed to the higher Ge content in the alloy JZ2 and the higher Ge/Sn ratio in the top and bulk. Germanium refines the eutectic microstructure in ternary Nb-Si-Ge alloys. The average Si + Ge + Sn content of the eutectic was 23.3 at.%. The latter is in the range of the compositions of eutectics with Nbss and βNb5Si3 that are formed in Nb-silicide-based alloys [13] and references within.
The A15 compound was observed only in the bottom of JZ2-AC where the melt was richer in Sn compared with the bulk and top (Table 3). Researchers have suggested (i) that formation of A15-Nb3Sn in Nb-silicide-based alloys depends strongly on their Sn content and (ii) that a minimum Sn concentration is required for the Nb3Sn to be stabilized in the microstructure [3,26,39]. This is supported by the results for the alloys JZ1 and JZ2.
The microstructure that formed in the bottom of the button of JZ2-AC was slightly different compared with JZ1-AC. Indeed, the phases that formed in JZ2-AC were the Nbss, A15, and Nb5Si3 and there was no Nb5Si3 + Nbss eutectic and no Ti-rich Nbss and Ti-rich Nb5Si3 (bottom left hand corner in Figure 5d). The entropies of fusion of the Nbss, A15-Nb3Sn, and Nb5Si3 are 9.45, 11.6, and 14.55 J/mol K, respectively. Thus, the growth of the former two would be expected to be easier than that of the Nb5Si3, which would require kinetic undercooling (see above).
Niobium has the bcc structure, which is also the structure of the Nb solid solution in Nb-silicide-based alloys [14]. Niobium can form a metastable A15-Nb3Nb structure with 0.5246 nm lattice parameter [40]. The lattice parameter of the stoichiometric A15-Nb3Sn is 0.529 nm [41]. In the A15 structure the Sn atoms form a bcc lattice, each face of the cube is bisected by orthogonal Nb chains and the distance between the Nb atoms is 0.265 nm. In the A15-Nb3Nb structure the distance between the Nb atoms is 0.262 nm. In both cases these distances are lower than the shortest distance between Nb atoms in bcc Nb, which is 0.286 nm (the Nb lattice parameter is 0.330 nm) [42]. Both Ta and Ti occupy Nb sites in the A15-Nb3Sn lattice [43] and as their concentrations increase, the stability of the cubic phase increases.
The compositions of the phases and the eutectic in Table 3 and the fact that no Ti-rich Nbss and Ti-rich Nb5Si3 were observed in the microstructure that formed in the bottom of the button of JZ2-AC (bottom left hand corner in Figure 5d) show that the partitioning of solutes in Nb5Si3 created favorable concentrations for the Ge, Si, Sn, Ta, Ti, W in the eutectic, but the partitioning of solutes in the solid solution and A15 created favorable concentrations for Ge and Si, and Ge, Si, and Ta, respectively.
In the undercooled melt of JZ2, near the water-cooled crucible the Nb5Si3 formed first (owing to its higher melting temperature) and then the Nbss, the growth of which was easier because of its lower entropy of fusion (see above). As solutes partitioned to the melt the formation of A15-Nb3Sn next to the solid solution became possible because of crystallographic reasons and the availability of Ge and Si that also form A15 compounds [35]. Thus, growth of the three phases became possible but the eutectic did not form because the melt could not reach the eutectic composition owing to the growth of the three phases separately. However, as the latter grew the melt undercooling decreased making it possible for the Ti-rich Nbss and Ti-rich Nb5Si3 to form. Formation of the latter two phases made less Ge, Si and Ti available for the needs of the A15-Nb3Sn and thus its formation/growth was suppressed and this marked the start of the transition from the microstructure in the bottom of JZ2-AC to that in the bulk, with coupled growth of Nbss and Nb5Si3 resulting in the eutectic between these two phases (Figure 5b,d).
The dependence (sensitivity) of the microstructures that formed in the cast alloys JZ1 and JZ2 on solidification conditions was discussed above and is common in Nb-silicide-based alloys that are produced using arc melting, as demonstrated in [25,26,31,34]. The importance of macro-segregation and solidification conditions for the cast microstructures and properties of arc melted RCCAs have been highlighted in [8]. The lack of research on the solidification of RCCAs is noticeable.
In the microstructures of the heat-treated alloys JZ1 and JZ2, the Nbss, and βNb5Si3 and Nb5Si3 were present with Ti-rich areas being present only in the Nb5Si3 silicide where the Ti+Hf content was not high enough to stabilize the hexagonal γNb5Si3. This suggests that the solid solution and the tetragonal Nb5Si3 silicides are stable in both alloys. The presence of both forms of the tetragonal Nb5Si3 is attributed to the βNb5Si3 stabilizers Ta, W, and Ge “controlling” the effect of Sn that promotes the Nb5Si3Nb5Si3 transformation. In JZ2-HT, the A15 compound was stabilized owing to the higher Sn content in the alloy compared with JZ1 as well as the presence of Ge and Si that stabilizes this structure. Based on the results for the alloy CM1 (=Nb-8.3Ti-21.1Si-5.4Mo-4W-0.7Hf) in [31], it is suggested that the subgrains (Figure 3b) formed in the Nb5Si3 grains in JZ2-HT.
In both alloys the eutectic microstructures were not stable after the heat treatment. This was not observed in the alloys Nb-17.4Si-5.3Hf-3.4Ta-2Mo and Nb-19.7Si-2W-4.5Mo [30] with no Ti addition where lamellar microstructures consisting of Nbss and Nb5Si3 were present after the heat treatment. This difference was attributed (i) to the synergy of the refractory metals with Ge and Sn and (ii) to the higher homologous heat treatment temperatures for the alloys JZ1 and JZ2 that were about 0.74 and 0.76, respectively, compared with the homologous temperature of about 0.69 for the two aforementioned alloys.
5.4. Oxidation
5.4.1. Oxidation at 800 °C
At 800 °C, both alloys followed linear oxidation kinetics, did not form protective scales, and suffered from the spallation of their scales, parts of which disintegrated into powder. The latter revealed their vulnerability to pesting (Figure 7a,b) and drew attention to the need for future research to find out if additional alloying could suppress it. The values of their rate constants were higher than those of the MASC alloy (Nb-25Ti-16Si-8Hf-2Al-2Cr) with/out Sn addition [24], similar to those of Al and Cr containing Nb-silicide-based alloys with/out Hf addition but without Sn or Ge and higher than those of Al and/or Cr containing Nb-silicide-based alloys with 2 or 5 at.% Sn [26]. Their oxidation was worse than that of the Al and/or Cr containing Nb-silicide-based alloys with Ge in [25], and the alloy OHS1 (Nb-24Ti-18Si-5Al-5Cr-5Ge-5Sn [27]) that followed parabolic oxidation kinetics at the same temperature. The weight gains of both alloys were higher than those of Nb-silicide-based alloys with Ge [25] or Sn [24,26], the alloy OHS1 [27] and Al and Cr containing alloys with/out Hf addition.
Pest oxidation of intermetallic compounds and alloys occurs in the range 600 to 900 °C. Pesting has been attributed to the rapid diffusion of oxygen along the grain boundaries that causes internal oxidation. The oxide(s) that are formed induce internal stresses that cause disintegration along the grain boundaries [45]. The vol.% of the Nbss is critical for the oxidation of Nb-silicide-based alloys [25,28]. In Nb-silicide-based alloys, the Nb5Si3 is cracked below the substrate/scale interface with the cracks running parallel to the scale/substrate interface. This phenomenon was attributed to the low fracture toughness of the Nb5Si3 (about 3 MPa m0.5 for the unalloyed silicide which increases to about 10 MPa m0.5 for Ti alloyed silicide with ≈ 30 at.% Ti [29]) and the stresses arising from the oxidation of the Nbss [21,24,26]. Control of the vol.% of the Nbss and the diffusion of oxygen toward the bulk of the alloy are critical for the pest oxidation of Nb-silicide-based alloys. The increase of the Sn and Ge concentrations in JZ2 and their synergy with Hf, Si, Ta, Ti, and W had an effect only on the vol.% of Nbss, which was lower than that of JZ1 (Table 2).
The vol.% of the Nbss in the alloys JZ1 and JZ2 respectively were 46.5 % and 34.5 %. The alloy Nb-18Si-5Sn (NV9) suffered from complete disintegration to powders (pesting) at 800 °C and that the alloy Nb-24Ti-18Si-5Sn (NV6) did not pest but instead formed a thin scale that cracked along all the edges of the cube shaped specimen. The alloy Nb-24Ti-18Si-5Ge (ZF3) also suffered from complete disintegration to powders at 800 °C [25]. The results for the alloy NV6, NV9, and ZF3 would suggest that the synergy of 5 at.% Sn with 24 at.% Ti is more effective than that of 5 at% Ge with 24 at% Ti regarding the control of pest oxidation at 800 °C.
The alloys JZ1 and JZ2 had lower Ge and Sn concentrations and the same but lower Ti concentrations than the alloys studied by Vellios and Tsakiropoulos (see [13]) and Li and Tsakiropoulos [25] and references within and did not suffer from complete disintegration to powders, instead their scales spalled off and scale fragments disintegrated into powder. This suggests (i) that the simultaneous presence of Ge and Sn in the alloys “controlled and improved” the effect of Ge and (ii) that the synergy of these two elements with Hf, Ta, Ti, and W was also beneficial regarding control of pest oxidation. The oxidation resistance of the alloy JZ2 at 800 °C was slightly improved, most likely because of its lower vol.% of the Nbss and higher Sn+Ge content, compared with the alloy JZ1. The results of this work and the literature suggest that additional research should aim to find out whether the oxidation of Nb-silicide-based alloys with Ta and W additions in the pest regime could be improved with simultaneous addition of Sn and Ge with Al and Cr.
5.4.2. Oxidation at 1200 °C
The results for the two alloys and in particular the improved adhesion of the scale of JZ2 showed that their oxidation was similar or better than that of some Nb-silicide-based alloys with Al and Cr additions. At the early stages, the oxidation of the alloys JZ1 and JZ2 was parabolic, and then changed to linear (Table 4). Their weight gains after 50 h were similar to those of the MASC alloy with/out Sn addition [24] (in [24] the oxidation at 1200 °C was studied up to 50 h) and their kl values were the same as those of MASC [24]. Their weight gains were higher than those of Nb-silicide-based alloys with/out Al or Cr and with 2 or 5 at.% Sn [26] and references within, and the alloy OHS1 [27]. Compared with the latter, the linear oxidation rate constants of JZ1 and JZ2 were similar but the parabolic rate constant was higher. Their rate constants were both slightly higher than those of the alloys with 2 at.% Sn [26] and their kl values were similar to those of the alloys ZX6 (Nb-24Ti-18Si-5Al-5Sn) and ZX8 (Nb-24Ti-18Si-5Al-5Cr-5Sn) [26] and references within, of which the latter did not follow parabolic kinetics in the early stages of oxidation. Compared with the Ge containing alloys in [25], the weight gains of JZ1 and JZ2 were higher, and the kl and kp rate constants of the alloy JZ2 were similar to those of Nb-24Ti-18Si-5Cr-5Ge.
The scale formed on JZ1 spalled off (Figure 7c), as was the case for (a) the MASC alloy with/out Sn addition [24], (b) the alloys JG3 (Nb-24Ti-18Si-5Al-5Cr-2Mo) and JG4 (Nb-24Ti-18Si-5Al-5Cr-5Hf-2Mo, which did not follow parabolic kinetics), (c) the alloys with 2 at.% Sn in [26], (d) the alloys with 5 at.% Ge in [25], and (e) the alloys with 5 at.% Sn in [26]. Partial spallation and improved scale adhesion was exhibited by the alloy JZ2 (Figure 7), similar to the alloys ZX6 (Nb-24Ti-18Si-5Al-5Sn) [26] and ZF9 (Nb-24Ti-18Si-5Al-5Cr-5Hf-5Ge) [25]. Thus, the synergy of Sn and Ge with Ta and W had the same effect regarding scale adhesion as 5Al+5Sn in ZX6 and 5Al+5Cr+5Ge+5Hf in ZF9, but was not as effective as that of 5Sn+5Ge with 5Al+5Cr in OHS1 [27] and 5Sn with 5Al, 5Cr, 5Hf, and 2Mo in JG6 (Nb-24Ti-18Si-5Al-5Cr-5Hf-5Sn-2Mo) where the vol.% of the Nbss in the cast alloy was very low and the solid solution was not stable (note that the Sn rich Nbss that was reported in JG6-HT [46] actually was the A15-Nb3Sn compound). Could simultaneous Al and Cr additions to the “base” alloy JZ2 improve oxidation at 1200 °C?
In the alloy JZ2 the scale was free of Sn or Ge as was the case in the alloys with 2 and 5 at.% Sn [26], and with 5 at.% Ge [25] and the alloy OHS1 with 5Sn+5Ge [27]. The presence of Nb and Ti rich oxides and silica in the scale is in agreement with [26,46]. In Nb-silicide-based alloys with Al and/or Cr and with Sn and/or Ge additions, Sn-rich and/or Ge-rich intermetallics formed in the substrate in the diffusion zone just below the scale/substrate interface [24,25,26,27]. In the alloy JZ2, Ge and Sn segregated in the substrate just below the scale/substrate interface where Sn rich and Ge rich areas formed (Figure 8 and Figure 9) as well as Sn and Ge containing intermetallic compounds (Table 5). The diffusion zone consisted of two parts, owing to differences in microstructure (Figure 8).
Segregation of Sn and Ge in the substrate just below the scale/substrate interface has been reported before, but always for Nb-silicide-based alloys that contained Al and/or Cr, with/out Hf [20,22,23,25]. A distinctive feature of JZ2, which has not been observed before, was the presence “next to each other” of separate Sn rich or Ge rich areas at the top of the diffusion zone 1 near its interface with the scale (Figure 8a,c and Figure 9). Table 6 shows the alloying additions in JZ1 and JZ2 that are predicted to segregate to the surfaces of binary Nb-X alloys [26] and references within. According to theory A, the solute with lower heat of sublimation should segregate to the surface. In accordance with theory B, the larger the solute atom relative to the solvent the higher the degree of surface segregation. As per theory C, the surface segregation is related with the partitioning of solute in the melt and surface segregation should occur when, owing to distribution (partitioning) of solute, the melt is richer in solute than the solid. Finally, as stated by theory D, the element with the lower surface energy segregates. None of the theories A to D predicts surface segregation of W or Ta. The predictions of theories A to D are supported by the analysis data (Table 5) and X-ray elemental maps (Figure 9).
The microstructure of the diffusion zone 2 was essentially the same as in the bulk. Titanium oxide was observed either inside the Nbss and A15 compound or at their interface. This confirmed that in JZ2 both these phases were more susceptible to contamination by oxygen than the Nb5Si3 at 1200 °C. Contamination of the microstructure of JZ2 by oxygen had occurred to the depth of about 200, i.e., deeper than that in the alloy OHS1 (=Nb-24Ti-18Si-5Al-5Cr-5Ge-5Sn [27]), which was about 100 μm. This would suggest that the synergy of Ta and W with Ge and Sn was not as effective as that of the latter elements with Al and Cr, even in the presence of the oxygen scavenging Hf in JZ2.
Contamination by oxygen of phases below the scale and sometimes in the bulk of Nb-silicide-based alloys also has been reported in [26,27]. The presence of Ge containing compounds, with the exception of NbGe2, and A15 intermetallic below the scale (Table 5) is consistent with the data in [24,26,27]. However, the absence of other Sn intermetallics (NbSn2, (Ti,Nb)6Sn5, and TM5Sn2Si), which were observed in [26,27], also should be noted. These observations would suggest (a) that the presence of Al and/or Cr is not essential for the formation of Ge and Sn containing intermetallic phases below the scale, and (b) that the alloying with RMs (synergy of Ta with W in this study) (i) suppresses the formation (stability ?) of certain Ge and Sn rich compounds below the scale, (ii) affects solute partitioning in Nb5Si3 below the scale (compare the data for Nb5(Si1-xGex)3 and W-rich Nb5(Si1-xGex)3 with that for Nb5Si3 and Ti-rich Nb5Si3 in Table 5) and promotes the formation (stability?) of NbGe2 below the scale. Further research is necessary to clarify (b).
5.5. Comparisons of Experimental Data with NICE
The alloy design methodology NICE [13] was used to calculate (predict) the macrosegregation of Si (MACSi), the composition of the Nbss and Nb5Si3, the vol.% of Nbss, and the weight gains per unit area (ΔW/A) after isothermal oxidation at 800 and 1200 °C. The latter were compared with the experimental data. The creep rate of the alloys at 1200 °C and 170 MPa was also calculated using NICE.
NICE slightly under and over-estimated the MACSi values, respectively in the alloys JZ1 and JZ2, which, based on their actual compositions, were calculated as being equal to 4.8 at.% and 5.2 at.%.
The Si concentration in the Nbss in JZ1-AC, JZ1-HT, and JZ2-HT respectively was 4.4, 3.8, and 3.5 at.%. These Si contents were close to those reported for the Nbss in the Al, Cr, and Ta containing alloys KZ6 (=Nb-24Ti-18Si-6Ta-5Al-5Cr) and KZ8 (=Nb-24Ti-18Si-6Ta-4Al-8Cr) in the as-cast and heat-treated conditions [44] and the “normal” Nbss in the Ta-containing and Al-, Cr-, and Ti -free alloy YG4-AC (=Nb-18Si-5Hf-3Ta-2Mo), and significantly higher, particularly for the heat-treated condition, than the values reported for the Nb solid solutions in Nb-silicide-based alloys without Ta addition, or with Ge addition [25] or with Sn addition [26,34].
The chemical compositions of the Nbss in the as-cast condition that were calculated using the actual compositions of the cast alloys and the relationships in NICE that link the concentration of a solute element in the alloy and its solid solution were 65.35Nb-14.15Ti-5.5Si-8.4Ta-4.1W-0.6Hf-1.4Sn-0.5Ge and 63.4Nb-13.3Ti-4Si-9Ta-4.8W-0.76Hf-3.3Sn-1.5Ge, respectively for the alloys JZ1 and JZ2. The Ta concentration was calculated using data for Mo in NICE, because there are not enough experimental data available for Ta containing Nb-silicide-based alloys. The values of the parameters δ and Δχ of the calculated Nbss respectively were 5.091 and 0.179, and 5.087 and 0.1946 for the alloys JZ1 and JZ2, and were consistent with [14,44]. The calculated compositions of the solid solutions were in very good agreement with the data in the Table 1 and Table 3. The values of the parameters Δχ and δ calculated for the actual compositions of the “normal” and Ti-rich Nbss in the alloys JZ1 and JZ2 (Table 1 and Table 3), respectively were 0.182 and 0.2109, and 5.858 and 5.363, and were consistent with [14].
The calculated values of the vol.% Nbss using NICE were 44.1% and 34.8%, respectively for the alloys JZ1 and JZ2, in very good agreement with the measured vol.% Nbss in the bulk of both the as-cast alloys (Table 2).
In the Nb5Si3 database in NICE the data for RM additions in tetragonal Nb5Si3 is limited. This lack of data hampered the calculation of the concentrations of Ta and W in the latter silicide. Calculation of the concentrations of the other elements in the alloyed Nb5Si3 was possible. For example, using the actual JZ2-AC alloy composition, the calculated composition of the Nb5Si3 was 49.9Nb-10Ti-5.8Ge-0.95Sn-0.7Hf-32.65Si.
The average weight gains of the alloys JZ1 and JZ2 at 800 °C and 1200 °C that were calculated using NICE, respectively were 17 and 12 mg/cm2, and 77 and 54 mg/cm2. Compared with the data in Table 4, NICE underestimated the ΔW/A values for both alloys and temperatures. The better oxidation behavior of JZ2 compared with JZ1 correlated well with the decrease in VEC and increase in δ parameter values (see next section), as required by NICE [13,25,26,27].
Creep
The values of the parameters VEC, Δχ, and δ and the ratio Nb/(Ti+Hf) that were calculated for the actual compositions of the cast alloys JZ1 and JZ2, respectively were 4.642, 0.1745, 8.93, and 4.41, and 4.562, 0.1859, 9.14 and 3.95. Both alloys met the constraint (a) (see Section 2). The calculated creep rates at 1200 °C and 170 MPa using NICE and the values of the above parameters and ratio were in the ranges 1.4 × 10⁻⁶ s−1 to 1.1 × 10⁻⁷ s−1, and 1.5 × 10⁻⁶ s−1 to 1.8 × 10⁻⁷ s−1, with average creep rates 7 × 10⁻⁷ s−1 and 9.6 × 10⁻⁷ s−1, respectively for the alloys JZ1 and JZ2. These rates were lower than that of the Ni-based superalloy CMSX-4 for the same conditions (5.6 × 10⁻⁵ s−1, see Section 2) but higher than the creep rate of 10−7 s−1 that is the criterion in NICE to predict whether it is likely for a designed (selected) alloy to meet the creep goal (see Section 2 and [13]).
6. Summary
Two Nb-silicide-based alloys with nominal compositions Nb-12Ti-18Si-6Ta-2.5W-1Hf-2Sn-2Ge (JZ1) and Nb-12Ti-18Si-6Ta-2.5W-1Hf-5Sn-5Ge (JZ2) were designed using the alloy design methodology NICE. All the research objectives that were discussed in the introduction of this paper were met. The cast microstructures of both alloys were sensitive to solidification conditions. There was macrosegregation of Si in JZ1 and JZ2. In both alloys the βNb5Si3 was the primary phase and the Nbss was stable. The A15-Nb3X (X = Ge,Si,Sn) was stable only in JZ2. The Nb3Si and Nbss + βNb5Si3 eutectic that formed only in JZ1 were not stable. Also the Nbss + βNb5Si3 eutectic was not stable in JZ2. At 800 °C both alloys followed linear oxidation kinetics and were vulnerable to pesting. At 1200 °C both alloys exhibited parabolic oxidation kinetics in the early stages that was followed by linear kinetics. The adhesion of the scale on JZ2 was better. The microstructure of JZ2 was contaminated by oxygen to a depth of about 200 μm, and in the substrate below the scale there was presence of NbGe2, Nb5(Si1-xGex)3, W-rich Nb5(Si1-xGex)3, and A15-Nb3X compounds. The better oxidation behavior of JZ2 compared with JZ1 correlated well with the decrease in VEC and increase in δ parameter values, in agreement with NICE. The experimental data for Si macrosegregation, vol.% Nbss, chemical composition of Nbss and Nb5Si3, weight gains at 800 and 1200 °C was compared with the calculations (predictions) of NICE. The agreement was very good. The calculated creep rates of both alloys at 1200 °C and 170 MPa were lower than that of the Ni-based superalloy CMSX-4 for the same conditions but higher than 10−7 s−1.
Author Contributions
Experimental work, J.Z., C.U., Supervision, C.U. and P.T., Formal analysis J.Z., C.U. and P.T., Draft preparation, J.Z., Review P.T., Final paper, J.Z., C.U. and P.T. All authors have read and agreed to the published version of the manuscript.
Funding
This research was funded by the EPSRC (EP/H500405/1, EP/L026678/1) and Rolls-Royce Plc.
Acknowledgments
The support of this work by the University of Sheffield, Rolls-Royce Plc and EPSRC (EP/H500405/1, EP/L026678/1) is gratefully acknowledged.
Conflicts of Interest
The authors declare no conflict of interest.
References
- MacKay, R.A.; Gabb, T.P.; Smialek, J.L.; Nathal, M.V. Alloy Design Challenge: Development of Low Density Superalloys for Turbine Blade Applications; NASA/TM-2009-215819; NASA Technical Reports Server: Hampton, VA, USA, 2009.
- Jackson, M.R.; Bewlay, B.P.; Rowe, R.G.; Skelly, D.W.; Lipsitt, H.A. High temperature refractory metal intermetallic composites. JOM 1996, 48, 9–44. [Google Scholar] [CrossRef]
- Jackson, M.R.; Bewlay, B.P.; Zhao, J.-C. Niobium Silicide Based Composites Resistant to Low Temperature Pesting. U.S. Patent 6,419,765, 16 July 2002. [Google Scholar]
- Jackson, M.R.; Bewlay, B.P.; Briant, C.L. Creep Resistant Nb-Silicide Based Two Phase Composites. U.S. Patent 6,447,623 B1, 9 October 2002. [Google Scholar]
- Jackson, M.R.; Bewlay, B.P.; Zhao, J.-C. Niobium-Silicide Based Composites Resistant to High Temperature Oxidation. U.S. Patent 6,913,655, 1 August 2002. [Google Scholar]
- Tsakiropoulos, P. On Nb silicide based alloys: Part II. J. Alloys Compd. 2018, 748, 569–576. [Google Scholar] [CrossRef] [Green Version]
- Gorsse, S.; Miracle, D.B.; Senkov, O.N. Mapping the world of complex concentrated alloys. Acta Mater. 2017, 135, 177–187. [Google Scholar] [CrossRef] [Green Version]
- Senkov, O.N.; Miracle, D.B.; Chaput, K.J. Development and exploration of refractory high entropy alloys—A review. J. Mater. Res. 2018, 33, 3092–3128. [Google Scholar] [CrossRef] [Green Version]
- Senkov, O.N.; Senkova, S.V.; Woodward, C.; Miracle, D.B. Low-density, refractory multi-principle element alloys of the Cr-Nb-Ti-V-Zr system: Microstructure and phase analysis. Acta Mater. 2013, 61, 1545–1557. [Google Scholar] [CrossRef]
- Stepanov, N.D.; Yurchenko, N.Y.; Panina, E.S.; Tikhonovsky, M.A.; Zherebtsov, S.V. Precipitation strengthened refractory Al0.5CrNbTi2V0.5 high entropy alloy. Mater. Lett. 2017, 188, 162–164. [Google Scholar] [CrossRef]
- Muller, F.; Gorr, B.; Christ, H.-J.; Chen, H.; Kauffmann, A.; Heilmaier, M. Effect of micro alloying with silicon on high temperature oxidation resistance of novel refractory high entropy alloy Ta-Mo-Cr-Ti-Al. Mater. High Temp. 2018, 35, 168–176. [Google Scholar] [CrossRef] [Green Version]
- Zheng, J.; Hou, X.; Wang, X.; Meng, Y.; Zheng, X.; Zheng, L. Isothermal oxidation mechanism of a newly developed Nb-Ti-V-Cr-Al-W-Mo-Hf alloy at 800–1200 °C. Intern. J. Refract. Met. Hard Mater. 2016, 54, 322–329. [Google Scholar] [CrossRef]
- Tsakiropoulos, P. On Nb silicide based alloys: Alloy design and selection. Materials 2018, 11, 844. [Google Scholar] [CrossRef] [Green Version]
- Tsakiropoulos, P. On the Nb silicide based alloys: Part I-The bcc Nb solid solution. J. Alloys Compd. 2017, 708, 961–971. [Google Scholar] [CrossRef] [Green Version]
- Chang, W.H. Strengthening of refractory metals. In Refractory Metal and Alloys, Proceedings of the Conference Refractory Metals and Alloys, Detroit, MI, USA, 25–26 May 1960; Semchyshen, M., Harwood, J.J., Eds.; Interscience Publishers: New York, NY, USA, 1961; pp. 83–118. [Google Scholar]
- Begley, R.T.; Bechtold, J.H. Effect of alloying on the mechanical properties of Niobium. J. Less Common Met. 1961, 3, 1–12. [Google Scholar] [CrossRef]
- Prokoshkin, D.A.; Vasileva, E.V. Alloys of Niobium; Samarin, A.M., Ed.; Israel Program for Scientific Translations: Jerusalem, Israel, 1965. [Google Scholar]
- Fujikara, M.; Kasama, A.; Tanaka, R.; Hanada, S. Effect of alloy chemistry on the high temperature strengths and room temperature fracture toughness of advanced Nb-based alloys. Mater. Trans. 2004, 45, 493–501. [Google Scholar] [CrossRef] [Green Version]
- Hirai, H.; Tabaru, T.; Sha, J.; Ueno, H.; Kitahara, A.; Hanada, S. High temperature compression strength of directionally solidified Nb-Mo-W-Ti-Si in situ composites. Mat. Res. Soc. Symp. Proc. 2001, 646, N5.41.1–N5.41.6. [Google Scholar] [CrossRef]
- Ma, C.L.; Li, J.G.; Tan, Y.; Tanaka, R.; Hanada, S. Microstructure and mechanical properties of Nb/Nb5Si3 in situ composites in Nb-Mo-Si and Nb-W.-Si systems. Mater. Sci. Eng. A 2004, 386, 375–383. [Google Scholar] [CrossRef]
- Menon, E.S.K.; Mendiratta, M.G.; Dimiduk, D.M. Oxidation behavior of complex niobium based alloys. In Niobium Science & Technology, Proceedings of the International Symposium Niobium 2001, Orlando, FL, USA, 2–5 December 2001; Niobium 2001 Limited: Bridgeville, PA, USA, 2002; pp. 121–145. ISBN 9780971206809. [Google Scholar]
- Sarah, E.; Menon, K.; Mendiratta, M.G.; Dimiduk, D.M. High temperature oxidation mechanisms in Nb-silicide bearing multicomponent alloys. In Structural Intermetallics; Hemker, K.J., Dimiduk, D.M., Clemens, H., Darolia, R., Inui, H., Larsen, J.M., Sikka, V.K., Thomas, M., Whittenberger, J.D., Eds.; TMS: Warrendale, PA, USA, 2001; pp. 591–600. [Google Scholar]
- Bewlay, B.P.; Jackson, M.R.; Zhao, J.-C.; Subramanian, P.R.; Mendiratta, M.G.; Lewandowski, J.J. Ultrahigh temperature Nb-silicide based composites. MRS Bull. 2003, 28, 646–653. [Google Scholar] [CrossRef]
- Knittel, S.; Mathieu, S.; Portebois, L.; Vilasi, M. Effect of tin addition on Nb-Si based in situ composites. Part II: Oxidation behavior. Intermetallics 2014, 47, 43–52. [Google Scholar] [CrossRef]
- Li, Z.; Tsakiropoulos, P. The effect of Ge addition on the oxidation of Nb-24Ti-18Si silicide based alloys. Materials 2019, 12, 3120. [Google Scholar] [CrossRef] [Green Version]
- Xu, Z.; Utton, C.; Tsakiropoulos, P. A study of the effect of 5 at.% Sn on the microstructure and isothermal oxidation at 800 and 1200 °C of Nb-24Ti-18Si based alloys with Al and/or Cr additions. Materials 2020, 13, 245. [Google Scholar] [CrossRef] [Green Version]
- Hernandez-Negrete, O.; Tsakiropoulos, P. On the microstructure and isothermal oxidation at 800 and 1200 °C of the Nb-24Ti-18Si-5Al-5Cr-5Ge-5Sn (at.%) silicide based alloy. Materials 2020, 13, 722. [Google Scholar] [CrossRef] [Green Version]
- Bewlay, B.P.; Jackson, M.R.; Gigliotti, M.F.X. Niobium silicide high temperature in situ composites. In Intermetallic Compounds: Principles and Practice; Fleischer, R.L., Westbrook, J.H., Eds.; John Wiley: New York, NY, 2001; Volume 3, p. 541. [Google Scholar]
- Chan, K.S. Alloying effects on the fracture toughness of Nb-based silicides and Laves phases. Mater. Sci. Eng. 2005, A409, 257–269. [Google Scholar] [CrossRef]
- Grammenos, I.; Tsakiropoulos, P. Study of the role of Hf, Mo and W additions in the microstructure of Nb-20Si silicide based alloy. Intermetallics 2011, 19, 1612–1621. [Google Scholar] [CrossRef]
- McCaughey, C.; Tsakiropoulos, P. Type of primary Nb5Si3 and precipitation of Nbss in αNb5Si3 in a Nb-8.3Ti-21.1Si-5.4Mo-4W-0.7Hf (at.%) near eutectic Nb-silicide based alloy. Materials 2018, 11, 967. [Google Scholar] [CrossRef] [PubMed] [Green Version]
- Bendersky, L.; Biancaniello, F.S.; Boettinger, W.J.; Perepezko, J.H. Microstructural characterisation of rapidly solidified Nb-Si alloys. Mater. Sci. Eng. 1987, A89, 151–159. [Google Scholar] [CrossRef]
- Schlesinger, M.E.; Okamoto, H.; Gokhale, A.B.; Abbaschian, R. The Nb-Si (Niobium-Silicon) System. J. Phase Equilibria 1993, 14, 502–5099. [Google Scholar] [CrossRef]
- Zacharis, E.; Utton, C.; Tsakiropoulos, P. A study of the effects of Hf and Sn on the microstructure, hardness and oxidation of Nb-18Si silicide based alloys without Ti addition. Materials 2018, 11, 2447. [Google Scholar] [CrossRef] [Green Version]
- Okamoto, H. Phase Diagrams for Binary Alloys: Desk Handbook; ASM International: Metals Park, OH, USA, 2000. [Google Scholar]
- David, N.; Cartigny, Y.; Belmonte, T.; Fiorani, J.M.; Vilasi, M. Thermodynamic description of the Cr-Nb-Si isothermal section at 1473 K. Intermetallics 2006, 14, 464–473. [Google Scholar] [CrossRef]
- Han, X.; Wei, B. Microstructural characteristics of Ni-Sb eutectic alloys under substantial undercooling and containerless solidification conditions. Metall. Mater. Trans. A 2002, 33, 1221–1228. [Google Scholar] [CrossRef]
- Li, M.; Kuribayashi, K. Further discussion on the free growth behaviour in the solidification of undercooled eutectic melts. Metall. Mater. Trans. 2003, 34, 1393–1396. [Google Scholar] [CrossRef]
- Knittel, S.; Mathieu, S.; Vilasi, M. Effect of tin addition on Nb-Si based in situ composites: Part, I. Structural modifications. Intermetallics 2014, 47, 36–42. [Google Scholar] [CrossRef]
- Stewart, G.; Newkirk, L.R.; Valencia, F.A. Impurity stabilized A15 Nb3Nb—A new Superconductor. Phys. Rev. B 1980, 21, 5055–5064. [Google Scholar] [CrossRef]
- Devantay, H.; Jorda, J.; Decroux, M.; Muller, J.; Flukiger, R. The physical and structural properties of superconducting A15-type Nb-Sn alloys. J. Mater. Sci. 1981, 16, 2145–2153. [Google Scholar] [CrossRef]
- Straumanis, M.; Zyszczynsk, S. Lattice parameters, thermal expansion coefficients and densities of Nb, and of solid solutions Nb-O and Nb-N-O and their defect structure. J. Appl. Cryst. 1970, 3, 1–6. [Google Scholar] [CrossRef]
- Tafto, J.; Suenaga, M.; Welch, D. Crystal site determination of dilute alloying elements in polycrystalline Nb3Sn superconductors using a transmission electron microscope. J. Appl. Phys. 1984, 55, 4330–4333. [Google Scholar] [CrossRef]
- Zelenitsas, K.; Tsakiropoulos, P. Study of the role of Ta and Cr additions in the microstructure of Nb-Ti-Si-Al in situ composites. Intermetallics 2006, 14, 639–659. [Google Scholar] [CrossRef]
- Westbrook, J.; Wood, D. Pest degradation in beryllides, silicides, aluminides, and related compounds. J. Nucl. Mater. 1964, 12, 208–215. [Google Scholar] [CrossRef]
- Geng, J.; Tsakiropoulos, P.; Shao, G. A Thermo-gravimetric and microstructural study of the oxidation of Nbss/Nb5Si3 based in situ composites with Sn addition. Intermetallics 2007, 15, 270–281. [Google Scholar] [CrossRef]
Figure 1.
X-ray diffractograms of the (a) as-cast and (b) heat-treated alloy JZ1.

Figure 2.
Backscattered electron (BSE) images of the microstructure of JZ1-AC in the (a) top and (c) bottom (b) showing the transition from the bulk to the bottom. (d) to (f) show the details of the microstructure in the bottom of the button of JZ1-AC where the Nb3Si silicide was observed.
Figure 2.
Backscattered electron (BSE) images of the microstructure of JZ1-AC in the (a) top and (c) bottom (b) showing the transition from the bulk to the bottom. (d) to (f) show the details of the microstructure in the bottom of the button of JZ1-AC where the Nb3Si silicide was observed.
Figure 3.
BSE images of the microstructures of the heat-treated alloys (a) JZ1 and (b) JZ2.
Figure 4.
X-ray diffractograms of the (a) as-cast and (b) heat-treated alloy JZ2.
Figure 5.
BSE images of the microstructure of JZ2-AC in (a) bulk, (b) and (c) the transition from the bottom to the bulk and (d) bottom of the button. (c) Corresponds to the area shown by square in (b).
Figure 5.
BSE images of the microstructure of JZ2-AC in (a) bulk, (b) and (c) the transition from the bottom to the bulk and (d) bottom of the button. (c) Corresponds to the area shown by square in (b).
Figure 6.
Thermogravimetric (TG) data for the alloys JZ1 (a,c) and JZ2 (b,d) for 800 °C (a,b) and 1200 °C (c,d).
Figure 6.
Thermogravimetric (TG) data for the alloys JZ1 (a,c) and JZ2 (b,d) for 800 °C (a,b) and 1200 °C (c,d).
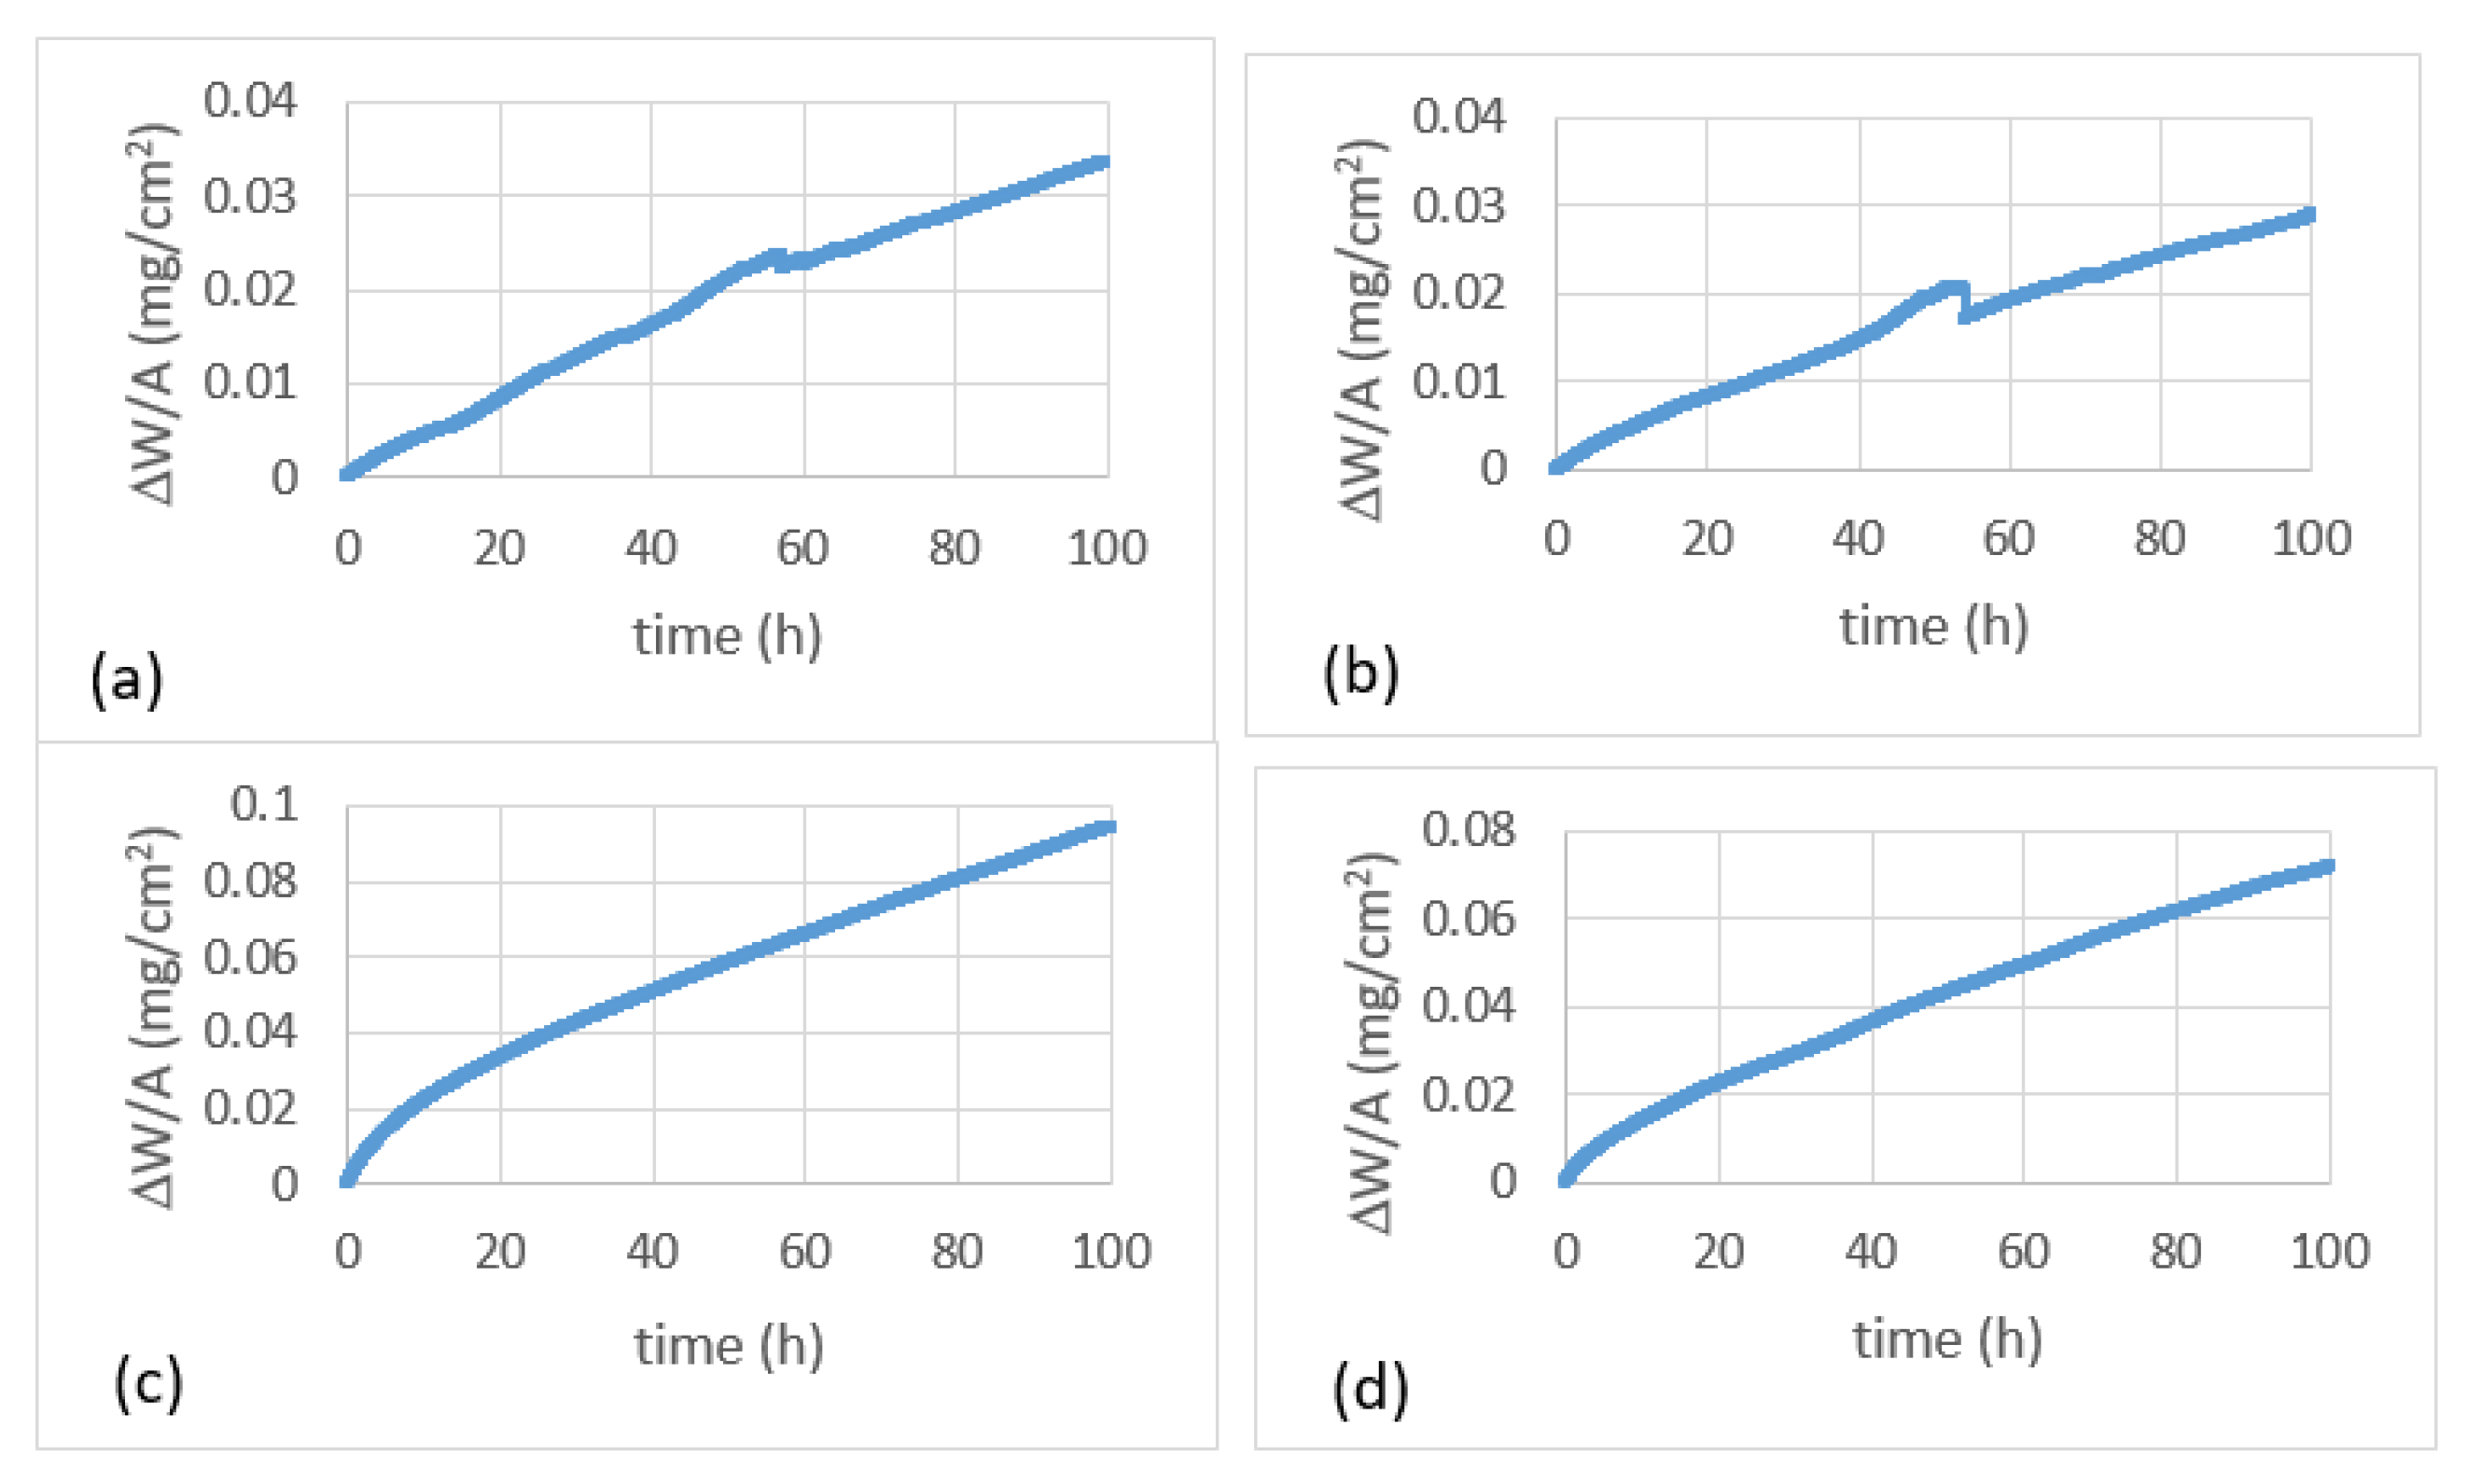
Figure 7.
The specimens of the alloys JZ1 (a,c) and JZ2 (b,d) after oxidation at 800 °C (a,b) and 1200 °C (c,d). The size of each oxidation specimen was 3 × 3 × 3 mm3.
Figure 7.
The specimens of the alloys JZ1 (a,c) and JZ2 (b,d) after oxidation at 800 °C (a,b) and 1200 °C (c,d). The size of each oxidation specimen was 3 × 3 × 3 mm3.
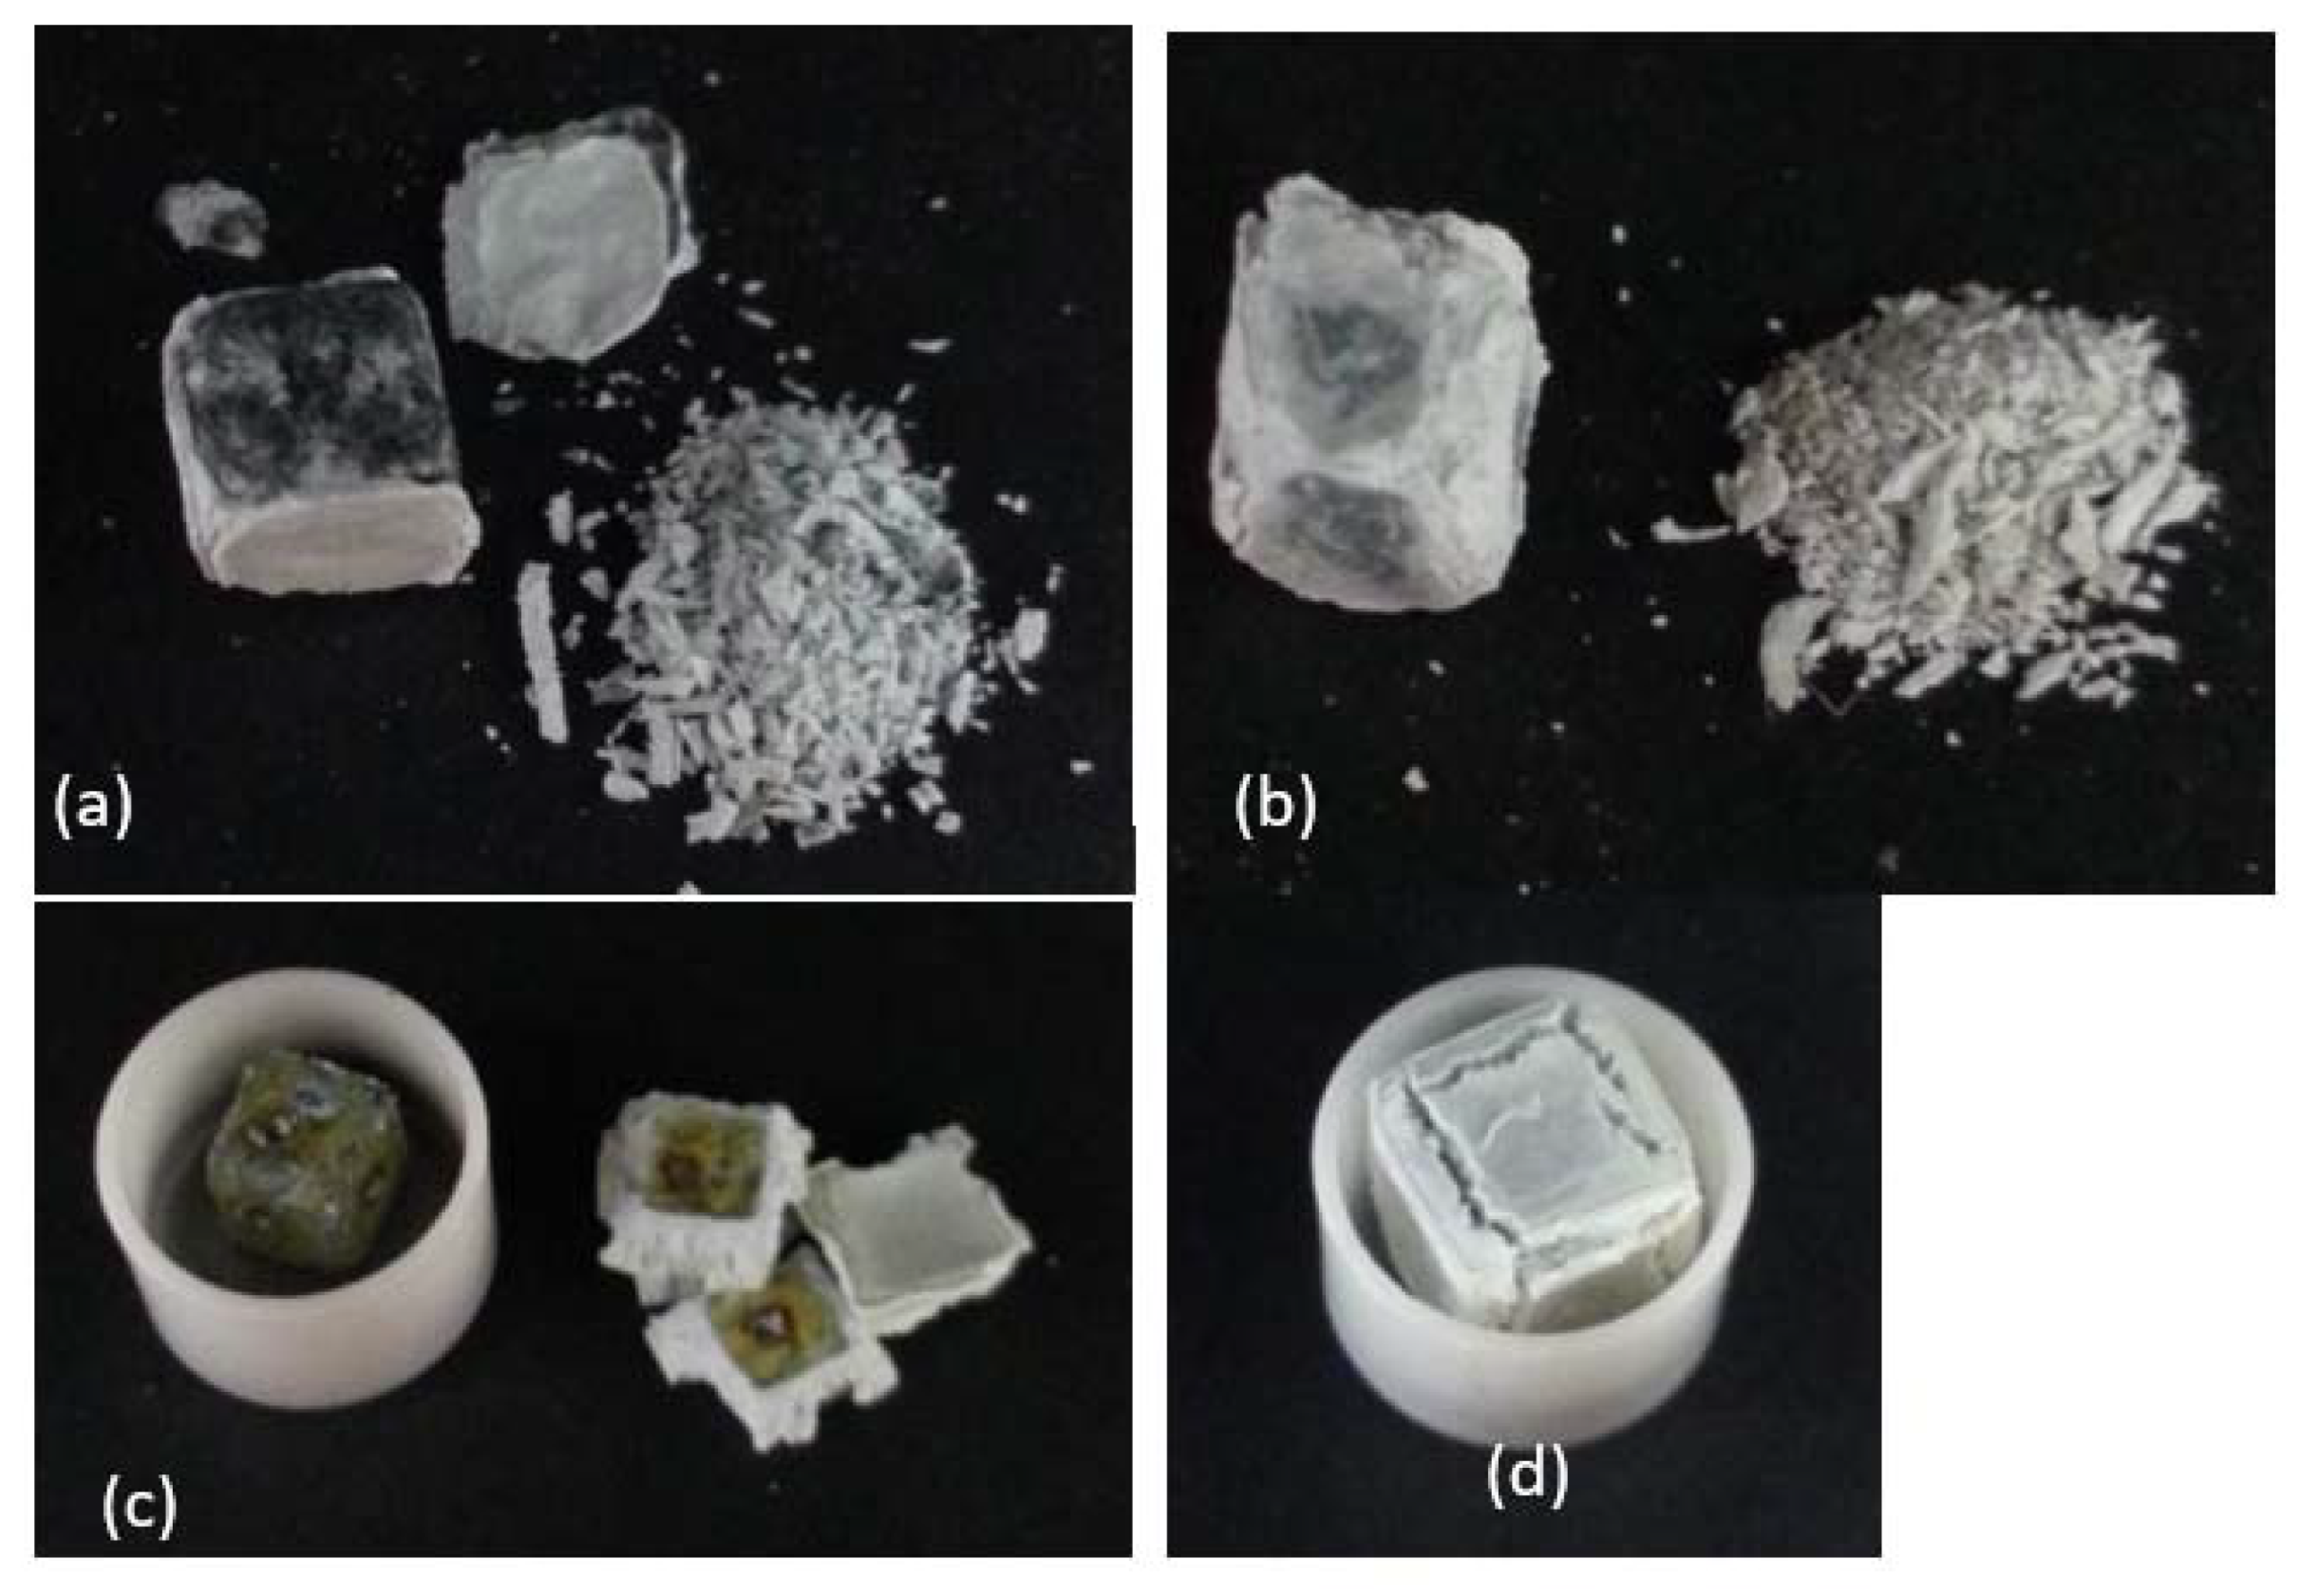
Figure 8.
BSE images of the microstructure (a) of a cross section of the oxidized alloy JZ2, (b) of the oxide scale, (c,d) of the diffusion zones 1 and 2, respectively. For the region indicated by a rectangle in (d), see later on the Figure 10 and text.
Figure 8.
BSE images of the microstructure (a) of a cross section of the oxidized alloy JZ2, (b) of the oxide scale, (c,d) of the diffusion zones 1 and 2, respectively. For the region indicated by a rectangle in (d), see later on the Figure 10 and text.
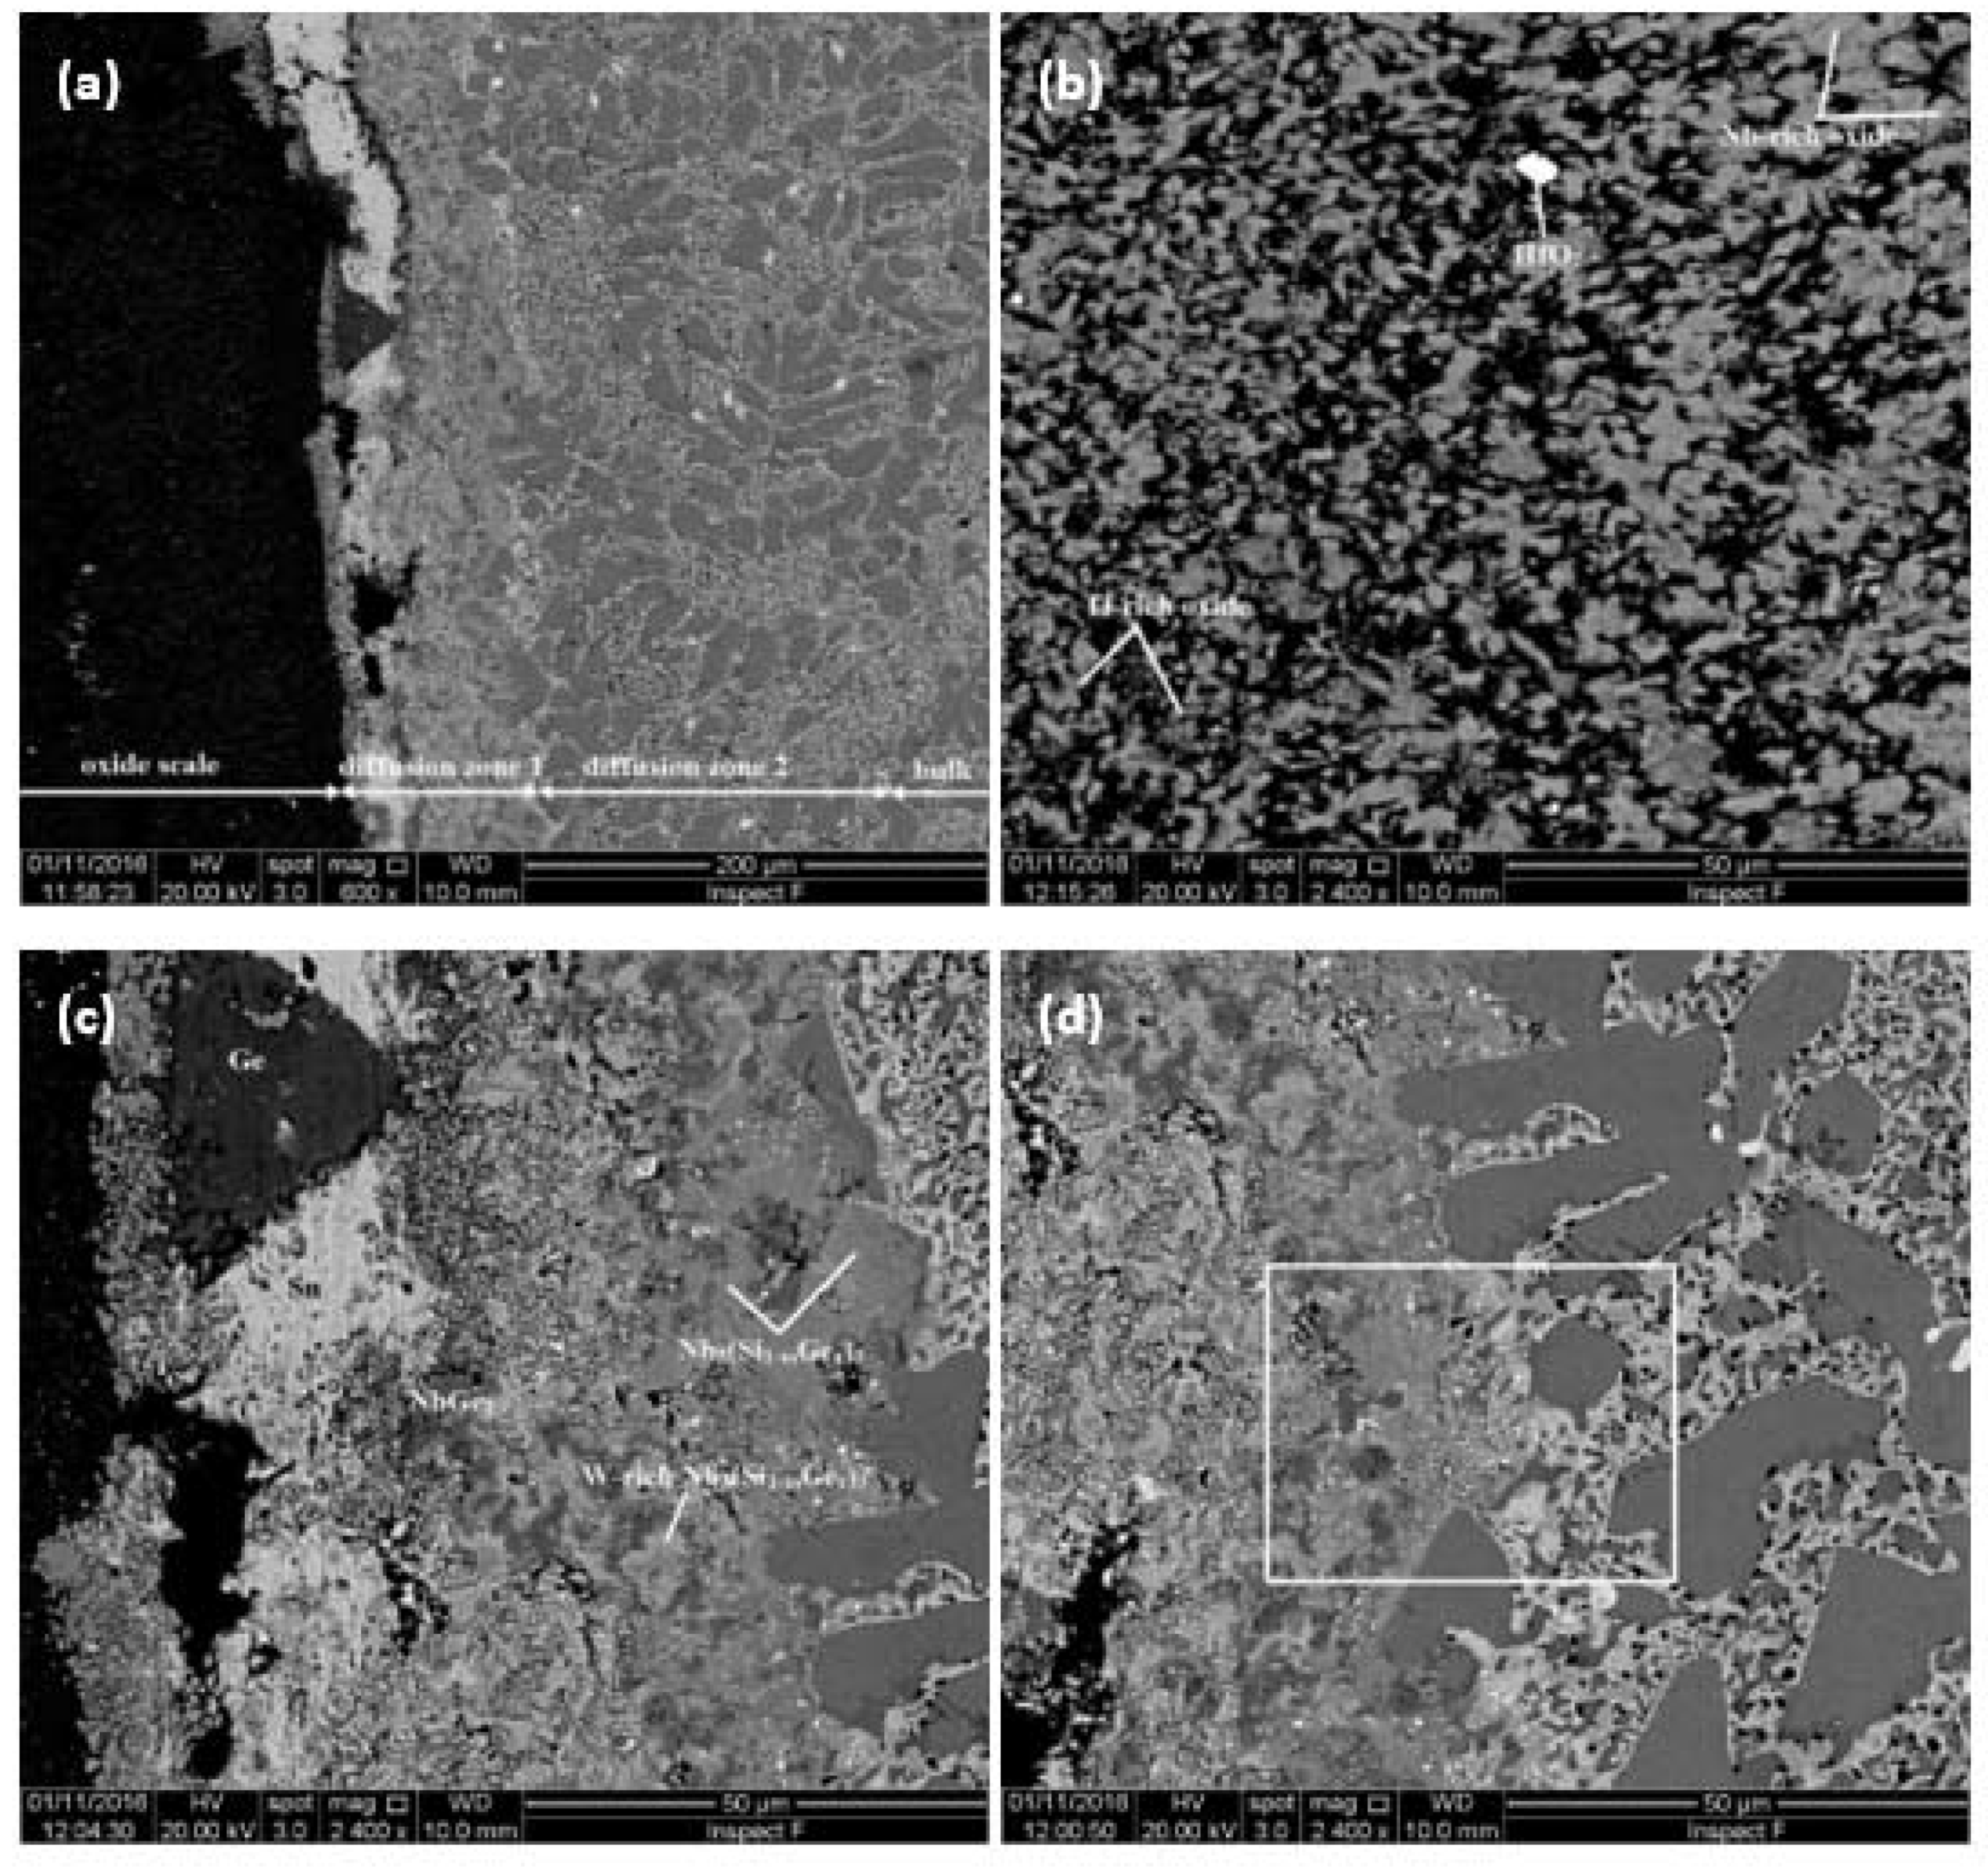
Figure 9.
BSE image and X-ray maps of a region in diffusion zone 1.

Figure 10.
BSE image and X-ray maps of the rectangular region in Figure 8d.
Figure 10.
BSE image and X-ray maps of the rectangular region in Figure 8d.

Table 1.
The analysis data (at.%) for the alloy JZ1.
| Area Phase | Nb | Ti | Si | Ta | W | Sn | Ge | Hf |
|---|---|---|---|---|---|---|---|---|
| As-cast | ||||||||
| Top | 55.1 ± 0.8 54.0–55.9 | 11.9 ± 0.6 11.3–12.7 | 22.3 ± 1.7 20.4–24.4 | 5.4 ± 0.3 5.2–5.8 | 1.6 ± 0.3 1.4–2.0 | 1.1 ± 0.2 0.9–1.3 | 1.8 ± 0.1 1.7–2.0 | 0.8 ± 0.1 0.7–0.9 |
| Bulk | 55.1 ± 0.9 53.5–56.0 | 11.4 ± 0.2 11.1–11.6 | 22.9 ± 1.6 21.2–23.0 | 5.1 ± 0.4 4.6–5.7 | 1.6 ± 0.3 1.3–1.9 | 1.2 ± 0.1 1.1–1.3 | 1.8 ± 0.2 1.6–2.1 | 0.9 ± 0.2 0.8–1.1 |
| Bottom | 55.4 ± 2.0 53.5–57.6 | 11.4 ± 0.2 11.3–11.7 | 22.3 ± 2.6 19.0–24.6 | 5.5 0.4 5.1–6.2 | 1.7 0.4 1.3–2.3 | 1.1 ± 0.2 0.9–1.3 | 1.8 0.2 1.6–2.0 | 0.8 0.1 0.6–0.9 |
| Nbss | 68.2 0.6 67.1–69.4 | 11.8 1.7 9.4–13.9 | 4.4 0.9 3.6–5.4 | 8.5 0.5 7.7–9.2 | 4.5 0.4 3.8–5.3 | 1.7 0.3 1.2–2.0 | 0.5 0.1 0.3–0.7 | 0.4 0.1 0.2–0.6 |
| Ti–rich Nbss | 61.1± 1.6 59.6–64.5 | 22.7 1.8 21.6–24.8 | 4.2 1.1 3.1–5.6 | 5.5 0.7 4.4–6.9 | 1.8 0.4 1.0–2.4 | 3.0 0.2 2.7–3.5 | 0.6 0.1 0.4–0.7 | 1.1 0.2 0.9–1.4 |
| Nb5Si3 | 48.4 0.3 47.7–48.6 | 7.8 0.2 7.4–8.0 | 36.3 0.6 35.4–37.2 | 3.9 0.2 3.6–4.2 | 0.3 0.1 0.1–0.5 | 0.5 0.1 0.4–0.7 | 2.3 0.1 2.1–2.6 | 0.5 0.1 0.4–0.6 |
| Ti-rich Nb5Si3 | 46.3 0.7 45.1–47.0 | 11.9 0.9 10.9–12.9 | 34.5 0.7 34.0–35.7 | 2.9 0.2 2.5–3.1 | 0.1 | 0.6 0.1 0.5–0.7 | 2.8 0.2 2.6–3.0 | 0.9 0.2 0.7–1.1 |
| Nb3Si | 55.9 0.4 55.2–56.1 | 8.0 0.1 7.8–8.1 | 26.20.5 25.7–26.9 | 6.5 0.2 6.2–6.8 | 1.5 0.1 1.3–1.6 | 0 | 1.4 0.1 1.4–1.5 | 0.5 0.1 0.4–0.6 |
| Eutectic | 58.8 0.6 58.0–59.8 | 10.8 0.7 9.9–11.9 | 18.2 0.6 16.1–18.1 | 6.2 0.3 6.1–6.8 | 2.8 0.2 2.7–3.2 | 1.3 0.1 1.2–1.6 | 1.2 0.2 0.9–1.5 | 0.7 0.1 0.4–0.8 |
| Heat-treated | ||||||||
| Large area | 55.0 1.3 53.3–56.9 | 12.0 0.4 11.5–12.8 | 22.4 1.6 20.1–24.5 | 5.2 0.3 4.6–5.5 | 1.6 0.3 1.1–2.1 | 1.2 0.2 1.0–1.5 | 1.8 0.2 1.5–2.1 | 0.8 0.1 0.7–0.9 |
| Nbss | 69.3 0.5 68.7–69.8 | 12.3 0.2 12.1–12.6 | 3.8 0.7 3.1–4.7 | 8.0 0.3 7.5–8.3 | 4.0 0.2 3.8–4.3 | 2.3 0.1 2.2–2.4 | 0.3 0.1 0.2–0.3 | 0 |
| Nb5Si3 | 48.3 0.4 47.9–48.8 | 7.9 0.2 7.7–8.2 | 35.9 0.4 35.4–36.4 | 4.1 0.1 3.9–4.2 | 0.4 0.1 0.2–0.4 | 0.6 0.1 0.5–0.7 | 2.3 0.2 2.0–2.4 | 0.5 0.1 04–0.5 |
| Ti-rich Nb5Si3 | 44.8 0.5 44.0–45.2 | 12.5 0.4 12.1–13.0 | 35.3 0.6 34.3–35.8 | 2.8 0.2 2.4–3.1 | 0 | 0.7 0.1 0.5–0.8 | 2.9 0.3 2.7–3.3 | 1.0 0.2 0.8–1.2 |
Table 2.
Density of the as-cast (AC) alloys and % area of Nbss in the as-cast and heat-treated (HT) alloys JZ1 and JZ2.
Table 2.
Density of the as-cast (AC) alloys and % area of Nbss in the as-cast and heat-treated (HT) alloys JZ1 and JZ2.
| Alloy | Density (g/cm3) | % Area Nbss a | ||
|---|---|---|---|---|
| Top | Bulk | Bottom | ||
| JZ1-AC a | 8.240.02 8.2–8.26 | 42.3 0.7 41.3–43 | 46.5 0.8 45.4–47.6 | 46.51.0 45.4–48.2 |
| JZ1-HT | - | - | 46.5 1.5 44–48.2 | - |
| JZ2-AC a | 8.31 0.02 8.28–8.33 | 32.9 1.1 32.1–34.1 | 34.5 1.0 33.9–35.6 | 21.9 1.1 20.7–22.7 |
| JZ2-HT | - | - | 23.52.7 20.4–25.4 | - |
a includes the Nbss and Ti-rich Nbss.
Table 3.
The analysis data (at.%) for the alloy JZ2.
| Area Phase | Nb | Ti | Si | Ta | W | Sn | Ge | Hf |
|---|---|---|---|---|---|---|---|---|
| As-cast | ||||||||
| Top | 50.7 0.9 49.0–50.5 | 11.6 0.2 11.4–12.0 | 21.6 1.7 19.2–23.7 | 5.4 0.5 4.8–6.2 | 1.9 0.2 1.7–2.1 | 2.6 0.2 2.3–2.9 | 5.3 0.4 4.8–5.9 | 0.9 0.1 0.8–1.0 |
| Bulk | 50.3 0.2 50.2–50.7 | 11.7 0.4 11.3–12.4 | 21.7 1.2 20.0–23.0 | 5.3 0.3 5.0–5.7 | 2.0 0.2 1.8–2.2 | 2.5 0.3 2.1–2.8 | 5.4 0.7 5.0–6.6 | 1.1 0.1 0.9–1.3 |
| Bottom | 50.8 0.9 50.1–52.1 | 12.1 0.5 11.4–12.7 | 21.1 1.7 18.8–22.5 | 4.9 0.4 4.5–5.6 | 2.0 0.2 1.9–2.4 | 3.2 0.3 2.9–3.6 | 4.9 0.2 4.7–5.1 | 1.0 0.2 0.8–1.3 |
| Nbss | 63.7 0.7 62.9–64.7 | 11.5 1.0 10.6–12.9 | 3.4 0.4 3.1–4.1 | 9.3 0.5 8.7–9.8 | 6.5 0.4 5.9–7.0 | 4.1 0.4 3.9–4.8 | 1.0 0.2 0.8–1.2 | 0.5 0.1 0.3–0.6 |
| Ti–rich Nbss | 61.4 0.9 60.3–62.4 | 15.5 1.1 14.7–17.4 | 4.0 0.5 3.5–4.7 | 7.6 0.5 7.0–8.1 | 4.4 0.4 3.7–4.7 | 5.5 0.4 5.1–6.1 | 1.0 0.1 0.8–1.2 | 0.6 0.1 0.5–0.7 |
| Nb5Si3 | 46.7 0.2 46.4–47.0 | 8.2 0.3 8.1–8.6 | 32.5 0.7 31.4–33.2 | 4.3 0.1 4.2–4.4 | 0.7 0.1 0.6–0.8 | 1.0 0.1 0.9–1.1 | 6.0 0.2 5.9–6.2 | 0.6 0.2 0.4–0.7 |
| Ti–rich Nb5Si3 | 44.0 1.1 42.1–45.1 | 13.0 1.2 12.2–15.2 | 29.2 0.8 28.3–30.4 | 3.1 0.4 2.3–3.4 | 0.2 | 1.9 0.4 1.5–2.5 | 7.6 0.6 7.1–8.7 | 1.0 0.1 0.9–1.2 |
| A15 | 56.5 0.9 55.4–57.8 | 16.8 1.3 15.0–18.5 | 6.6 0.5 5.8–7.1 | 4.7 0.5 4.0–5.2 | 2.2 0.4 1.7–2.7 | 9.5 0.4 8.9–10.0 | 3.1 0.2 2.9–3.4 | 0.6 0.2 0.3–0.9 |
| Eutectic | 53.2 0.9 52.2–54.3 | 13.5 0.6 12.9–14.3 | 15.6 0.4 15.1–16.1 | 5.9 0.1 5.9–5.9 | 3.0 0.2 2.9–3.0 | 3.4 0.2 3.2–3.6 | 4.3 0.2 4.2–4.6 | 1.1 0.3 0.8–1.6 |
| Heat-treated | ||||||||
| Large area | 51.0 0.6 50.3–51.8 | 12.0 0.3 11.8–12.5 | 21.1 1.1 19.5–22.6 | 5.4 0.3 4.9–5.8 | 2.1 0.2 1.8–2.2 | 2.7 0.1 2.7–2.8 | 4.9 0.2 4.6–5.2 | 0.8 0.1 0.7–0.8 |
| Nbss | 65.6 0.3 65.3–66.2 | 10.7 0.4 10.4–11.3 | 3.5 1.0 2.5–4.9 | 10.0 0.4 9.5–10.4 | 7.5 0.2 7.3–7.7 | 2.2 0.2 1.9–2.4 | 0.5 0.1 0.4–0.6 | 0 |
| Nb5Si3 | 46.7 0.4 46.2–47.1 | 8.4 0.5 7.9–9.1 | 32.3 0.7 31.2–32.8 | 4.6 0.2 4.4–4.8 | 0.7 0.3 0.2–0.9 | 0.8 0.1 0.8–1.0 | 5.9 0.2 5.6–6.1 | 0.6 0.1 05–0.7 |
| Ti–rich Nb5Si3 | 37.9 4.6 34.3–43.3 | 19.4 4.6 14.3–22.8 | 28.6 2.4 26.5–31.8 | 2.6 0.3 2.2–2.9 | 0 | 0.7 0.4 0.2–1.2 | 9.3 2.1 6.8–10.9 | 1.5 0.6 0.7–2.2 |
| A15 | 58.8 0.4 58.3–59.4 | 14.5 0.3 14.2–14.8 | 5.7 0.6 5.2–6.6 | 5.3 0.2 4.9–5.4 | 2.3 0.1 2.2–2.5 | 10.4 0.2 10.2–10.7 | 2.9 0.1 2.7–3 | 0 |
Table 4.
Weight gains and oxidation rate constants of the alloys JZ1 and JZ2 after isothermal oxidation at 800 and 1200 °C for 100 h.
Table 4.
Weight gains and oxidation rate constants of the alloys JZ1 and JZ2 after isothermal oxidation at 800 and 1200 °C for 100 h.
| Alloy | 800 °C | 1200 °C | |||
|---|---|---|---|---|---|
| Weight Gain (mg/cm2) | Rate Constant | Weight Gain (mg/cm2) | Rate Constant | ||
| kl (g cm−2 s−1) | kl (g cm−2 s−1) | kp (g2 cm−4 s−1) | |||
| JZ1 | 33.6 (100 h) | 1.14 10−7 (0–58 h) 7.5 10−8 (58−100 h) | 91.3 (100 h) | 2.16 10−7 (9–100 h) | 1.4 10−8 (0–9 h) |
| JZ2 | 28.9 (100 h) | 1 10−7 (0–53 h) 6.8 10−8 (53–100 h) | 71.7 (100 h) | 1.8 10−7 (9–100 h) | 5.5 10−9 (0–9 h) |
Table 5.
Analysis data (at.%) of phases in the alloy JZ2 after isothermal oxidation at 1200 °C for 100 h.
Table 5.
Analysis data (at.%) of phases in the alloy JZ2 after isothermal oxidation at 1200 °C for 100 h.
| Area | Phase | O | Nb | Ti | Si | Ta | W | Sn | Ge | Hf |
|---|---|---|---|---|---|---|---|---|---|---|
| Oxide scale | Nb-rich oxide | 74.4 0.7 73.3–75.0 | 16.6 0.9 15.6–17.7 | 5.7 1.9 3.6–7.5 | 0.7 0.5 0.3–1.4 | 1.8 0.4 1.3–2.3 | 0.4 0.2 0.3–0.7 | – | – | 0.3 0.2 0.2–0.6 |
| Ti–rich oxide | 73.8 0.8 72.8–74.6 | 4.0 0.7 3.5–5.2 | 20.9 0.9 19.7–22.2 | 0.3 0.2 0.1–0.5 | 0.6 0.1 0.6–0.7 | – | – | – | 0.4 0.1 0.3–0.4 | |
| HfO2 | 71.8 1.7 69.7–73.2 | 1.6 0.4 1.2–1.9 | 1.1 0.1 1.0–1.1 | 0.5 0.9 0–1.6 | – | – | – | – | 24.9 0.3 24.6–25.1 | |
| Diffusion zone 1 | Nb5(Si1–x,Gex)3 | - | 54.3 0.9 52.8–54.8 | 1.6 0.6 1.1–2.7 | 15.3 0.5 14.6–15.7 | 5.2 0.3 4.7–5.4 | 1.1 0.2 0.9–1.4 | - | 22.4 1.0 21.6–24.1 | - |
| W–rich Nb5(Si1–x,Gex)3 | - | 47.4 1.2 45.7–48.7 | 1.2 0.2 1.0–1.5 | 12.8 1.0 12.2–14.6 | 7.4 0.3 7.2–7.9 | 6.2 0.5 5.7–6.9 | 0.5 0.4 0.3–1.0 | 24.8 1.5 22.7–26.6 | - | |
| NbGe2 | - | 33.0 0.9 32.0–34.1 | 1.0 0.5 0.2–1.4 | 4.4 1.2 2.8–5.8 | 2.7 0.4 2.3–3.4 | 0.9 0.3 0.6–1.5 | 0.2 0.1 0.1–0.4 | 57.8 1.0 56.5–5.89 | - | |
| Diffusion zone 2 | Nb5Si3 | - | 48.3 0.3 47.8–48.7 | 8.0 0.2 7.6–8.2 | 31.4 0.7 30.7–32.4 | 4.5 0.3 4.1–4.9 | 0.7 0.1 0.6–0.9 | 1.0 0.1 0.9–1.1 | 5.5 0.2 5.3–5.7 | 0.6 0.2 0.5–0.9 |
| Ti–rich Nb5Si3 | - | 45.8 1.2 44.1–46.6 | 15.0 1.8 13.7–17.7 | 24.9 0.6 24.2–25.6 | 3.4 0.5 2.7–3.7 | 0.3 0.1 0.2–0.4 | 3.2 0.4 2.8–3.7 | 6.8 0.5 6.3–7.4 | 0.9 0.1 0.7–1.0 | |
| A15 | - | 61.0 0.8 59.9–61.9 | 14.2 1.0 12.9–15.4 | 4.7 0.9 3.7–5.7 | 4.6 0.3 4.2–4.9 | 2.0 0.4 1.4–2.5 | 10.3 0.3 10.0–10.8 | 3.2 0.1 3.1–3.3 | - | |
| Nbss a | - | 69.7 | 5.5 | 4.6 | 10.2 | 7.1 | 2.0 | 0.8 | 0.2 | |
| Bulk | Nb5Si3 | - | 47.0 1.0 45.9–48.3 | 8.2 0.2 8.1–8.6 | 31.9 0.8 30.9–32.7 | 4.6 0.3 4.2–5.0 | 0.7 0.10 0.6–0.8 | 1.0 0.1 0.9–1.1 | 5.9 0.5 5.3–6.4 | 0.7 0.1 0.5–0.8 |
| Ti–rich Nb5Si3 | - | 42.9 1.5 40.6–44.6 | 17.0 2.2 13.8–19.4 | 26.2 0.9 25.0–27.3 | 2.9 0.6 2.4–3.9 | – | 2.4 0.4 1.8–2.9 | 7.6 0.7 6.5–8.6 | 1.1 0.1 1.0–1.3 | |
| A15 | - | 58.9 0.9 57.2–59.3 | 16.6 0.5 16.2–17.3 | 3.9 1.0 3.1–5.5 | 5.0 0.4 4.6–5.6 | 2.0 0.2 1.8–2.2 | 10.8 0.5 10.4–11.7 | 2.8 0.2 2.4–2.9 | - | |
| Nbss | - | 66.1 1.0 64.9–67.5 | 10.3 0.4 9.7–10.7 | 3.9 1.4 2.1–5.4 | 10.1 0.5 9.6–10.9 | 6.8 0.5 6.2–7.3 | 1.9 0.6 1.2–2.7 | 1.0 0.3 0.6–1.3 | - |
a Ti oxide particles were formed in the phase, only two analyses were possible.
Table 6.
Solutes in Nb-X binary alloys predicted to segregate to the surface.
| Theory * | Element | ||||
|---|---|---|---|---|---|
| A | Si | Sn | Ge | Hf | Ti |
| B | - | Sn | Ge | - | Ti |
| C | Si | Sn | Ge | - | - |
| D | Si | Sn | Ge | Hf | Ti |
* see text.
© 2020 by the authors. Licensee MDPI, Basel, Switzerland. This article is an open access article distributed under the terms and conditions of the Creative Commons Attribution (CC BY) license (http://creativecommons.org/licenses/by/4.0/).
Share and Cite
MDPI and ACS Style
Zhao, J.; Utton, C.; Tsakiropoulos, P. On the Microstructure and Properties of Nb-12Ti-18Si-6Ta-2.5W-1Hf (at.%) Silicide-Based Alloys with Ge and Sn Additions. Materials 2020, 13, 1778. https://doi.org/10.3390/ma13071778
AMA Style
Zhao J, Utton C, Tsakiropoulos P. On the Microstructure and Properties of Nb-12Ti-18Si-6Ta-2.5W-1Hf (at.%) Silicide-Based Alloys with Ge and Sn Additions. Materials. 2020; 13(7):1778. https://doi.org/10.3390/ma13071778
Chicago/Turabian StyleZhao, Jiang, Claire Utton, and Panos Tsakiropoulos. 2020. "On the Microstructure and Properties of Nb-12Ti-18Si-6Ta-2.5W-1Hf (at.%) Silicide-Based Alloys with Ge and Sn Additions" Materials 13, no. 7: 1778. https://doi.org/10.3390/ma13071778
Note that from the first issue of 2016, this journal uses article numbers instead of page numbers. See further details here.